 Achyudhan R. Kutuva
 Jimmy J. Caudell
 Kosj Yamoah3
 Heiko Enderling
 Mohammad U. Zahid
- 1Department of Integrated Mathematical Oncology, H. Lee Moffitt Cancer Center & Research Institute, Tampa, FL, United States
- 2Department of Microbiology and Cell Science, University of Florida, Gainesville, FL, United States
- 3Department of Radiation Oncology, H. Lee Moffitt Cancer Center & Research Institute, Tampa, FL, United States
Introduction: Radiation therapy (RT) is one of the most common anticancer therapies. Yet, current radiation oncology practice does not adapt RT dose for individual patients, despite wide interpatient variability in radiosensitivity and accompanying treatment response. We have previously shown that mechanistic mathematical modeling of tumor volume dynamics can simulate volumetric response to RT for individual patients and estimation personalized RT dose for optimal tumor volume reduction. However, understanding the implications of the choice of the underlying RT response model is critical when calculating personalized RT dose.
Methods: In this study, we evaluate the mathematical implications and biological effects of 2 models of RT response on dose personalization: (1) cytotoxicity to cancer cells that lead to direct tumor volume reduction (DVR) and (2) radiation responses to the tumor microenvironment that lead to tumor carrying capacity reduction (CCR) and subsequent tumor shrinkage. Tumor growth was simulated as logistic growth with pre-treatment dynamics being described in the proliferation saturation index (PSI). The effect of RT was simulated according to each respective model for a standard schedule of fractionated RT with 2 Gy weekday fractions. Parameter sweeps were evaluated for the intrinsic tumor growth rate and the radiosensitivity parameter for both models to observe the qualitative impact of each model parameter. We then calculated the minimum RT dose required for locoregional tumor control (LRC) across all combinations of the full range of radiosensitvity and proliferation saturation values.
Results: Both models estimate that patients with higher radiosensitivity will require a lower RT dose to achieve LRC. However, the two models make opposite estimates on the impact of PSI on the minimum RT dose for LRC: the DVR model estimates that tumors with higher PSI values will require a higher RT dose to achieve LRC, while the CCR model estimates that higher PSI values will require a lower RT dose to achieve LRC.
Discussion: Ultimately, these results show the importance of understanding which model best describes tumor growth and treatment response in a particular setting, before using any such model to make estimates for personalized treatment recommendations.
1 Introduction
More than 50% of all cancer patients will receive radiation therapy (RT) during the course of their cancer treatment, either given with curative intent as a single agent, concurrently with systemic therapies, or (neo-)adjuvant to other therapeutic approaches, or in the palliative setting (1). Even modest improvements in treatment outcomes and quality of life for cancer patients undergoing RT would yield benefits for a large patient cohort. However, current radiation oncology practice does not personalize or adapt RT dose for individual patients, despite variance in individual patient radiosensitivity. Thus, many patients are potentially receiving either too much or too little RT dose. Recent efforts include more strategic integration of basic science approaches into radiobiology and radiation oncology to help better understand the mechanisms of radiation response dynamics and to help predict how to best personalize radiation to individual patients. Genomic signatures (2–5), imaging metrics (6–8), and burgeoning machine learning and artificial intelligence approaches are being retrospectively and prospectively evaluated as novel biomarkers for radiation response (9–11).
Simple mathematical approaches have a long history in radiobiology and radiation oncology. The linear-quadratic (LQ) model that describes the clonogenic survival of a cell population to increasing acute doses of radiation has been extensively used to identify cell-intrinsic radiosensitivities (12–14). Prominent developments of the LQ model include the concept of biologically effective dose (BED), tumor control probability (TCP), and normal tissue complication probability (NTCP) (15–19). Many conceptual studies have attempted to explain the biological underpinnings of linear-quadratic response dynamics. However, the non-linear tumor growth and treatment response dynamics require deployment of population dynamics models.
Mathematical oncology may hold the key to mechanistic understanding of the complex adaptive dynamic tumor system and its response to radiotherapy (20–24), with demonstrated feasibility of translation into prospective clinical trials. Using TCP and NTCP concepts combined with a logistic differential equation that describes the recovery of normal tissues from sublethal radiation-induced damage, Scott et al. pioneered the concept of temporally feathered radiation therapy (TFRT) that prioritizes and de-prioritizes organ-at-risk doses at different times during treatment. TFRT was subsequently shown to lead to increased doses to the radiation target, or reduced cumulative doses to organs at risk (25). Leder et al. combined experimental and differential equation models to identify novel radiation schedules to significantly improve radiation efficacy by taking advantage of the dynamic instability of radioresistance (26), which was recently demonstrated to be feasible and safe to administer to glioblastoma patients (27). Our group has introduced the concept of a patient specific ‘carrying capacity’ in a logistic growth model, called the proliferation saturation index (PSI) as a putative biomarker for radiosensitivity in head and neck cancer as well as non-small cell lung cancer (28–31) that is currently being evaluated as trigger for personalized radiation dose fractionation (NCT03656133).
One of the advantages of using mechanistic mathematical models to simulate radiation responses is that if an appropriate model is calibrated, validated, and predictive power demonstrated, then it may be used to simulate potential alternative treatments (32, 33). However, it is critical to examine the effects of the underlying models on these alternative treatment recommendations. While two models with different mechanstic mathematical formulations may be trained to fit longitudinal dynamics and predict individual responses equally well, they could have different implications for alternative radiation dose fractionations.
Poleszczuk et al. previously analyzed that clinical predictions are strongly dependent on the specific growth law assumed, and that the applicable growth law should be known to be utilized in clinical practice (29). The objective of this paper is to examine the impact of the underlying tumor volume dynamics models on the estimated optimal RT dose (Figure 1). In a previous study (34), our group used a pre-specified model of tumor volume response to RT to estimate the minimum RT dose required for locoregional control of head and neck tumors. Herein, we compare two different mathematical models of response to RT: (1) cytotoxicity to cancer cells that lead to direct tumor volume reduction (DVR) and (2) radiation damage to the tumor microenvironment that lead to tumor carrying capacity reduction (CCR) and subsequent tumor shrinkage. Both of these models have been shown capable of fitting longitudinal tumor volume data from head and neck cancer patients (31, 35). The comparison is focused on evaluating the impacts of both of these models on RT dose personalization.
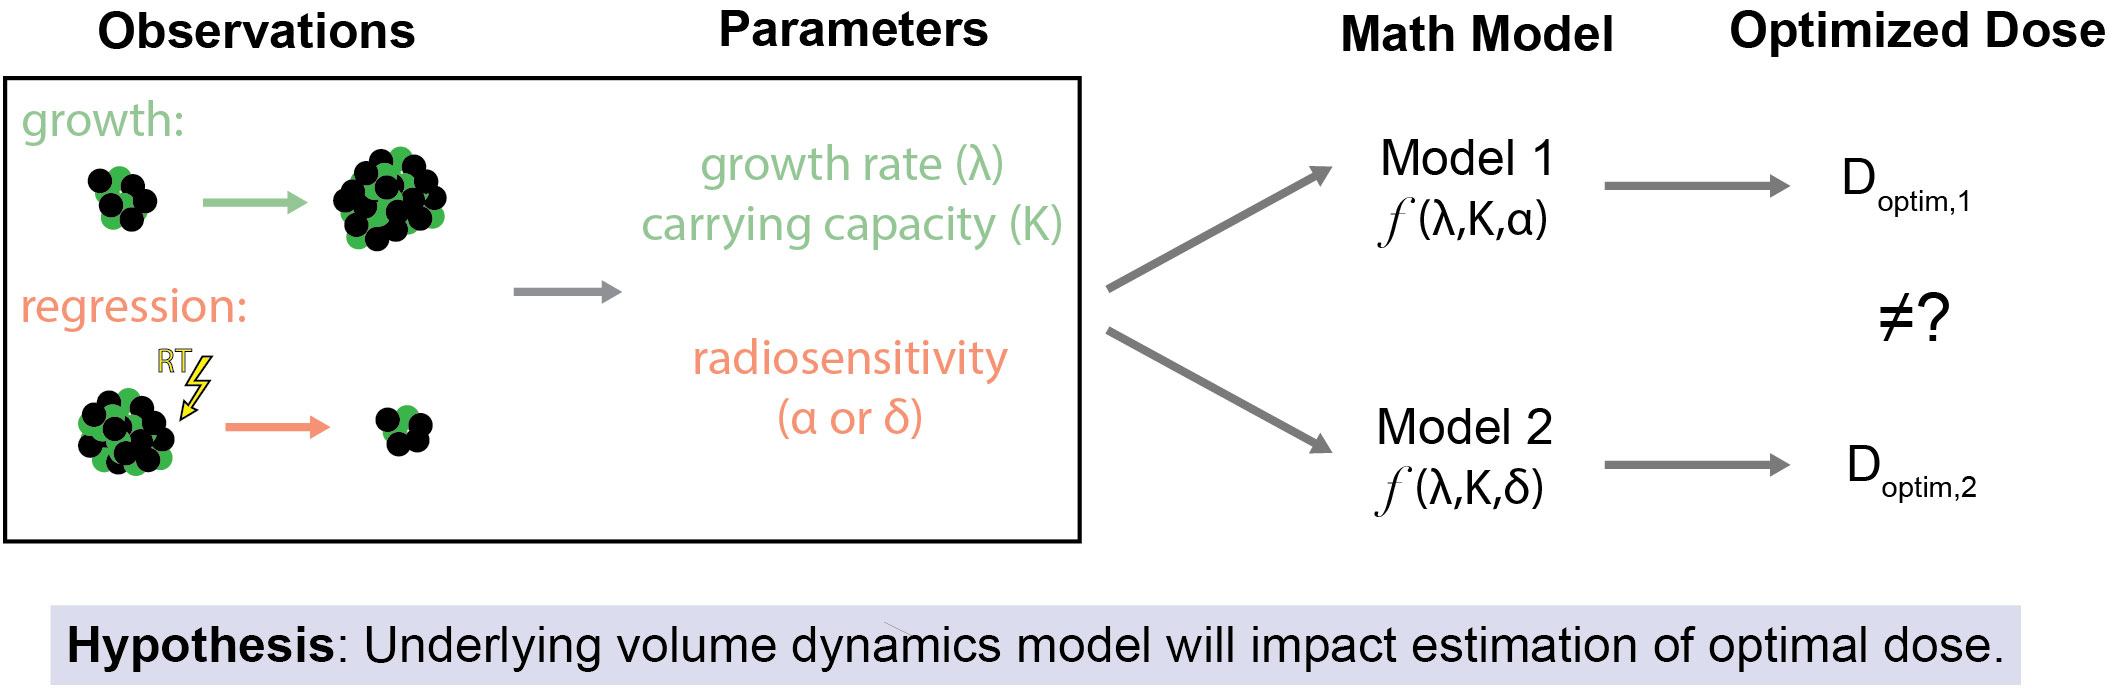
Figure 1 Study Overview and Hypothesis. The primary objective of this study is to assess how the selection of the underlying mathematical model of tumor volume dynamics affects estimates for optimal RT dose. This is premised on the idea that even when the same observations of tumor volume changes (both due to off-treatment growth and regression due to treatment effect) are used as inputs for differing models of response to RT there may be different estimates of the optimal RT dose.
2 Methods
2.1 Tumor growth model
Tumor growth models are plentiful, ranging from incredibly simple exponential growth to highly different growth dynamics as the tumor volume changes, either relative to itself or its (static or dynamic) microenvironment (36). While classical investigations sought a universal tumor growth model (37–39), the search of tumor growth laws is still very much ongoing (40). The seminal study by Benzekry et al. demonstrated that the Gompertz growth model best captured pre-clinical in vivo breast and lung cancer growth dynamics but fell short of adequate forecasts beyond one subsequent measurement (41). More recently, Kather and his team provided the first such model comparison analysis in clinical data of 1,472 patients undergoing chemotherapy or cancer immunotherapy for solid tumors (42). Again, the Gompertz model provided the best balance between goodness-of-fit and number of parameters, but once more early treatment response was only moderately correlated with final treatment responses.
We have previously shown that logistic growth dynamics provide excellent fits to clinical data of head and neck and non-small cell lung cancer during fractionated radiotherapy, and demonstrated predictive power of final tumor volumes with sufficient patient-specific data (30, 35). Logistic growth is described by the differential equation:
where V is tumor volume (cc), λ is the intrinsic tumor growth rate (day-1), and K is the carrying capacity of the tumor (cc), which is the maximum size tumor that the local tissue can support (28). In logistic growth, the tumor volume grows initially exponentially but growth monotonically decelerates as the volume approaches the defined carrying capacity, visually indicated by the horizontal asymptote (Figure 2A). In describing the distinct types of growth dynamics that this model can capture, our group has previously defined the proliferation saturation index (PSI) a measure of the effective tumor growth rate in the absence of RT (28). PSI is defined by the expression:
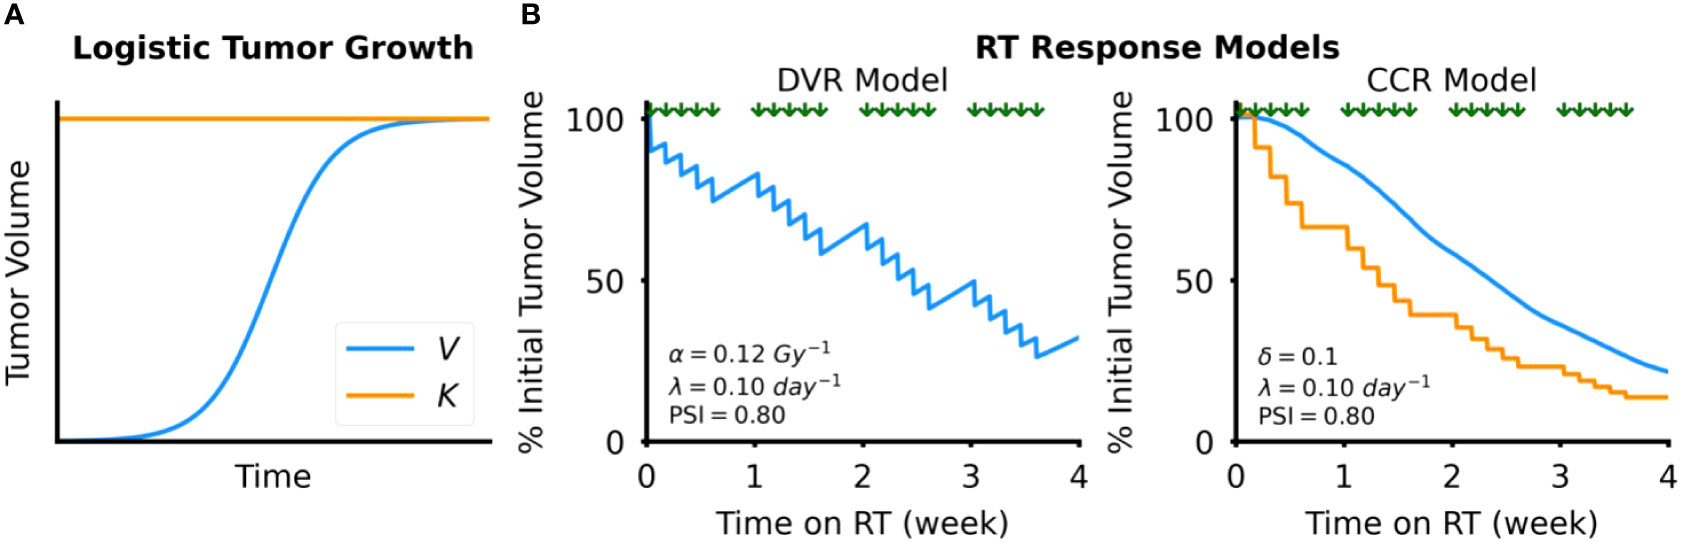
Figure 2 Tumor dynamics models. (A) Simulated example of tumor growth modeled as logistic growth. The blue curve shows tumor volume, V, over time and the orange line the tumor carrying capacity, K (B) Simulated examples of response to RT, which is modeled by either direct tumor volume reduction (DVR, left) or tumor carrying capacity reduction (CCR, right). Timing of RT fractions, simulated as a standard fractionated RT course with weekday fractions, is shown by the arrows above each plot.
where and K 0 are the initial tumor volume and tumor carrying capacity before treatment, respectively. K0 can be prospectively calculated using the following expression:
where is the current tumor volume before radiation (usually obtained at radiation simulation), is the tumor volume measure at diagnosis, and Δt is the time between the two volume measurements (usually a few weeks).5 PSI is defined between 0 and 1. As PSI approaches 0 tumor growth approaches exponential growth, which indicates a tumor microenvironment capable of sustaining a much larger tumor than what currently exists. In contrast, as PSI approaches 1, tumor growth approaches its carrying capacity, which corresponds to high tumor proliferation saturation in the constraints of the tumor microenvironment limiting further proliferation of the tumor.
2.2 Modeling response to radiotherapy
We simulate the effect of RT with 2 different models (1): Direct Tumor Volume Reduction (DVR) and (2) Tumor Carrying Capacity Reduction (CCR).
2.2.1 Direct tumor volume reduction model
In the DVR model (Figure 2B), we simulate the effect of an RT fraction as an instantaneous reduction in proliferating tumor volume due to cancer cell death:
where V+ is the tumor volume after the RT fraction; V- is the tumor volume before the RT fraction; is the cancer cell death rate; and K is the tumor carrying capacity. The parameter is derived from the linear-quadratic model (12, 43):
where d [Gy] is the RT dose per fraction, and [Gy-1] and [Gy-2] are the LQ radiation sensitivity parameters, respectively. In this study, we set the ratio = 10 Gy, as seen in many cancer types that are treated with fractionated RT, including head and neck cancer (44). Of note, here we model the effect of radiation on tumor volume and not individual cells in a clonogenic assay. Therefore, the absolute value of may not be directly comparable to the preclinical radiobiology literature.
2.2.2 Tumor carrying capacity reduction model
In the CCR model (Figure 2B), we model the effect of RT as an instantaneous reduction in the tumor carrying capacity:
where K+ is the tumor carrying capacity after each RT fraction; K– is the tumor carrying capacity before the RT fraction; and δ is the proportion that the carrying capacity is reduced with each RT fraction, ranging from 0 to 1. Modeling the effect of RT as a reduction in the tumor carrying capacity is motivated by observations of how RT alters components of the tumor microenvironment, such tumor vasculature (45) or the release of tumor-specific antigens and damage-associated molecular patterns (DAMPs) that stimulate antitumor immunity (46), that may reduce the tumor carrying capacity. As of yet, the actual dose dependency of radiation-induced carrying capacity reduction is unknown. Thus, we limit this study to the effect of the total dose given in 2 Gy fractions, without consideration of alternative dose fractionations.
2.3 Simulating tumor volume dynamics during RT
All simulations were done using custom scripts developed in Java and subsequent analyses were done in Python. The code for both is available at the following Github repository: https://github.com/akutuva21/SPARK-Project. All simulations of RT were performed using a common schedule for fractionated RT, where d = 2 Gy fractions are delivered daily Monday-Friday with no RT delivered on Saturday and Sunday. All simulations of RT were performed using schedules and doses routinely used in treating head and neck cancer patients. Between-fraction tumor volume changes were simulated with the logistic growth model using a 1-hour time resolution.
2.4 Parameter sweep analysis
To understand the impact of the model parameters on tumor volume dynamics, we conducted parameter sweeps of both the radiosensitivity parameters (α for the DVR model and δ for the CCR model) and the intrinsic tumor growth rate, λ. For the radiosensitivity parameter sweeps, we set λ = 0.1 day-1 and PSI = 0.9 for all simulations. These parameters are arbitrarily chosen to investigate qualitative response dynamics. Dynamics for different growth rate and PSI parameters are comparable and intuitively derivable from the below results. For the DVR model, we tested α (0, 0.20) Gy-1, with a step size of 0.01 Gy-1. For the CCR model, we tested δ (0, 0.20), with a step of size of 0.01.
For the intrinsic growth rate (λ) sweeps, we tested λ (0, 0.10) day-1 for both models. For the other parameters, we set a PSI = 0.7 for both models for rich model dynamics, and α = 0.1 Gy-1 for the DVR model and δ = 0.1 for the CCR model. These sweeps were done using simulations of standard 6 weeks of RT with standard weekday fractionation. Parameter ranges were informed by previous studies fitting these models to longitudinal tumor volume data from head and neck cancer patients that received fractionated RT (31, 34, 35). However, herein we focus on qualitatively demonstrating response dynamics without emphasis on actual values for a specific cancer type.
2.5 Estimating minimum RT dose for locoregional tumor control
In head and neck cancer, mid-treatment volumetric responses correlate with outcome (31, 47). Patients with greater than 32.2% tumor volume reduction after 4 weeks of RT were 100% locoregionally controlled (LRC) at a mean follow-up time of 20 months. We have previously used this tumor volume reduction threshold to estimate patient-specific RT doses to achieve locoregional control (LRC) using the CCR model (34). While it is conceivable that a greater tumor volume reduction would not jeopardize tumor control, higher RT doses are correlated with higher normal tissue complication probability (NTCP).
Here, we will use the 32.2% tumor volume reduction threshold to estimate the minimum cumulative RT dose required to achieve locoregional control (LRC) in both DVR and CCR models. We simulate RT up to 8 weeks (allowing consideration of modest dose escalation) using the same fractionation schedule and dose/fraction described above and then finding the minimum cumulative dose (Dmin) where the tumor volume shrinks below the volume reduction threshold. These simulations were done over the following parameter ranges: PSI (0.6,1.0), α (0.06, 0.14) Gy-1 for the DVR model, and δ (0.01, 0.09) for the CCR model.
3 Results
3.1 Parameter sweep analysis
Intuitively, when the radiosensitivity parameters (α for the DVR model, δ for the CCR model) increase, the reduction in tumor volume increased for both models of RT response (Figure 3). However, the effect of the intrinsic growth rate, λ, on tumor volume reduction were opposite in the two models. In the DVR model, as λ decreases the net tumor volume reduction increases (Figure 4A). This is because with lower λ values there is less repopulation between RT fractions. In the CCR model, however, higher λ values result in higher net tumor volume reduction (Figure 4B). This counterintuitive result comes from the fact that in the CCR model tumor volume only decreases when V > K, which makes < 0 and results in λ becoming the rate at which the tumor volume approaches the current carrying capacity from above. Of interest, this contrasts with the response dynamics during the first week of RT (Figure 3B, inset). During early radiation fractions, the carrying capacity remains greater than the tumor volume, which results in > 0 and continued tumor growth, albeit slower with each fraction as V approaches K. Thus, initially, higher λ values yield higher transient tumor volumes, followed by steeper volume reduction.
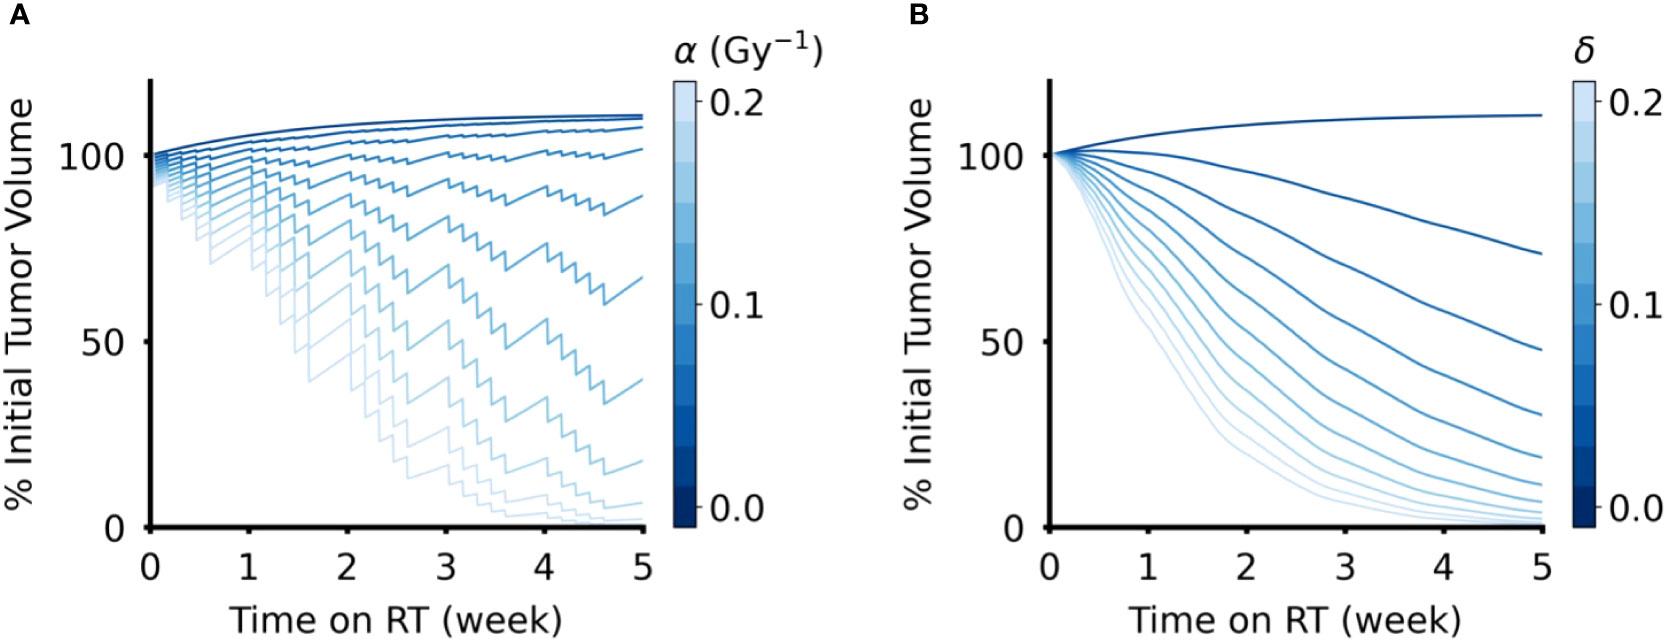
Figure 3 Effect of radiation sensitivity parameter in DVR and CCR models. (A) Tumor volume trajectories simulated using the DVR model with values of α ∈ (0,0.2) Gy-1, where larger α values lead to greater decrease in tumor volume. (B) Tumor volume trajectories simulated using the CCR model with values of δ ∈ (0,0.2), where larger δ values lead to greater decrease in tumor volume. For both models, λ = 0.1 day-1 and PSI = 0.9, and the value of the respective radiation sensitivity parameters are indicated by the color bar. All simulations have an arbitrary initial tumor volume with a fractionated RT regimen, where treatment is applied every weekday for a total of five weeks of treatment.
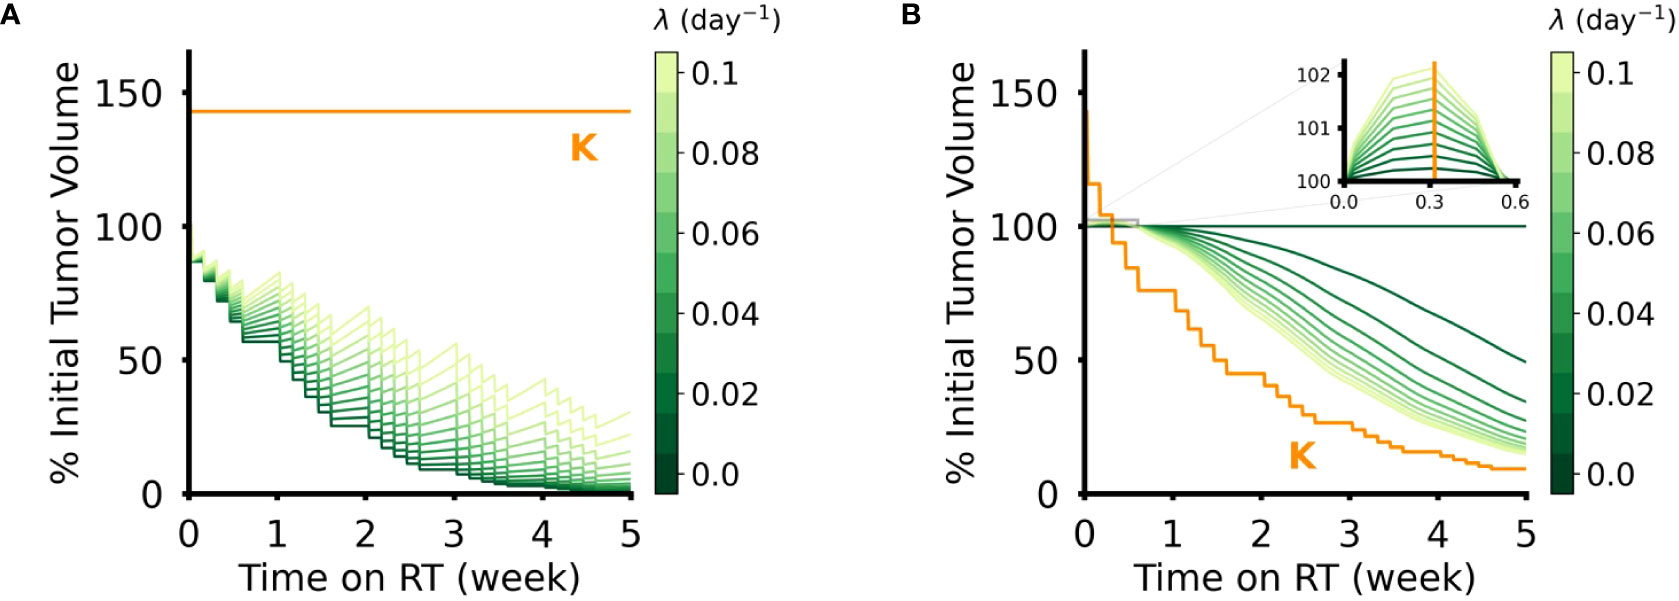
Figure 4 Effect of intrinsic tumor growth rate, λ, in DVR and CCR models. (A) Tumor volume trajectories simulated using the DVR model with α = 0.1 Gy-1 and λ ∈ (0,0.1) day-1. Lower λ values lead to greater net reduction in tumor volume at the end of the treatment course. (B) Tumor volume trajectories simulated using the CCR model with δ = 0.1 and λ ∈ (0,0.1) day-1. Higher λ values lead to greater net reduction in tumor volume at the end of the treatment course. The inset shows the initial phase of simulated RT, where the tumor volume remains above the carrying capacity and lower λ still results in lower tumor volumes. For all simulations PSI = 0.7, and the values of λ are indicated by the color bar. All simulations have an arbitrary initial tumor volume with a fractionated RT regimen, where treatment is applied every weekday for a total of five weeks of treatment.
3.2 Minimum cumulative dose estimation
In the DVR model, higher radiosensitivity (α) leads to lower estimated Dmin for LRC, while higher PSI values lead to higher estimated Dmin (Figures 5A, B). Similarly, in the CCR model higher radiosensitivity (δ) leads to lower estimated Dmin for LRC. However, increasing PSI in the CCR model leads to lower estimated Dmin for LRC (Figures 5E, F). This is, again, due to tumor reduction being achieved only when the carrying capacity drops below the current tumor volume, and consequently < 0. The closer the tumor volume is to its carrying capacity (i.e., higher PSI), the faster radiation can reduce the carrying capacity below the current value. The implications of these analyses can be more clearly seen by looking at Dmin for LRC as a function of PSI and the radiosensitivity parameters (Figures 5C, D, G, H). Dmin(PSI), Dmin(α), and Dmin(δ) were fit to exponential functions with the form , where x is PSI, α, or δ depending on the respective context (fitted coefficient values in SI Tables 1–4). In the DVR model, higher PSI always yields a higher estimate for Dmin regardless of the value of α (Figure 5C). The opposite is true in the CCR model, where higher PSI always yields a lower estimate for Dmin, regardless of the value of δ (Figure 5G). Additionally, for both the DVR and CCR model, higher values of the radiosensitivity parameter yield lower estimates for Dmin (Figures 5D, H). Overall, in the DVR model the highest estimated Dmin values are found at high PSI values and low α values, while in the CCR model the highest estimated Dmin values are found at low δ values and low PSI values.
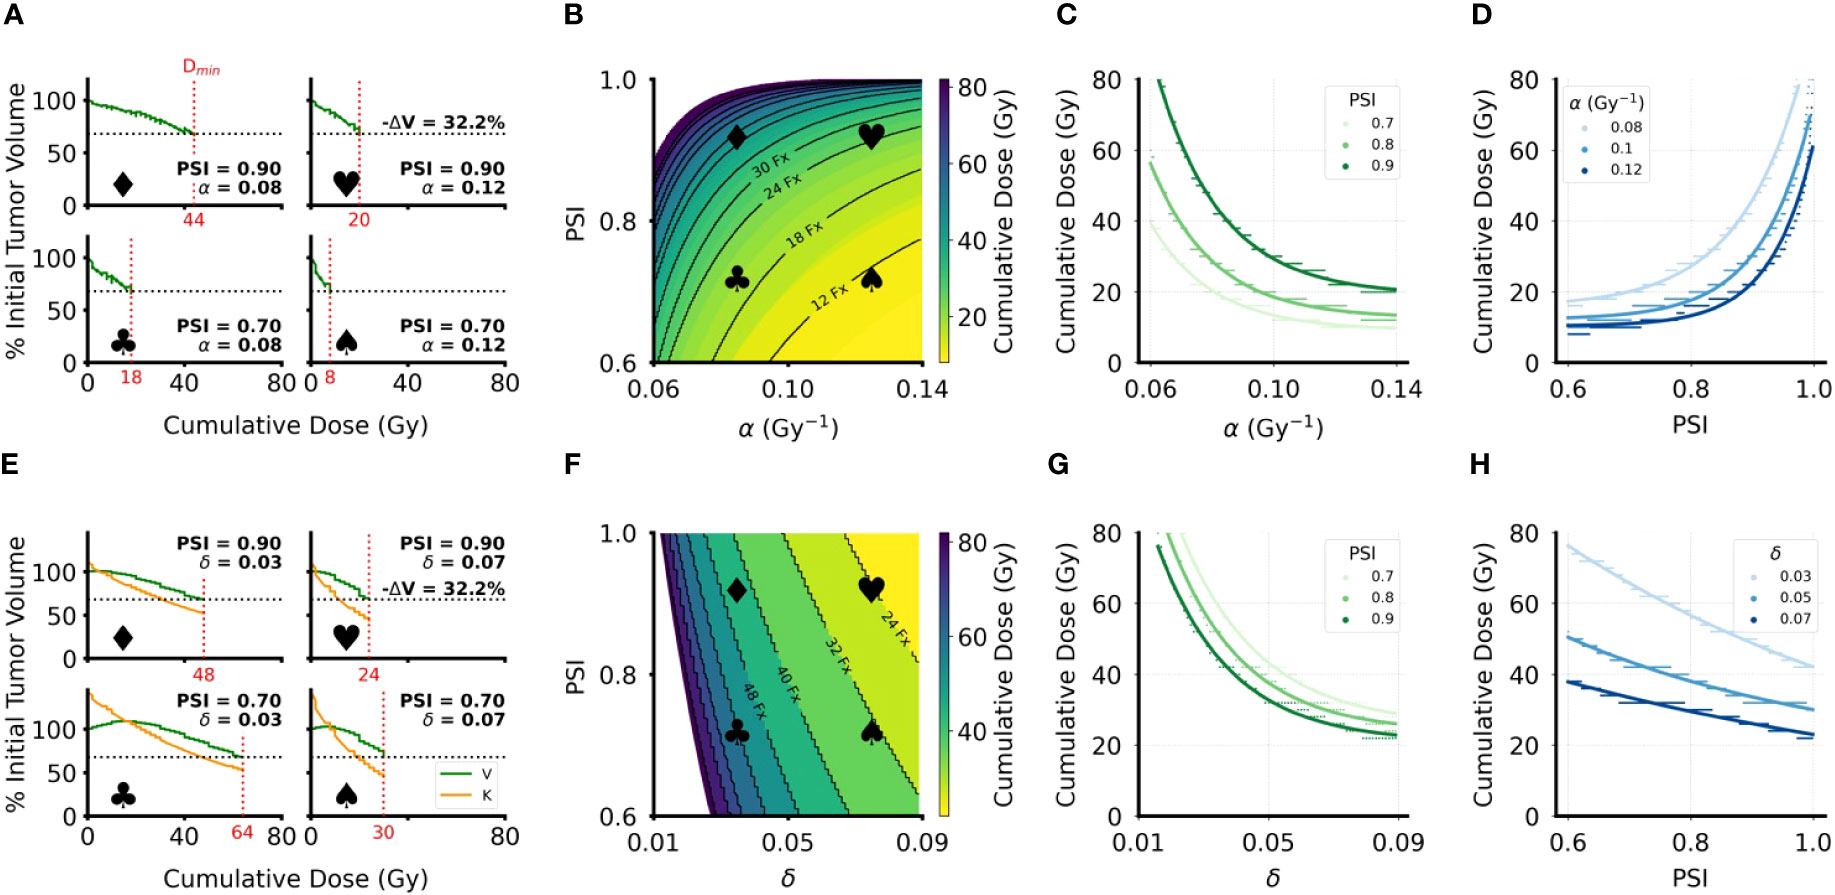
Figure 5 Minimum cumulative dose (Dmin) for LRC estimates for DVR and CCR models. (A, E) Sample volume trajectories for representative parameter pairs across the parameter range, where the bold symbols indicate the location on the heatmap in (B, F). Green curves are the tumor volume plotted as function of cumulative dose, which increases linearly with treatment time; horizontal dashed line indicates the 32.2% volume reduction cutoff used to calculate Dmin; vertical red dashed line indicates the calculated Dmin with the specific value of Dmin indicated on the x-axis. Patient-specific parameters for each simulation are indicated on the corresponding plots. For all simulations, λ = 0.07 day-1. (B, F) Heatmaps of Dmin over the clinically relevant range for the radiosensitivity parameter (α or δ) and PSI. All simulations have an arbitrary initial tumor volume with a fractionated RT regimen, where treatment is applied every weekday for a total of five weeks of treatment. Black curves indicate “iso-dose” levels with the number of RT fractions required for the indicated dose. White areas indicate parameter regions where sufficient volume reduction was not achieved in the 8 weeks of simulated RT. (C, G) Plots of the radiosensitivity parameters (α or δ) against Dmin for PSI = 0.7, 0.8, 0.9. Colored dots are data points sampled from the heatmaps in (B, F); the corresponding solid lines are exponential fits to the data (fitted coefficients in SI). (D, H) Plots of PSI against Dmin for 3 different values of the radiosensitivity parameters. Colored dots are data points sampled from the heatmaps in (B, F); the corresponding solid lines are exponential fits to the data (fitted coefficients in SI Tables 1–4).
4 Discussion
In this study we have shown that different mathematical models of RT response yield different clinical implications. Thus, the choice of RT response model is critical when estimating RT doses that best shrink tumor volumes based on intrinsic model parameters. Although the two models studied herein both estimate that patients with higher radiosensitivity will require a lower RT dose to achieve LRC, they make opposite estimates on the impact of pre-treatment tumor growth dynamics biomarker, PSI. Fast-growing tumors have lower PSI values and slow-growing tumors have higher PSI values. The DVR model, which assumes that the effect of RT comes from the direct radiation-induced death of tumor cells, estimates that tumors with higher PSI values, i.e. lower pre-treatment proliferation, will require a higher RT dose to achieve LRC. However, the CCR model, which assumes that the effect of RT comes from a reduction in the tumor carrying capacity of the local tissue, estimates that higher PSI values will require a lower RT dose to achieve LRC. It is therefore of utmost importance to know which mathematical model best describes the radiobiology that underlies the observable radiation response dynamics. It is encouraging, however, that both radiosensitivity and PSI could be measured or estimated in the clinic: PSI can be calculated by using two temporally separated tumor volume measurements before the start of treatment (28) and radiosensitivity via genomic measures such as the radiosensitivity index (48). Estimates of radiosensitivity may increase in accuracy by using serial measurements of the tumor volume during RT to dynamically update estimates of tumor radiation response (35).
The opposing estimates of the effect of PSI on the required minimum RT dose for LRC stem from the fact that tumor cell death is modulated by PSI in the DVR model as the model assumes that only proliferative cells are killed by RT. This means that as PSI increases, higher and higher doses will be required to achieve the same reduction in tumor volume. On the other hand, in the CCR model tumor volume reduction only occurs once the carrying capacity is less than the tumor volume. This means that tumors with higher PSI values require less RT dose for the carrying capacity to drop below the tumor volume, as the initial values for V and K are already relatively close to each other. This result suggests that by determining which model more accurately describes on-treatment tumor volume dynamics in a particular scenario it may be possible to determine which effect of RT is more dominant.
Herein, we focused on two particular models of radiation response mechanisms in the logistic growth model and PSI framework that have been previously presented – and studied which of the two mechanisms has the predominant effect tumor volume dynamics (28, 35). While it is conceivable that both mechanisms – direct cancer cell kill and modulation of the tumor microenvironment via carrying capacity reduction – contribute to the clinically observed tumor responses, the current framework unable to combine both models without significant adjustments to the underlying mathematics. Combining both models (SI Methods) leads to scenarios where V/K > 1 resulting in numerical artifacts of unrealistic spikes and large oscillations in tumor volume (SI Figure 1) for the majority of tested model parameters (SI Figure 2). It may be possible to prevent this issue by simulating DVR and CCR on different timescales, but the required mathematics are beyond the scope of this study and left for future analysis.
Furthermore, we have constrained the models to only simulate changes in tumor volume immediately before and during an RT treatment course. There are documented delayed and cumulative effects of RT that manifest in the months following radiation (49–51). The discussed models, however, are specifically trained to simulate on treatment tumor response dynamics. For tumor decay following radiation, for example due to activated immune responses or clearance of necrotic debris, more complex models will be required that do not contribute to the implications of the herein discussed results. Additionally, the chosen models require measurable tumor volume. Any dynamics below the limit of detection where stochastic effects may dominate need to be simulated with different mathematical approaches (52, 53).
Ultimately, it is critical to understand if a model appropriately describes tumor growth and treatment response for specific cancer subtypes, or individual patients, before using any such model to make estimates for personalized treatment recommendations. It may eventually be possible to select appropriate patient-specific or tumor site-specific models, but this will require further study. One route for studying which models of response to RT are best fit for different contexts will be increased acquisition of both direct and indirect measurements of tumor burden during the course of RT. This may be enabled by emerging techniques such as RT with MRI-guided linear accelerators (MR-LinAc) (54, 55) and liquid biopsies to measure circulating tumor DNA (ctDNA) and cell-free DNA (cfDNA) (56–58). In the absence of sufficient evidence for cancer-specific or patient-specific model selection, however, the more prudent approach may be to consider model ensembles for making prediction or treatment recommendations. Ensemble modeling is commonly utilized in weather forecasting, transport modeling, ecology, or financial forecasting to account for model biases, measurement uncertainties, and forecast uncertainty (59–63). In the context of modeling tumor response to RT, if using an ensemble of models, one might only recommend a change from standard treatment or dosing when a sufficient number of models in the ensemble agree on the direction or magnitude of the estimated treatment personalization.
Data availability statement
The raw data supporting the conclusions of this article will be made available by the authors, without undue reservation.
Author contributions
AK, MZ, and HE contributed to the conceptualization and design of the study. AK performed all modelling and analyses. JC and KY provided clinical insight and feedback. HE and KY provided administrative and material support. AK, MZ, and HE co-wrote the first draft of the manuscript. MZ supervised the study. All authors contributed to the article and approved the submitted version.
Funding
This project was supported, in part, by the NIH/NCI U01CA244100 and R21CA263911 (HE). AK received support from the H. Lee Moffitt Cancer Center Summer Program for the Advancement of Research Knowledge (SPARK) and the Frank E. Duckworth Foundation. MZ is supported in part by Funds from the Moffit Cancer Center Radiation Oncology Future of Radiation Therapy (FORT) program.
Conflict of interest
The authors declare that the research was conducted in the absence of any commercial or financial relationships that could be construed as a potential conflict of interest.
Publisher’s note
All claims expressed in this article are solely those of the authors and do not necessarily represent those of their affiliated organizations, or those of the publisher, the editors and the reviewers. Any product that may be evaluated in this article, or claim that may be made by its manufacturer, is not guaranteed or endorsed by the publisher.
Supplementary material
The Supplementary Material for this article can be found online at: https://www.frontiersin.org/articles/10.3389/fonc.2023.1130966/full#supplementary-material
References
1. Delaney G, Jacob S, Featherstone C, Barton M. The role of radiotherapy in cancer treatment: estimating optimal utilization from a review of evidence-based clinical guidelines. Cancer: Interdiscip Int J Am Cancer Soc (2005) 104(6):1129–37. doi: 10.1002/cncr.21324
2. Torres-Roca JF. A molecular assay of tumor radiosensitivity: a roadmap towards biology-based personalized radiation therapy. Per Med (2012) 9(5):547–57. doi: 10.2217/pme.12.55
3. Eschrich S, Zhang H, Zhao H, Boulware D, Lee JH, Bloom G, et al. Systems biology modeling of the radiation sensitivity network: A biomarker discovery platform. Int J Radiat Oncol Biol Phys (2009) 75(2):497–505. doi: 10.1016/j.ijrobp.2009.05.056
4. Eschrich SA, Fulp WJ, Pawitan Y, Foekens JA, Smid M, Martens JWM, et al. Validation of a radiosensitivity molecular signature in breast cancer. Clin Cancer Res (2012) 18(18):5134–43. doi: 10.1158/1078-0432.CCR-12-0891
5. Mellon E, Yue B, Strom TS, Torres-Roca JF, Fulp WJ, Scott JG, et al. A genome-based model for adjusting radiotherapy dose (GARD): a retrospective, cohort-based study. Lancet Oncol (2016) 18(2):202–11. doi: 10.1016/S1470-2045(16)30648-9
6. Fang M, Kan Y, Dong D, Yu T, Zhao N, Jiang W, et al. Multi-habitat based radiomics for the prediction of treatment response to concurrent chemotherapy and radiation therapy in locally advanced cervical cancer. Front Oncol (2020) 10:563. doi: 10.3389/fonc.2020.00563
7. Carles M, Fechter T, Radicioni G, Schimek-Jasch T, Adebahr S, Zamboglou C, et al. FDG-PET radiomics for response monitoring in non-small-cell lung cancer treated with radiation therapy. Cancers (2021) 13:814. doi: 10.3390/cancers13040814
8. Cozzi L, Comito T, Fogliata A, Franzese C, Franceschini D, Bonifacio C, et al. Computed tomography based radiomic signature as predictive of survival and local control after stereotactic body radiation therapy in pancreatic carcinoma. PloS One (2019) 14(1):e0210758. doi: 10.1371/journal.pone.0210758
9. el Naqa I, Murphy MJ. What is machine learning? Machine learning in radiation. Oncology (2015), 3–11. doi: 10.1007/978-3-319-18305-3_1
10. Tseng HH, Luo Y, ten Haken RK, el Naqa I. The role of machine learning in knowledge-based response-adapted radiotherapy. Front Oncol (2018) 8:266. doi: 10.3389/fonc.2018.00266
11. Cui S, Hope A, Dilling TJ, Dawson LA, ten Haken R, el Naqa I. Artificial intelligence for outcome modeling in radiotherapy. Semin Radiat Oncol (2022) 32(4):351–64. doi: 10.1016/j.semradonc.2022.06.005
12. Fowler JF. The linear-quadratic formula and progress in fractionated radiotherapy. Br J Radiol (1989) 62:679–94. doi: 10.1259/0007-1285-62-740-679
13. Dale RG. The application of the linear-quadratic dose-effect equation to fractionated and protracted radiotherapy. Br J Radiol (1985) 58(690):515–28. doi: 10.1259/0007-1285-58-690-515
14. Brenner DJ. The linear-quadratic model is an appropriate methodology for determining isoeffective doses at large doses per fraction. Semin Radiat Oncol (2008) 18(4):234–9. doi: 10.1016/j.semradonc.2008.04.004
15. Dahlman EL, Watanabe Y. Evaluating the biologically effective dose (BED) concept using a dynamic tumor simulation model. Med Phys (2020) 47(8):3710–20. doi: 10.1002/mp.14228
16. Fowler JF. 21 Years of biologically effective dose. Br J Radiology. (2010) 83(991):554–68. doi: 10.1259/bjr/31372149
17. Palma G, Monti S, Conson M, Pacelli R, Cella L. Normal tissue complication probability (NTCP) models for modern radiation therapy. Semin Oncol (2019) 46(3):210–8. doi: 10.1053/j.seminoncol.2019.07.006
18. Yaes RJ. Some implications of the linear quadratic model for tumor control probability. Int J Radiat Oncol Biol Phys (1988) 14(1):147–57. doi: 10.1016/0360-3016(88)90062-4
19. Wennberg BM, Baumann P, Gagliardi G, Nyman J, Drugge N, Hoyer M, et al. NTCP modelling of lung toxicity after SBRT comparing the universal survival curve and the linear quadratic model for fractionation correction. Acta Oncol (Madr) (2011) 50(4):518–27. doi: 10.3109/0284186X.2010.543695
20. Anderson ARA, Quaranta V. Integrative mathematical oncology. Nat Rev Cancer (2008) 8(3):227–34. doi: 10.1038/nrc2329
21. Altrock PM, Liu LL, Michor F. The mathematics of cancer: integrating quantitative models. Nat Rev Cancer. (2015) 15(12):730–45. doi: 10.1038/nrc4029
22. Gatenby RA, Maini PK. Mathematical oncology: cancer summed up. Nature (2003) 421(6921):321. doi: 10.1038/421321a
23. Rockne RC, Hawkins-Daarud A, Swanson KR, Sluka JP, Glazier JA, Macklin P, et al. The 2019 mathematical oncology roadmap. Phys Biol (2019) 16(4):41005. doi: 10.1088/1478-3975/ab1a09
24. Aherne NJ, Dhawan A, Scott JG, Enderling H. Mathematical oncology and it’s application in non melanoma skin cancer–A primer for radiation oncology professionals. Oral Oncol (2020) 103:104473. doi: 10.1016/j.oraloncology.2019.104473
25. Alfonso JCL, Parsai S, Joshi N, Godley A, Shah C, Koyfman SA, et al. Temporally feathered intensity-modulated radiation therapy: A planning technique to reduce normal tissue toxicity. Med Phys (2018) 45(7):3466–74. doi: 10.1002/mp.12988
26. Leder K, Pitter K, LaPlant Q, Hambardzumyan D, Ross BD, Chan TA, et al. Mathematical modeling of PDGF-driven glioblastoma reveals optimized radiation dosing schedules. Cell (2014) 156(3):603–16. doi: 10.1016/j.cell.2013.12.029
27. Dean JA, Tanguturi SK, Cagney D, Shin KY, Youssef G, Aizer A, et al. Phase I study of a novel glioblastoma radiation therapy schedule exploiting cell-state plasticity. Neuro Oncol (2022) 25(6):1100–12. doi: 10.1093/neuonc/noac253/6834115
28. Prokopiou S, Moros EG, Poleszczuk J, Caudell J, Torres-Roca JF, Latifi K, et al. A proliferation saturation index to predict radiation response and personalize radiotherapy fractionation. Radiat Oncol (2015) 10(1):1–8. doi: 10.1186/s13014-015-0465-x
29. Poleszczuk J, Walker R, Moros EG, Latifi K, Caudell JJ, Enderling H. Predicting patient-specific radiotherapy protocols based on mathematical model choice for proliferation saturation index. Bull Math Biol (2018) 80(5):1195–206. doi: 10.1007/s11538-017-0279-0
30. Sunassee ED, Tan D, Ji N, Brady R, Moros EG, Caudell JJ, et al. Proliferation Saturation Index in an adaptive Bayesian approach to predict patient-specific radiotherapy responses. Int J Radiat Biol (2019) 95(10):1421–6. doi: 10.1080/09553002.2019.1589013
31. Zahid MU, Mohamed ASR, Latifi K, Rishi A, Harrison LB, Fuller CD, et al. Proliferation saturation index to characterize response to radiation therapy and evaluate altered fractionation in head and neck cancer. Appl Radiat Oncol (2021) 10(1):32–9. doi: 10.37549/ARO1272
32. Enderling H, Alfonso JCL, Moros E, Caudell JJ, Harrison LB. Integrating mathematical modeling into the roadmap for personalized adaptive radiation therapy. Trends Cancer (2019) 5(8):467–4. doi: 10.1016/j.trecan.2019.06.006
33. Brady R, Enderling H. Mathematical models of cancer: when to predict novel therapies, and when not to. Bull Math Biol (2019) 81(10):3722–31. doi: 10.1007/s11538-019-00640-x
34. Zahid MU, Mohamed AS R, Caudell JJ, Harrison LB, Fuller CD, Moros EG, et al. Dynamics-adapted radiotherapy dose (DARD) for head and neck cancer radiotherapy dose personalization. J Personalized Med (2021) 11(11):1124. doi: 10.3390/jpm11111124
35. Zahid MU, Mohsin N, Mohamed ASRR, Caudell JJ, Harrison LB, Fuller CD, et al. Forecasting individual patient response to radiotherapy in head and neck cancer with a dynamic carrying capacity model. Int J Radiat Oncol Biol Phys (2021) 111(3):693–704. doi: 10.1016/j.ijrobp.2021.05.132
36. Araujo RP, McElwain DLS. A history of the study of solid tumour growth: the contribution of mathematical modelling. Bull Math Biol (2004) 66(5):1039–91. doi: 10.1016/j.bulm.2003.11.002
37. Brú A, Albertos S, Subiza JL, García-Asenjo JL, Brú I. The universal dynamics of tumor growth. Biophys J (2003) 85(5):2948–61. doi: 10.1016/S0006-3495(03)74715-8
38. Guiot C, Degiorgis PG, Delsanto PP, Gabriele P, Deisboeck TS. Does tumor growth follow a “universal law”? J Theor Biol (2003) 225(2):147–51. doi: 10.1016/S0022-5193(03)00221-2
39. Guiot C, Delsanto PP, Carpinteri A, Pugno N, Mansury Y, Deisboeck TS. The dynamic evolution of the power exponent in a universal growth model of tumors. J Theor Biol (2006) 240(3):459–63. doi: 10.1016/j.jtbi.2005.10.006
40. Gerlee P. The model muddle: in search of tumor growth laws. Cancer Res (2013) 73(8):2407–11. doi: 10.1158/0008-5472.CAN-12-4355
41. Benzekry S, Tracz A, Mastri M, Corbelli R, Barbolosi D, Ebos JML. Modeling spontaneous metastasis following surgery: An in vivo-in silico approach. Cancer Res (2016) 76(3):535–47. doi: 10.1158/0008-5472.CAN-15-1389
42. Laleh NG, Loeffler CML, Grajek J, Staňková K, Pearson AT, Muti HS, et al. Classical mathematical models for prediction of response to chemotherapy and immunotherapy. PloS Comput Biol (2022) 18(2):e1009822. doi: 10.1371/journal.pcbi.1009822
43. McMahon SJ. The linear quadratic model: usage, interpretation and challenges. Phys Med Biol (2018) 64(1):01TR01. doi: 10.1088/1361-6560/aaf26a
44. van Leeuwen CM, Oei AL, Crezee J, Bel A, Franken NAP, Stalpers LJA, et al. The alfa and beta of tumours: a review of parameters of the linear-quadratic model, derived from clinical radiotherapy studies. Radiat Oncol (2018) 13(1):1–11. doi: 10.1186/s13014-018-1040-z
45. Tozer GM, Myers R, Cunningham VJ. Radiation-induced modification of blood flow distribution in a rat fibrosarcoma. Int J Radiat Biol (1991) 60(1–2):327–34. doi: 10.1080/09553009114552081
46. Friedman EJ. Immune modulation by ionizing radiation and its implications for cancer immunotherapy. Curr Pharm Des (2002) 8(19):1765–80. doi: 10.2174/1381612023394089
47. Byun DJ, Tam MM, Jacobson AS, Persky MS, Tran TT, Givi B, et al. Prognostic potential of mid-treatment nodal response in oropharyngeal squamous cell carcinoma. Head Neck. (2020) 43(1):173–81. doi: 10.1002/hed.26467
48. Eschrich SA, Pramana J, Zhang H, Zhao H, Boulware D, Lee JH, et al. A gene expression model of intrinsic tumor radiosensitivity: prediction of response and prognosis after chemoradiation. Int J Radiat Oncol Biol Phys (2009) 75(2):489–96. doi: 10.1016/j.ijrobp.2009.06.014
49. Wallgren A. Late effects of radiotherapy in the treatment of breast cancer. Acta Oncologica (1992) 31(2):237–42. doi: 10.3109/02841869209088909
50. Coia LR, Myerson RJ, Tepper JE. Late effects of radiation therapy on the gastrointestinal tract. Int J Radiat Oncol Biol Phys (1995) 31(5):1213–36. doi: 10.1016/0360-3016(94)00419-L
51. Cooper JS, Fu K, Marks J, Silverman S. Late effects of radiation therapy in the head and neck region. Int J Radiat Oncol Biol Phys (1995) 31(5):1141–64. doi: 10.1016/0360-3016(94)00421-G
52. Gerlee P, Altrock PM, Malik A, Krona C, Nelander S. Autocrine signaling can explain the emergence of Allee effects in cancer cell populations. PloS Comput Biol (2022) 18(3):e1009844. doi: 10.1371/journal.pcbi.1009844
53. Kimmel GJ, Locke FL, Altrock PM. The roles of T cell competition and stochastic extinction events in chimeric antigen receptor T cell therapy. Proc R Soc B (2021) 288(1947). doi: 10.1098/rspb.2021.0229
54. Liney GP, Whelan B, Oborn B, Barton M, Keall P. MRI-linear accelerator radiotherapy systems. Clin Oncol (2018) 30(11):686–91. doi: 10.1016/j.clon.2018.08.003
55. Hall WA, Small C, Paulson E, Koay EJ, Crane C, Intven M, et al. Magnetic resonance guided radiation therapy for pancreatic adenocarcinoma, advantages, challenges, current approaches, and future directions. Front Oncol (2021) 11:628155. doi: 10.3389/fonc.2021.628155
56. Lv J, Chen Y, Zhou G, Qi Z, Tan KRL, Wang H, et al. Liquid biopsy tracking during sequential chemo-radiotherapy identifies distinct prognostic phenotypes in nasopharyngeal carcinoma. Nat Commun (2019) 10(1):1–10. doi: 10.1038/s41467-019-11853-y
57. Chaudhuri AA, Binkley MS, Osmundson EC, Alizadeh AA, Diehn M. Predicting radiotherapy responses and treatment outcomes through analysis of circulating tumor DNA. Semin Radiat Oncol (2015) 25(4):305–12. doi: 10.1016/j.semradonc.2015.05.001
58. Earland N, Chen K, Semenkovich NP, Chauhan PS, Zevallos JP, Chaudhuri AA. Emerging roles of circulating tumor DNA for increased precision and personalization in radiation oncology. Semin Radiat Oncol (2023) 33(3):262–78. doi: 10.1016/j.semradonc.2023.03.004
59. Gneiting T, Raftery AE. Weather forecasting with ensemble methods. Sci (1979) (2005) 310(5746):248–9. doi: 10.1126/science.1115255
60. Leutbecher M, Palmer TN. Ensemble forecasting. J Comput Phys (2008) 227(7):3515–39. doi: 10.1016/j.jcp.2007.02.014
61. Wu H, Levinson D. The ensemble approach to forecasting: A review and synthesis. Transp Res Part C Emerg Technol (2021) 132:103357. doi: 10.1016/j.trc.2021.103357
62. Araújo MB, New M. Ensemble forecasting of species distributions. Trends Ecol Evol (2007) 22(1):42–7. doi: 10.1016/j.tree.2006.09.010
Keywords: radiotherapy, mathematical modeling, oncology, personalized oncology, model comparison
Citation: Kutuva AR, Caudell JJ, Yamoah K, Enderling H and Zahid MU (2023) Mathematical modeling of radiotherapy: impact of model selection on estimating minimum radiation dose for tumor control. Front. Oncol. 13:1130966. doi: 10.3389/fonc.2023.1130966
Received: 24 December 2022; Accepted: 28 August 2023;
Published: 09 October 2023.
Edited by:
James C. L. Chow, University of Toronto, CanadaReviewed by:
Andrew Dhawan, Cleveland Clinic, United StatesArun Radhakrishnan, JKKN College of Pharmacy, India
Copyright © 2023 Kutuva, Caudell, Yamoah, Enderling and Zahid. This is an open-access article distributed under the terms of the Creative Commons Attribution License (CC BY). The use, distribution or reproduction in other forums is permitted, provided the original author(s) and the copyright owner(s) are credited and that the original publication in this journal is cited, in accordance with accepted academic practice. No use, distribution or reproduction is permitted which does not comply with these terms.
*Correspondence: Mohammad U. Zahid, bW9oYW1tYWQuemFoaWRAbW9mZml0dC5vcmc=