
95% of researchers rate our articles as excellent or good
Learn more about the work of our research integrity team to safeguard the quality of each article we publish.
Find out more
ORIGINAL RESEARCH article
Front. Oncol. , 23 February 2023
Sec. Hematologic Malignancies
Volume 13 - 2023 | https://doi.org/10.3389/fonc.2023.1128560
This article is part of the Research Topic Decoding the Genome of Acute Lymphoblastic Leukemia Through Genomic and Transcriptomic Approaches View all 5 articles
 Femke M. Hormann1,2,3
 Alex Q. Hoogkamer1,2Aurélie Boeree1,2
 Edwin Sonneveld1,4
 Gabriele Escherich5,6
 Monique L. den Boer1,2,3,4
 Judith M. Boer1,2*
Background and purpose: Intrachromosomal amplification of chromosome 21 (iAMP21) is a rare subtype of B-cell precursor acute lymphoblastic leukaemia (BCP-ALL). It is unknown how iAMP21 contributes to leukaemia. The currently known commonly amplified region is 5.1 Mb.
Methods: We aimed to narrow down the common region of amplification by using high resolution techniques. Array comparative genomic hybridization (aCGH) was used to determine copy number aberrations, Affymetrix U133 Plus2 expression arrays were used to determine gene expression. Genome-wide expression correlations were evaluated using Globaltest.
Results: We narrowed down the common region of amplification by combining copy number data from 12 iAMP21 cases with 52 cases from literature. The combined common region of amplification was 1.57 Mb, located from 36.07 to 37.64 Mb (GRCh38). This region is located telomeric from, but not including, RUNX1, which is the locus commonly used to diagnose iAMP21. This narrow region, which falls inside the Down Syndrome critical region, includes 13 genes of which the expression of eight genes was significantly upregulated compared with 143 non-iAMP21 B-other cases. Among these, transcriptional repressor RIPPLY3 (also known as DSCR6) was the highest overexpressed gene (fold change = 4.2, FDR < 0.001) and most strongly correlated (R = 0.58) with iAMP21-related genome-wide expression changes.
Discussion: The more precise definition of the common region of amplification could be beneficial in the diagnosis of iAMP21 based on copy number analysis from DNA sequencing or arrays as well as stimulate functional research into the role of the included genes in iAMP21 biology.
Paediatric B-cell acute lymphoblastic leukaemia (BCP-ALL) is the most common childhood malignancy. BCP-ALL consists of several subtypes, each one defined by different chromosomal rearrangements, associated with different prognoses. One of these rearrangements is an intrachromosomal amplification of chromosome 21 (iAMP21). The iAMP21 subtype was discovered in 2003 during routine fluorescence in situ hybridization (FISH) screening for the ETV6-RUNX1 fusion gene, when amplifications of the RUNX1 gene were observed (1, 2). Currently, the most commonly used definition of iAMP21 is ”three or more extra copies of RUNX1 on a single abnormal chromosome 21 (a total of five or more RUNX1 signals per cell)” (3, 4). Recent studies have focussed more on the distinctive genomic profile of chromosome 21 (5, 6). iAMP21 BCP-ALL accounts for ~2% of all BCP-ALL cases and often occurs in older children presenting with a low white blood cell count at diagnosis (7). The prognosis of this subtype is poor when treated on a standard protocol (8, 9), but the prognosis improves with more intensive treatment (7, 10). Although some iAMP21 cases harbour concomitant lesions that might be targetable (11, 12), no targeted treatment is available for this high risk subtype.
iAMP21 is characterized by an abnormal chromosome 21, showing structural aberrations such as amplifications, losses, inversions, and other rearrangements. This chromosome is thought to arise through a breakage-fusion-bridge mechanism, often followed by chromothripsis (4, 13–15). While the iAMP21 arises through chromosomal instability, the final chromosome remains stable (4, 16). As can be expected from the formation process, the formed iAMP21 is unique for each case (4, 15). However, Rand et al. (4) show that the amplification is not completely random, with a region that is amplified in 18 studied cases of 5.1 Mb spanning from 32.8 to 37.9 Mb (hg18). This amplified region contains 86 genes (coding and non-coding) (4), and even though some of these genes are highly overexpressed in iAMP21 (17), none of these genes have yet been identified to be causally deregulated by the amplification. Besides overexpression of genes on chromosome 21 (cis-effect), many genes outside of chromosome 21 are overexpressed as well (17), opening up the possibility of an indirect leukemic effect of chromosome 21 amplification (trans-effect).
We aimed to narrow down the common region of amplification (CRA) by combining our patients’ data with published data sets and to pinpoint pivotal genes by integrating analysis of copy number and gene expression data. Our results suggest possible targets of the transformation involved in iAMP21. In addition, narrowing down the CRA in iAMP21 may help the diagnosis of this high-risk subtype based on copy number profiles.
Bone marrow and/or peripheral blood samples were collected from children with BCP-ALL at time of diagnosis. In accordance with the declaration of Helsinki, and as approved by the Medical Ethics Committee of the Erasmus Medical Center, Rotterdam, The Netherlands, written informed consent to use excess diagnostic material for research purposes was obtained from parents or guardians. Children with newly diagnosed ALL in three consecutive Dutch Childhood Oncology Group trials (DCOG ALL-8, ALL-9, and ALL-10) (18), and two German Cooperative ALL trials (COALL 06-97 and 07-03) (19) were included in this study. The major known cytogenetic subtypes of BCP-ALL, BCR-ABL1, ETV6-RUNX1, KMT2A/MLL-rearranged, TCF3-PBX1, as well as ploidy status (high hyperdiploidy; 51-65 chromosomes, near tetraploidy; >65 chromosomes, and low hypodiploidy; <39 chromosomes) were determined using karyotyping, fluorescence in situ hybridization (FISH) and RT-PCR by reference laboratories. Mononuclear cells were obtained from bone marrow and/or peripheral blood samples by Lymphoprep density gradient centrifugation and blast percentage was determined based on morphology using May-Grunwald-Giemsa staining (20). If necessary, samples were enriched to >90% leukemic blasts using negative beads enrichment. RNA and DNA were routinely isolated from samples using TRIzol reagents.
Copy number was determined in a population-based paediatric ALL cohort (n=372) using the Agilent G3 Human 4x180K aCGH (reference genome build hg18), co-hybridized with 1 µg patient DNA (ULS-Cy5-labeled) and 1 µg reference genomic DNA male pool (ULS-Cy3-labeled), as previously described (21). Agilent Feature Extraction software was used to generate normalized log Ratios. CGHcall was used to normalize the data. The data was dewaved using the NoWave package (22) and 16 references samples, excluding the Y chromosome. Data was centralized using the CGHnormaliter package (23). CGHcall was used to generate segmented data. Segmented LogR values (log2) were used to determine the CRA. Normalized LogR values (log2) were used for the correlation between copy number and gene expression. Copy number data are available at GEO under accession number GSE184692 (see Supplementary Table S1 for used samples). Supplementary SNP array data (reference genome build hg19) from Gu et al. (24) were used to extend the number of samples. All iAMP21 cases with available SNP array data were selected, excluding SJBALL042258, which is a 60-year-old patient, and SJBALL014273, which showed no apparent iAMP21 copy number profile. Borders of the CRA in hg18 builds were converted to hg19 using the UCSC liftover tool.
Gene expression microarrays (Affymetrix U133 Plus 2) from a previously described population-based paediatric ALL cohort were used (25, 26). In short, expression data was normalized using vsnrma (27), and batch effects were removed using the empirical Bayes method (28). Differential gene expression between 12 iAMP21 and 143 B-other cases was determined using Limma with false discovery rate (FDR) multiple testing correction (29). Gene expression data are available at GEO under accession number GSE87070 (see Supplementary Table S1 for used samples). As a validation cohort, RNA sequencing gene expression data from the Pediatric Cancer (PeCan) database (https://pecan.stjude.cloud/) were used. Gene expression in fragments per kilobase per million mapped reads (FPKM) of selected genes was extracted. BCP-ALL samples annotated as BCR-ABL1, ETV6-RUNX1, TCF3-PBX1, high hyperdiploidy, low hypodiploidy, and infant ALL were excluded from analysis, resulting in a validation cohort of 17 iAMP21 samples and 174 B-other samples. Differential gene expression of target genes was determined using the Mann Whitney U test with Bonferroni multiple testing correction.
To determine the correlation between copy number and gene expression one copy number probe and one gene expression probeset per gene were selected. Selection was based on the best correlation between copy number and gene expression (spearman correlation, determined by p-value) and most significant overexpression in iAMP21 compared with B-other cases. Genome-wide gene expression integration, or gene-set testing, was done using the Globaltest package (30), using gene expression of the selected probeset as the response variable and genome-wide gene expression as the covariate. The Globaltest tests the correlation of the input probeset to all other gene expression probesets as a set (global p-value, Bonferroni multiple testing corrected) and to all other gene expression probesets individually (local p-value, FDR multiple testing corrected within each gene-set, correlation signature).
Bonferroni corrected p-values were considered significant if <0.05, FDR corrected p-values were considered significant if <0.01. Boxplots show the median (thick line), first and third quartile (box), and minimum and maximum (whiskers; to the furthest distance of 1.5 times the interquartile range). R (version 3.6.3) and Rstudio were used for all data analyses.
We selected 155 BCP-ALL samples without major known cytogenetic subtypes for which both gene expression array and aCGH data was available (Supplementary Figure S1). Among these 155 samples (Table 1) 12 cases showed a copy number profile suggestive of iAMP21 (Supplementary Figure S2). Of the 143 remaining cases, collectively called B-other, 16 samples had a gain of chromosome 21 (of which 6 Down syndrome (DS) cases) and 4 samples had another structural aberration on chromosome 21 (osa21; data not shown). iAMP21 cases had a lower white blood cell count (median 7.6 vs 30 x 109/L, p=0.0056 (Mann Whitney-U)) than the remaining B-other cases. Similarly to previous reports (7), RB1 deletion (p <0.001) and EBF1 deletion (p = 0.043) were more frequent, while PAX5 deletions (p = 0.0035) and CDKN2A deletions (p = 0.0061) were less frequent in the iAMP21 group (Table 1). Clinical characteristics and treatment outcome of the 12 individual iAMP21 patients are detailed in Supplementary Table S2. Interestingly, based on karyotypes, we found one iAMP21 DS patient (iAMP21-06) and one non-DS patient (iAMP21-10), both with an apparent ring chromosome 21 based on karyotype, which is not often described (Supplementary Table S2) (7). As only aberrant karyotypes were available, it was not possible to determine whether the ring chromosome is constitutional or acquired in the leukemic cells.
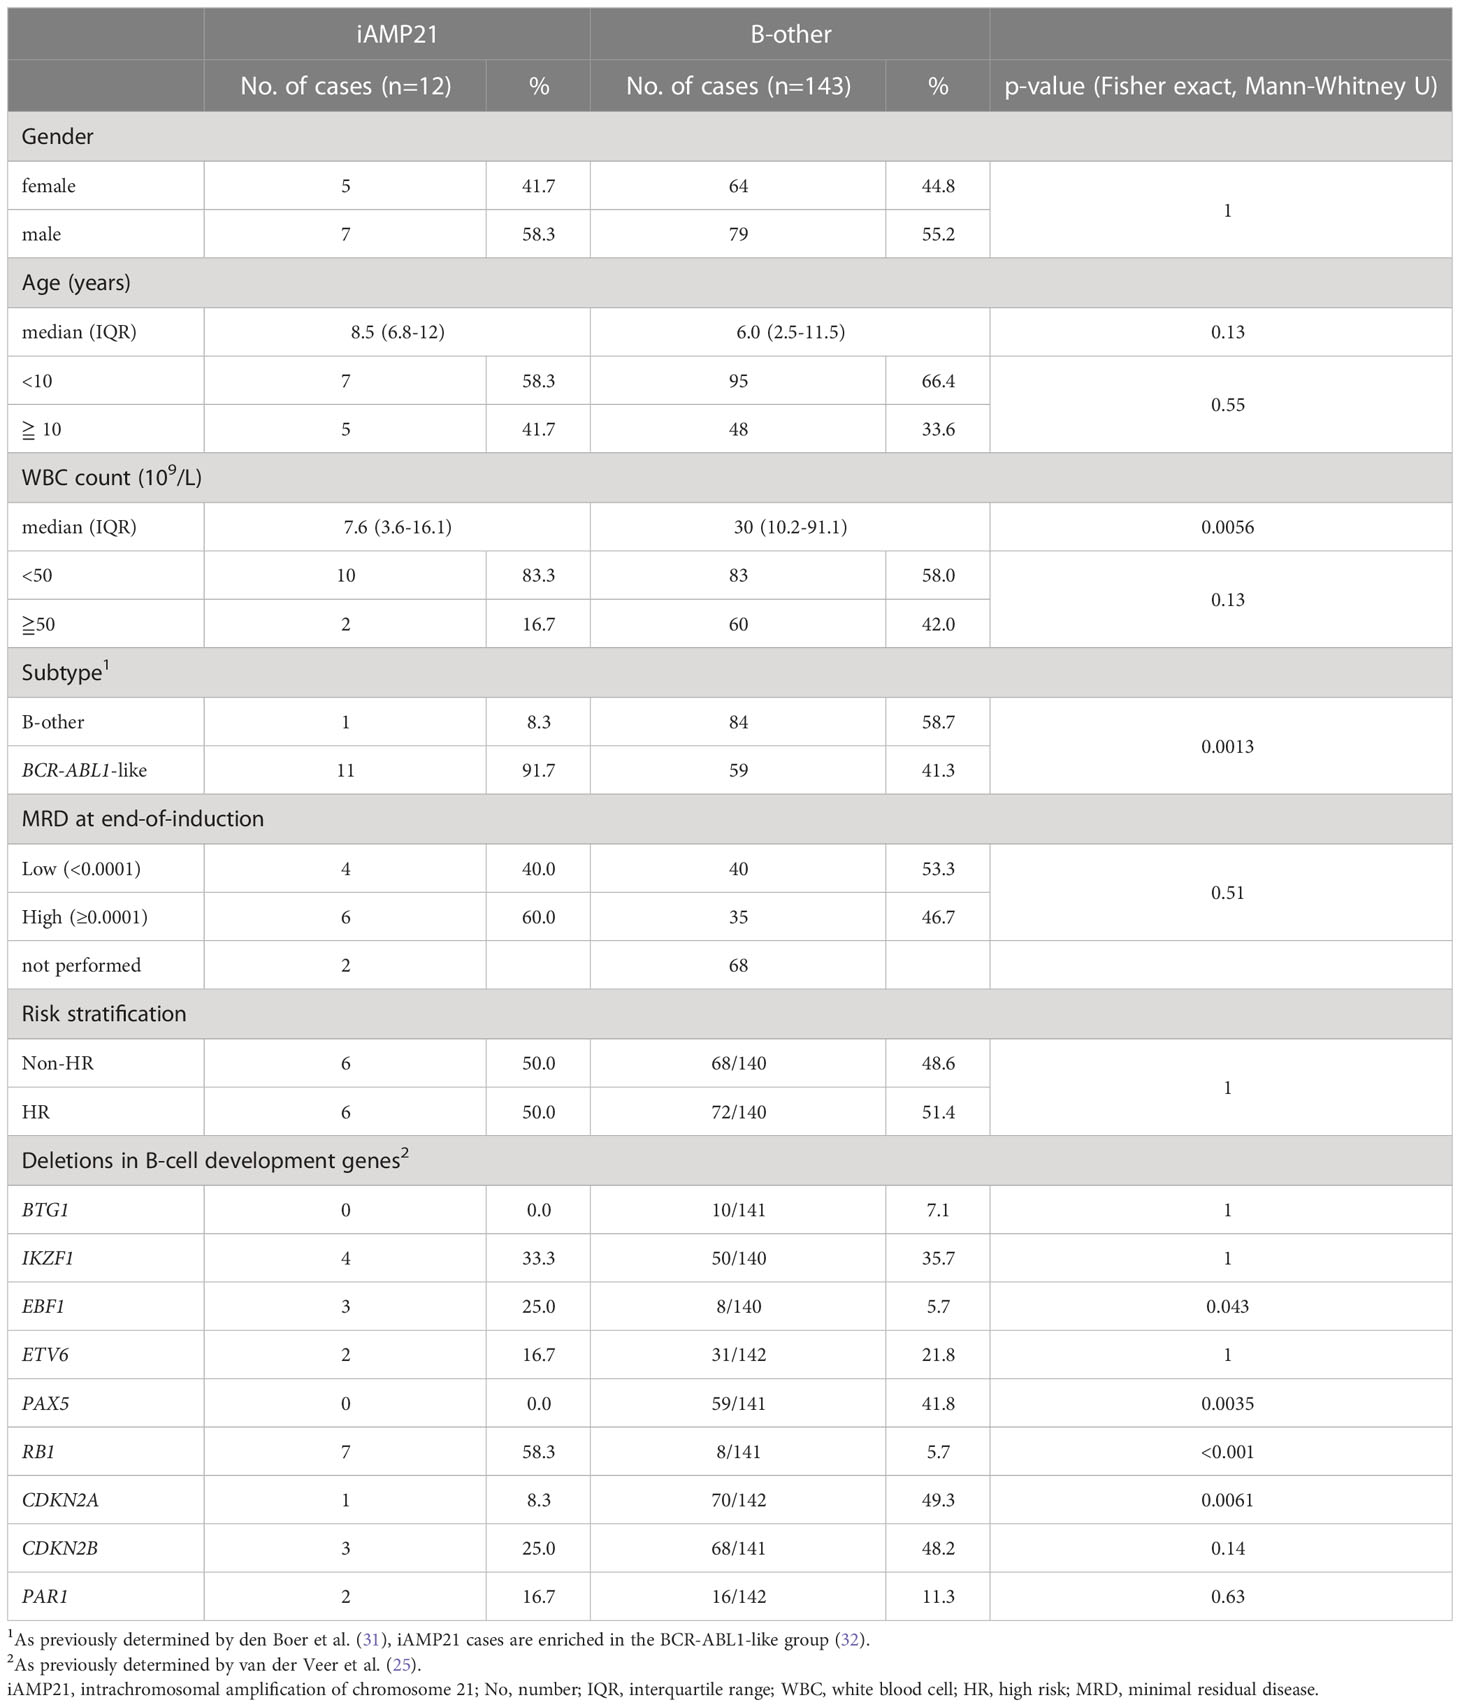
Table 1 Clinical characteristics of included patients.
The chromosome 21 copy number profile of the 12 iAMP21 cases showed amplifications mainly between 30 Mb to 40 Mb (Supplementary Figure S2). To determine the common region of amplification, a LogR cut-off of 0.75 was chosen based on comparison of aCGH profiles of high hyperdiploid samples (data not shown) and expected to indicate a copy number of four or greater. There were three regions where all 12 iAMP21 cases showed amplification, located from 35.11-35.38 Mb (containing RUNX1), 36.12-37.93 Mb, and 38.04-39.92 Mb (hg18; Figures 1A, B). To further define the CRA we extended our dataset to include the supplementary SNP array data of Gu et al. (24), where segMean values above 0.4 were determined to equal an amplification. Using the same strategy, the CRA in this cohort was defined, locating from 37.45-40.54 Mb (hg19; Figures 2A, B). By combining these two CRAs with the CRA as published by Rand (4), we defined a combined CRA based on 64 iAMP21 cases (Figure 2C). The combined CRA was located from 37.45-39.01 Mb (hg19; 36.07-37.64 Mb in the most recent GRCh38 genome build) and comprised of 12 protein-coding genes (CBR3, DOPEY2, MORC3, CHAF1B, CLDN14, SIM2, HLCS, RIPPLY3 (also known as DSCR6), PIGP, TTC3, DSCR3 (also known as VPS26C), and DYRK1A) and one non-coding gene (DSCR9; Figure 2D). Notably, both borders of the combined CRA seemed to be defined by two studies; our study and Rand et al. (4) at the centromeric border, our study and Gu et al. (24) at the telomeric border.
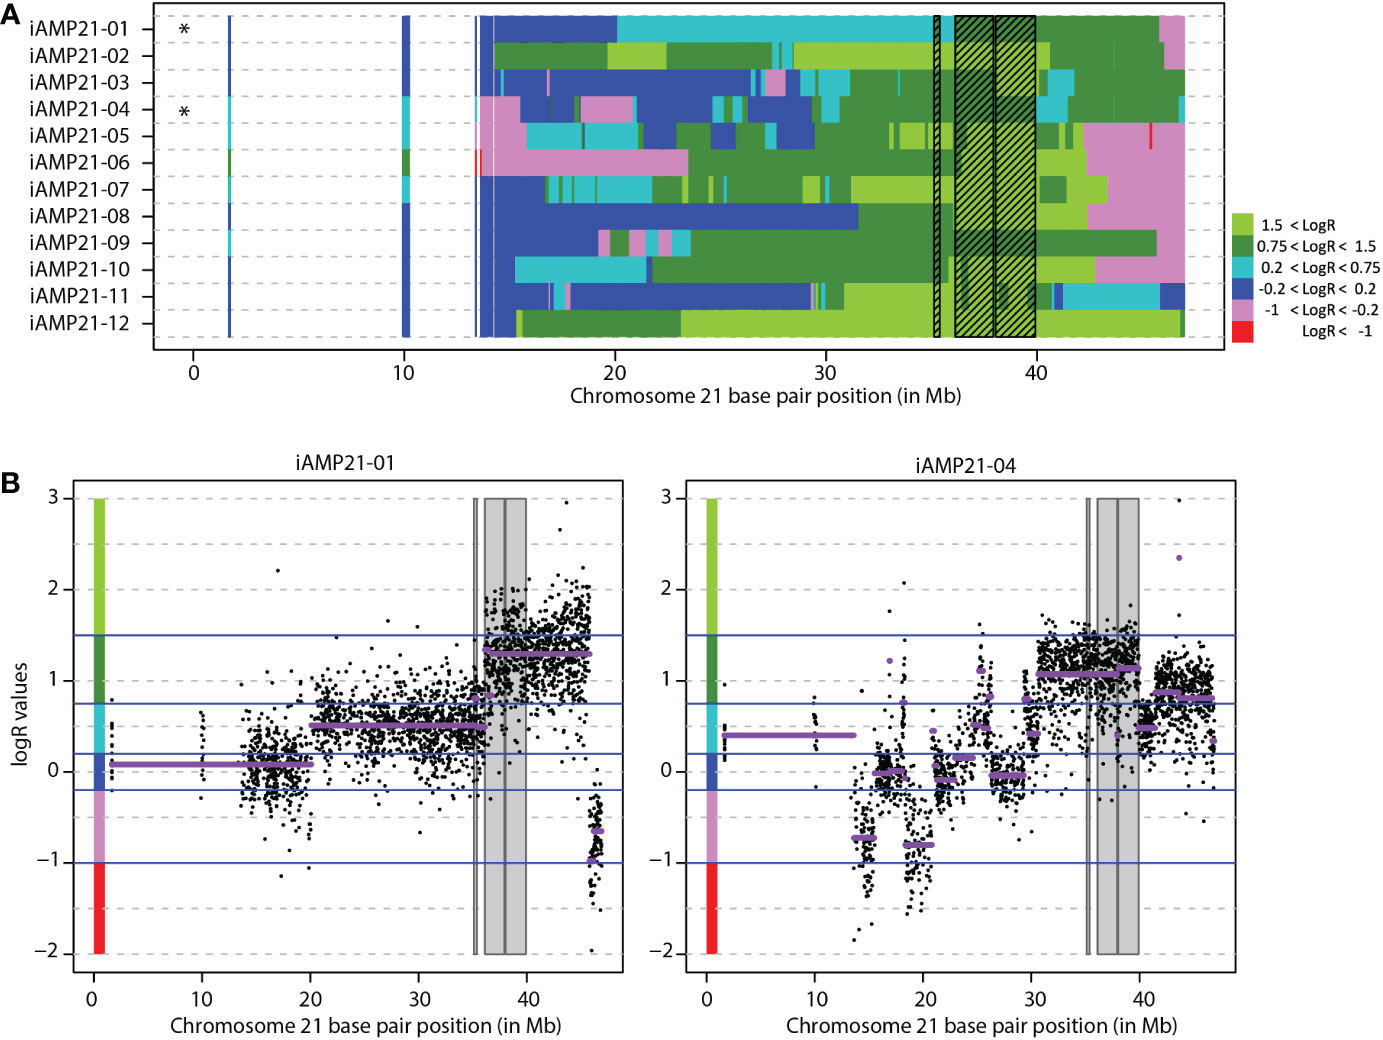
Figure 1 Determination of the common region of amplification in 12 iAMP21 cases. (A) Segmented chromosome 21 LogR values 12 copy number profiled iAMP21 cases. Each row depicts one case ordered randomly. Shaded region shows the common region of amplification in this cohort (CRA). Chromosome 21 base pair position is shown on the x-axis (reference genome hg18). Black stars depict cohort CRA defining cases. (B) Chromosome 21 copy number profile of the two cases that define the borders of the CRA. The y-axis shows normalized LogR values of individual probes (dots) and segmented LogR values (purple lines). Chromosome 21 base pair position is shown on the x-axis (reference genome hg18), with LogR value on the y-axis. Shaded region shows the CRA. Blue lines show the LogR value cut-offs as used in figure 1A, colours on the y-axis represent the colours as shown in figure 1A.
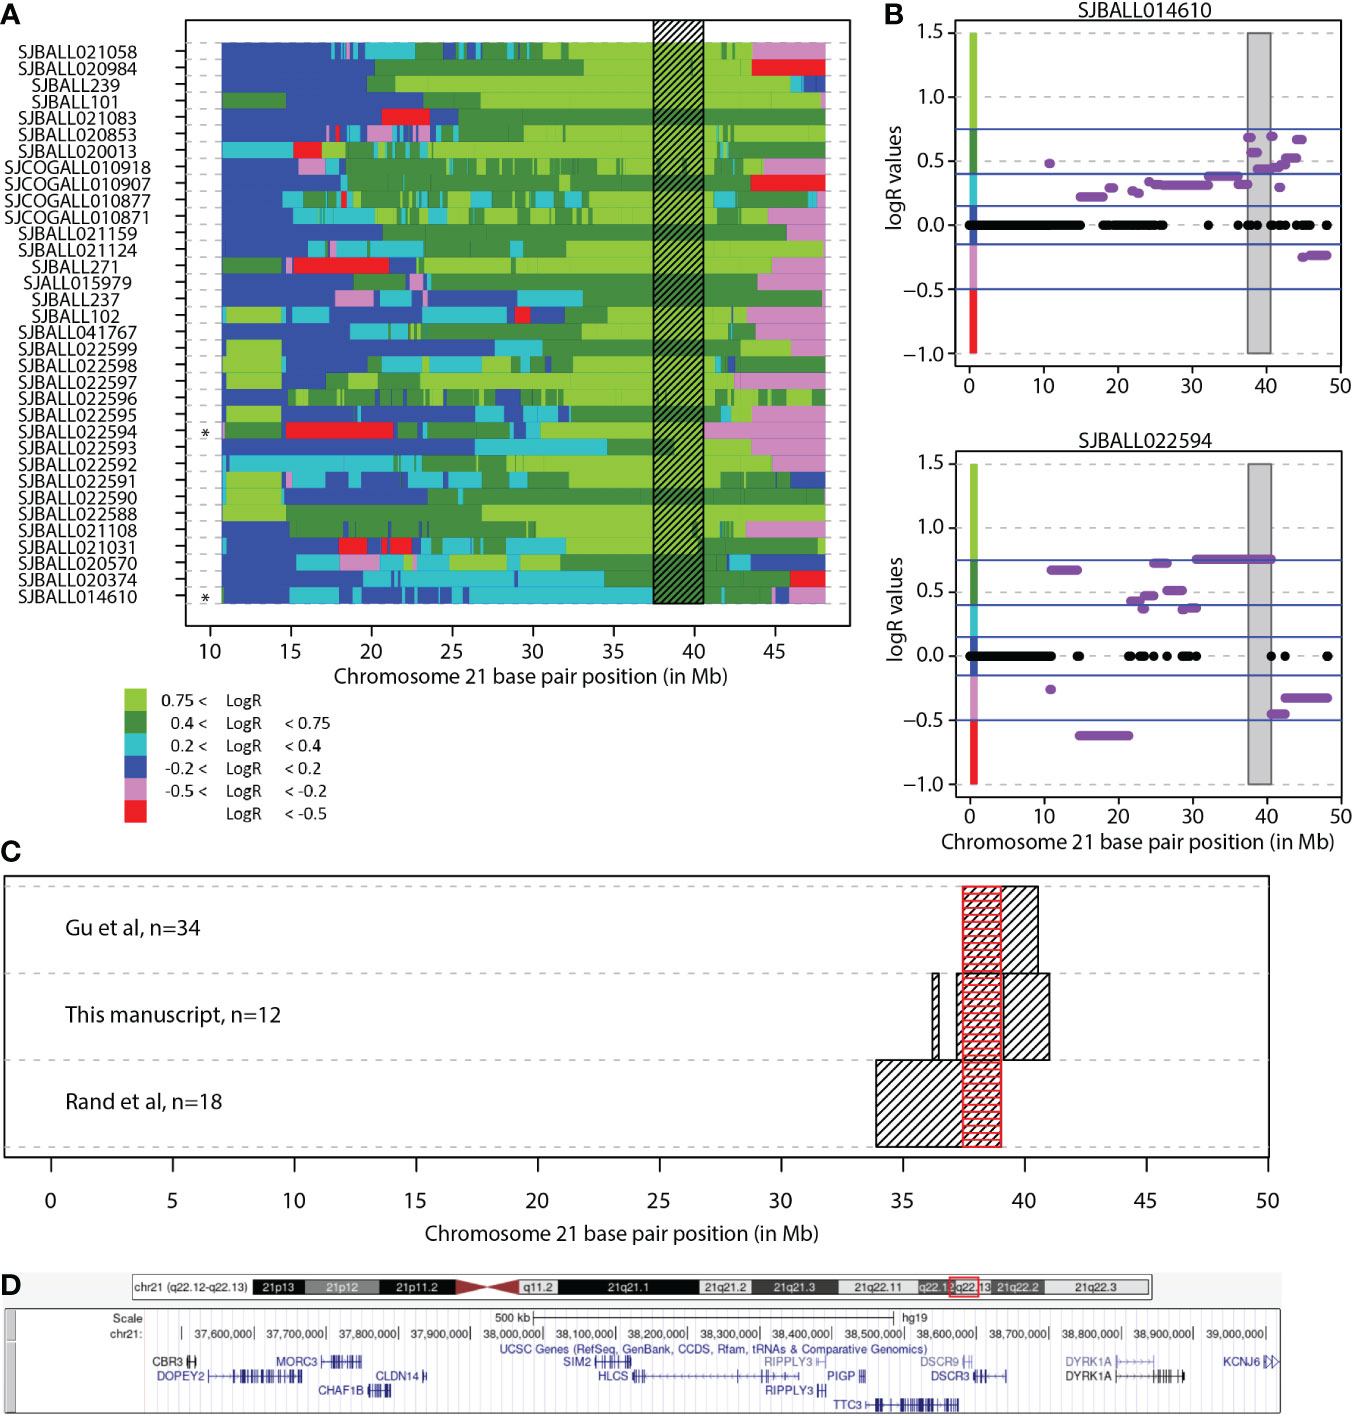
Figure 2 Combined common region of amplification. (A) Segmented chromosome 21 LogR values in 34 iAMP21 cases from the study of Gu et al. Each row depicts one case. Shaded region shows the common region of amplification in this cohort (CRA). Black stars depict cohort CRA defining cases. Chromosome 21 base pair position is shown on the x-axis (reference genome hg19). (B) Chromosome 21 copy number profile of the two cases from Gu et al. that define the region. Purple lines show the segMean values, values between -0.2-0.2 were absent from supplement, indicated in black. Chromosome 21 base pair position is shown on the x-axis (reference genome hg19), with LogR values on the y-axis. Shaded region shows the common region of amplification. Blue lines show the LogR value borders as used in figure 2A, colours on the y-axis represent the colours as shown in figure 2A. (C) The overlap of the CRA in all three studies. Black boxes show the region in each study, red box shows the overlap between all studies. Chromosome 21 base pair position is shown on the x-axis (reference genome hg19). (D) Overview common region of amplification. Snapshot taken from UCSC genome browser (Reference genome hg19/GRCh37; location chr21:37,452,074-39,019,555). DSCR3 is also known as VPS26C.
To determine iAMP21-related genome-wide gene expression changes, we compared gene expression between 12 iAMP21 and 143 B-other samples (n = 143), excluding sentinel subtypes such as ETV6-RUNX1 and high hyperdiploidy. As the B-other group is still a heterogeneous subgroup, the results should identify a unique iAMP21 effect. In total, 1126 probesets were differentially expressed, measuring 744 unique genes (Supplementary Table S3). Of these, 101 probesets, measuring 41 unique genes, were located on chromosome 21, while 1025 probesets, measuring 704 unique genes were located on other chromosomes. Most probesets were overexpressed, only five probesets on chromosome 21 were downregulated, while almost a third of probesets outside of chromosome 21 (307/1025 = 30%) were downregulated.
RUNX1, located on chromosome 21, has often been mentioned as a potential oncogene affected by the transformation resulting in iAMP21. However, RUNX1 is not located in the newly identified CRA. While expression of RUNX1 was indeed modestly increased in iAMP21 compared with B-other in our dataset (log2(fold change) [logFC] = 0.69, FDR = 0.030; Figure 3A) and in the independent PeCan dataset (logFC = 0.44, Bonferroni corrected p-value = 0.002; Figure 3B), there was no correlation between RUNX1 copy number and RUNX1 gene expression (Bonferroni corrected p-value = 0.262, spearman correlation; Figure 3C).
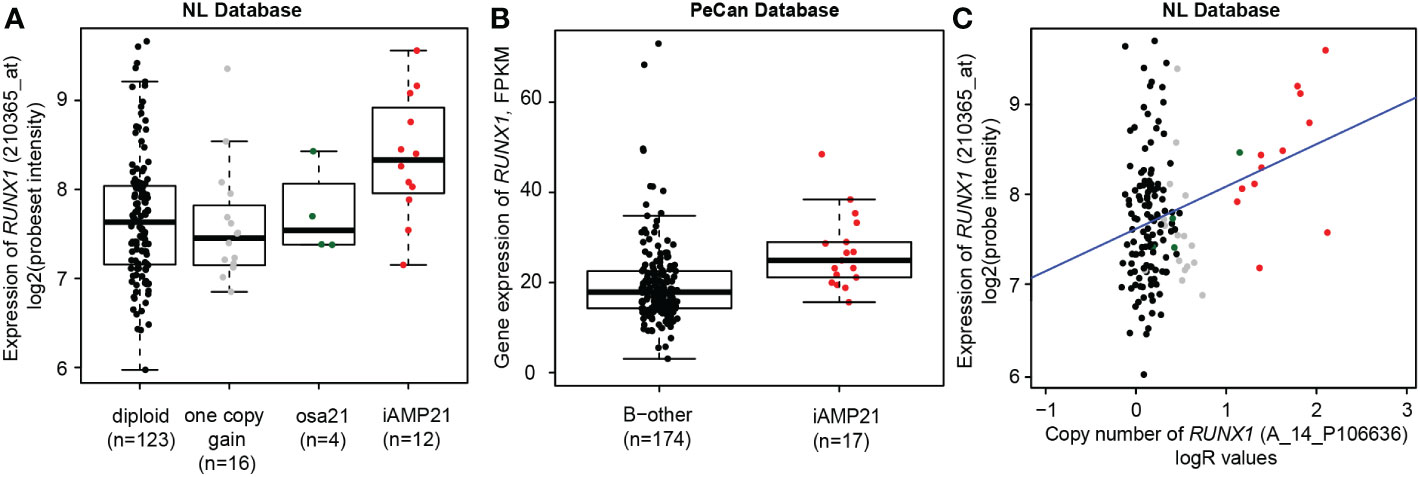
Figure 3 RUNX1 copy number and expression in iAMP21 cases. (A) Expression levels of RUNX1 (log2 intensities) categorized based on chromosome 21 copy number aberrations determined by aCGH: diploid, one copy gain, other structural aberration on chromosome 21 (osa21), and iAMP21. (B) Expression of RUNX1 (FPKM) in the PeCan database. Selected cases were categorized based on iAMP21 status, as described in the PeCan database. (C) Correlation between copy number (normalized LogR values, x-axis) and gene expression (log2 values, y-axis). Cases are coloured based on chromosome 21 copy number aberrations determined by aCGH: diploid, one copy gain, other structural aberration on chromosome 21 (osa21), and iAMP21 (see figure 3A). Blue line represents the linear regression trendline using all samples shown in this figure.
iAMP21 leads to an increased copy number on chromosome 21, but the levels differ between cases. The genes affected by the transformation are likely located in the CRA, where the copy number gain is expected to result in increased gene expression. We prioritized the genes within the combined CRA based on three assumptions. Firstly, the gene should be overexpressed in iAMP21 samples compared with B-other samples. Of the 13 protein-coding genes in the combined CRA, eight (MORC3, CHAF1B, HLCS, RIPPLY3, PIGP, TTC3, VPS26C, and DYRK1A) were significantly overexpressed in iAMP21 cases compared with the non-iAMP21 B-other cases in our cohort and in the PeCan cohort (Supplementary Table S4; Supplementary Figure S3). Most of the eight selected genes were uniquely expressed in iAMP21 or increased in both iAMP21 and high hyperdiploid (not statistically tested, Supplementary Figure S4). Secondly, the copy number and gene expression should be correlated (cis-effect). The eight overexpressed genes in the CRA showed a positive correlation between copy number and gene expression (Supplementary Table S4; Supplementary Figure S3). These genes were either uniquely overexpressed in iAMP21 or increased in both iAMP21 and high hyperdiploid (not statistically tested, Supplementary Figure S4). Thirdly, we expect that genome-wide expression associated with the individual CRA gene expression as determined by gene-set testing with a non-supervised method (Globaltest) strongly overlaps with the iAMP21 signature (trans-effect). Each of the eight selected genes in the CRA was correlated to genome-wide gene expression changes (Table 2) and displayed highly different genome-wide effects, both in which genes were affected and in number of associated genes (Supplementary Table S5). The expression signature of RIPPLY3 (also known as DSCR6), overlapped most with the iAMP21 differential gene expression results (Figure 4A). Of the 1126 iAMP21-related differentially expressed probesets, 838 (74%) were significantly associated with RIPPLY3 expression, of which 759 were not located on chromosome 21. In addition, the -log10(p-values) of the iAMP21 signature showed the highest correlation with the RIPPLY3 correlation signature (R = 0.58, Table 2). RIPPLY3 was the highest overexpressed gene in the CRA of iAMP21 cases in our dataset (logFC = 2.08, FDR < 0.001; Figure 4B), as well as the PeCan dataset (logFC = 2.92, Bonferroni corrected p-value < 0.001; Figure 4C). In addition, RIPPLY3 copy number and expression were highly correlated, with the steepest correlation of all genes tested (Figure 4D; Table 2). Interestingly, one sample with a total of 5 copies of the long arm of chromosome (osa21), showed high RIPPLY3 expression as well (Figure 4B). RIPPLY3 is located in the region with the highest amplification within the CRA (Figure 4E).
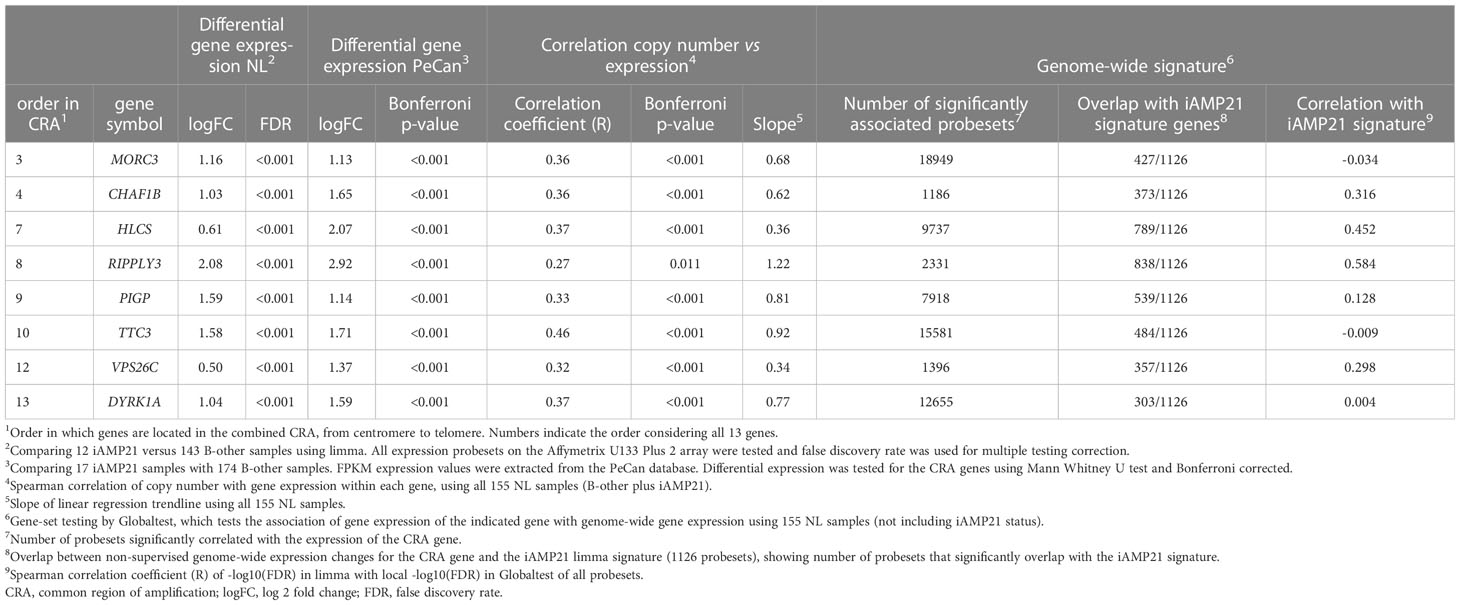
Table 2 Expression and genome-wide correlations of the eight selected genes in the combined iAMP21 common region of amplification.
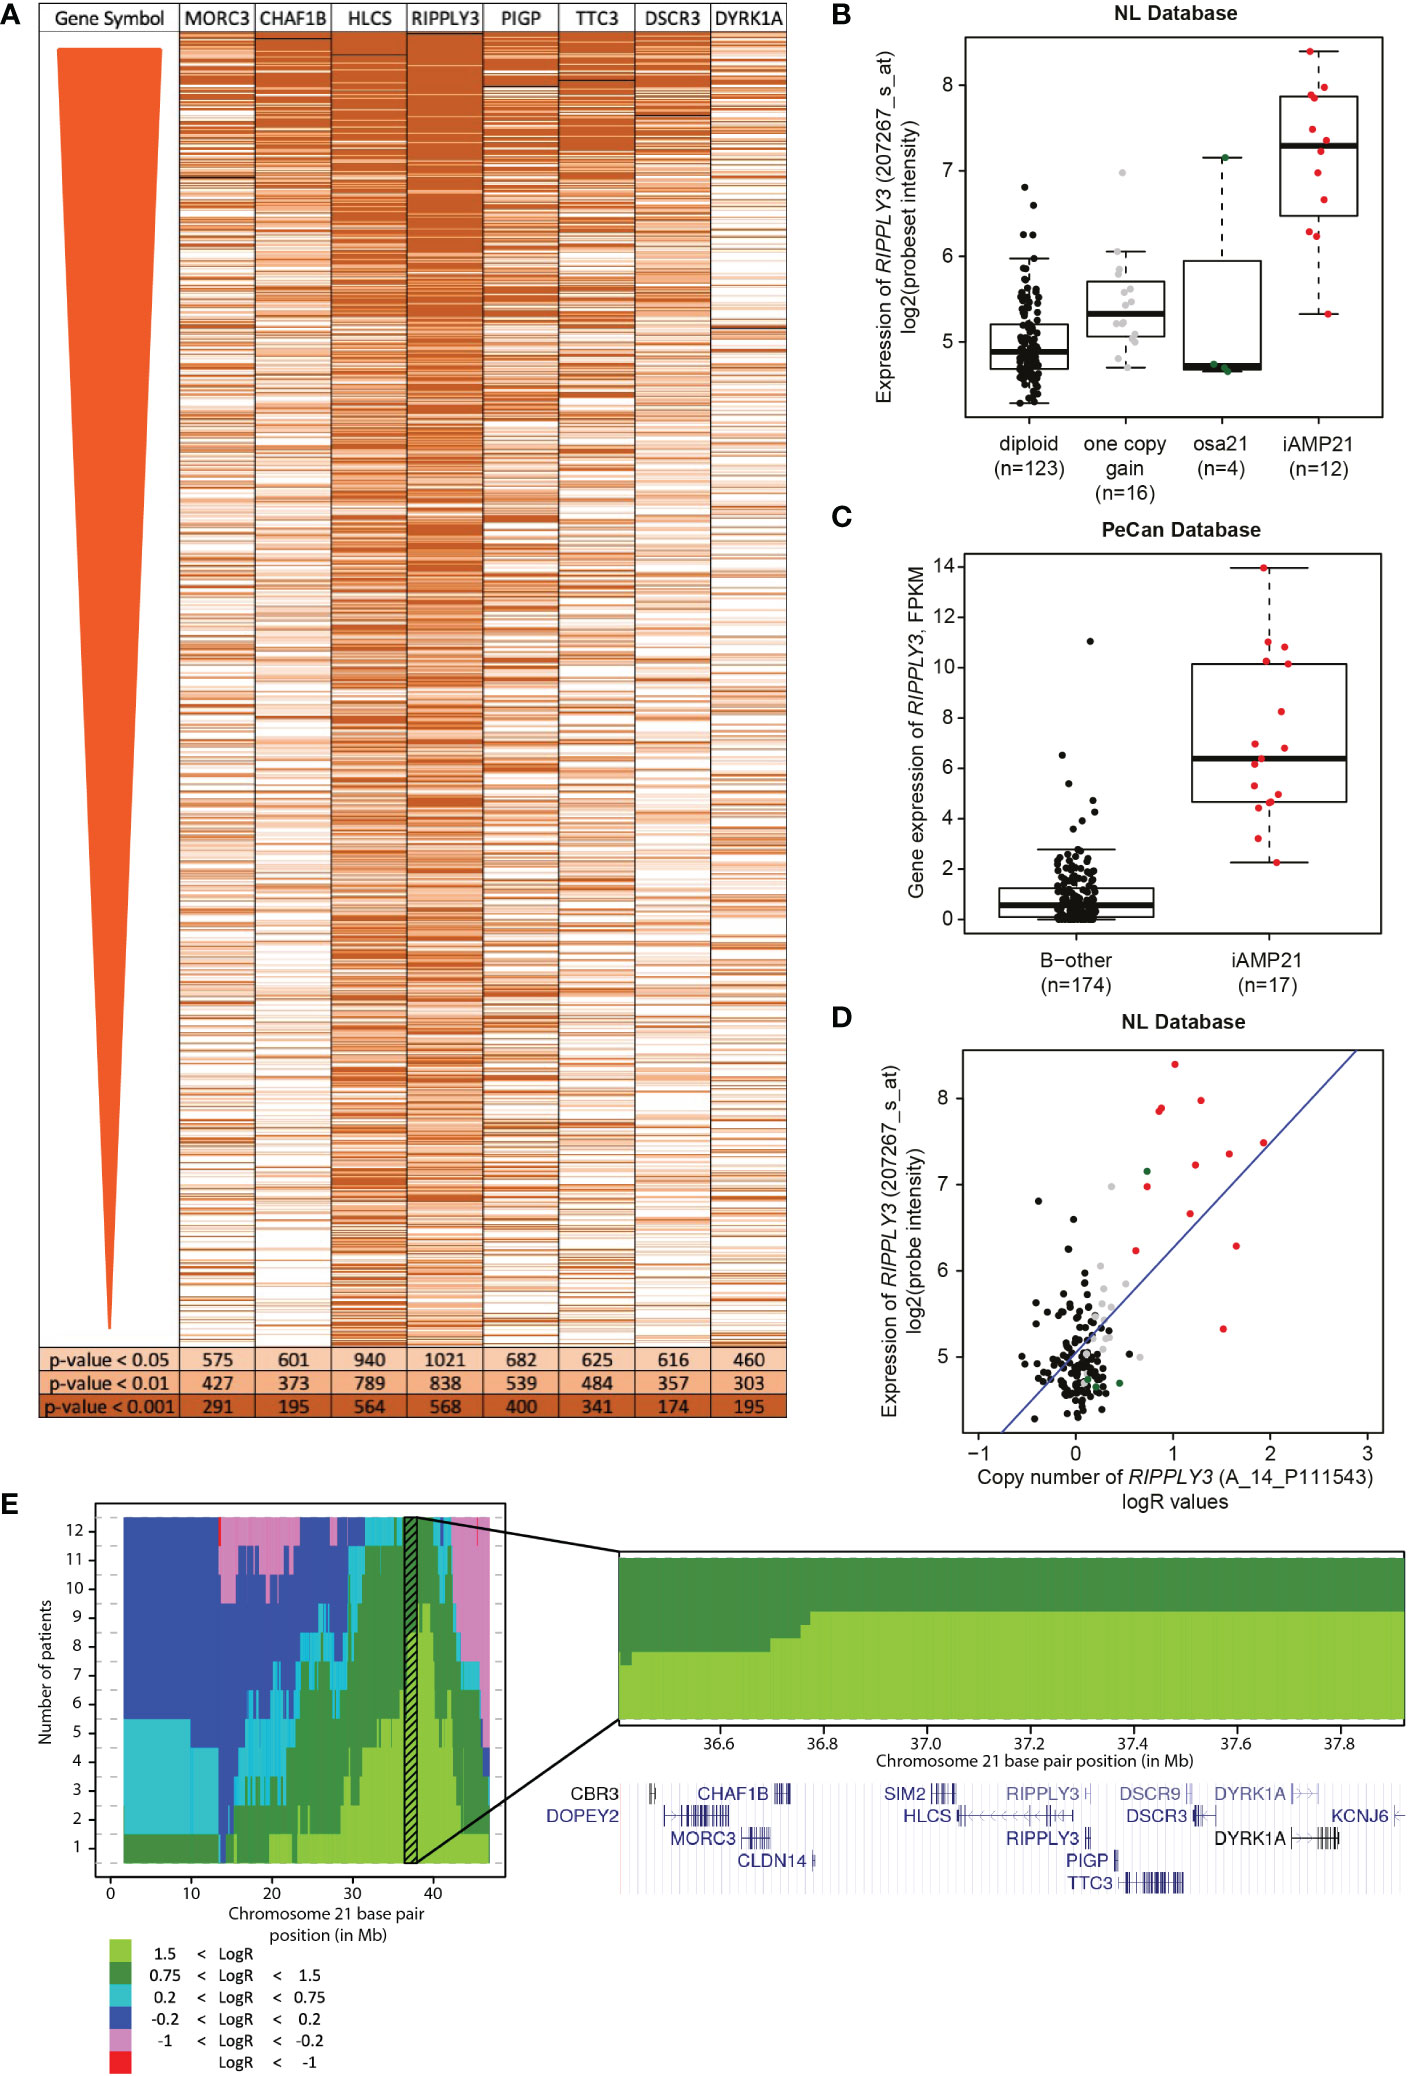
Figure 4 Correlation of RIPPLY3 (also known as DSCR6) and the iAMP21 signature. (A) Heatmap showing the significant probesets in the differential gene expression analysis (FDR < 0.01; limma), ordered on FDR from lowest to high. Each row represents a probeset, colours show correlation of the probeset to one of the eight selected probesets, determined with gene-set testing (Globaltest). Light orange: local globaltest FDR < 0.05; medium orange: FDR < 0.01; dark orange: FDR < 0.001. (B) Expression levels of RIPPLY3 (log2 intensities) categorized based on chromosome 21 copy number aberrations determined by aCGH: diploid, one copy gain, other structural aberration on chromosome 21 (osa21), and iAMP21. (C) Expression of RIPPLY3 (FPKM) in the PeCan database. Selected cases are categorized based on iAMP21 status, as described in the PeCan database. (D) Correlation between copy number (normalized LogR values, x-axis) and gene expression (log2 values, y-axis). Cases are coloured based on chromosome 21 copy number aberrations determined by aCGH: diploid, one copy gain, other structural aberration on chromosome 21 (osa21), and iAMP21. Blue line represents the linear regression trendline using all samples shown in this figure. (E) Histogram showing the cumulative copy number in all 12 iAMP21 cases. Chromosome 21 base pair position is shown on the x-axis (reference genome hg18), number of cases on the y-axis. Colours show the segmented LogR values, see legend. Shaded region shows the combined CRA. Bottom panel shows a zoom-in of the combined CRA. Gene locations are indicated by the UCSC genome browser cut-out. DSCR3 is also known as VPS26C.
We narrowed down the CRA to 1.57 Mb, encompassing 13 genes, based on 64 cases. Of note, both borders of this CRA seemed to be defined by two studies and therefore by two different patients. While all CRA genes might be potential target genes of iAMP21, and could have a combined effect, RIPPLY3 was highest prioritised based on genomic data integration. Since iAMP21 is a primary event in the development of BCP-ALL (4), it might confer its initiating effects via RIPPLY3 and/or one of the other CRA genes.
A recent study from Öfverholm et al. (17) identified MORC3, SON, CHAF1B and DYRK1A as potential candidates for the iAMP21 pathophysiology. In our study, MORC3, CHAF1B, and DYRK1A, located in the CRA, were upregulated, but less strongly than RIPPLY3 (CHAF1B: R = 0.32) or not at all correlated to the iAMP21 signature (MORC3: R = -0.034; DYRK1A: R = 0.004). RIPPLY3 was the most overexpressed gene on chromosome 21 in their study, but not further evaluated since it was not significantly overexpressed in iAMP21 cases compared with high hyperdiploid cases. The study from Öfverholm et al. used a biased subset of cases, with 30% (14/46) dic (9, 20) cases, while we compared iAMP21 cases with population-based, diverse B-other cases. Although direct comparison is difficult, three out of four genes identified by this independent study were located in the combined CRA, indicating the potential specificity of this region.
RIPPLY3 is a relatively understudied gene and no associations with leukaemia have been shown yet. Discovered in 2000 (33), RIPPLY3 plays an important role in embryonic development (34, 35). RIPPLY3 is a transcriptional corepressor, regulating the transcriptional activity of other transcription factors, such as TBX1 and STAT3 (36, 37). RIPPLY3, or the transcription factors it regulates, might affect gene expression changes observed in iAMP21 BCP-ALL, with 30% of the non-chromosome 21 differentially expressed genes being downregulated. We focussed on finding the target of the first step of the iAMP21 leukemic transformation, while other iAMP21 studies focus on the concomitant lesions, such as lesions in the RAS pathway (11) or the JAK/STAT pathway (12, 38). These lesions provide interesting targeting options using for example trametinib or ruxolitinib, however, they will only benefit cases with those specific lesions. Finding the gene or genes responsible for the BCP-ALL initiation, like RIPPLY3 may be, might lead to the development of a more specific treatment, benefitting more or even all iAMP21 cases.
The role of chromosome 21 in paediatric BCP-ALL has been extensively studied in DS-ALL, since the risk of developing BCP-ALL is 20 times higher in children with a constitutional gain of chromosome 21 (39). DS is not always characterized by a gain of a complete chromosome 21 but is sometimes due to a partial trisomy of chromosome 21. Modelling the DS phenotype in mice has led to identification of a Down Syndrome Critical Region (DSCR), spanning 5.3 Mb and containing 33 genes (40). This region starts at the same position as the combined CRA. As shown by Lane et al. (41), triplication of this region leads to indefinite self-renewal of B-cell colonies. Lane et al. (41) identified HMGN1, located in the DSCR, as a candidate gene for DS BCP-ALL. HMGN1 overexpression results in an increase in global transcription (42). Although overexpressed in our samples (LogFC = 0.95, Bonferroni corrected p-value < 0.001) HMGN1 is located distal and hence outside the CRA at around 39.3 Mb (GRCh38).
Since iAMP21 is a high risk subtype, benefitting from a more intense treatment, accurate diagnosis of this subtype is essential (7, 10). In agreement with previous reports (43–45), we suggest that not all iAMP21 cases follow the current WHO definition that is focussed on RUNX1 copy number. Although the distinctive genomic profile of chromosome 21 could be beneficial in identifying iAMP21 cases as well (46, 47), our identified CRA could aid in the diagnosis of iAMP21 based on copy number analysis. While RUNX1 is likely not the target gene of iAMP21, it is still often in a region with high amplification, making the subgroup of iAMP21 patients with low RUNX1 amplification small. It would be informative to compare clinical outcome in this small group of iAMP21 patients, that would be missed with classical FISH screening for RUNX1, with the remaining iAMP21 patients in an international collaboration.
This study presents an in silico approach to determine the potential target gene of iAMP21. We chose a cut-off that should represent a copy number of four or higher. As the same cut-off was used in all cases within the same cohort, this should accurately represent the CRA. In addition, we only used samples with a high blast percentage (above 90%), which minimizes the effect of normal cells on the LogR. While mRNA expression generally represents protein expression well, mRNA may not correlate with protein expression in all cases. A further determination of protein expression of genes in the CRA and functional studies of their role in leukaemia would be greatly beneficial in determining the potential target of iAMP21.
In summary, we further defined the CRA to a region of 1.57 Mb, located from 36.07 to 37.64 Mb (GRCh38) and identified RIPPLY3 as the most prominent gene affected in iAMP21-positive BCP-ALL. As this region is amplified in all (studied) iAMP21 cases, it might be involved in the development of leukaemia as a result of iAMP21. Furthermore, this region might be of benefit in accurate diagnosis of iAMP21 BCP-ALL.
No drugs specifically targeting the deregulated gene expression in iAMP21 have been developed yet. Further studies should focus on studying the link between RIPPLY3 and iAMP21 by performing functional in vitro studies. Identifying downstream pathways influenced by RIPPLY3 could benefit the development of more targeted treatment options of the high-risk iAMP21 subtype.
The data presented in the study are deposited in the Gene Expression Omnibus repository, accession number GSE87070 (gene expression) and GSE184692 (copy number).
Contribution: The project was conceived by JB and MB and conceptualized together with FH. Experimental and computational analyses were performed by FH, AB and AH. Clinical samples and data were provided by ES and GE. Data interpretation was performed by FH, JM, and MB. The manuscript was drafted by FH, JB and MB. All authors contributed to the article and approved the submitted version.
KWF kankerbestrijding grant KWF-10482, awarded to Dr. JB, funded the PhD position of FH. Stichting Kinderen Kankervrij grant KiKa-264, awarded to Dr. JB, funded the position of AH. Funding from Stichting Kinder Oncologisch Centrum Rotterdam, awarded to prof. MB, funded remaining personnel costs.
We thank Gu et al. (24) for making the supplementary SNP data of 34 iAMP21 cases publicly available. We thank the St. Jude Children’s Research Hospital for making the gene expression data of paediatric ALL cases publicly available.
The authors declare that the research was conducted in the absence of any commercial or financial relationships that could be construed as a potential conflict of interest.
All claims expressed in this article are solely those of the authors and do not necessarily represent those of their affiliated organizations, or those of the publisher, the editors and the reviewers. Any product that may be evaluated in this article, or claim that may be made by its manufacturer, is not guaranteed or endorsed by the publisher.
The Supplementary Material for this article can be found online at: https://www.frontiersin.org/articles/10.3389/fonc.2023.1128560/full#supplementary-material
1. Harewood L, Robinson H, Harris R, Jabbar Al-Obaidi M, Jalali GR, Martineau M, et al. Amplification of AML1 on a duplicated chromosome 21 in acute lymphoblastic leukemia: A study of 20 cases. Leukemia (2003) 17(3):547–53. doi: 10.1038/sj.leu.2402849
2. Soulier J, Trakhtenbrot L, Najfeld V, Lipton JM, Mathew S, Avet-Loiseau H, et al. Amplification of band q22 of chromosome 21, including AML1, in older children with acute lymphoblastic leukemia: An emerging molecular cytogenetic subgroup. Leukemia (2003) 17(8):1679–82. doi: 10.1038/sj.leu.2403000
3. Wang S, He G. 2016 Revision to the WHO classification of acute lymphoblastic leukemia. J Transl Intern Med (2016) 4(4):147–9. doi: 10.1515/jtim-2016-0040
4. Rand V, Parker H, Russell LJ, Schwab C, Ensor H, Irving J, et al. Genomic characterization implicates iAMP21 as a likely primary genetic event in childhood b-cell precursor acute lymphoblastic leukemia. Blood (2011) 117(25):6848–55. doi: 10.1182/blood-2011-01-329961
5. Harrison CJ. Blood spotlight on iAMP21 acute lymphoblastic leukemia (ALL), a high-risk pediatric disease. Blood (2015) 125(9):1383–6. doi: 10.1182/blood-2014-08-569228
6. Yu C-H, Lin T-K, Jou S-T, Lin C-Y, Lin K-H, Lu M-Y, et al. MLPA and DNA index improve the molecular diagnosis of childhood b-cell acute lymphoblastic leukemia. Sci Rep (2020) 10(1):11501. doi: 10.1038/s41598-020-68311-9
7. Harrison CJ, Moorman AV, Schwab C, Carroll AJ, Raetz EA, Devidas M, et al. An international study of intrachromosomal amplification of chromosome 21 (iAMP21): cytogenetic characterization and outcome. Leukemia (2014) 28(5):1015–21. doi: 10.1038/leu.2013.317
8. Heerema NA, Carroll AJ, Devidas M, Loh ML, Borowitz MJ, Gastier-Foster JM, et al. Intrachromosomal amplification of chromosome 21 is associated with inferior outcomes in children with acute lymphoblastic leukemia treated in contemporary standard-risk children’s oncology group studies: A report from the children’s oncology group. J Clin Oncol (2013) 31(27):3397–402. doi: 10.1200/JCO.2013.49.1308
9. Moorman AV, Richards SM, Robinson HM, Strefford JC, Gibson BES, Kinsey SE, et al. Brief report: Prognosis of children with acute lymphoblastic leukemia (ALL) and intrachromosomal amplification of chromosome 21 (iAMP21). Blood (2007) 109(6):2327–30. doi: 10.1182/blood-2006-08-040436
10. Moorman AV, Robinson H, Schwab C, Richards SM, Hancock J, Mitchell CD, et al. Risk-directed treatment intensification significantly reduces the risk of relapse among children and adolescents with acute lymphoblastic leukemia and intrachromosomal amplification of chromosome 21: A comparison of the MRC ALL97/99 and UKALL2003 trials. J Clin Oncol (2013) 31(27):3389–96. doi: 10.1200/JCO.2013.48.9377
11. Ryan SL, Matheson E, Grossmann V, Sinclair P, Bashton M, Schwab C, et al. The role of the RAS pathway in iAMP21-ALL. Leukemia (2016) 30(9):1824–31. doi: 10.1038/leu.2016.80
12. Sinclair PB, Ryan S, Bashton M, Hollern S, Hanna R, Case M, et al. SH2B3 inactivation through CN-LOH 12q is uniquely associated with b-cell precursor ALL with iAMP21 or other chromosome 21 gain. Leukemia (2019) 33(8):1881–94. doi: 10.1038/s41375-019-0412-1
13. Robinson HM, Harrison CJ, Moorman AV, Chudoba I, Strefford JC. Intrachromosomal amplification of chromosome 21 (iAMP21) may arise from a breakage-fusion-bridge cycle. Genes Chromosomes Cancer (2007) 46(4):318–26. doi: 10.1002/gcc.20412
14. Sinclair PB, Parker H, An Q, Rand V, Ensor H, Harrison CJ, et al. Analysis of a breakpoint cluster reveals insight into the mechanism of intrachromosomal amplification in a lymphoid malignancy. Hum Mol Genet (2011) 20(13):2591–602. doi: 10.1093/hmg/ddr159
15. Li Y, Schwab C, Ryan S, Papaemmanuil E, Robinson HM, Jacobs P, et al. Constitutional and somatic rearrangement of chromosome 21 in acute lymphoblastic leukaemia. Nature (2014) 508(7494):98–102. doi: 10.1038/nature13115
16. Sinclair PB, Blair HH, Ryan SL, Buechler L, Cheng J, Clayton J, et al. Dynamic clonal progression in xenografts of acute lymphoblastic leukemia with intrachromosomal amplification of chromosome 21. Haematologica (2018) 103(4):634–44. doi: 10.3324/haematol.2017.172304
17. Öfverholm II, Zachariadis V, Taylan F, Marincevic-Zuniga Y, Tran AN, Saft L, et al. Overexpression of chromatin remodeling and tyrosine kinase genes in iAMP21-positive acute lymphoblastic leukemia. Leuk Lymphoma (2020) 61(3):604–13. doi: 10.1080/10428194.2019.1678153
18. Kamps WA, van der Pal-de Bruin KM, Veerman AJP, Fiocco M, Bierings M, Pieters R. Long-term results of Dutch childhood oncology group studies for children with acute lymphoblastic leukemia from 1984 to 2004. Leukemia (2010) 24(2):309–19. doi: 10.1038/leu.2009.258
19. Escherich G, Horstmann MA, Zimmermann M, Janka-Schaub GE, COALL study group. Cooperative study group for childhood acute lymphoblastic leukaemia (COALL): long-term results of trials 82,85,89,92 and 97. Leukemia (2010) 24(2):298–308. doi: 10.1038/leu.2009.249
20. Den Boer ML, Harms DO, Pieters R, Kazemier KM, Gobel U, Körholz D, et al. Patient stratification based on prednisolone-vincristine-asparaginase resistance profiles in children with acute lymphoblastic leukemia. J Clin Oncol (2003) 21(17):3262–8. doi: 10.1200/JCO.2003.11.031
21. Boer JM, Steeghs EMP, Marchante JRM, Boeree A, Beaudoin JJ, Beverloo HB, et al. Tyrosine kinase fusion genes in pediatric BCR-ABL1-like acute lymphoblastic leukemia. Oncotarget (2017) 8(3):4618–28. doi: 10.18632/oncotarget.13492
22. van de Wiel MA, Brosens R, Eilers PHC, Kumps C, Meijer GA, Menten B, et al. Smoothing waves in array CGH tumor profiles. Bioinformatics (2009) 25(9):1099–104. doi: 10.1093/bioinformatics/btp132
23. van Houte BPP, Binsl TW, Hettling H, Pirovano W, Heringa J. CGHnormaliter: An iterative strategy to enhance normalization of array CGH data with imbalanced aberrations. BMC Genomics (2009) 10(June 2014):401. doi: 10.1186/1471-2164-10-401
24. Gu Z, Churchman ML, Roberts KG, Moore I, Zhou X, Nakitandwe J, et al. PAX5-driven subtypes of b-progenitor acute lymphoblastic leukemia. Nat Genet (2019) 51(2):296–307. doi: 10.1038/s41588-018-0315-5
25. van der Veer A, Waanders E, Pieters R, Willemse ME, Van Reijmersdal SV, Russell LJ, et al. Independent prognostic value of BCR-ABL1-like signature and IKZF1 deletion, but not high CRLF2 expression, in children with b-cell precursor ALL. Blood (2013) 122(15):2622–9. doi: 10.1182/blood-2012-10-462358
26. Polak R, Bierings MB, van der Leije CS, Sanders MA, Roovers O, Marchante JRM, et al. Autophagy inhibition as a potential future targeted therapy for ETV6-RUNX1-driven b-cell precursor acute lymphoblastic leukemia. Haematologica (2019) 104(4):738–48. doi: 10.3324/haematol.2018.193631
27. Huber W, von Heydebreck A, Sültmann H, Poustka A, Vingron M. Variance stabilization applied to microarray data calibration and to the quantification of differential expression. Bioinformatics (2002) 18(SUPPL. 1):S96–104. doi: 10.1093/bioinformatics/18.suppl_1.S96
28. Johnson WE, Li C, Rabinovic A. Adjusting batch effects in microarray expression data using empirical bayes methods. Biostatistics (2007) 8(1):118–27. doi: 10.1093/biostatistics/kxj037
29. Smyth GK. Limma: Linear models for microarray data. In: Bioinformatics and computational biology solutions using r and bioconductor. New York: Springer-Verlag (2005). p. 397–420.
30. Goeman JJ, van de Geer SA, de Kort F, van Houwelingen HC. A global test for groups of genes: testing association with a clinical outcome. Bioinformatics (2004) 20(1):93–9. doi: 10.1093/bioinformatics/btg382
31. Den Boer ML, van Slegtenhorst M, De Menezes RX, Cheok MH, Buijs-Gladdines JGCAM, Peters STCJM, et al. A subtype of childhood acute lymphoblastic leukaemia with poor treatment outcome: a genome-wide classification study. Lancet Oncol (2009) 10(2):125–34. doi: 10.1016/S1470-2045(08)70339-5
32. Boer JM, Marchante JRM, Evans WE, Horstmann MA, Escherich G, Pieters R, et al. BCR-ABL1-like cases in pediatric acute lymphoblastic leukemia: A comparison between DCOG/Erasmus MC and COG/St. Jude signatures. Haematologica (2015) 100(9):e354–7. doi: 10.3324/haematol.2015.124941
33. Shibuya K, Kudoh J, Minoshima S, Kawasaki K, Asakawa S, Shimizu N. Isolation of two novel genes, DSCR5 and DSCR6, from down syndrome critical region on human chromosome 21q22.2. Biochem Biophys Res Commun (2000) 271(3):693–8. doi: 10.1006/bbrc.2000.2685
34. Janesick A, Shiotsugu J, Taketani M, Blumberg B. RIPPLY3 is a retinoic acid-inducible repressor required for setting the borders of the pre-placodal ectoderm. Development (2012) 139(6):1213–24. doi: 10.1242/dev.071456
35. Li HY, Grifone R, Saquet A, Carron C, Shi DL. The xenopus homologue of down syndrome critical region protein 6 drives dorsoanterior gene expression and embryonic axis formation by antagonising polycomb group proteins. Dev (2013) 140(24):4903–13. doi: 10.1242/dev.098319
36. Okubo T, Kawamura A, Takahashi J, Yagi H, Morishima M, Matsuoka R, et al. Ripply3, a Tbx1 repressor, is required for development of the pharyngeal apparatus and its derivatives in mice. Development (2011) 138(2):339–48. doi: 10.1242/dev.054056
37. Loreti M, Shi D-L, Carron C. The regulatory proteins DSCR6 and Ezh2 oppositely regulate Stat3 transcriptional activity in mesoderm patterning during xenopus development. J Biol Chem (2020) 295(9):2724–35. doi: 10.1074/jbc.RA119.010719
38. Baughn LB, Meredith MM, Oseth L, Smolarek TA, Hirsch B. SH2B3 aberrations enriched in iAMP21 b lymphoblastic leukemia. Cancer Genet (2018) 226–227:30–5. doi: 10.1016/j.cancergen.2018.05.004
39. Hasle H, Clemmensen IH, Mikkelsen M. Risks of leukaemia and solid tumours in individuals with down’s syndrome. Lancet (2000) 355(9199):165–9. doi: 10.1016/S0140-6736(99)05264-2
40. Olson LE, Richtsmeier JT, Leszl J, Reeves RH. A chromosome 21 critical region does not cause specific down syndrome phenotypes. Science (2004) 306(5696):687–90. doi: 10.1126/science.1098992
41. Lane AA, Chapuy B, Lin CY, Tivey T, Li H, Townsend EC, et al. Triplication of a 21q22 region contributes to b cell transformation through HMGN1 overexpression and loss of histone H3 Lys27 trimethylation. Nat Genet (2014) 46(6):618–23. doi: 10.1038/ng.2949
42. Mowery CT, Reyes JM, Cabal-Hierro L, Higby KJ, Karlin KL, Wang JH, et al. Trisomy of a down syndrome critical region globally amplifies transcription via HMGN1 overexpression. Cell Rep (2018) 25(7):1898–1911.e5. doi: 10.1016/j.celrep.2018.10.061
43. Tsuchiya KD, Davis B, Gardner RA. Is intrachromosomal amplification of chromosome 21 (iAMP21) always intrachromosomal? Cancer Genet (2017) 218–219:10–4. doi: 10.1016/j.cancergen.2017.08.005
44. Johnson RC, Weinberg OK, Cascio MJ, Dahl GV, Mitton BA, Silverman LB, et al. Cytogenetic variation of b-lymphoblastic leukemia with intrachromosomal amplification of chromosome 21 (iAMP21): A multi-institutional series review. Am J Clin Pathol (2015) 144(1):103–12. doi: 10.1309/AJCPLUYF11HQBYRB
45. Schwab CJ, Murdy D, Butler E, Enshaei A, Winterman E, Cranston RE, et al. Genetic characterisation of childhood b-other-acute lymphoblastic leukaemia in UK patients by fluorescence in situ hybridisation and multiplex ligation-dependent probe amplification. Br J Haematol (2022) 196(3):753–63. doi: 10.1111/bjh.17869
46. Wrona E, Braun M, Pastorczak A, Taha J, Lejman M, Kowalczyk J, et al. MLPA as a complementary tool for diagnosis of chromosome 21 aberrations in childhood BCP-ALL. J Appl Genet (2019) 60(3–4):347–55. doi: 10.1007/s13353-019-00509-8
Keywords: intrachromosomal amplification of chromosome 21 (iAMP21), peadiatric, acute lymphoblastic leukaemia, genomics, RIPPLY3
Citation: Hormann FM, Hoogkamer AQ, Boeree A, Sonneveld E, Escherich G, den Boer ML and Boer JM (2023) Integrating copy number data of 64 iAMP21 BCP-ALL patients narrows the common region of amplification to 1.57 Mb. Front. Oncol. 13:1128560. doi: 10.3389/fonc.2023.1128560
Received: 20 December 2022; Accepted: 10 February 2023;
Published: 23 February 2023.
Edited by:
Augusto Rojas-Martinez, Tecnológico de Monterrey, MexicoReviewed by:
Luca Lo Nigro, Azienda Ospedaliero Universitaria Policlinico - San Marco, ItalyCopyright © 2023 Hormann, Hoogkamer, Boeree, Sonneveld, Escherich, den Boer and Boer. This is an open-access article distributed under the terms of the Creative Commons Attribution License (CC BY). The use, distribution or reproduction in other forums is permitted, provided the original author(s) and the copyright owner(s) are credited and that the original publication in this journal is cited, in accordance with accepted academic practice. No use, distribution or reproduction is permitted which does not comply with these terms.
*Correspondence: Judith M. Boer, ai5tLmJvZXItMjBAcHJpbnNlc21heGltYWNlbnRydW0ubmw=
Disclaimer: All claims expressed in this article are solely those of the authors and do not necessarily represent those of their affiliated organizations, or those of the publisher, the editors and the reviewers. Any product that may be evaluated in this article or claim that may be made by its manufacturer is not guaranteed or endorsed by the publisher.
Research integrity at Frontiers
Learn more about the work of our research integrity team to safeguard the quality of each article we publish.