
94% of researchers rate our articles as excellent or good
Learn more about the work of our research integrity team to safeguard the quality of each article we publish.
Find out more
ORIGINAL RESEARCH article
Front. Oncol. , 01 May 2023
Sec. Cancer Imaging and Image-directed Interventions
Volume 13 - 2023 | https://doi.org/10.3389/fonc.2023.1124069
 Chutong He1†
 Wanli Zhang1†
 Yue Zhao2
 Jiamin Li1
 Ye Wang1
 Wang Yao1
 Nianhua Wang1
 Wenshuang Ding3
 Xinhua Wei1
 Ruimeng Yang1*
 Xinqing Jiang1*
Objective: To investigate the predictive value of contrast-enhanced computed tomography (CECT) imaging features and clinical factors in identifying the macrotrabecular-massive (MTM) subtype of hepatocellular carcinoma (HCC) preoperatively.
Methods: This retrospective study included 101 consecutive patients with pathology-proven HCC (35 MTM subtype vs. 66 non-MTM subtype) who underwent liver surgery and preoperative CECT scans from January 2017 to November 2021. The imaging features were evaluated by two board-certified abdominal radiologists independently. The clinical characteristics and imaging findings were compared between the MTM and non-MTM subtypes. Univariate and multivariate logistic regression analyses were performed to investigate the association of clinical-radiological variables and MTM-HCCs and develop a predictive model. Subgroup analysis was also performed in BCLC 0-A stage patients. Receiver operating characteristic (ROC) curves analysis was used to determine the optimal cutoff values and the area under the curve (AUC) was employed to evaluate predictive performance.
Results: Intratumor hypoenhancement (odds ratio [OR] = 2.724; 95% confidence interval [CI]: 1.033, 7.467; p = .045), tumors without enhancing capsules (OR = 3.274; 95% CI: 1.209, 9.755; p = .03), high serum alpha-fetoprotein (AFP) (≥ 228 ng/mL, OR = 4.101; 95% CI: 1.523, 11.722; p = .006) and high hemoglobin (≥ 130.5 g/L; OR = 3.943; 95% CI: 1.466, 11.710; p = .009) were independent predictors for MTM-HCCs. The clinical-radiologic (CR) model showed the best predictive performance, achieving an AUC of 0.793, sensitivity of 62.9% and specificity of 81.8%. The CR model also effectively identify MTM-HCCs in early-stage (BCLC 0-A stage) patients.
Conclusion: Combining CECT imaging features and clinical characteristics is an effective method for preoperatively identifying MTM-HCCs, even in early-stage patients. The CR model has high predictive performance and could potentially help guide decision-making regarding aggressive therapies in MTM-HCC patients.
Hepatocellular carcinoma (HCC) is the third leading cause of cancer-related deaths worldwide (1), and the prognosis remains poor, with a high recurrence rate of up to 80% within five years after surgical resection (2). Recently, a newly classified variant histological HCC subtype, namely macrotrabecular-massive HCC (MTM-HCC), was reported in 2019 WHO classification of digestive system tumors (3). Due to the gene and molecular-related proliferative activity (e.g., TP53 mutations, FGF19 amplification, and chromosomal instability), MTM-HCC represents an aggressive form of HCC that is associated with poor clinical prognosis, especially early recurrence (4–6). MTM-HCC is a promising candidate subtype for immunotherapy (7), which further implies the potential significance of identifying this HCC subtype for tailored clinical management.
As the gold standard for MTM-HCC diagnosis, pathological examinations (including surgical resection or biopsy) have limitations, such as invasiveness, complications, and sampling errors. Additionally, HCC is unique since it can be diagnosed by the typical radiologic features in high-risk patients according to the current HCC clinical guidelines, so histological evaluation is not mandatory for diagnosis (2, 8, 9). Thus, developing a noninvasive, robust method to preoperatively predict MTM-HCC is urgently needed. Recently, ultrasound (US), computed tomography (CT), and magnetic resonance image (MRI) have been applied for identifying MTM-HCC based on specific imaging features (10–16), particularly Gd-EOB-DTPA enhanced MRI (10, 11, 13, 15). Compared to MRI, contrast-enhanced CT (CECT) has the advantages of fast speed and low cost and is comparable to MRI for MTM-HCC prediction when using similar diagnostic criteria as MRI (16). However, the value of CECT in differentiating MTM from non-MTM HCC has not been fully determined.
In addition, most previous studies focused on imaging features without fully assessing the contribution of clinical factors to predictive performance. Clinical characteristics such as biochemical and tumor biomarkers also play an important role in HCC diagnosis and prognosis (17–22), with the MTM-HCC being associated with a higher Barcelona Clinical Liver Cancer (BCLC) stage, poor histologic differentiation and higher serum alpha-fetoprotein (AFP) (6, 23). Neutrophil-lymphocyte-ratio (NLR), platelet-lymphocyte-ratio (PLR), γ-glutamyl transpeptidase-lymphocyte ratio (GLR), and other lab results are also related to poor prognosis and therapeutic effects in HCC (17, 19, 20, 22). However, the contribution of clinical characteristics in identifying MTM-HCCs remains unclear. Therefore, this study investigated whether CECT-based image features or/and clinical data-derived predictive models could help preoperatively identify MTM-HCCs.
This retrospective study was approved by the Institutional Review Board of the Second Affiliated Hospital of South China University of Technology, and written informed consent was waived. The study protocol conforms to the ethical guidelines of the 1975 Declaration of Helsinki as reflected in a priori approval by the institution’s human research committee. Consecutive patients who underwent liver surgery and had postoperative pathological proven HCC from January 2017 to November 2021 were recruited. The exclusion criteria were 1) patients who underwent HCC treatment before surgery (n = 108); 2) patients who had other malignant tumors (n = 7); 3) patients who did not have a CECT scan before surgery or the interval between the surgery and CT scan was more than two weeks (n = 30); 4) lack of necessary clinical and laboratory data (n = 23). The study flowchart is displayed in Figure 1.
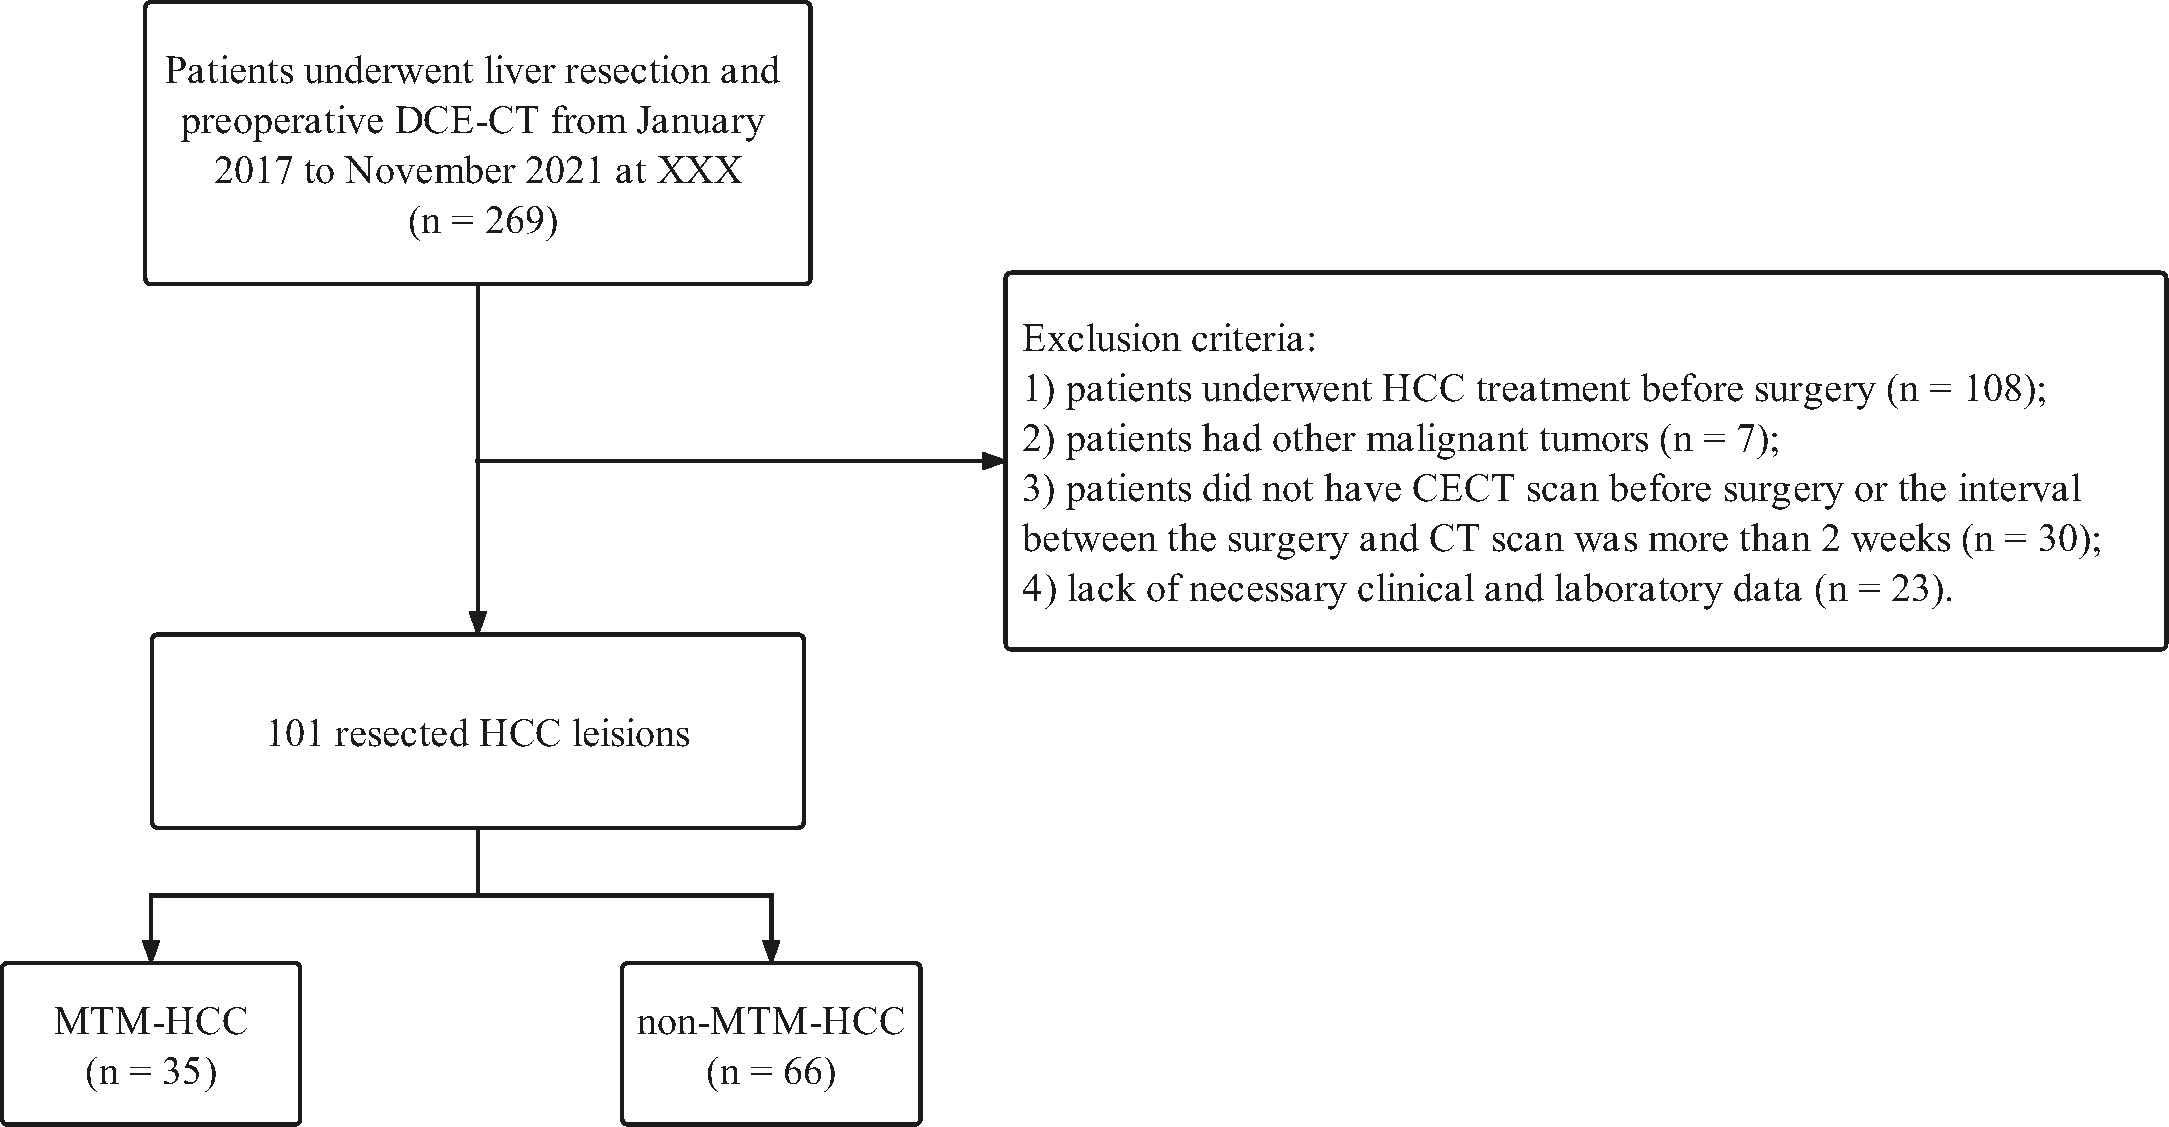
Figure 1 Flowchart of this retrospective study.
The basic demographic and clinical characteristics, including gender, age, background liver diseases, serum tumor biomarkers, liver function tests, and some common laboratory tests, were obtained from the clinical data system. The clinical characteristics were calculated according to the following formulae, and the ALBI values were categorized according to a previous study (22):
NLR = Neutrophils counts/Lymphocyte counts (1)
PLR = Platelet counts/Lymphocyte counts (2)
GLR = γ-Glutamyl transpeptidase/Lymphocyte counts (3)
ALBI = 0.66 × lg (TBIL) – 0.085 × ALB (4)
All histological slides were reviewed by a pathologist (W.S. Ding) with 16 years of experience blinded to the other clinical and imaging results. MTM-HCC was defined as tumors with a predominant (> 50%) macrotrabecular architecture pattern (trabeculae more than six cells thick) according to previously reported diagnostic criteria (6). Tumor differentiation was evaluated by the Edmondson-Steiner grading system, and microvascular invasion (MVI) and the Ki-67 index were also evaluated.
All dynamic acquisition of contrast-enhanced CT images were obtained prospectively using the following CT scanners: Siemens Somatom Drive, Siemens Somatom Force, Philips Brilliance 64, and Toshiba Aquilion One. The scanning parameters were as follows: tube voltage, 120 kVp; tube current, 200 mAs; reconstruction slice thickness, 5-7 mm. After unenhanced images were acquired, all patients were injected with intravenous nonionic iodinated contrast agent (iodipamide, 370 mg I/mL, Bracco) via the antecubital vein by mechanical power injectors based on their weight (2.0 mL/kg body weight, maximal dose of 180 mL), followed by a 20 mL saline flush. Four phases of contrast-enhanced CT (early arterial phase, late arterial phase, portal venous phase, and delayed phase) were obtained in 18-25 s, 35-40 s, 50-60 s, and 120-250 s, respectively, after contrast injection.
The CT images were reviewed independently by two radiologists (C.T. He and W.L. Zhang, with 3 and 5 years of experience in abdominal diagnostic imaging, respectively), who were blinded to the detailed clinical and pathological results. All image features were assessed according to the Liver Imaging Reporting and Data System (LI-RADS) version 2018 (24) and previous studies, including (a) LI-RADS major features, (b) LI-RADS ancillary features, and (c) non-LI-RADS features according to previous studies.
a. LI-RADS major features included i) non-rim arterial phase hyperenhancement (APHE), defined as a lesion with an arterial phase attenuation higher than the background liver without rim enhancement; ii) washout, defined as non-peripheral relative hypoattenuation of the lesion compared with background liver on the portal venous and delayed phases; and iii) enhancing capsule, defined as a smooth, uniform, sharp border around the tumor at the portal venous phase or delayed phase as an enhancing rim.
b. LI-RADS ancillary features included i) peritumoral hyperenhancement, defined as hyperenhancement adjacent to the tumor at the late arterial phase or portal venous phase; ii) non-smooth tumor margins, non-smooth tumor margins were assessed according to the morphologic appearance of the tumor at the delayed phase; iii) mosaic architecture, defined as a lesion with multiple compartments of different density and enhancement, separated by septations; iv) blood products in mass, intralesional or perilesional hemorrhage in the absence of biopsy or trauma; v) fat in mass, defined as the presence of macroscopic fat within the tumor; and vi) tumor in vein, defined as the presence of enhancing soft tissue in the portal venous and/or inferior vena cava, regardless of visualization of a parenchymal mass.
c. non-LI-RADS features included i) intratumor hypoenhancement and intratumor artery. Intratumor hypoenhancement was defined as lesion components without or mild enhancement (with lower attenuation than the adjacent normal liver parenchyma at the arterial phase) accounts for more than 20% of the whole tumor volume, including necrosis and severe ischemia. While ii) intratumor artery was defined as the presence of hepatic artery within the tumor.
The long and short axes of each tumor section were measured with the largest tumor diameter at the portal venous phase. Discrepancies were solved by consulting with a senior radiologist (R.M. Yang) with 15 years of experience in abdominal diagnostic radiology.
The prediction model was constructed using univariate and multivariate logistic regression. Variables with p <.10 in the univariate logistic regression analysis were included in the backward stepwise multivariate logistic regression. Three models were developed: (i) a model based on clinical characteristics (C model), (ii) a model based on radiological semantic features (R model), and (iii) a model combining both clinical characteristics and radiological semantic features (CR model). To dichotomize the continuous variables, receiver operating characteristic (ROC) curves were employed to determine the threshold by calculating the maximum Youden index.
Although MTM-HCCs appeared more frequent in higher BCLC stage, patients in BCLC 0-A stage might achieve more aggressive therapies earlier if their tumors presented as MTM-HCCs. The performance of the three models in BCLC 0-A stage were then evaluated.
Continuous variables are reported as means and standard deviations (SD) or medians and interquartiles. The categorical variables are presented as numbers and proportions. The normality of data distribution was assessed by the Shapiro-Wilk test. Comparisons between groups were performed using the following statistical tests: Student’s t-tests for normally distributed continuous variables, the Mann-Whitney U test for non-normally distributed continuous variables, and the Chi-square test for binary categorical variables. Receiver operating characteristic (ROC) curves were employed to determine the threshold of the continuous variables by calculating the maximum Youden index. Features with p <.10 in the univariate logistic regression analysis were then included in backward stepwise multivariate logistic regression to develop MTM-HCC predictive models. ROC curve and area under the curve (AUC) were then applied to evaluate the performance of the constructed models, followed by DeLong’s test to compare the AUC value between the two models. All statistical analyses were performed using the SPSS software (version 23.0, IBM Corp.) and R software (version 4.1.3, http://www.r-project.org). A p-value <.05 was considered statistically significant.
A total of 101 patients (80 males and 21 females) were included in this study, including 35 MTM-HCCs and 66 non-MTM-HCCs. The baseline characteristics, demographic and pathological data are summarized in Table 1. The mean age of the study cohort was 58.03 ± 13.91 years old (ranging from 24 to 86 years old). Among the 101 patients, 68 patients (67.3%) were HBV infected, 48 patients (47.5%) presented with microvascular invasion (MVI), and 49 patients (48.5%) had a Ki-67 index higher than 10%. The clinical characteristics are summarized in Table 2. MTM-HCC patients had a higher BCLC stage (p = .02), higher serum AFP levels (p = .02), and higher hemoglobin levels (p = .02).
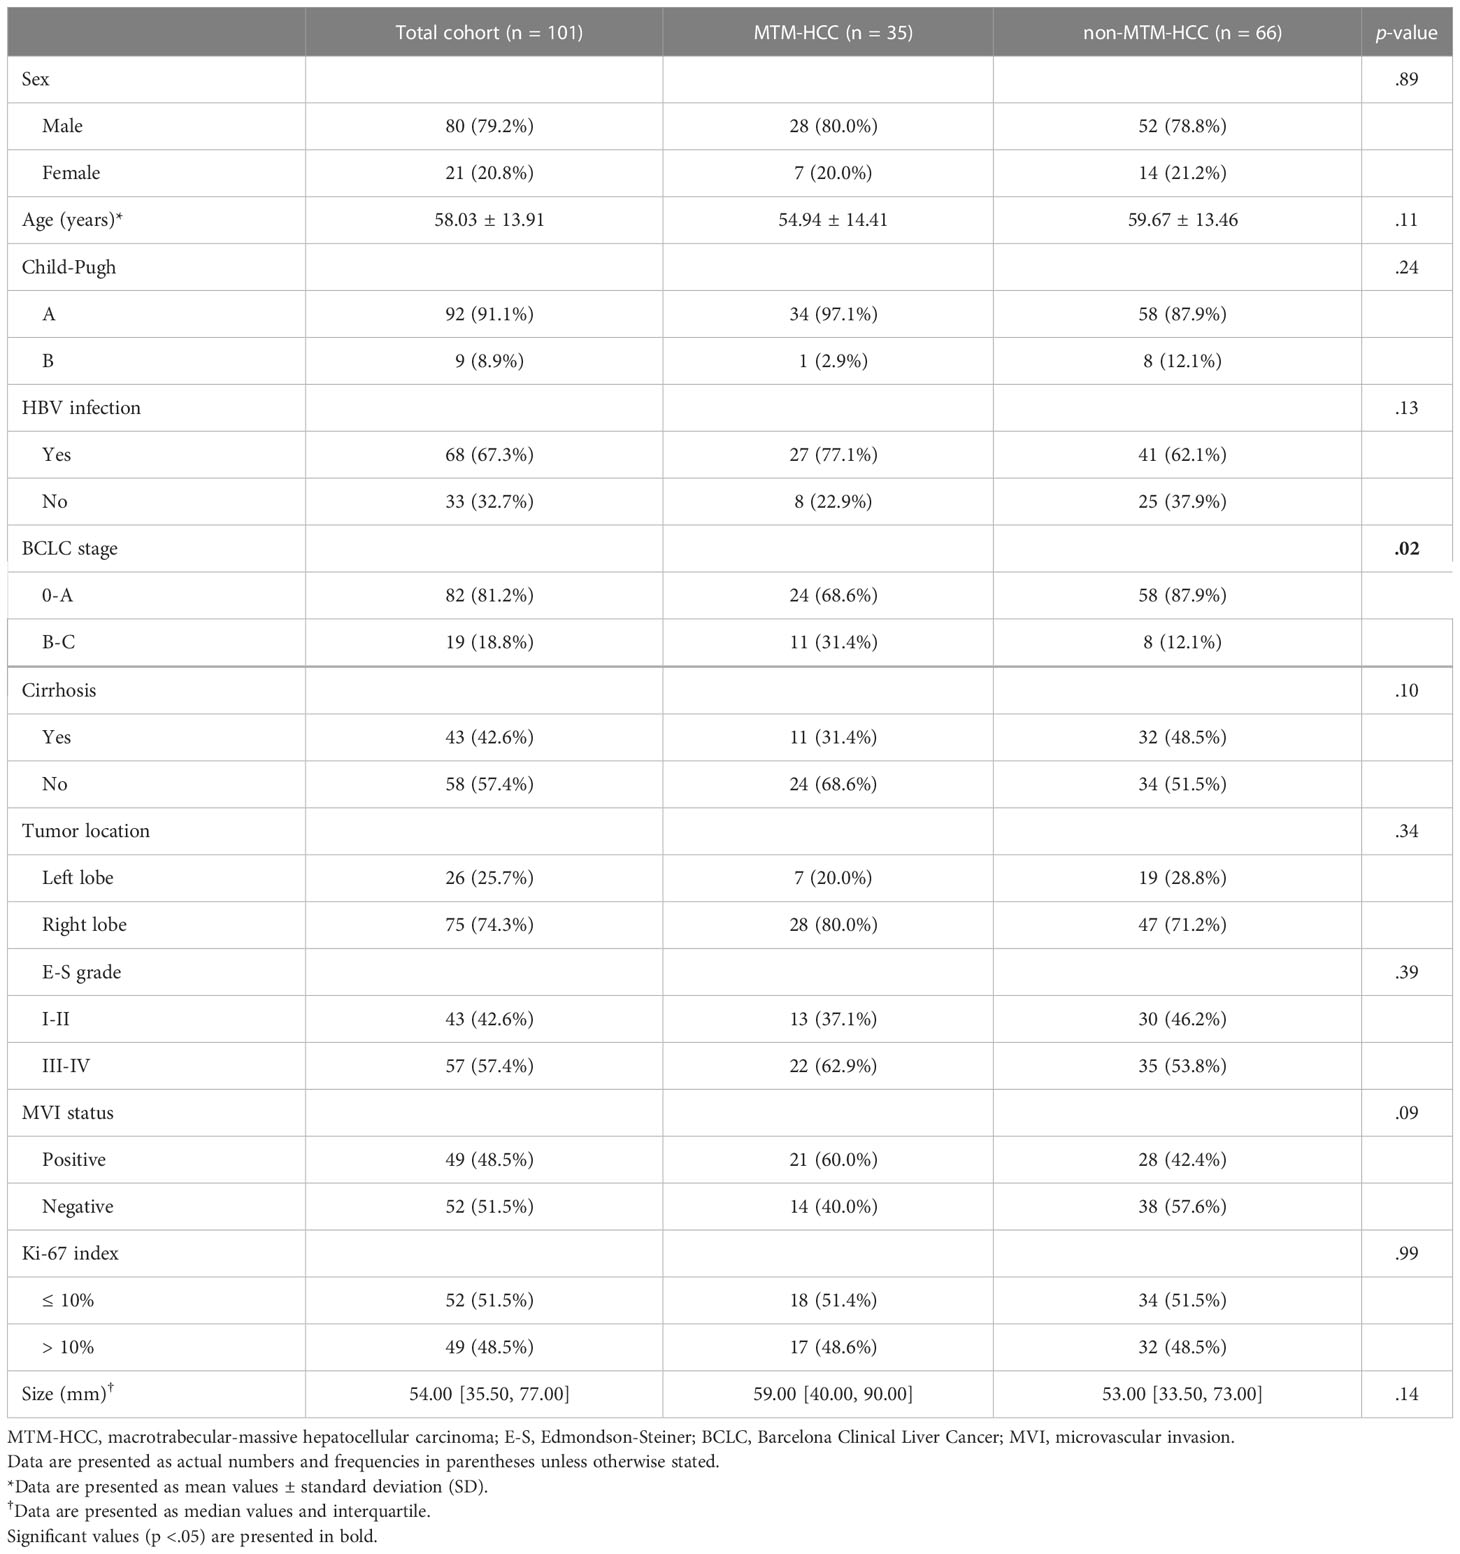
Table 1 Baseline demographic, clinical, and pathologic characteristics of MTM-HCCs and non-MTM-HCCs.
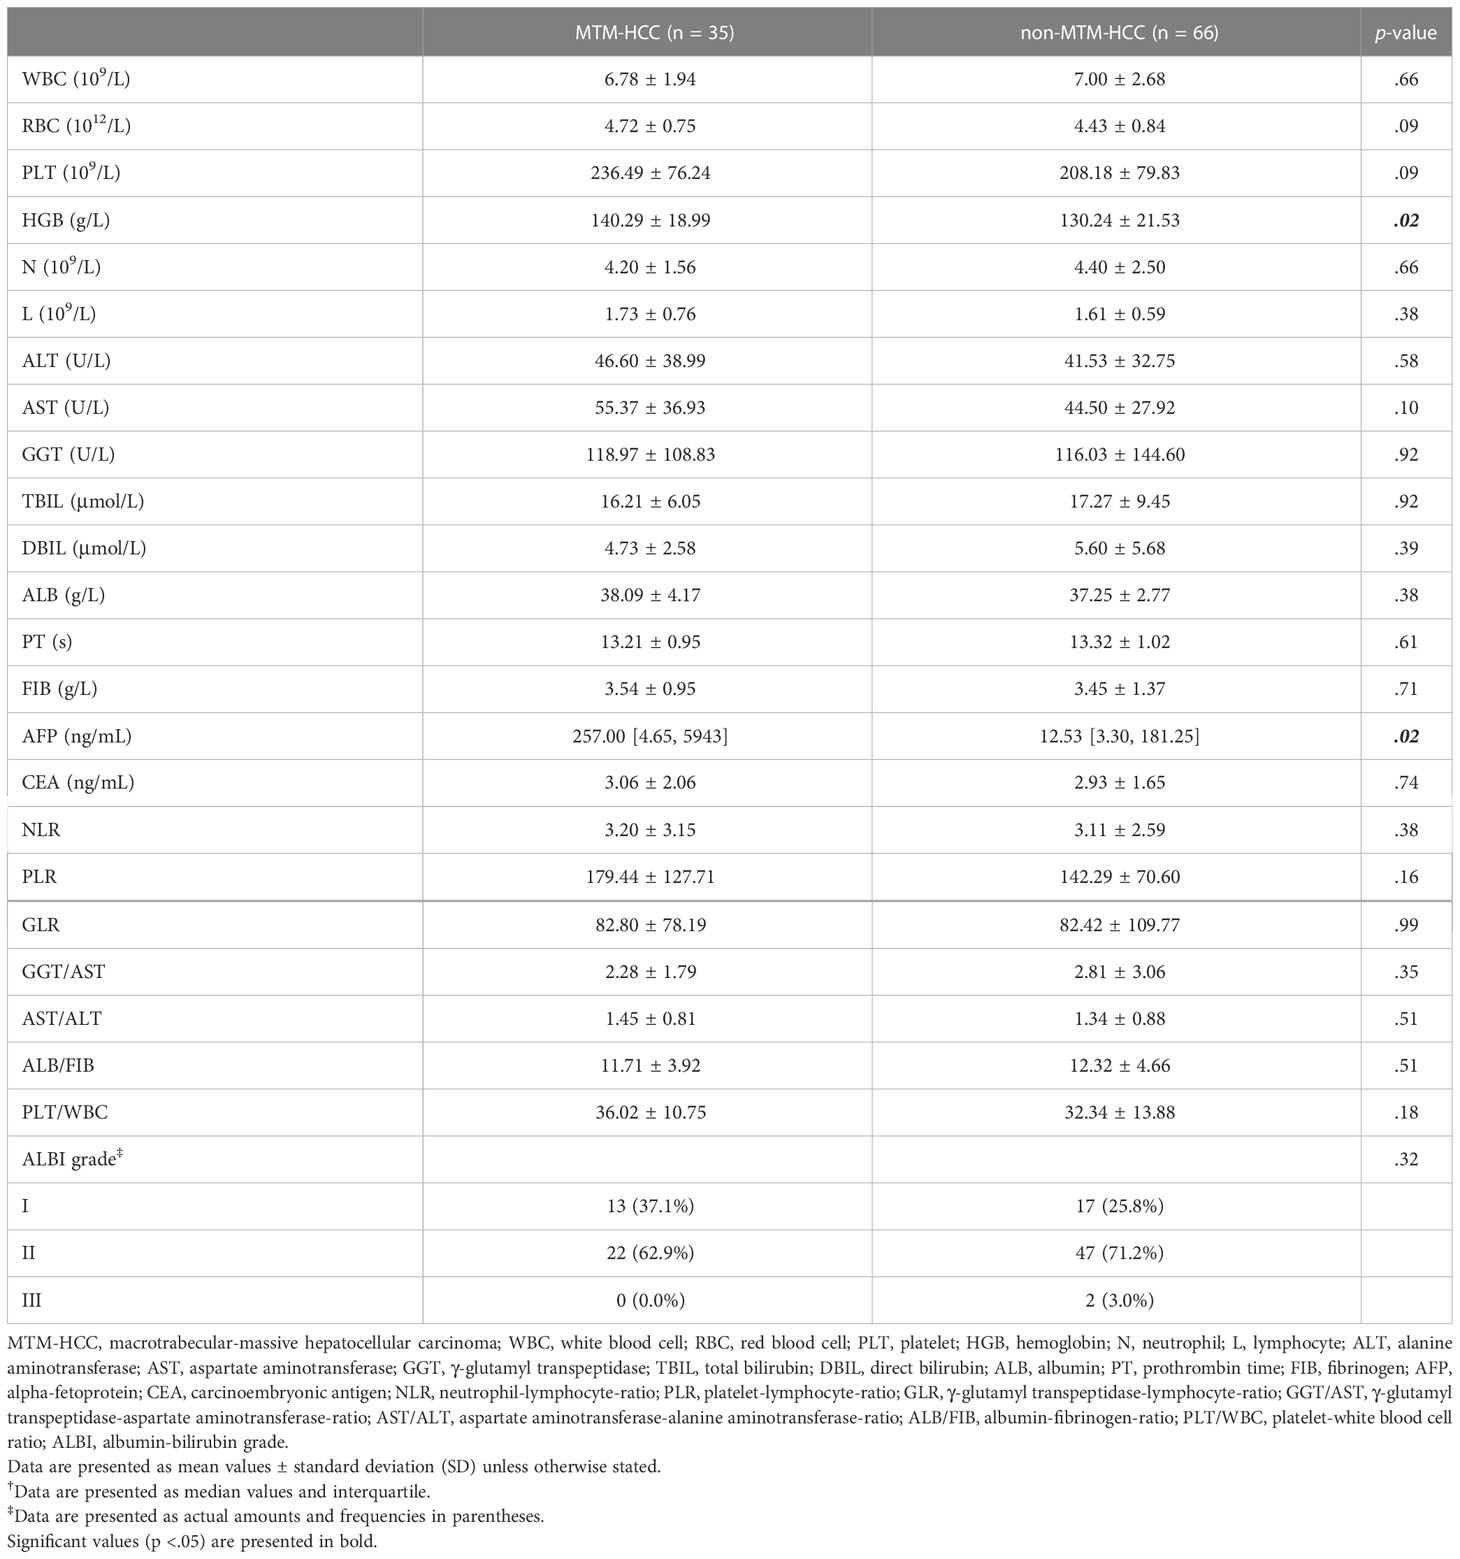
Table 2 Comparison of the laboratory characteristics of MTM-HCCs and non-MTM-HCCs.
Table 3 summarizes the imaging features of MTM-HCCs and non-MTM-HCCs, showing that MTM-HCCs had a higher probability of more than 20% intratumor hypoenhancement (p = .01). The other features were similar in both groups and representative images of MTM-HCCs and non-MTM-HCCs are illustrated in Figures 2, 3.
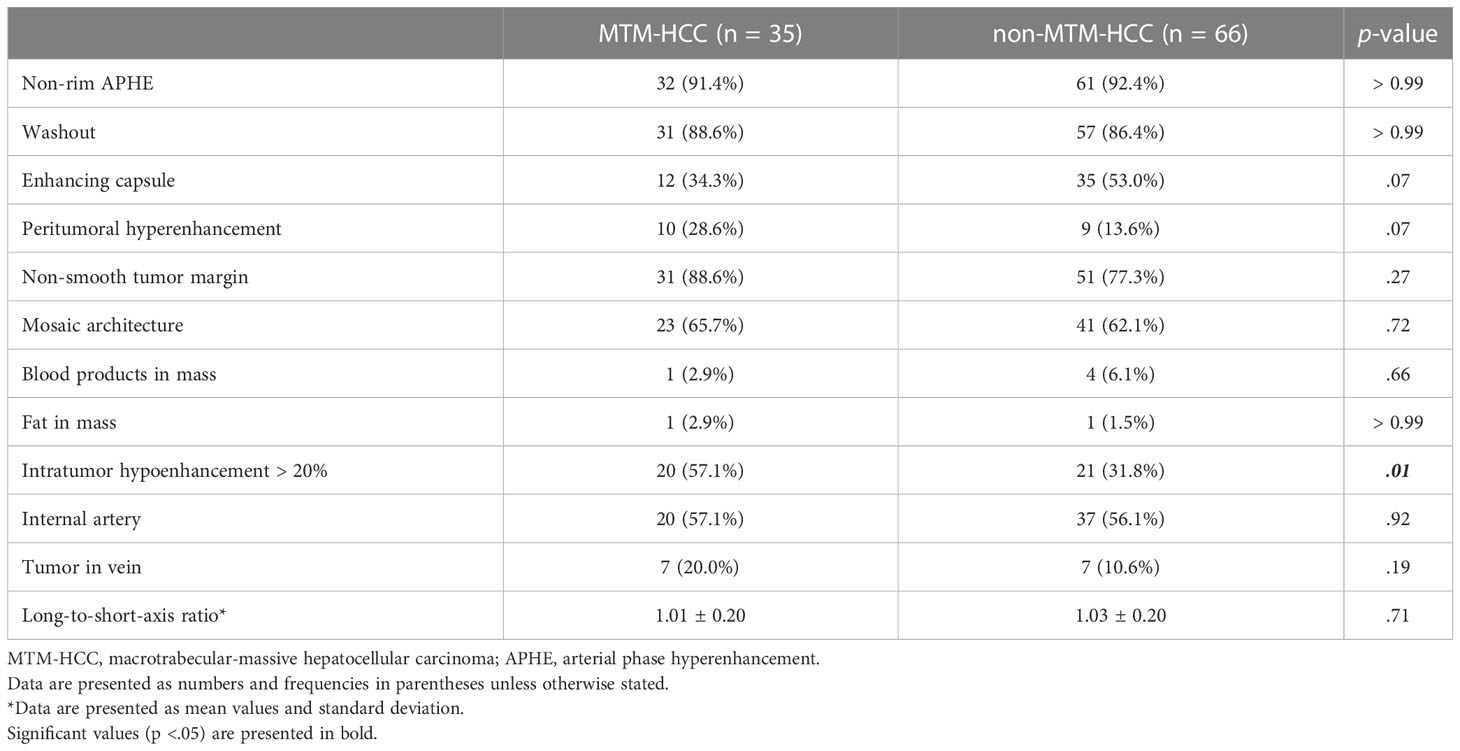
Table 3 Comparison of the CT imaging features of MTM-HCCs and non-MTM-HCCs.
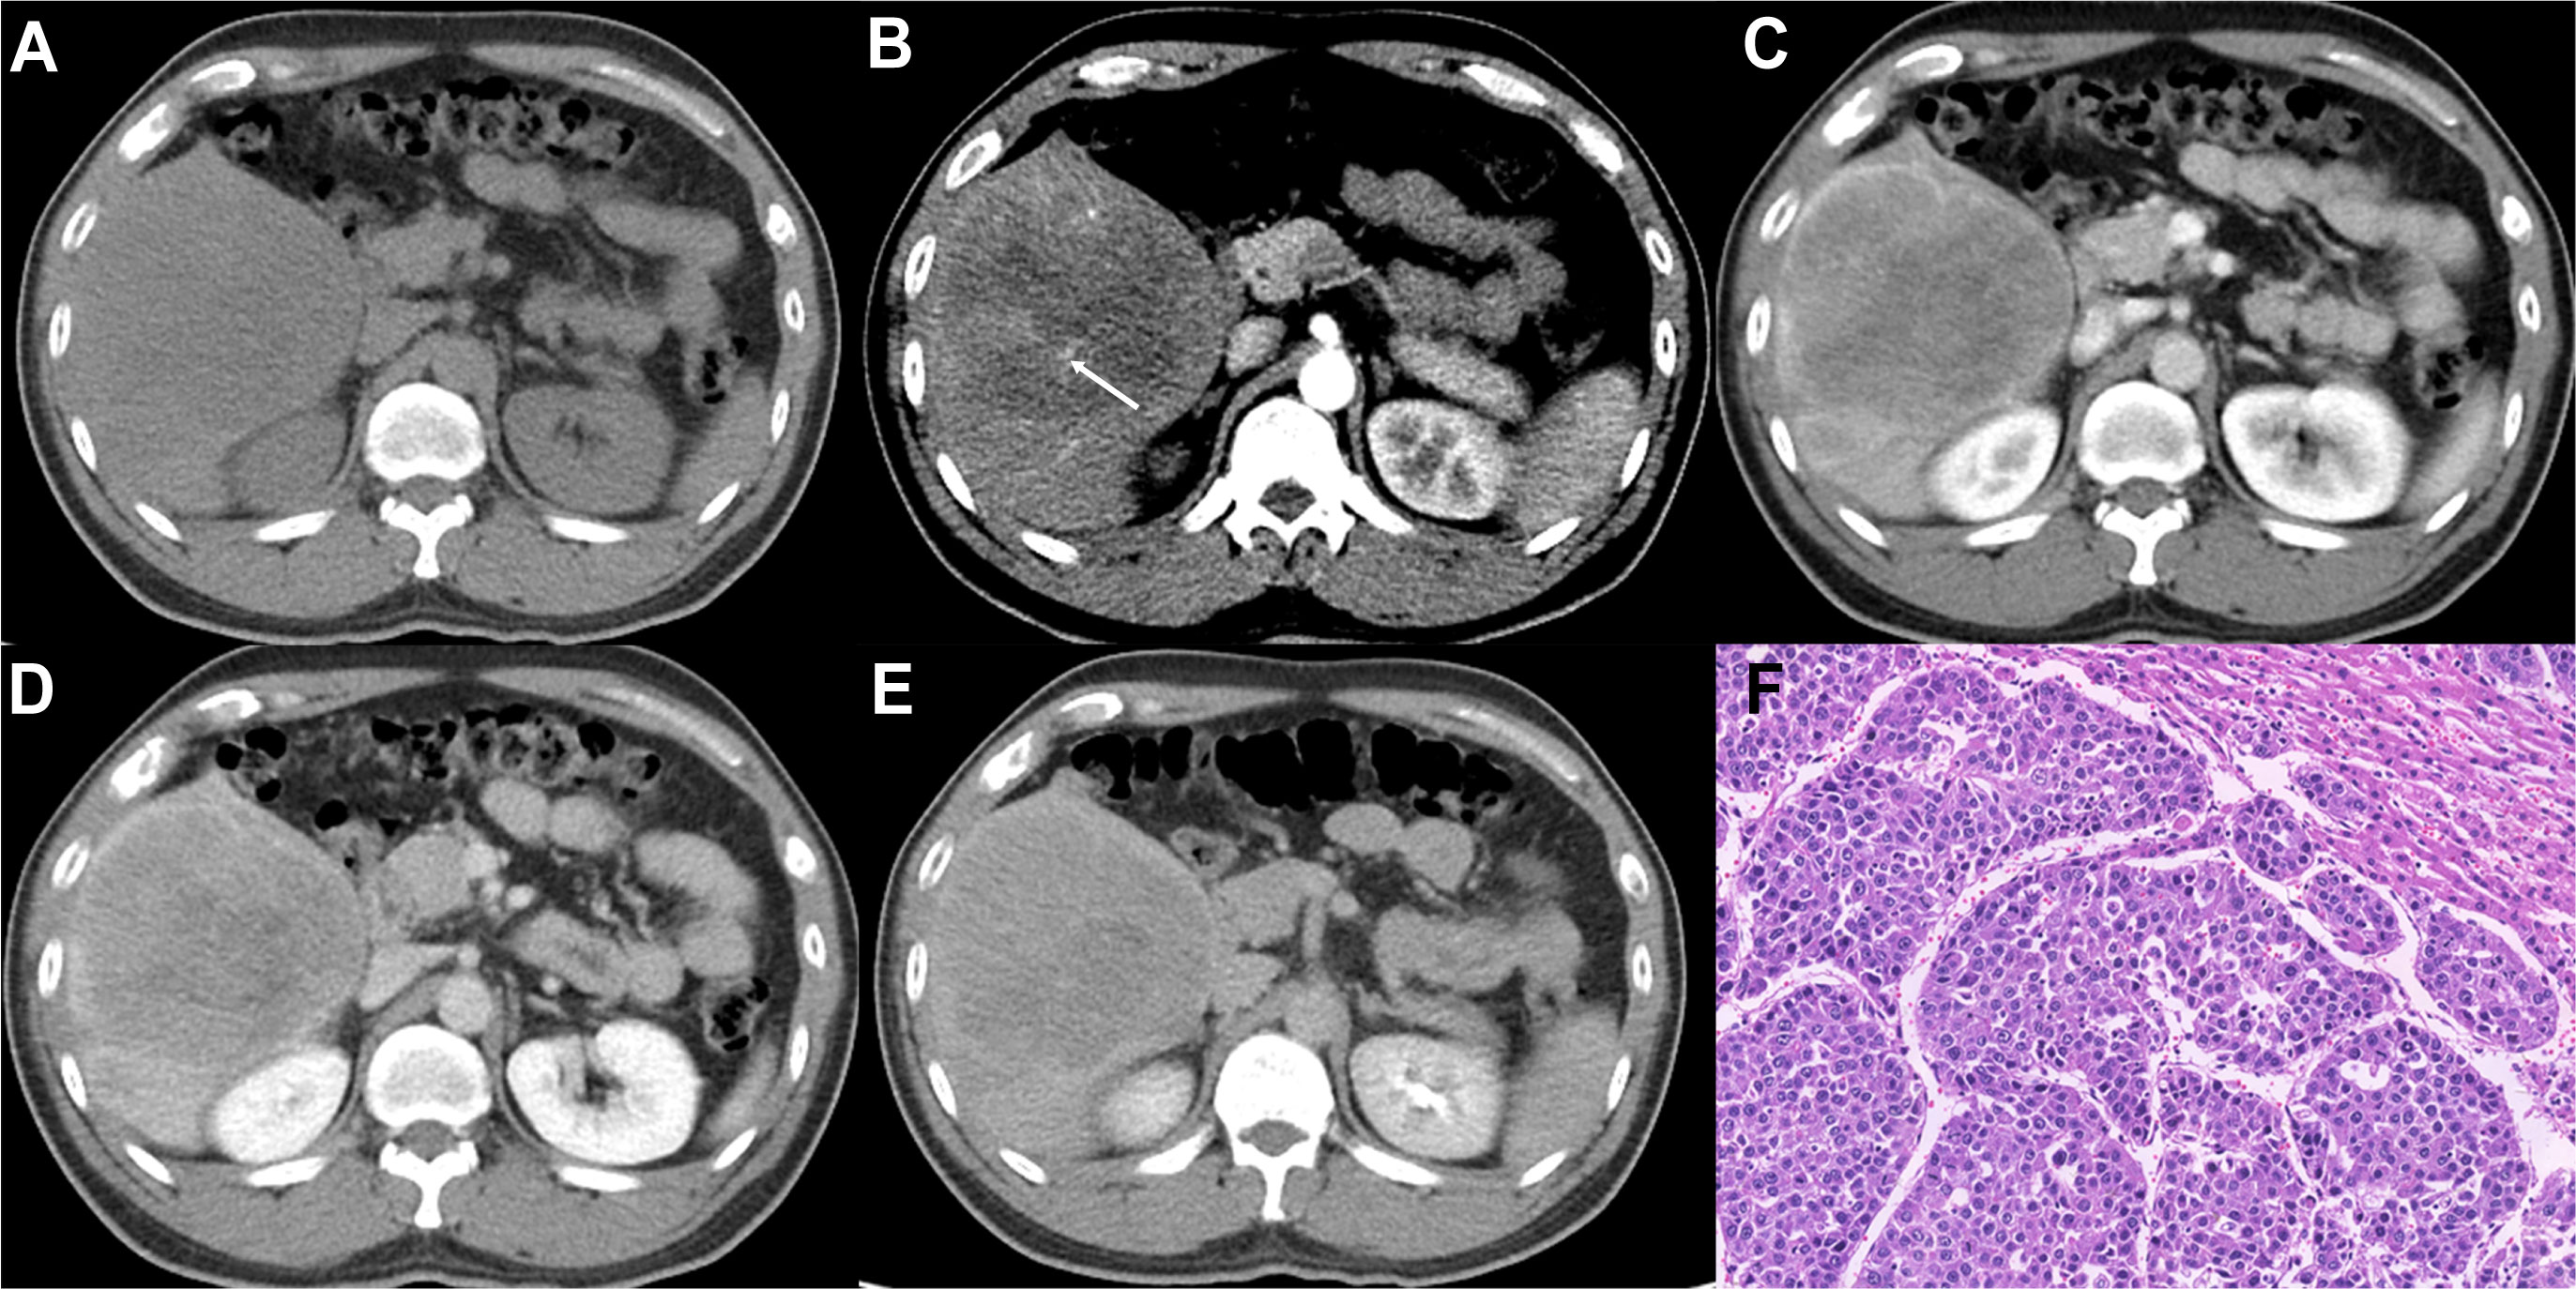
Figure 2 Imaging features and pathological information of a 37-year-old male MTM-HCC patient with an AFP level of 245,658 ng/mL and hemoglobin of 176 g/L. Multiphase axial contrast-enhanced CT (CECT) displays low attenuation in the unenhanced phase (A), the intratumor artery (white arrow) in the early arterial phase (B), rim hyperenhancement (APHE) and intratumor hypoenhancement in the late arterial phase (C), portal venous phase (D), and delay phase (E). Histopathology revealed the predominant thick trabecular structure diagnosed as MTM-HCC (F, original magnification, × 100; hematoxylin-eosin staining).
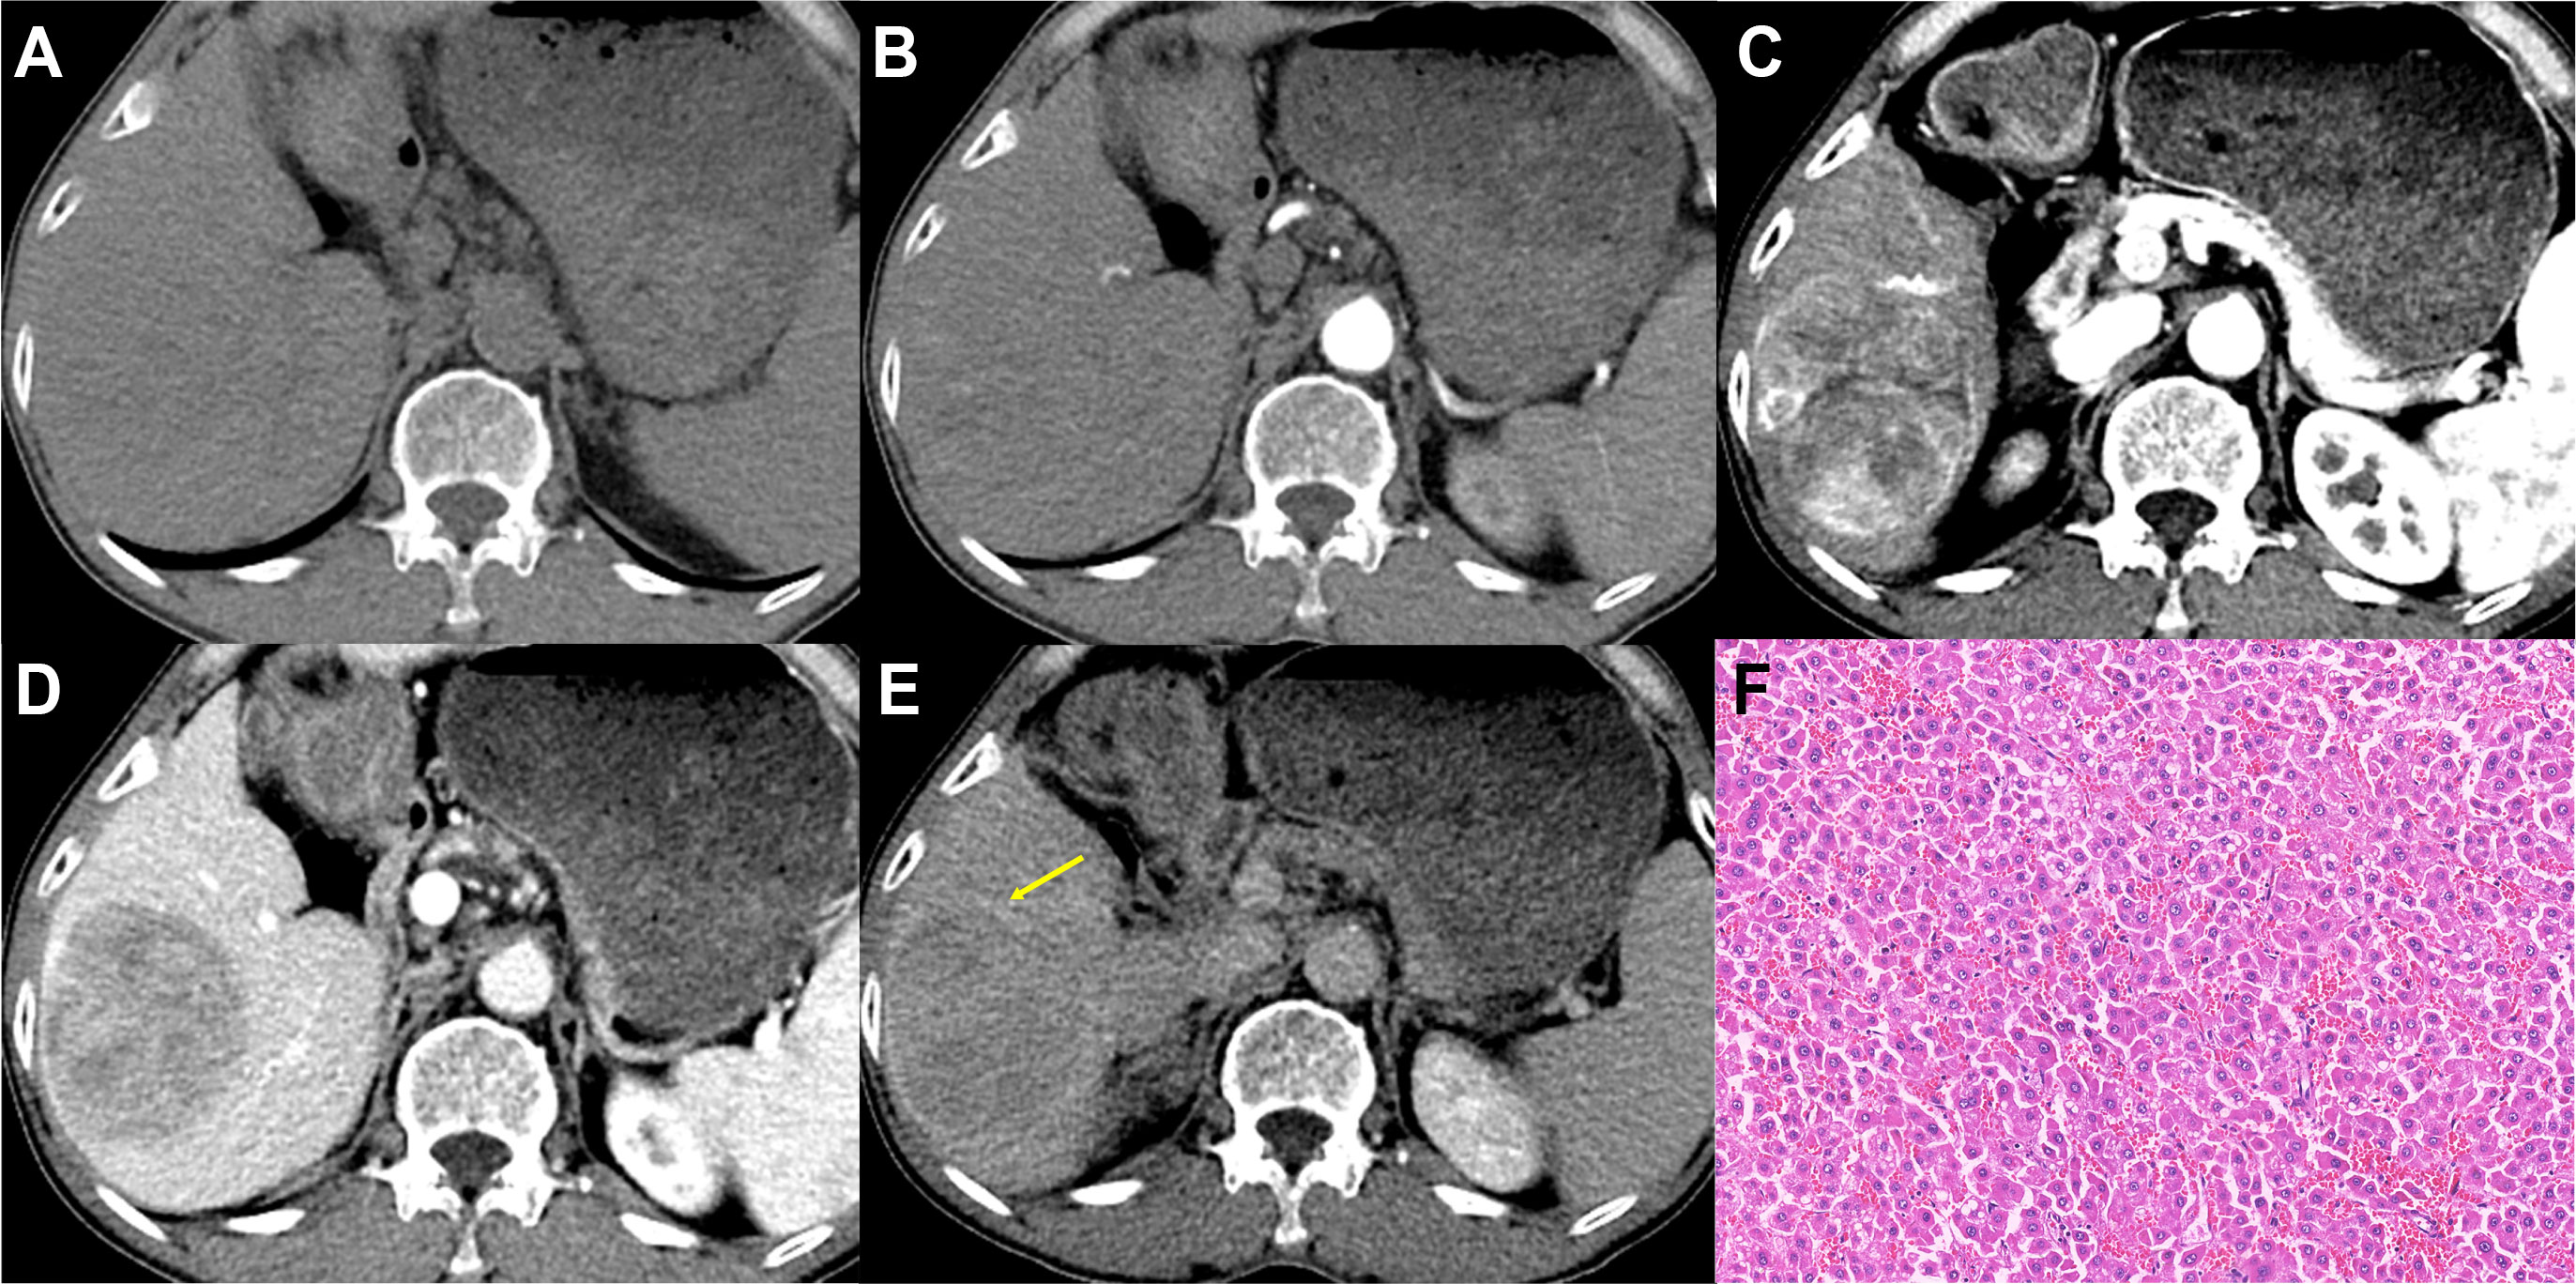
Figure 3 Imaging features and pathological information of a 62-year-old male non-MTM-HCC patient with an AFP level of 26.58 ng/mL and hemoglobin of 119 g/L. Multiphase axial contrast-enhanced CT (CECT) demonstrates iso-attenuation in the unenhanced phase (A) and early arterial phase (B). Strong and heterogeneous hyperenhancement (APHE) and little intratumor hypoenhancement are evident in the late arterial phase (C). Capsule enhancement (yellow arrow) and washout are demonstrated in the portal venous phase (D) and delay phase (E). Histopathology confirmed the diagnosis of non-MTM-HCC (F, original magnification, × 100; hematoxylin-eosin staining).
The ROC curves demonstrated the best cutoff values of 228 ng/mL AFP and 130.5 g/L hemoglobin level, and univariate and multivariate logistic regression (Table 4) indicated that serum AFP ≥ 228 ng/mL (OR = 4.101; 95% CI: 1.523, 11.722; p = .006), hemoglobin ≥ 130 g/L (OR = 3.943; 95% CI: 1.466, 11.710; p = .009), tumors without enhancing capsules (OR = 3.274; 95% CI: 1.209, 9.755; p = .03) and intratumor hypoenhancement (OR = 2.724; 95% CI: 1.033, 7.467; p = .045) were independent predictors for MTM-HCCs. The predictive performance of each independent predictor and the three models (C model, R model, and CR model) are illustrated in Table 5. Intratumor hypoenhancement and tumors without an enhancing capsule were identified 57.1% (20/35) and 65.7% (23/35) of MTM-HCCs. The R model had a higher specificity of 75.8%, whereas the C model had a much higher specificity of 87.8% but an unsatisfactory sensitivity of 45.7%. In comparison, the CR predictive model demonstrated a specificity of 81.8% and a sensitivity of 62.9%, with an AUC of 0.793 (95% CI: 0.701, 0.886). The diagnostic performance of the CR predictive model was significantly improved compared to the R (p = .03) and C models (p = .03) according to DeLong’s tests, but there was no significant difference between the CR models with and without HGB (p = .18). The ROC curves of each model are displayed in Figure 4.
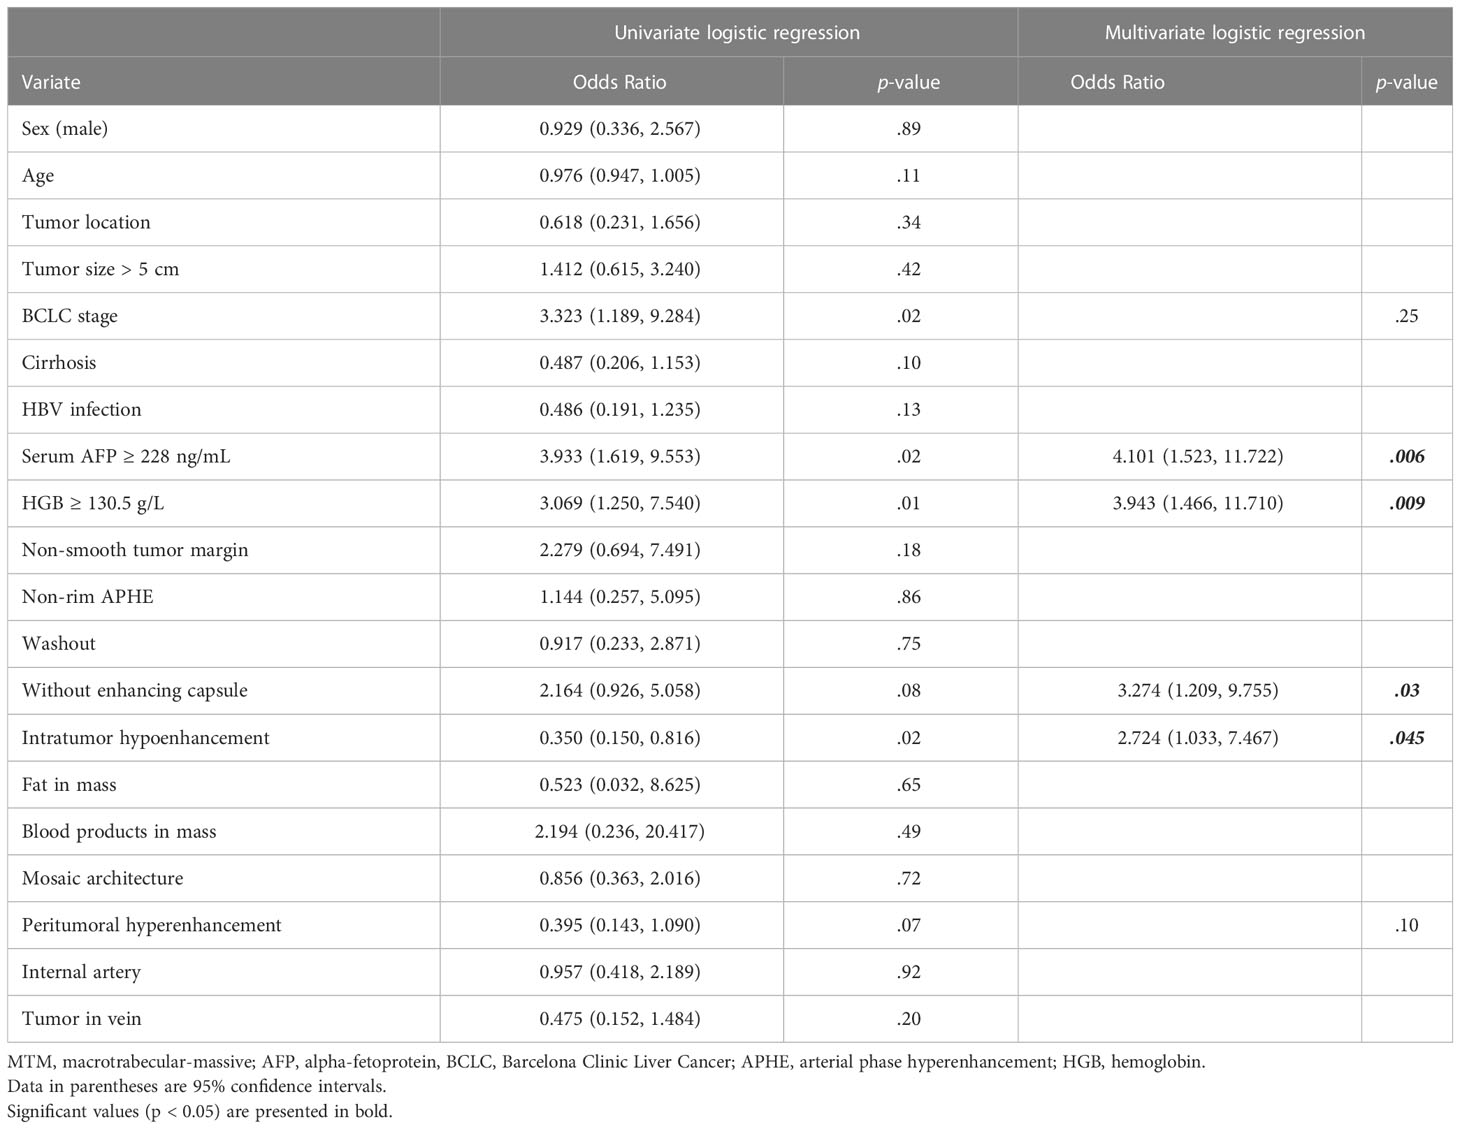
Table 4 Univariate and multivariate analyses of clinical and imaging features for MTM-HCCs.
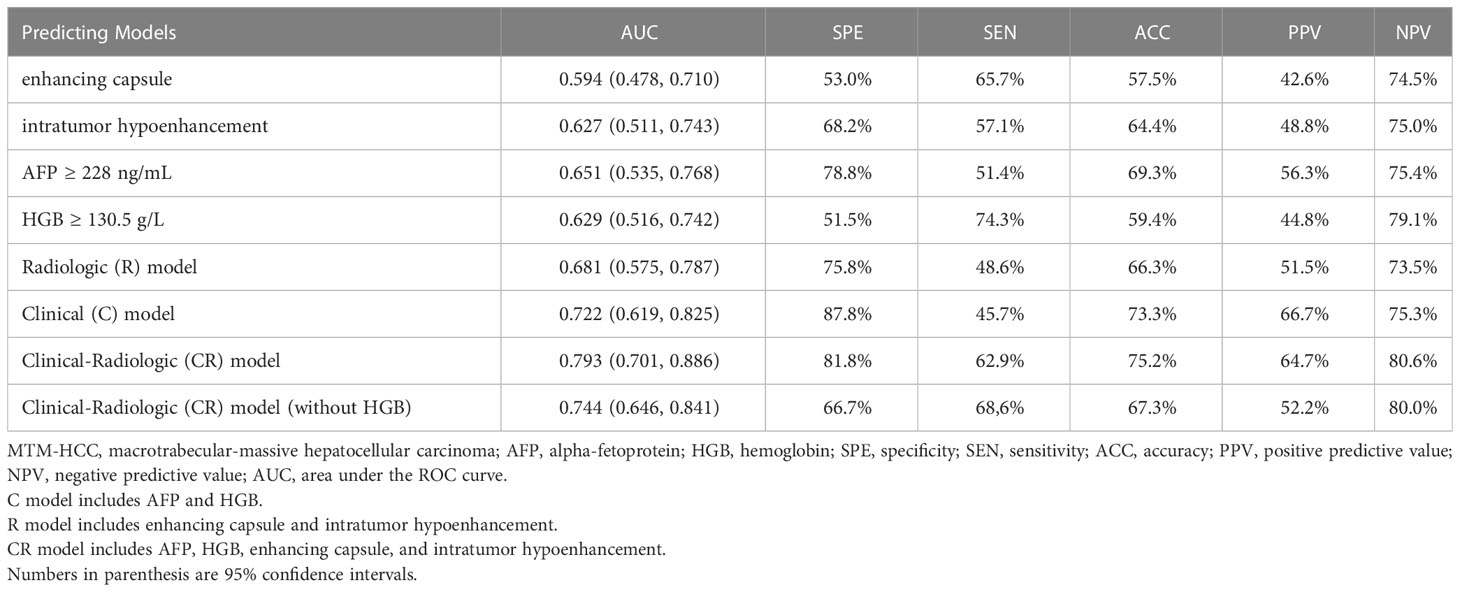
Table 5 Diagnosis performance of MTM-HCC predictive models.
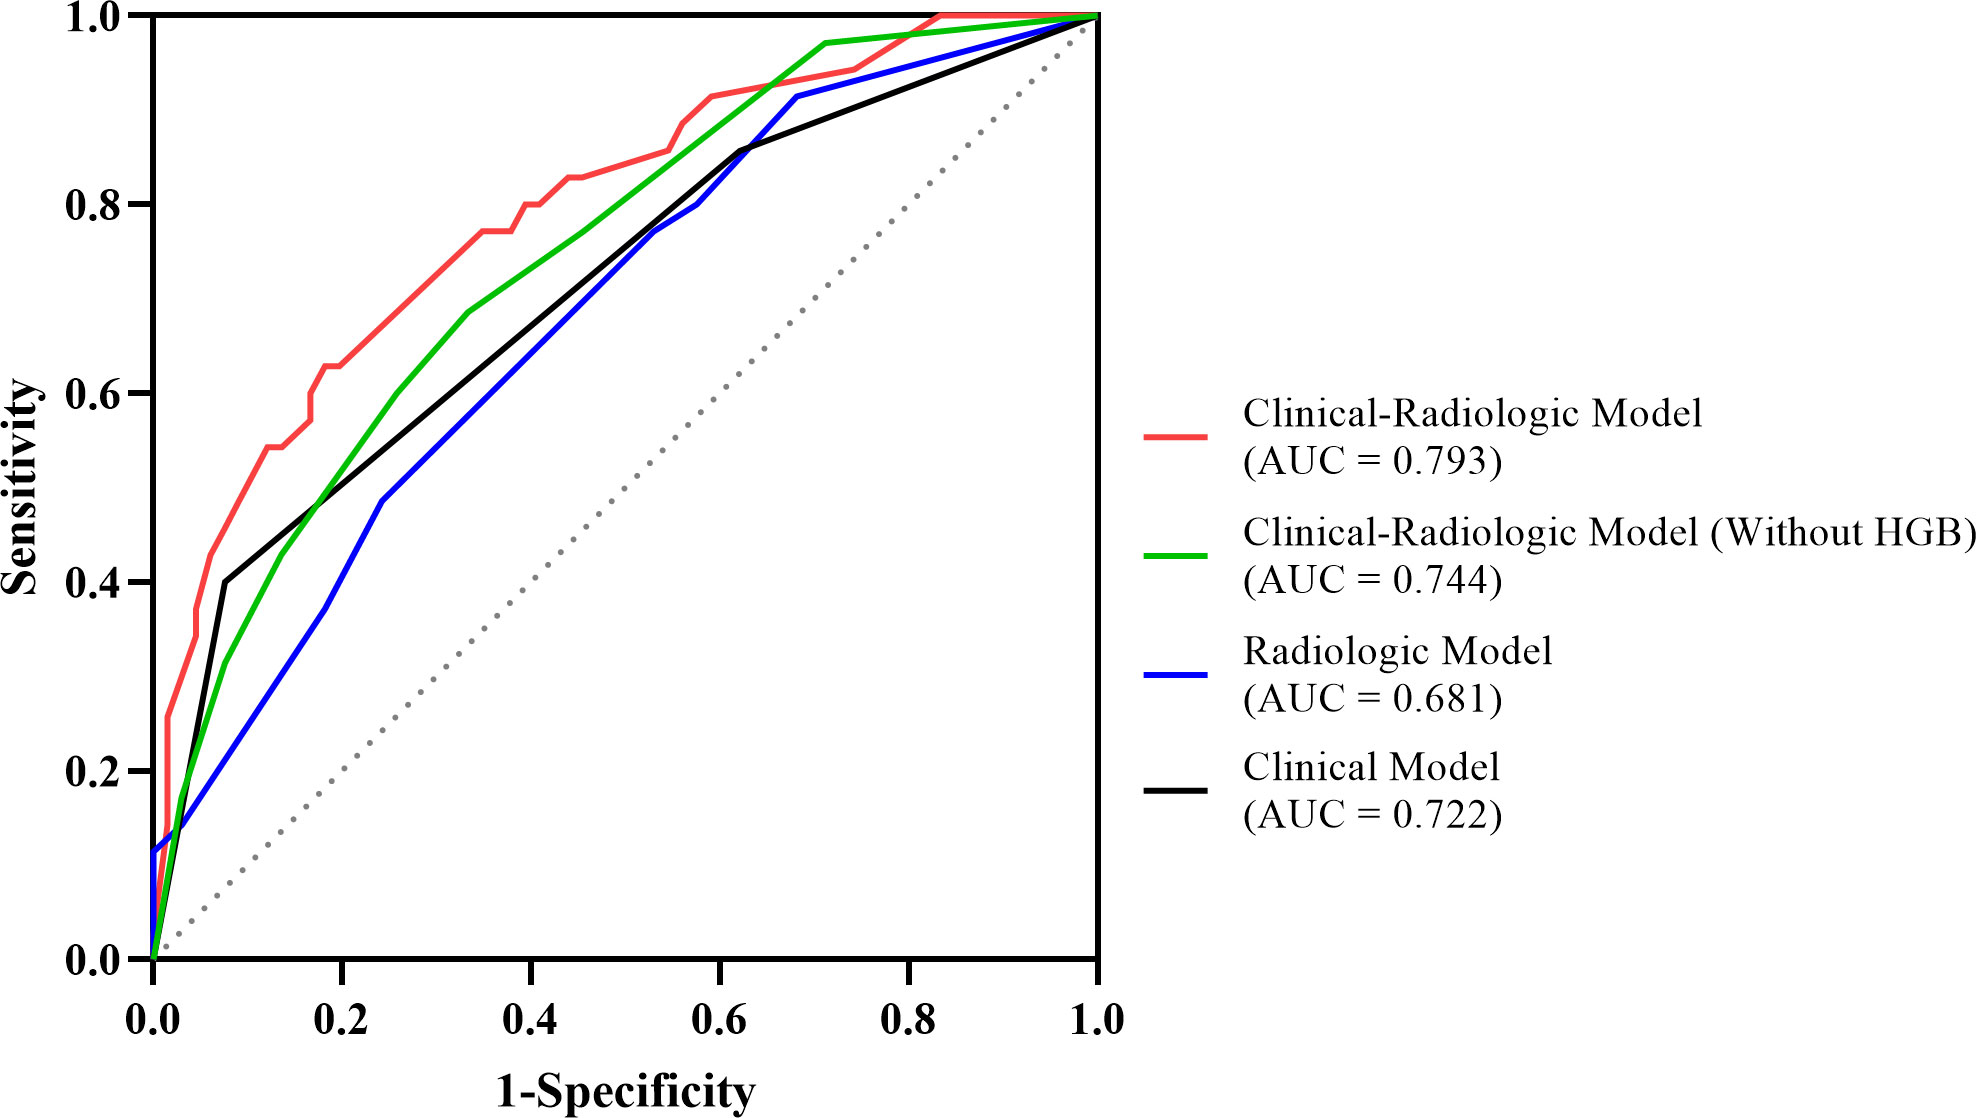
Figure 4 The ROC curves of the MTM-HCC prediction models. According to DeLong’s test, the clinical-radiologic model displayed better prediction performance than the radiologic model (p = .03) and the clinical model (p = .03).
The performance of the three models in BCLC 0-A subgroup are illustrated in Table 6 and Figure 5. The AUC value of the CR model achieved 0.801 (95% CI: 0.695, 0.907), outperforming the C model with the value of 0.697 (95% CI: 0.580, 0.814) according to DeLong’s test (p = .01). Meanwhile, the AUC values between the CR model and the R model had no significant differences (p = .06).
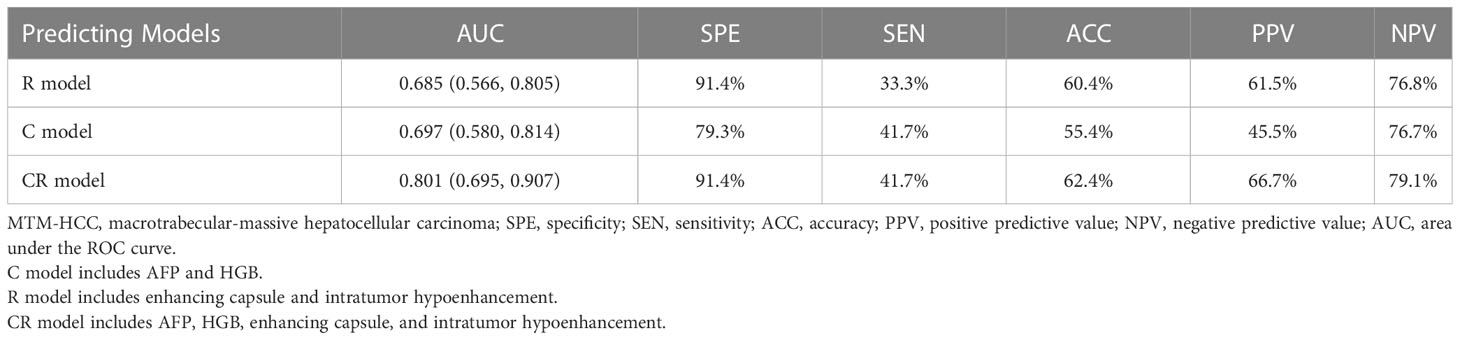
Table 6 Diagnosis performance of MTM-HCC predictive models in BCLC 0-A subgroup.
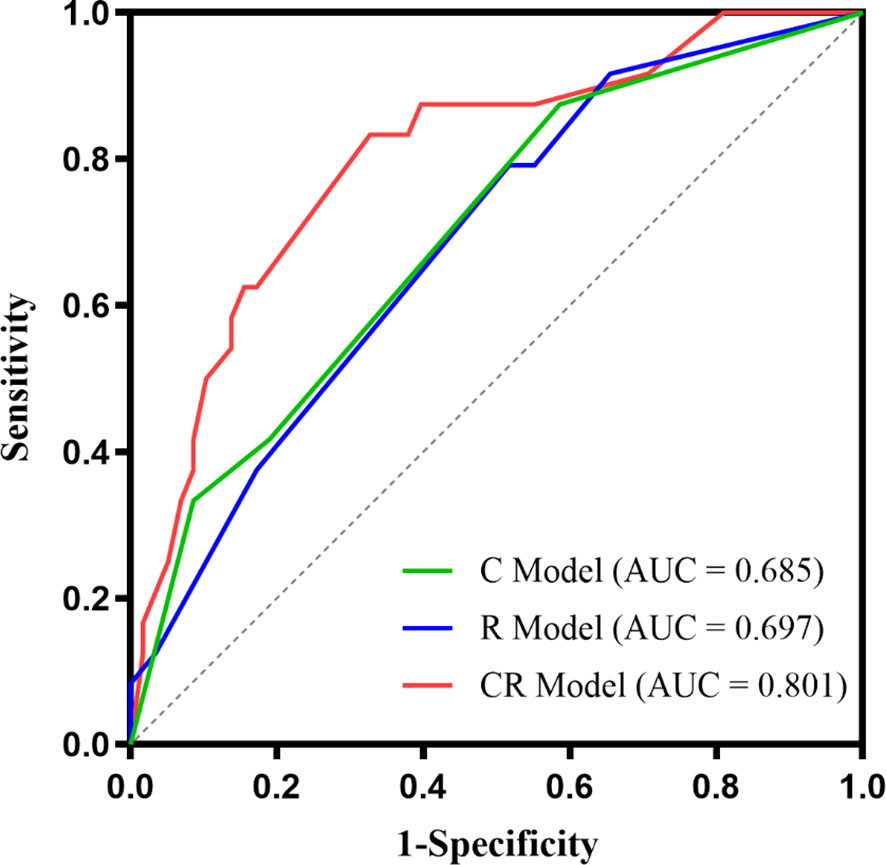
Figure 5 The ROC curves of the three models in BCLC 0-A stage subgroup.
The newly defined histological subtype MTM-HCC is associated with gene mutations, aggressive biological behavior, and poor prognosis regardless of surgical resection or radiofrequency ablation (4–6). In this study, we constructed predictive models for MTM-HCC based on clinical characteristics and CECT image findings, confirming high serum AFP, high hemoglobin, tumors without enhancing capsules, and intratumor hypoenhancement (for more than 20% of the whole tumor) were independent predictors for MTM-HCCs. The clinical-radiologic (CR) model, with an AUC value of 0.793, outperformed the radiologic (R) model and the clinical (C) model in terms of predicting MTM-HCCs. Additionally, the CR model demonstrated its ability to identify MTM-HCCs in patients with BCLC 0-A stage in the subgroup analysis.
The present study demonstrated that intratumor hypoenhancement and tumors without enhancing capsules were independent radiologic predictors of MTM-HCCs, which was consistent with previous studies (10–13, 15, 16). Intratumor hypoenhancement, including severe ischemic or necrosis, is related to endothelial-specific molecule 1 (ESM-1), angiopoietin 2 (Ang-2), and vascular endothelial growth factor A (VEGFA) expression in the tumor leading to peripheral tumor angiogenesis, hypoxia, rapid growth, and subsequent reduced central perfusion (25, 26). Moreover, necrosis correlates with poor survival in HCCs (27, 28), which could also explain the unsatisfying prognosis of MTM-HCCs. Tumors without enhancing capsules, as another independent radiologic predictor for MTM-HCC, are associated with aggressive biological behavior, which tends to have a higher incidence of direct liver invasion (29) or a strong correlation with TP53 mutations (30), which might explain why MTM-HCCs more frequently invade adjacent liver parenchyma or vascular systems (6).
Alpha-fetoprotein (AFP) is a biomarker strongly associated with developing HCC and advanced stages (31). Our results depicted that higher serum AFP was also an independent predictor for MTM-HCC in line with previous studies (6, 10, 12, 32). Notably, higher hemoglobin level was another independent predictor of MTM-HCC. Considering the association between MTM-HCC and high expression of hypoxia-related genes like EPO, CAIX, and VEGFA (25), EPO might stimulate hemoglobin to produce compensatory oxygen for tumors. A similar phenomenon was reported by Emara et al., who observed increased hemoglobin in patients with glioma due to the hypoxic microenvironment (33). Calderaro et al. reported that MTM-HCC has a characteristic highly activated angiogenic microenvironment (25). In addition, Xue et al. found a higher level of hemoglobin in HCC related to tumor angiogenesis from Vasohibin 2 upregulation (34), which requires further investigation.
The present study found that the inclusion of the clinical characteristics to identify MTM-HCCs improved the predictive performance, but there was no significant difference between models within or without HGB, and the clinical-radiologic (CR) model has the highest AUC value. The predictive performance of our CR model is similar to previous studies, but our model had a higher AUC value and higher specificity than Feng’s model, which included AFP, tumor necrosis, and hemorrhage (12), possibly due to the contribution of lab test results. Additionally, our model had better sensitivity than several reported MRI-based predictive models (11, 13, 15). Furthermore, some features employed in previous studies, like tumor hemorrhage and intratumor fat, might lead to the relatively high specificity of the predictive model due to their rarity in the real clinical scenario. Our radiologic (R) model had an AUC value of only 0.681, with a specificity of 75.8% and a sensitivity of 48.6%. This was worse than our CR model, which had an AUC value of 0.793. A similar study by Liang et al. (15) also found low AUC values of 0.644-0.699 when combining any two imaging features of enhancing capsule, blood products in mass or ascites. However, Shan et al. (35) were able to construct a predictive model for MTM-HCC using aspartate aminotransferase, AFP, and prothrombin time, achieving a C-index of 0.723. Therefore, we believed that adding clinical characteristics can increase the robustness of the predictive model. Remarkably, our CR model was able to identify MTM-HCCs in early-stage patients (BCLC 0-A stage). This result could significantly influence therapy decisions for patients with this subtype, promoting more aggressive interventions such as wider tumor resection margins, more intensive follow-up schedules, and a more comprehensive selection of adjuvant therapies, ultimately improving clinical outcomes.
Previous studies have demonstrated that MTM-HCCs tend to be larger than non-MTM-HCCs (6, 10, 11, 36). Although a larger tumor size of HCCs correlates with a higher histologic grade, vascular invasion, tumor recurrence, and extrahepatic metastasis (37–39), there was no significant difference in tumor size or the long-to-short axis ratio between MTM-HCCs and non-MTM-HCCs in our study, in contrast to previous findings. This difference in our study might be due to the small sample size and strict inclusion criteria. All the HCCs in our study were confirmed pathologically, leading to exclusion of smaller HCC lesions that underwent ablation other than hepatectomy.
Our study has several limitations that should be acknowledged. Firstly, being a single-center retrospective study, selection bias may have affected the results. Secondly, due to the lack of prognosis information and validation cohort, future studies with a larger multicenter cohort and including prognosis information are necessary to validate our findings. Additionally, future quantitative studies using radiomics or deep learning methods may provide high-throughput data to construct a more robust predictive model.
In conclusion, a prediction model combining imaging features and clinical data can identify MTM-HCCs even in early-stage patients and has better predictive performance than imaging features or clinical data alone.
The original contributions presented in the study are included in the article/supplementary material. Further inquiries can be directed to the corresponding authors.
The studies involving human participants were reviewed and approved by the Institutional Review Board of the Second Affiliated Hospital of South China University of Technology. Written informed consent for participation was not required for this study in accordance with the national legislation and the institutional requirements.
CH and WZ contributed equally to this work and share the first authorship. RY and XJ contributed equally to this work and CH, WZ, and RY conducted the literature search. CH, WZ, XW, RY, and XJ designed the study. JL, WY, YW, NW, and WD collected the data. CH, WZ, YZ, JL, and RY analyzed the data. All authors verified the data. CH, WZ, RY, and XJ edited the manuscript. RY, XW, and XJ reviewed the manuscript. All authors contributed to the article and approved the submitted version.
This study was funded by the National Natural Science Foundation of China (81971574, 82271938), the Natural Science Foundation of Guangdong Province (2021A1515011350), the GuangDong Basic and Applied Basic Research Foundation (2021A1515220060), the Science and Technology Project of Guangzhou (202102010025), the Special Fund for the Construction of High-level Key Clinical Specialty (Medical Imaging) in Guangzhou, and the Guangzhou Key Laboratory of Molecular Imaging and Clinical Translational Medicine (202201020376).
The authors declare that the research was conducted in the absence of any commercial or financial relationships that could be construed as a potential conflict of interest.
All claims expressed in this article are solely those of the authors and do not necessarily represent those of their affiliated organizations, or those of the publisher, the editors and the reviewers. Any product that may be evaluated in this article, or claim that may be made by its manufacturer, is not guaranteed or endorsed by the publisher.
AFP, Alpha-fetoprotein; APHE, Arterial phase hyperenhancement; AUC, Area under the ROC curve; BCLC, Barcelona Clinical Liver Cancer; CI, Confidence interval; GLR, γ-glutamyl transpeptidase-lymphocyte ratio; HCC, Hepatocellular carcinoma; HGB, Hemoglobin; MTM, Macrotrabecular-massive; NLR, Neutrophil-lymphocyte-ratio; OR, Odds ratio; PLR, Platelet-lymphocyte-ratio; ROC, Receiver operating characteristic.
1. Sung H, Ferlay J, Siegel RL, Laversanne M, Soerjomataram I, Jemal A, et al. Global cancer statistics 2020: globocan estimates of incidence and mortality worldwide for 36 cancers in 185 countries. CA Cancer J Clin (2021) 71(3):209–49. doi: 10.3322/caac.21660
2. Forner A, Reig M, Bruix J. Hepatocellular carcinoma. Lancet (2018) 391(10127):1301–14. doi: 10.1016/S0140-6736(18)30010-2
3. Nagtegaal ID, Odze RD, Klimstra D, Paradis V, Rugge M, Schirmacher P, et al. The 2019 who classification of tumours of the digestive system. Histopathology (2020) 76(2):182–8. doi: 10.1111/his.13975
4. Calderaro J, Couchy G, Imbeaud S, Amaddeo G, Letouze E, Blanc JF, et al. Histological subtypes of hepatocellular carcinoma are related to gene mutations and molecular tumour classification. J Hepatol (2017) 67(4):727–38. doi: 10.1016/j.jhep.2017.05.014
5. Calderaro J, Ziol M, Paradis V, Zucman-Rossi J. Molecular and histological correlations in liver cancer. J Hepatol (2019) 71(3):616–30. doi: 10.1016/j.jhep.2019.06.001
6. Ziol M, Pote N, Amaddeo G, Laurent A, Nault JC, Oberti F, et al. Macrotrabecular-massive hepatocellular carcinoma: a distinctive histological subtype with clinical relevance. Hepatology (2018) 68(1):103–12. doi: 10.1002/hep.29762
7. Liu LL, Zhang SW, Chao X, Wang CH, Yang X, Zhang XK, et al. Coexpression of Cmtm6 and pd-L1 as a predictor of poor prognosis in macrotrabecular-massive hepatocellular carcinoma. Cancer Immunol Immunother (2021) 70(2):417–29. doi: 10.1007/s00262-020-02691-9
8. Villanueva A. Hepatocellular carcinoma. N Engl J Med (2019) 380(15):1450–62. doi: 10.1056/NEJMra1713263
9. Benson AB, D’Angelica MI, Abbott DE, Anaya DA, Anders R, Are C, et al. Hepatobiliary cancers, version 2.2021, nccn clinical practice guidelines in oncology. J Natl Compr Canc Netw (2021) 19(5):541–65. doi: 10.6004/jnccn.2021.0022
10. Mule S, Galletto Pregliasco A, Tenenhaus A, Kharrat R, Amaddeo G, Baranes L, et al. Multiphase liver mri for identifying the macrotrabecular-massive subtype of hepatocellular carcinoma. Radiology (2020) 295(3):562–71. doi: 10.1148/radiol.2020192230
11. Chen J, Xia C, Duan T, Cao L, Jiang H, Liu X, et al. Macrotrabecular-massive hepatocellular carcinoma: imaging identification and prediction based on gadoxetic acid-enhanced magnetic resonance imaging. Eur Radiol (2021) 31(10):7696–704. doi: 10.1007/s00330-021-07898-7
12. Feng Z, Li H, Zhao H, Jiang Y, Liu Q, Chen Q, et al. Preoperative ct for characterization of aggressive macrotrabecular-massive subtype and vessels that encapsulate tumor clusters pattern in hepatocellular carcinoma. Radiology (2021) 300(1):219–29. doi: 10.1148/radiol.2021203614
13. Rhee H, Cho ES, Nahm JH, Jang M, Chung YE, Baek SE, et al. Gadoxetic acid-enhanced mri of macrotrabecular-massive hepatocellular carcinoma and its prognostic implications. J Hepatol (2021) 74(1):109–21. doi: 10.1016/j.jhep.2020.08.013
14. Zhu Y, Weng S, Li Y, Yan C, Ye R, Wen L, et al. A radiomics nomogram based on contrast-enhanced mri for preoperative prediction of macrotrabecular-massive hepatocellular carcinoma. Abdom Radiol (NY) (2021) 46(7):3139–48. doi: 10.1007/s00261-021-02989-x
15. Liang Y, Xu F, Wang Z, Tan C, Zhang N, Wei X, et al. A gadoxetic acid-enhanced mri-based multivariable model using Li-rads V2018 and other imaging features for preoperative prediction of macrotrabecular-massive hepatocellular carcinoma. Eur J Radiol (2022) 153:110356. doi: 10.1016/j.ejrad.2022.110356
16. Cha H, Choi JY, Park YN, Han K, Jang M, Kim MJ, et al. Comparison of imaging findings of macrotrabecular-massive hepatocellular carcinoma using ct and gadoxetic acid-enhanced mri. Eur Radiol (2023) 33(2):1364–77. doi: 10.1007/s00330-022-09105-7
17. Zheng J, Seier K, Gonen M, Balachandran VP, Kingham TP, D’Angelica MI, et al. Utility of serum inflammatory markers for predicting microvascular invasion and survival for patients with hepatocellular carcinoma. Ann Surg Oncol (2017) 24(12):3706–14. doi: 10.1245/s10434-017-6060-7
18. Zhang H, Zhou Y, Li Y, Qin W, Zi Y, Liu Y, et al. Predictive value of gamma-glutamyl transpeptidase to lymphocyte count ratio in hepatocellular carcinoma patients with microvascular invasion. BMC Cancer (2020) 20(1):132. doi: 10.1186/s12885-020-6628-7
19. Wang Q, Chen Q, Zhang X, Lu XL, Du Q, Zhu T, et al. Diagnostic value of gamma-Glutamyltransferase/Aspartate aminotransferase ratio, protein induced by vitamin K absence or antagonist ii, and alpha-fetoprotein in hepatitis b virus-related hepatocellular carcinoma. World J Gastroenterol (2019) 25(36):5515–29. doi: 10.3748/wjg.v25.i36.5515
20. Liao W, Zhang J, Zhu Q, Qin L, Yao W, Lei B, et al. Preoperative neutrophil-to-Lymphocyte ratio as a new prognostic marker in hepatocellular carcinoma after curative resection. Transl Oncol (2014) 7(2):248–55. doi: 10.1016/j.tranon.2014.02.011
21. Tzartzeva K, Obi J, Rich NE, Parikh ND, Marrero JA, Yopp A, et al. Surveillance imaging and alpha fetoprotein for early detection of hepatocellular carcinoma in patients with cirrhosis: a meta-analysis. Gastroenterology (2018) 154(6):1706–18 e1. doi: 10.1053/j.gastro.2018.01.064
22. Johnson PJ, Berhane S, Kagebayashi C, Satomura S, Teng M, Reeves HL, et al. Assessment of liver function in patients with hepatocellular carcinoma: a new evidence-based approach-the albi grade. J Clin Oncol (2015) 33(6):550–8. doi: 10.1200/JCO.2014.57.9151
23. Woo HY, Rhee H, Yoo JE, Kim SH, Choi GH, Kim DY, et al. Lung and lymph node metastases from hepatocellular carcinoma: comparison of pathological aspects. Liver Int (2022) 42(1):199–209. doi: 10.1111/liv.15051
24. Chernyak V, Fowler KJ, Kamaya A, Kielar AZ, Elsayes KM, Bashir MR, et al. Liver imaging reporting and data system (Li-rads) version 2018: imaging of hepatocellular carcinoma in at-risk patients. Radiology (2018) 289(3):816–30. doi: 10.1148/radiol.2018181494
25. Calderaro J, Meunier L, Nguyen CT, Boubaya M, Caruso S, Luciani A, et al. Esm1 as a marker of macrotrabecular-massive hepatocellular carcinoma. Clin Cancer Res (2019) 25(19):5859–65. doi: 10.1158/1078-0432.CCR-19-0859
26. Tohme S, Yazdani HO, Liu Y, Loughran P, van der Windt DJ, Huang H, et al. Hypoxia mediates mitochondrial biogenesis in hepatocellular carcinoma to promote tumor growth through Hmgb1 and Tlr9 interaction. Hepatology (2017) 66(1):182–97. doi: 10.1002/hep.29184
27. Wei T, Zhang XF, Bagante F, Ratti F, Marques HP, Silva S, et al. Tumor necrosis impacts prognosis of patients undergoing curative-intent hepatocellular carcinoma. Ann Surg Oncol (2021) 28(2):797–805. doi: 10.1245/s10434-020-09390-w
28. Ling YH, Chen JW, Wen SH, Huang CY, Li P, Lu LH, et al. Tumor necrosis as a poor prognostic predictor on postoperative survival of patients with solitary small hepatocellular carcinoma. BMC Cancer (2020) 20(1):607. doi: 10.1186/s12885-020-07097-5
29. Rong D, Liu W, Kuang S, Xie S, Chen Z, Chen F, et al. Preoperative prediction of pathologic grade of hcc on gadobenate dimeglumine-enhanced dynamic mri. Eur Radiol (2021) 31(10):7584–93. doi: 10.1007/s00330-021-07891-0
30. Dong Z, Huang K, Liao B, Cai H, Dong Y, Huang M, et al. Prediction of sorafenib treatment-related gene expression for hepatocellular carcinoma: preoperative mri and histopathological correlation. Eur Radiol (2019) 29(5):2272–82. doi: 10.1007/s00330-018-5882-4
31. Zheng Y, Zhu M, Li M. Effects of alpha-fetoprotein on the occurrence and progression of hepatocellular carcinoma. J Cancer Res Clin Oncol (2020) 146(10):2439–46. doi: 10.1007/s00432-020-03331-6
32. Ridder DA, Weinmann A, Schindeldecker M, Urbansky LL, Berndt K, Gerber TS, et al. Comprehensive clinicopathologic study of alpha fetoprotein-expression in a Large cohort of patients with hepatocellular carcinoma. Int J Cancer (2022) 150(6):1053–66. doi: 10.1002/ijc.33898
33. Emara M, Turner AR, Allalunis-Turner J. Hypoxia differentially upregulates the expression of embryonic, fetal and adult hemoglobin in human glioblastoma cells. Int J Oncol (2014) 44(3):950–8. doi: 10.3892/ijo.2013.2239
34. Xue X, Gao W, Sun B, Xu Y, Han B, Wang F, et al. Vasohibin 2 is transcriptionally activated and promotes angiogenesis in hepatocellular carcinoma. Oncogene (2013) 32(13):1724–34. doi: 10.1038/onc.2012.177
35. Shan Y, Yu X, Yang Y, Sun J, Wu S, Mao S, et al. Nomogram for the preoperative prediction of the macrotrabecular-massive subtype of hepatocellular carcinoma. J Hepatocell Carcinoma (2022) 9:717–28. doi: 10.2147/JHC.S373960
36. Cannella R, Dioguardi Burgio M, Beaufrere A, Trapani L, Paradis V, Hobeika C, et al. Imaging features of histological subtypes of hepatocellular carcinoma: implication for Li-rads. JHEP Rep (2021) 3(6):100380. doi: 10.1016/j.jhepr.2021.100380
37. Huang K, Dong Z, Cai H, Huang M, Peng Z, Xu L, et al. Imaging biomarkers for well and moderate hepatocellular carcinoma: preoperative magnetic resonance image and histopathological correlation. BMC Cancer (2019) 19(1):364. doi: 10.1186/s12885-019-5574-8
38. Pawlik TM, Delman KA, Vauthey JN, Nagorney DM, Ng IO, Ikai I, et al. Tumor size predicts vascular invasion and histologic grade: implications for selection of surgical treatment for hepatocellular carcinoma. Liver Transpl (2005) 11(9):1086–92. doi: 10.1002/lt.20472
Keywords: hepatocellular carcinoma, liver neoplasm, computed tomography, macrotrabecular-massive, diagnosis
Citation: He C, Zhang W, Zhao Y, Li J, Wang Y, Yao W, Wang N, Ding W, Wei X, Yang R and Jiang X (2023) Preoperative prediction model for macrotrabecular-massive hepatocellular carcinoma based on contrast-enhanced CT and clinical characteristics: a retrospective study. Front. Oncol. 13:1124069. doi: 10.3389/fonc.2023.1124069
Received: 14 December 2022; Accepted: 18 April 2023;
Published: 01 May 2023.
Edited by:
Ju Dong Yang, Cedars Sinai Medical Center, United StatesReviewed by:
Christopher Malone, Washington University in St. Louis, United StatesCopyright © 2023 He, Zhang, Zhao, Li, Wang, Yao, Wang, Ding, Wei, Yang and Jiang. This is an open-access article distributed under the terms of the Creative Commons Attribution License (CC BY). The use, distribution or reproduction in other forums is permitted, provided the original author(s) and the copyright owner(s) are credited and that the original publication in this journal is cited, in accordance with accepted academic practice. No use, distribution or reproduction is permitted which does not comply with these terms.
*Correspondence: Ruimeng Yang, ZXlydWltZW5neWFuZ0BzY3V0LmVkdS5jbg==; Xinqing Jiang, ZXlqaWFuZ3hxQHNjdXQuZWR1LmNu
†These authors have contributed equally to this work and share first authorship
Disclaimer: All claims expressed in this article are solely those of the authors and do not necessarily represent those of their affiliated organizations, or those of the publisher, the editors and the reviewers. Any product that may be evaluated in this article or claim that may be made by its manufacturer is not guaranteed or endorsed by the publisher.
Research integrity at Frontiers
Learn more about the work of our research integrity team to safeguard the quality of each article we publish.