- 1Department of Physiology and Biomedical Engineering, Mayo Clinic College of Medicine and Science, Rochester, MN, United States
- 2Department of Quantitative Health Sciences, Mayo Clinic College of Medicine and Science, Rochester, MN, United States
- 3Department of Radiology, Mayo Clinic College of Medicine and Science, Rochester, MN, United States
Introduction: A contrast-free ultrasound microvasculature imaging technique was evaluated in this study to determine whether extracting morphological features of the vascular networks in hepatic lesions can be beneficial in differentiating benign and malignant tumors (hepatocellular carcinoma (HCC) in particular).
Methods: A total of 29 lesions from 22 patients were included in this work. A post-processing algorithm consisting of clutter filtering, denoising, and vessel enhancement steps was implemented on ultrasound data to visualize microvessel structures. These structures were then further characterized and quantified through additional image processing. A total of nine morphological metrics were examined to compare different groups of lesions. A two-sided Wilcoxon rank sum test was used for statistical analysis.
Results: In the malignant versus benign comparison, six of the metrics manifested statistical significance. Comparing only HCC cases with the benign, only three of the metrics were significantly different. No statistically significant distinction was observed between different malignancies (HCC versus cholangiocarcinoma and metastatic adenocarcinoma) for any of the metrics.
Discussion: Obtained results suggest that designing predictive models based on such morphological characteristics on a larger sample size may prove helpful in differentiating benign from malignant liver masses.
1 Introduction
Hepatocellular carcinoma (HCC) is the most frequently occurring malignancy in the liver, accounting for approximately 70 to 90 percent of all primary liver cancers (1, 2). In the year 2020, primary liver cancer ranked third among all cancers in terms of mortality rate worldwide (3). As in most other cancer types, early diagnosis of HCC is extremely important in implementation of timely intervention and determination of proper treatments (4). Hindering HCC progression in early stages can lead to higher survival rate and lower probability of postoperative recurrence (5–7). Detection of the presence of liver lesions is typically an important step in potential HCC diagnosis while screening patients with liver disorders and abnormalities (8, 9).
HCC often develops in patients with underlying liver disease (10). Viral hepatitis, autoimmune liver disorders, hemochromatosis, and nonalcoholic steatohepatitis (NASH) are among diseases which can cause chronic damage to the liver resulting in cirrhosis, and in some cases lead directly to the development of HCC (11). Thus, regular surveillance of such patients is of high importance. Different imaging techniques, including ultrasound (US), computed tomography (CT), and magnetic resonance imaging (MRI), are often used for accurate diagnosis of HCC (12). Even though research suggests inferior performance of US (especially without the use of contrast agents) in comparison with CT and MRI in detecting HCC (13, 14), US imaging is generally the method of choice for frequent routine screening due to its accessibility, portability, ease of operation, cost-effectiveness and nonionizing nature (15–17).
Angiogenesis, or the formation of new blood vessels, is a common occurrence in the development and growth of neoplasms (18, 19). HCCs are known to exhibit hypervascularity (20, 21), and therefore, identification and characterization of vascular structures in liver masses can help in establishing biomarkers resulting in more accurate diagnoses. MRI, and CT have been employed in several studies to investigate blood flow and vasculature in HCC (22–25). The use of US imaging (with and without contrast-enhancement) for characterization and quantification of vascularity and hemodynamics in liver lesions has been reported in a number of studies (26–40). In particular, Yang et al. (41) utilized the ultrasound-based technique of superb microvascular imaging (SMI) to visualize microvascular structure in liver lesions and demonstrated its diagnostic capability with respect to HCC. Oezdemir et al. (42) presented a contrast-enhanced ultrasound (CEUS) data processing method for vasculature analysis and investigated the efficacy of using morphologic characteristics of HCC vascular networks in predicting the response to transarterial chemoembolization.
In this paper, we utilize a previously introduced (43) technique for visualization of microvasculature networks obtained from contrast-free ultrasound imaging data. Since this method is shown to be capable of visualizing sub-millimeter vessels, as small as 300 µm, it has been termed high-definition microvasculature imaging (HDMI). The proposed quantitative HDMI is equipped with a series of image processing operations, morphological filtering and vessel enhancement to extract and quantify vessel morphological parameters as quantitative vessel biomarkers (43–45). This method has been used for differentiation of breast masses (45–47). The present work constitutes an evaluation framework to distinguish HCCs from benign lesions. We hypothesize, by providing information regarding tumor vessel morphological features as quantitative biomarkers, the proposed contrast-free HDMI has the potential to objectively classify early HCC from benign liver lesions, thus rendering this method operator independent and eliminating the observer/reader variability for a reliable clinical use. Statistical analysis shows the potential of this framework in accurate characterization of malignant tumors.
2 Materials and methods
2.1 Participants
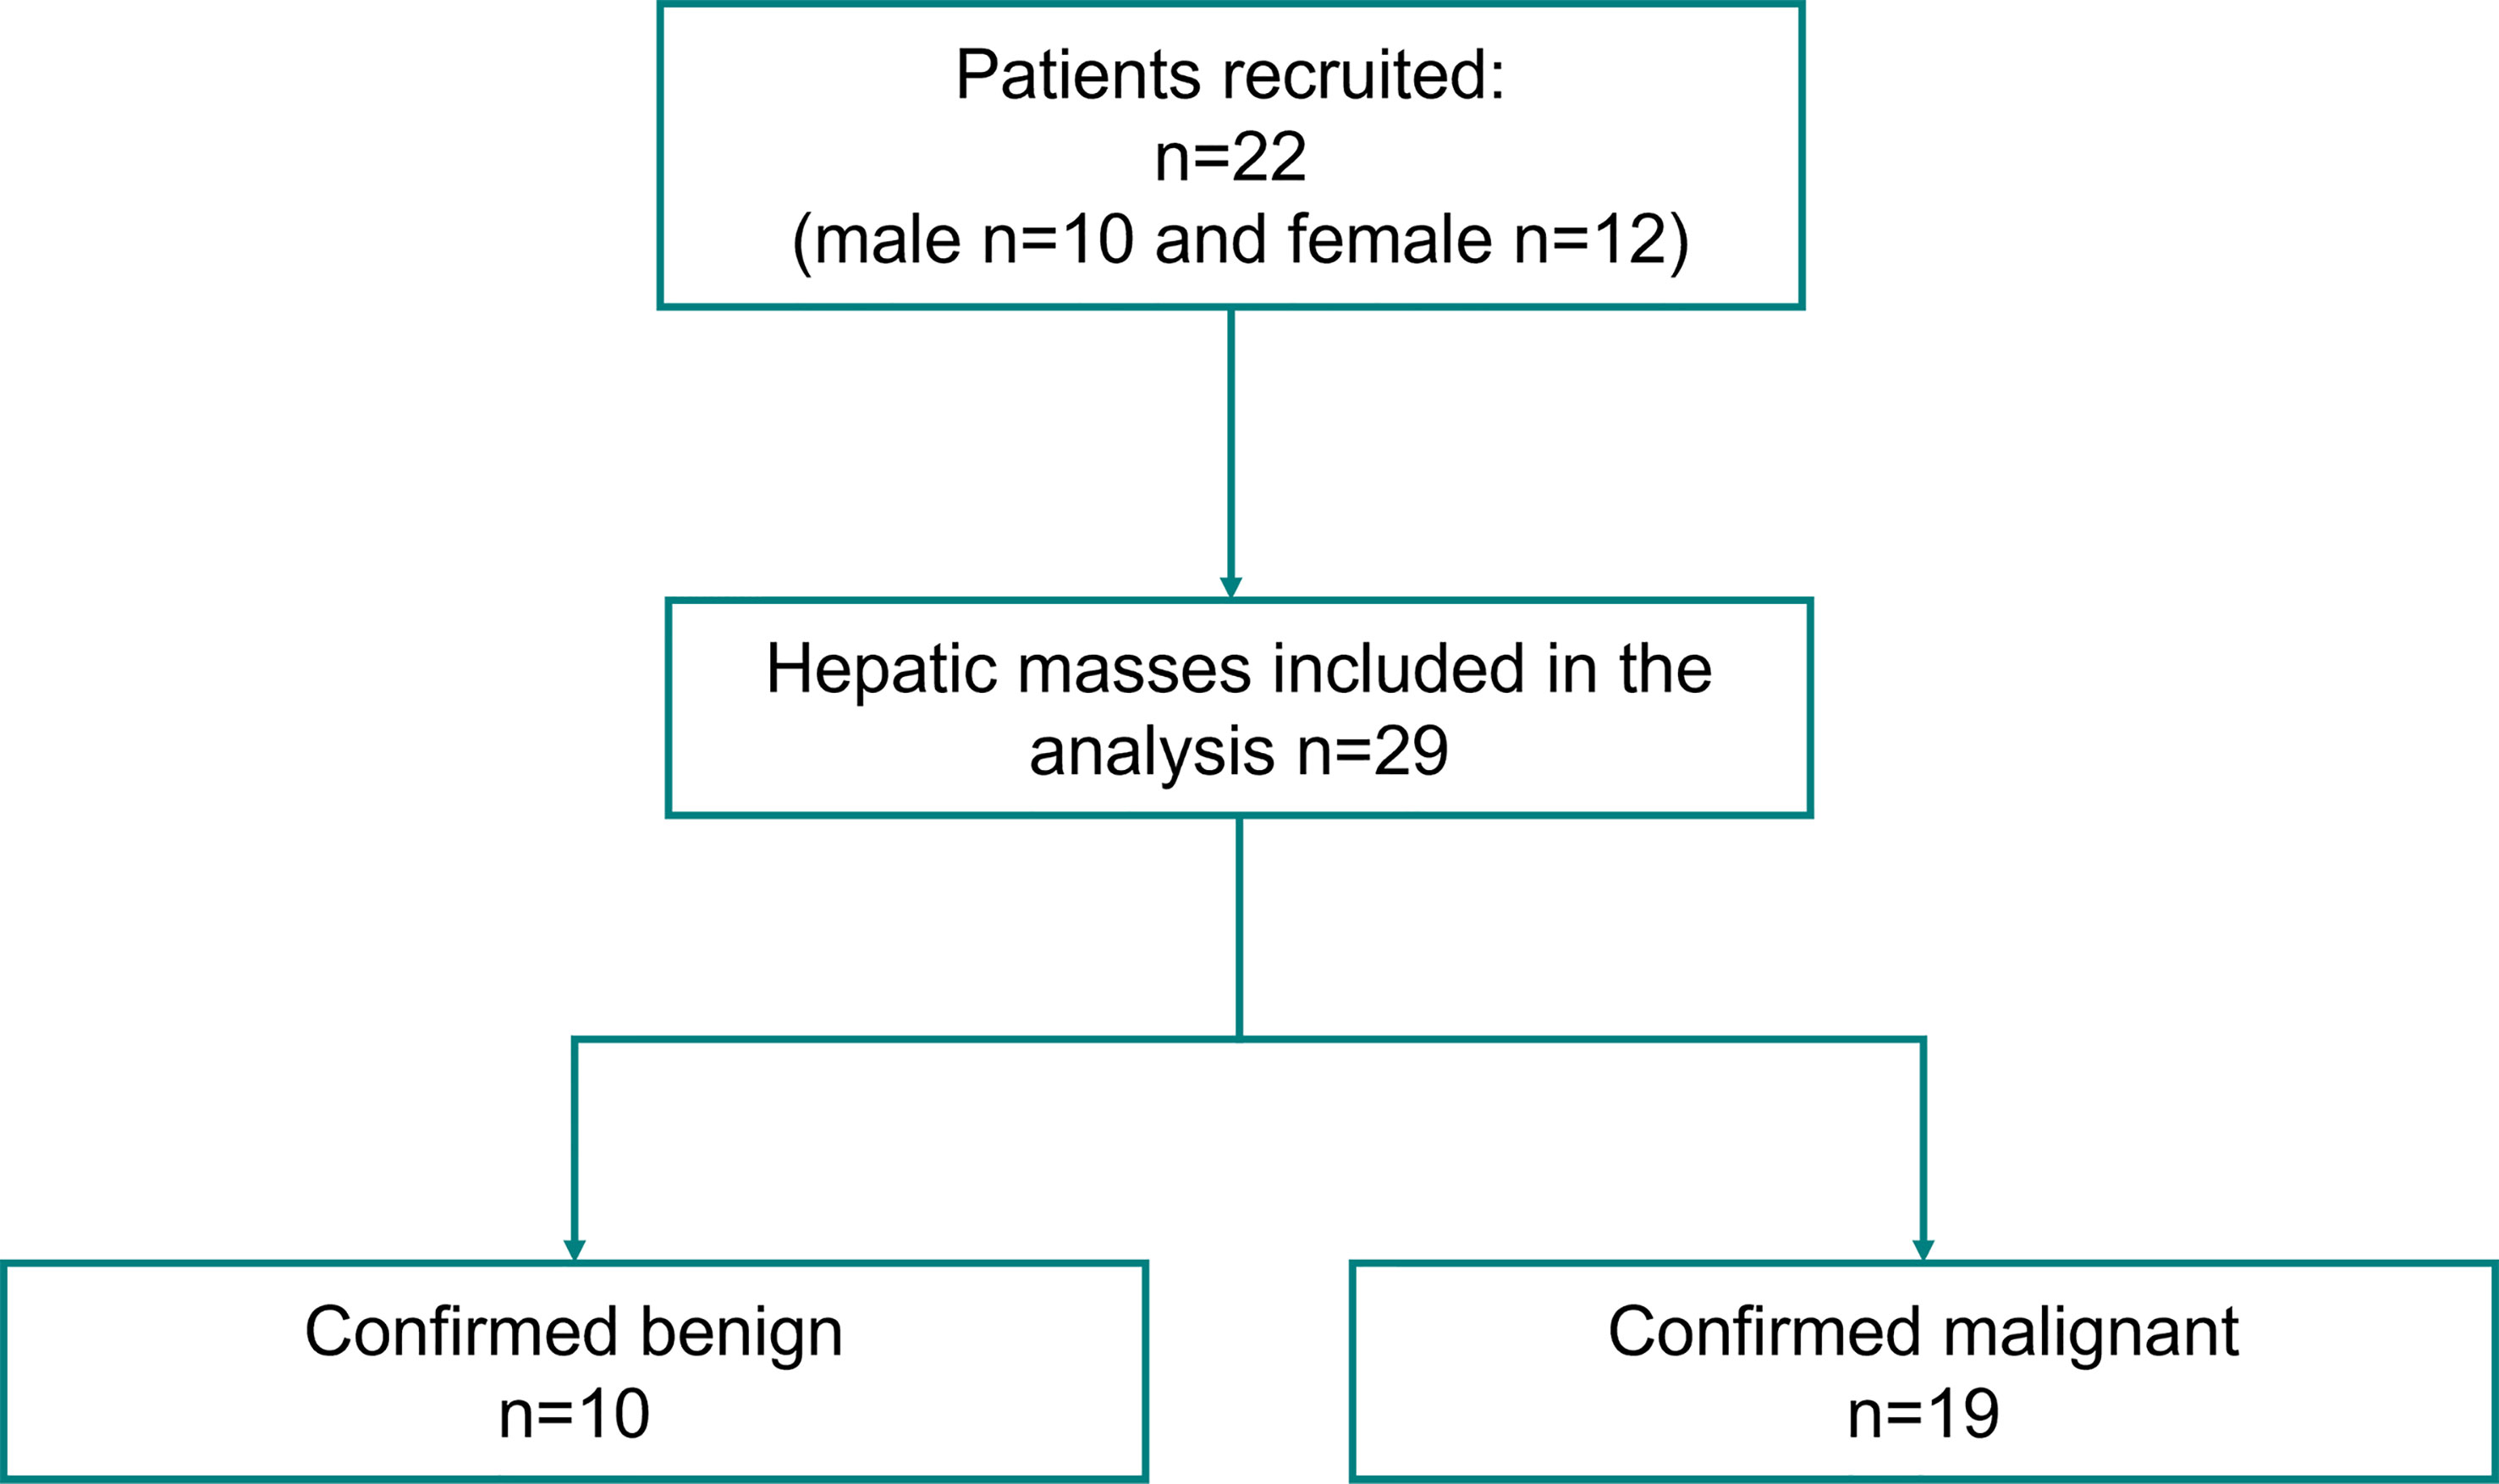
This prospective study, which was conducted from August 2020 to September 2021, received institutional review board approval (IRB#: 16-009435) and was in compliance with the Health Insurance Portability and Accountability Act. A signed written informed consent with permission for publication was obtained from each enrolled participant prior to the study. A total of 22 patients, ages ranged 19 - 82 years, mean age 61.6 ± 16.2, with 29 identified hepatic mass/masses on their screening ultrasound imaging, were enrolled in this study. Details of participant selection are provided in Figure 1. Patients were selected based on the criteria of having suspicious hepatic lesions and clinical diagnoses through pathology or cross-sectional imaging were used as the gold standard for creating the classes and labels.
2.2 Microvessel image acquisition and generation
For each participant, the ultrasound examinations were performed by one of two trained sonographers, with more than 35 and 15 years of experience, respectively. Subjects were scanned using an ultrasound system, Alpinion E-Cube 12R ultrasound machine (Alpinion Medical Systems, Seoul, South Korea), using a curved array transducer C1-6 operating at 3.6 MHz frequency. This system is capable of plane wave imaging and provides high-frame-rate images in the form of raw in-phase and quadrature (IQ) beamformed data for a total duration of 3 seconds, forming each frame of the data using 5-angle coherent plane wave compounding (48). For image acquisition, patients were instructed to stay still and halt respiration for approximately 3 seconds during data acquisition to reduce motion artifacts. To increase reproducibility, at least 2 acquisitions at each scan orientation were acquired. The methods for obtaining HDMI images, vessel extraction and steps for vessel segmentation have been detailed in (43, 44), as well as Supplementary Material 1.
2.3 Quantification of morphological parameters of tumor microvessels
For each case, the lesion of interest was manually segmented with the help of an experienced sonographer, to enable vessel quantification inside and outside the lesion separately. The output of the segmentation would then constitute a binary mask, delineating the region of interest (ROI). This mask underwent a 10mm dilation to include perilesional vascularity. This 10mm dilation was applied consistently to all of the masks ensuring sufficient area in the periphery of all lesions (regardless of their size) is included in the analysis. In some cases, where the lesions were large, or were situated in the proximity of the edges of the scanning region, the dilated mask would extend beyond the boundaries of the image, in which case we would use as much information as available within the image for quantification. The resulting mask was subsequently applied to the microvasculature image to limit vessel quantification within the ROI.
Vessel quantification procedures were implemented on the ROI beginning by binarizing the image using an empirically chosen threshold to ensure an adequate balance between background noise exclusion and keeping the vascular structure intact. Several morphological operations were then employed to remove small objects that do not correspond to actual vessels, as well as to fill the spurious holes inside vascular structures that might appear as a result of the visualization filtering processes. Next, a thinning algorithm was applied to the resulting binary image to extract the centerline of the vascular networks, to obtain what is referred to as the skeleton image.
Vessel quantification operations were performed on the skeleton image in order to compute discriminating metrics that would separate benign lesions from malignant ones. In this paper, we have used nine metrics that characterize the morphology and complexity of the vascular structures inside hepatic lesions. These metrics include: vessel density (VD), number of vessel segments (NV), number of branch points (NB), mean tortuosity as measured by the distance metric (τmean), maximum tortuosity as measured by the distance metric (τmax), mean diameter (Dmean), fractal dimension (FD), mean of Murray’s deviation (MDmean), mean bifurcation angle (BAmean). More details on the quantification procedure and the computation of these morphological features can be found in (44, 45), as well as Supplementary Material 1.
2.4 Statistical analysis
Quantitative variables are summarized as mean ± standard deviation (SD). To evaluate the discrimination of the metrics in differentiating the tumors, two separate analyses were performed. First, the lesions were divided into two groups, benign lesions and HCC lesions. A two-sided Wilcoxon rank sum test was applied to test for differences in distributions of the metric values for the two groups and corresponding p-values were obtained. Next, a new set was created by adding the other malignant lesions (cholangiocarcinoma (CCA) and metastatic adenocarcinoma) to the HCC cases, this time with the objective of separating benign masses from malignant ones. In all cases, p-values less than 0.05 were declared as statistically significant. All data processing and analyses were performed in MATLAB R2019a (The Mathworks Inc., Natick, MA, USA).
3 Results
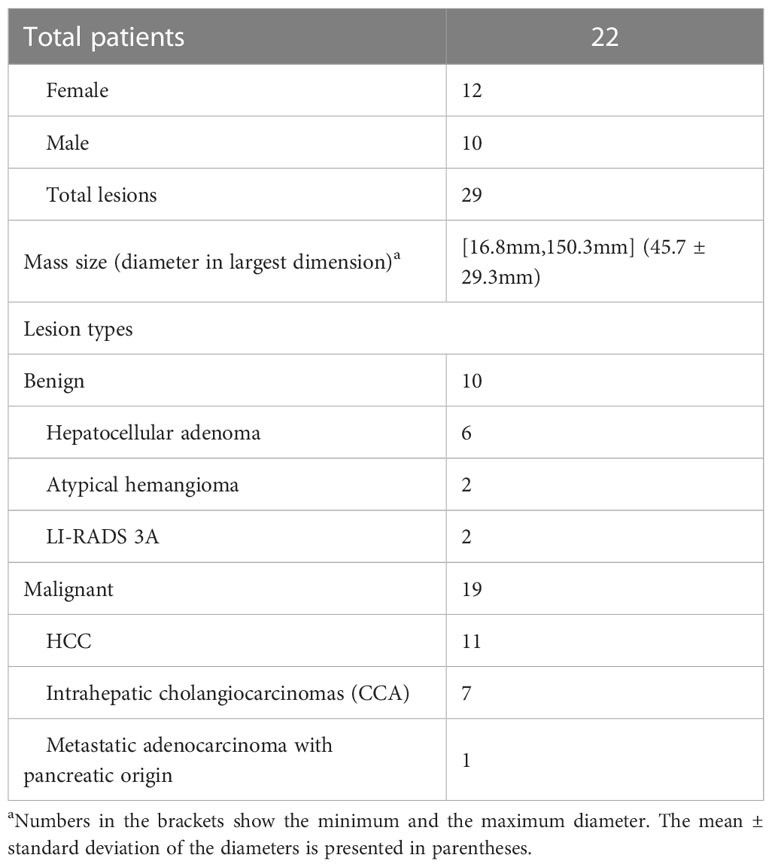
A total of 22 enrolled patients, consisting of 10 males and 12 females (ranging in age from 19 to 82 years, mean age 61.6 ± 16.2 years), with 29 hepatic masses (10 benign, 19 malignant) were examined by quantitative HDMI. The size of these lesions (diameter across the largest axial/lateral dimension) ranged from 16.8mm to 150.3mm with a mean diameter 45.7 ± 29.3mm. Clinical diagnoses (pathological or through cross-sectional imaging) were used to label the lesions. Among the 29 lesions, 27 ultimately underwent needle biopsy for pathologic diagnosis and 2 were radiologically confirmed based on typical contrast-enhanced CT and/or MRI imaging appearance. The 19 malignant cases included 11 hepatocellular carcinoma, 7 cholangiocarcinoma, and 1 metastatic adenocarcinoma of pancreatic origin. The 10 benign hepatic masses included 6 pathologically proven hepatocellular adenoma, 2 atypical hemangioma and 2 LI-RADS 3A labeled masses. Table 1 summarizes the lesion information included in this study.
3.1 Microvessel visualization and quantification for different groups of liver masses
In this section we present the visual comparison along with metric values of quantitative HDMI, for three groups of malignant and benign liver masses: 1) two larger malignant liver masses (HCC and CCA), 2) two smaller deep-seated liver masses (HCC and benign), and 3) two very small benign and malignant liver masses.
In group one, the conventional B-mode ultrasound and HDMI images of two larger malignant liver masses, HCC and CCA, respectively measuring 94mm and 51mm in the largest axial/lateral dimension, are shown for visual comparison in Figure 2. Microvasculature image inside the 10mm dilated mask for HCC (Figure 2B) presents more vascularity than that of CCA (Figure 2D). The quantified metrics presented in the tables below of each row show lower values for VD, NV, NB, FD, MDmean, Dmean, τmean, and τmax but higher value of BAmeanin CCA compared to HCC.
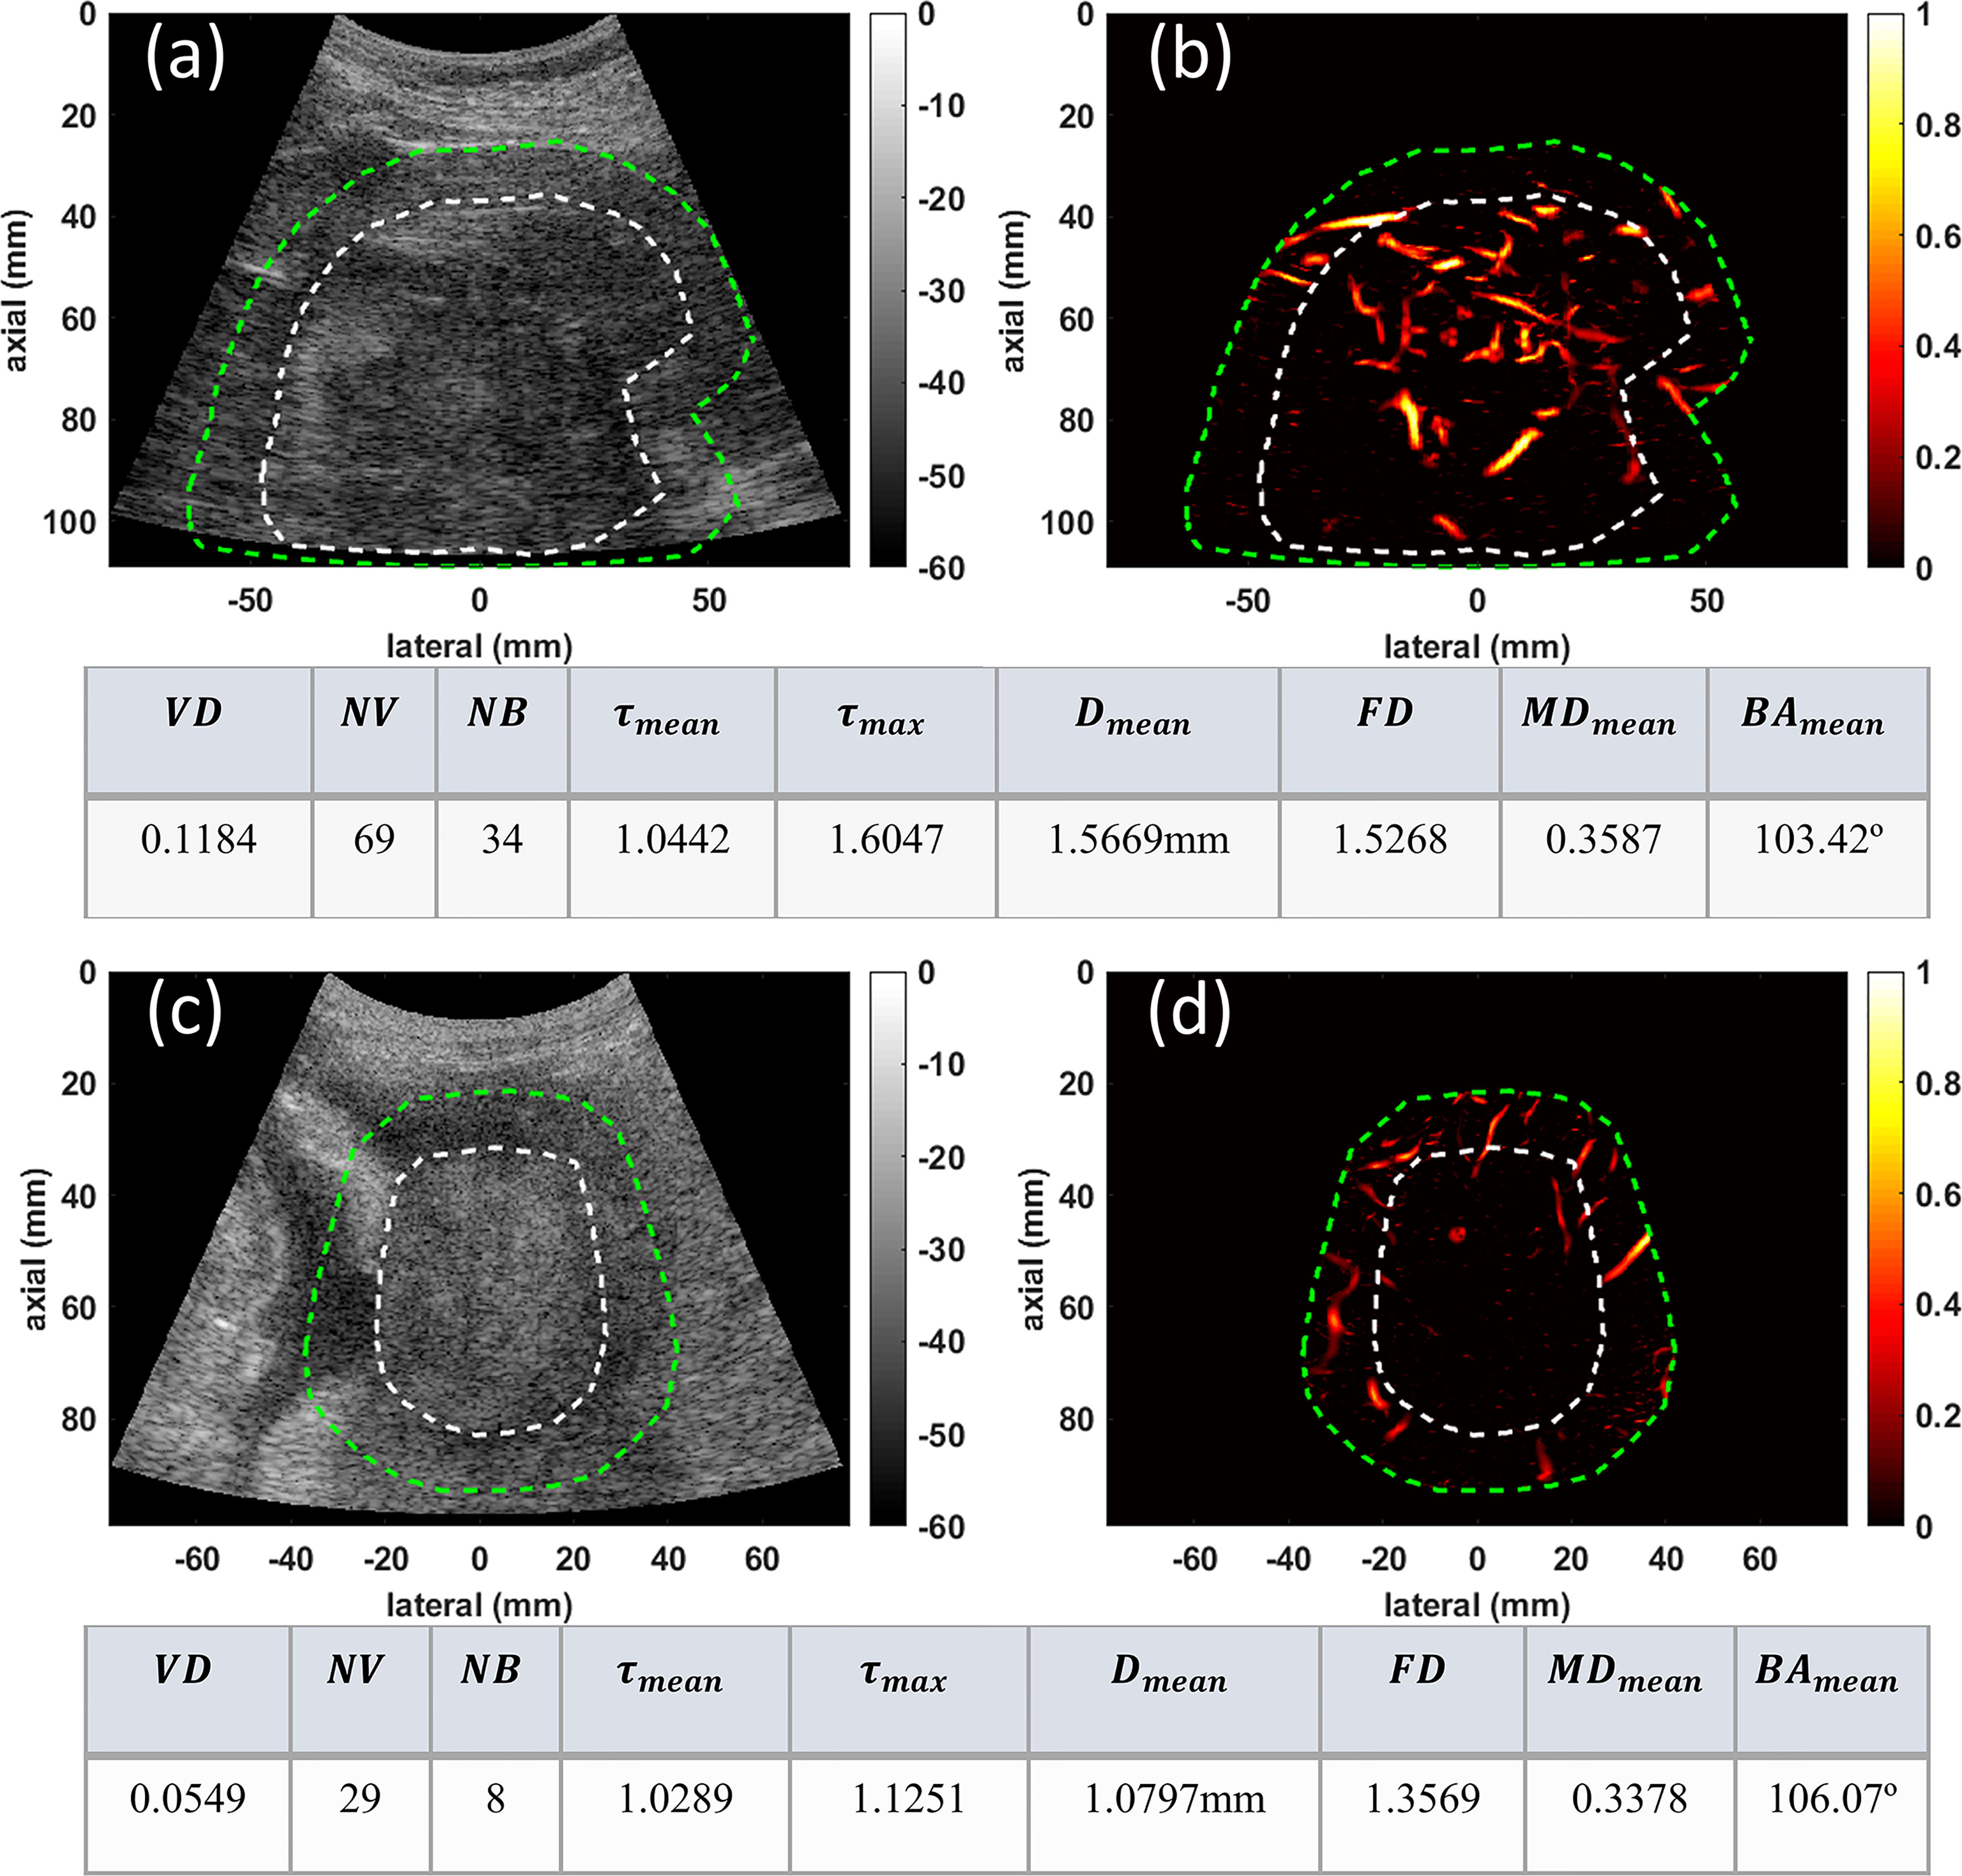
Figure 2 Examples of visualization and quantification results for two malignant lesions. (A) B-mode image of a 94mm HCC tumor (B) Microvasculature image inside the dilated HCC tumor mask (C) B-mode image of a 51mm CCA lesion (D) Microvasculature image inside the dilated CCA tumor mask. In all images the white dashed line indicates the boundaries of the lesion, and the green dashed line delineates the boundaries after a 10mm dilation. The tables below each row of images show metric values for the HCC (top) and CCA (bottom) tumors.
In the second group, the conventional B-mode ultrasound and HMDI images of two deep-seated small liver masses, an HCC and a benign mass, are shown in Figure 3 for visual comparison. This figure depicts the ability of HDMI in visualizing vasculature in and around deep-seated hepatic masses. The B-mode and microvasculature images of a dilated mass mask, centered approximately about 80mm, are shown in Figures 3A, B, respectively. This tumor is confirmed to be HCC. The B-mode and microvasculature images of another dilated mass mask, seated approximately about 90mm in depth, are shown in Figures 3C, D, respectively. This tumor is confirmed to be benign. The corresponding quantification metrics are shown in the tables below each row of images. The quantified metrics show higher values for VD, NV, NB, FD, τmean, τmax, MDmean, and BAmeanin HCC compared to the benign mass.
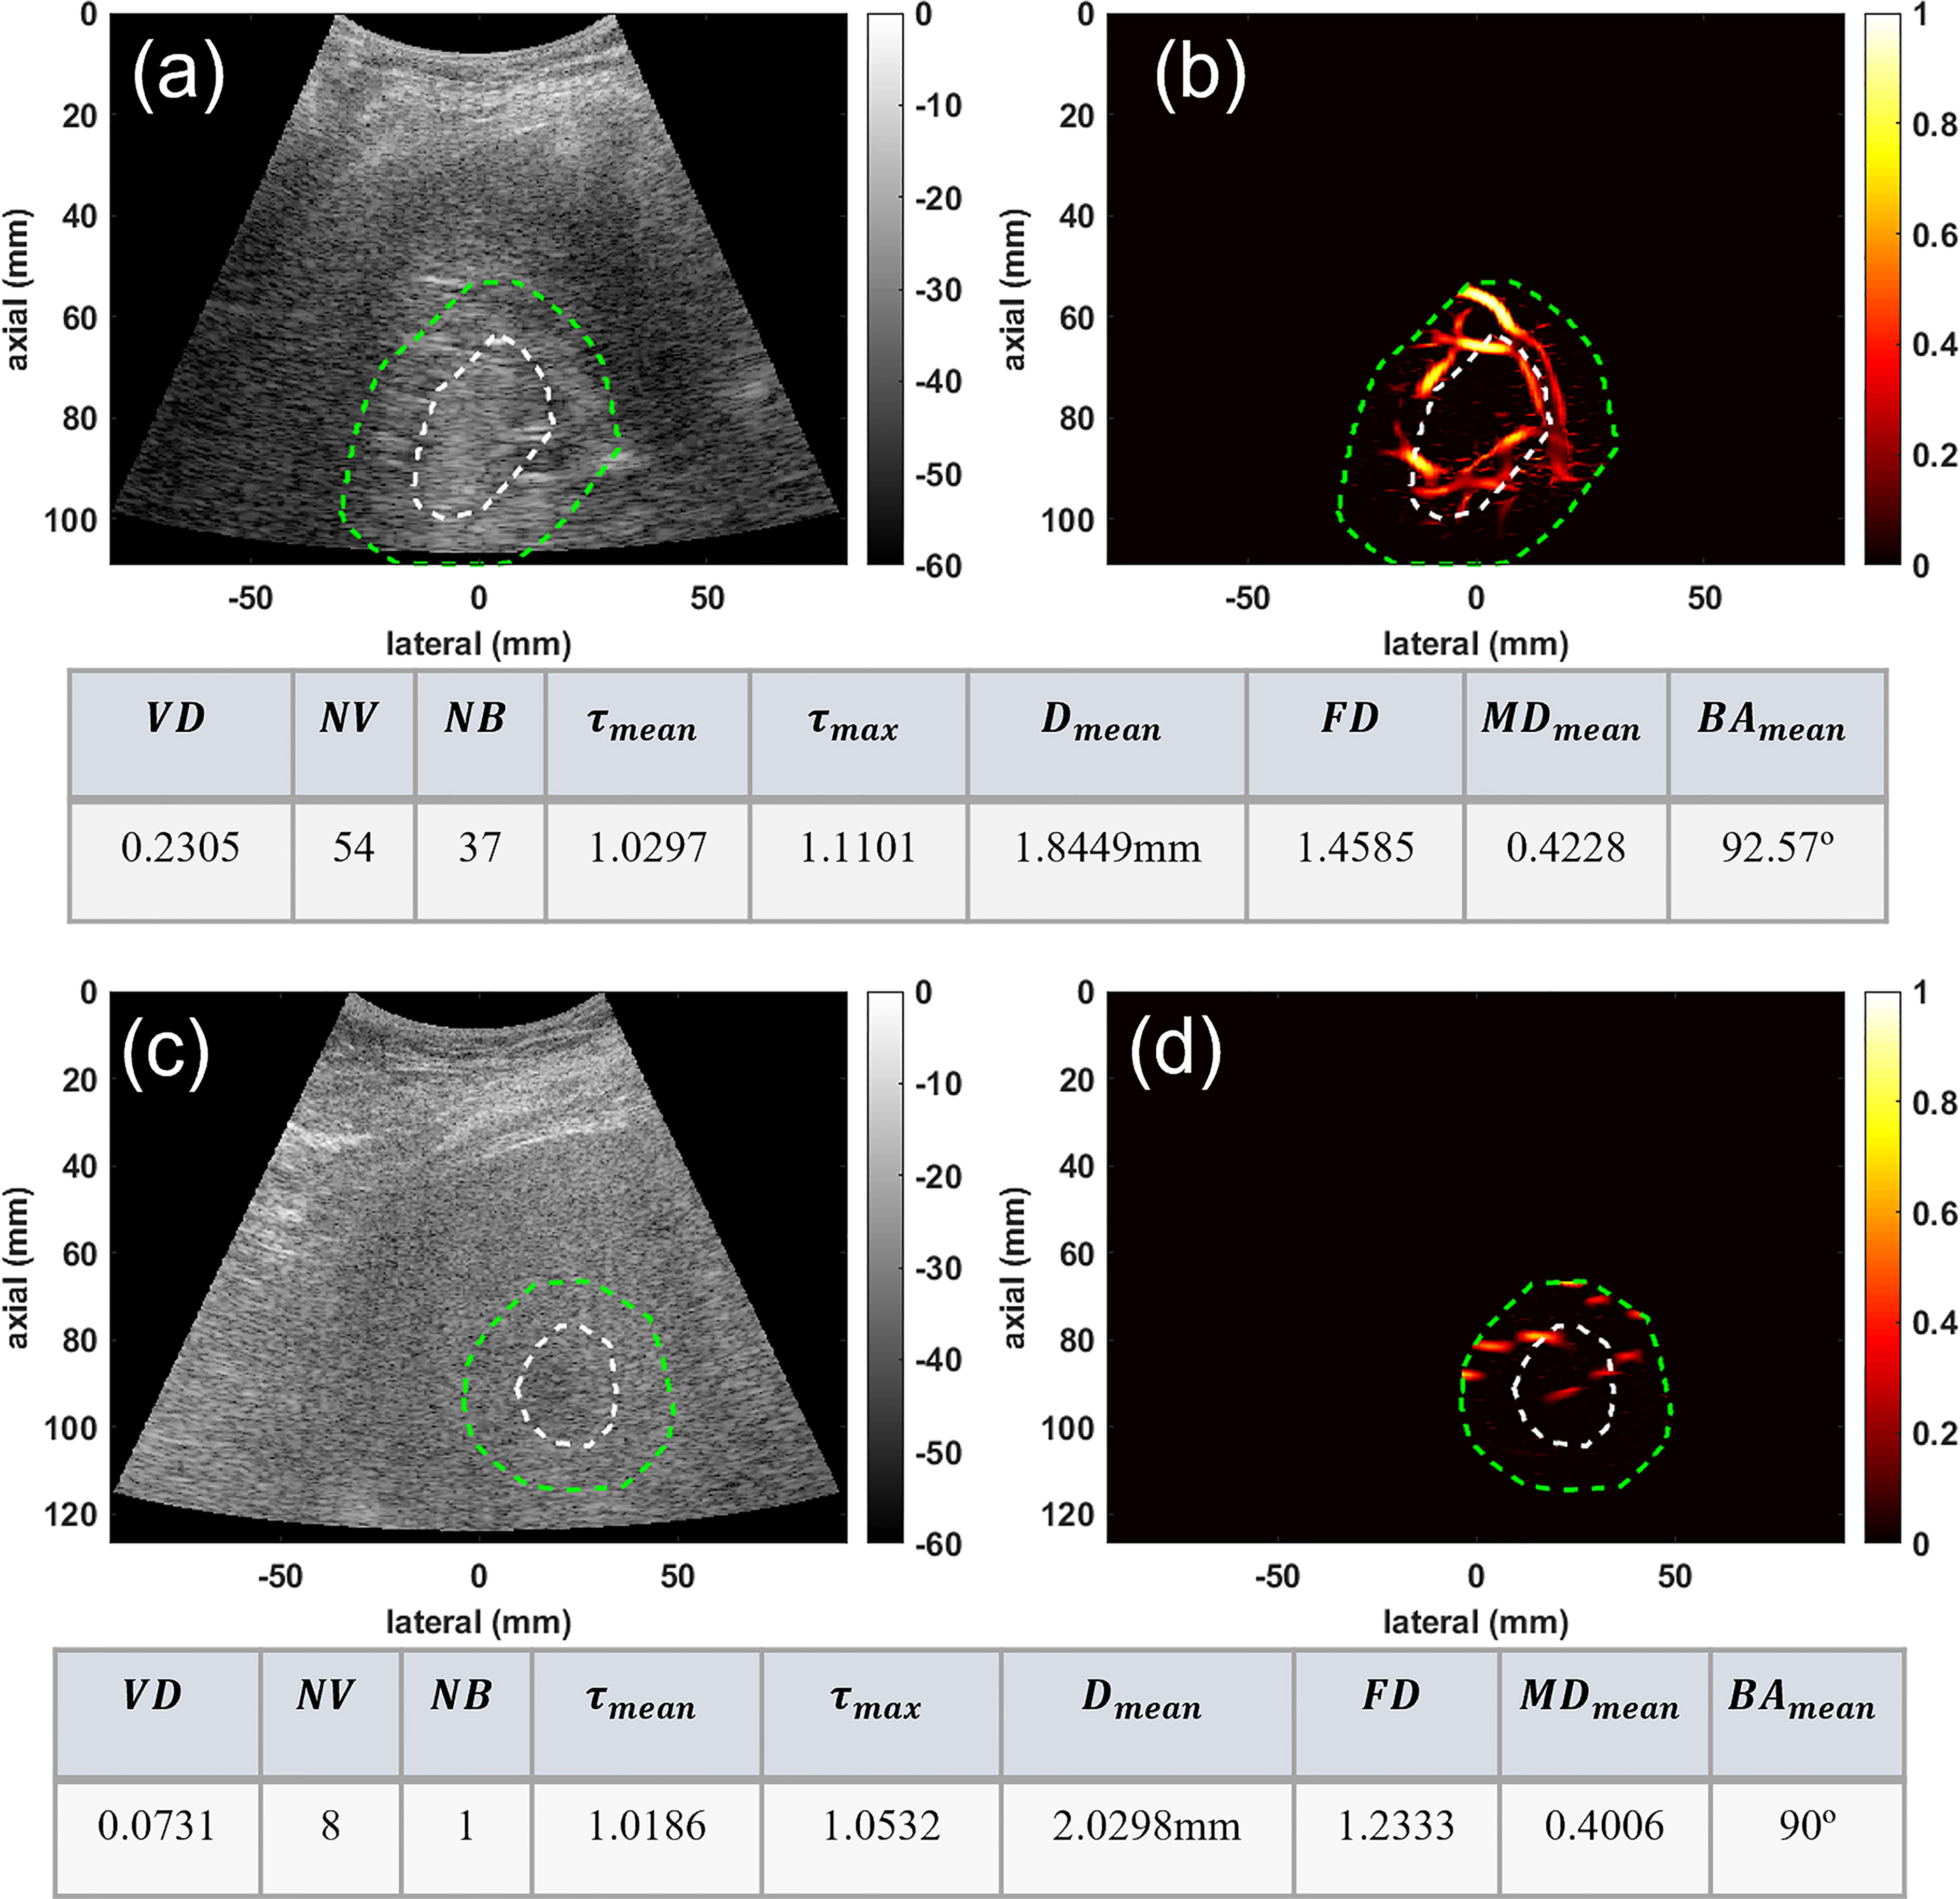
Figure 3 Visualization and quantification of deep-seated HCC and benign masses. (A) B-mode image of a deep-seated HCC tumor (B) Microvasculature image inside the dilated HCC tumor mask (C) B-mode image of a deep-seated benign lesion (D) Microvasculature image inside the dilated benign lesion mask. In all images the white dashed line indicates the boundaries of the lesion, and the green dashed line delineates the boundaries after a 10mm dilation. The tables below each row of images show metric values for the HCC (top) and benign (bottom) lesions.
We also demonstrated the potential of our method for characterization of very small liver masses in group three. Figure 4 depicts the microvessel images of two very small masses under 3 and about 2cm, for a confirmed HCC and a benign mass, respectively. Figures 4A, B, respectively, show the B-mode and microvasculature images in and around an HCC tumor with an approximate size of 29mm in its largest axial/lateral dimension. Similarly, Figures 4C, D show the resulting images for a benign lesion with an approximate size of 22mm. The corresponding quantification metrics are shown in the tables below each row of images. The quantified metrics show higher values for VD, NV, NB, FD, τmean, τmax, and Dmean in HCC compared to the benign mass.
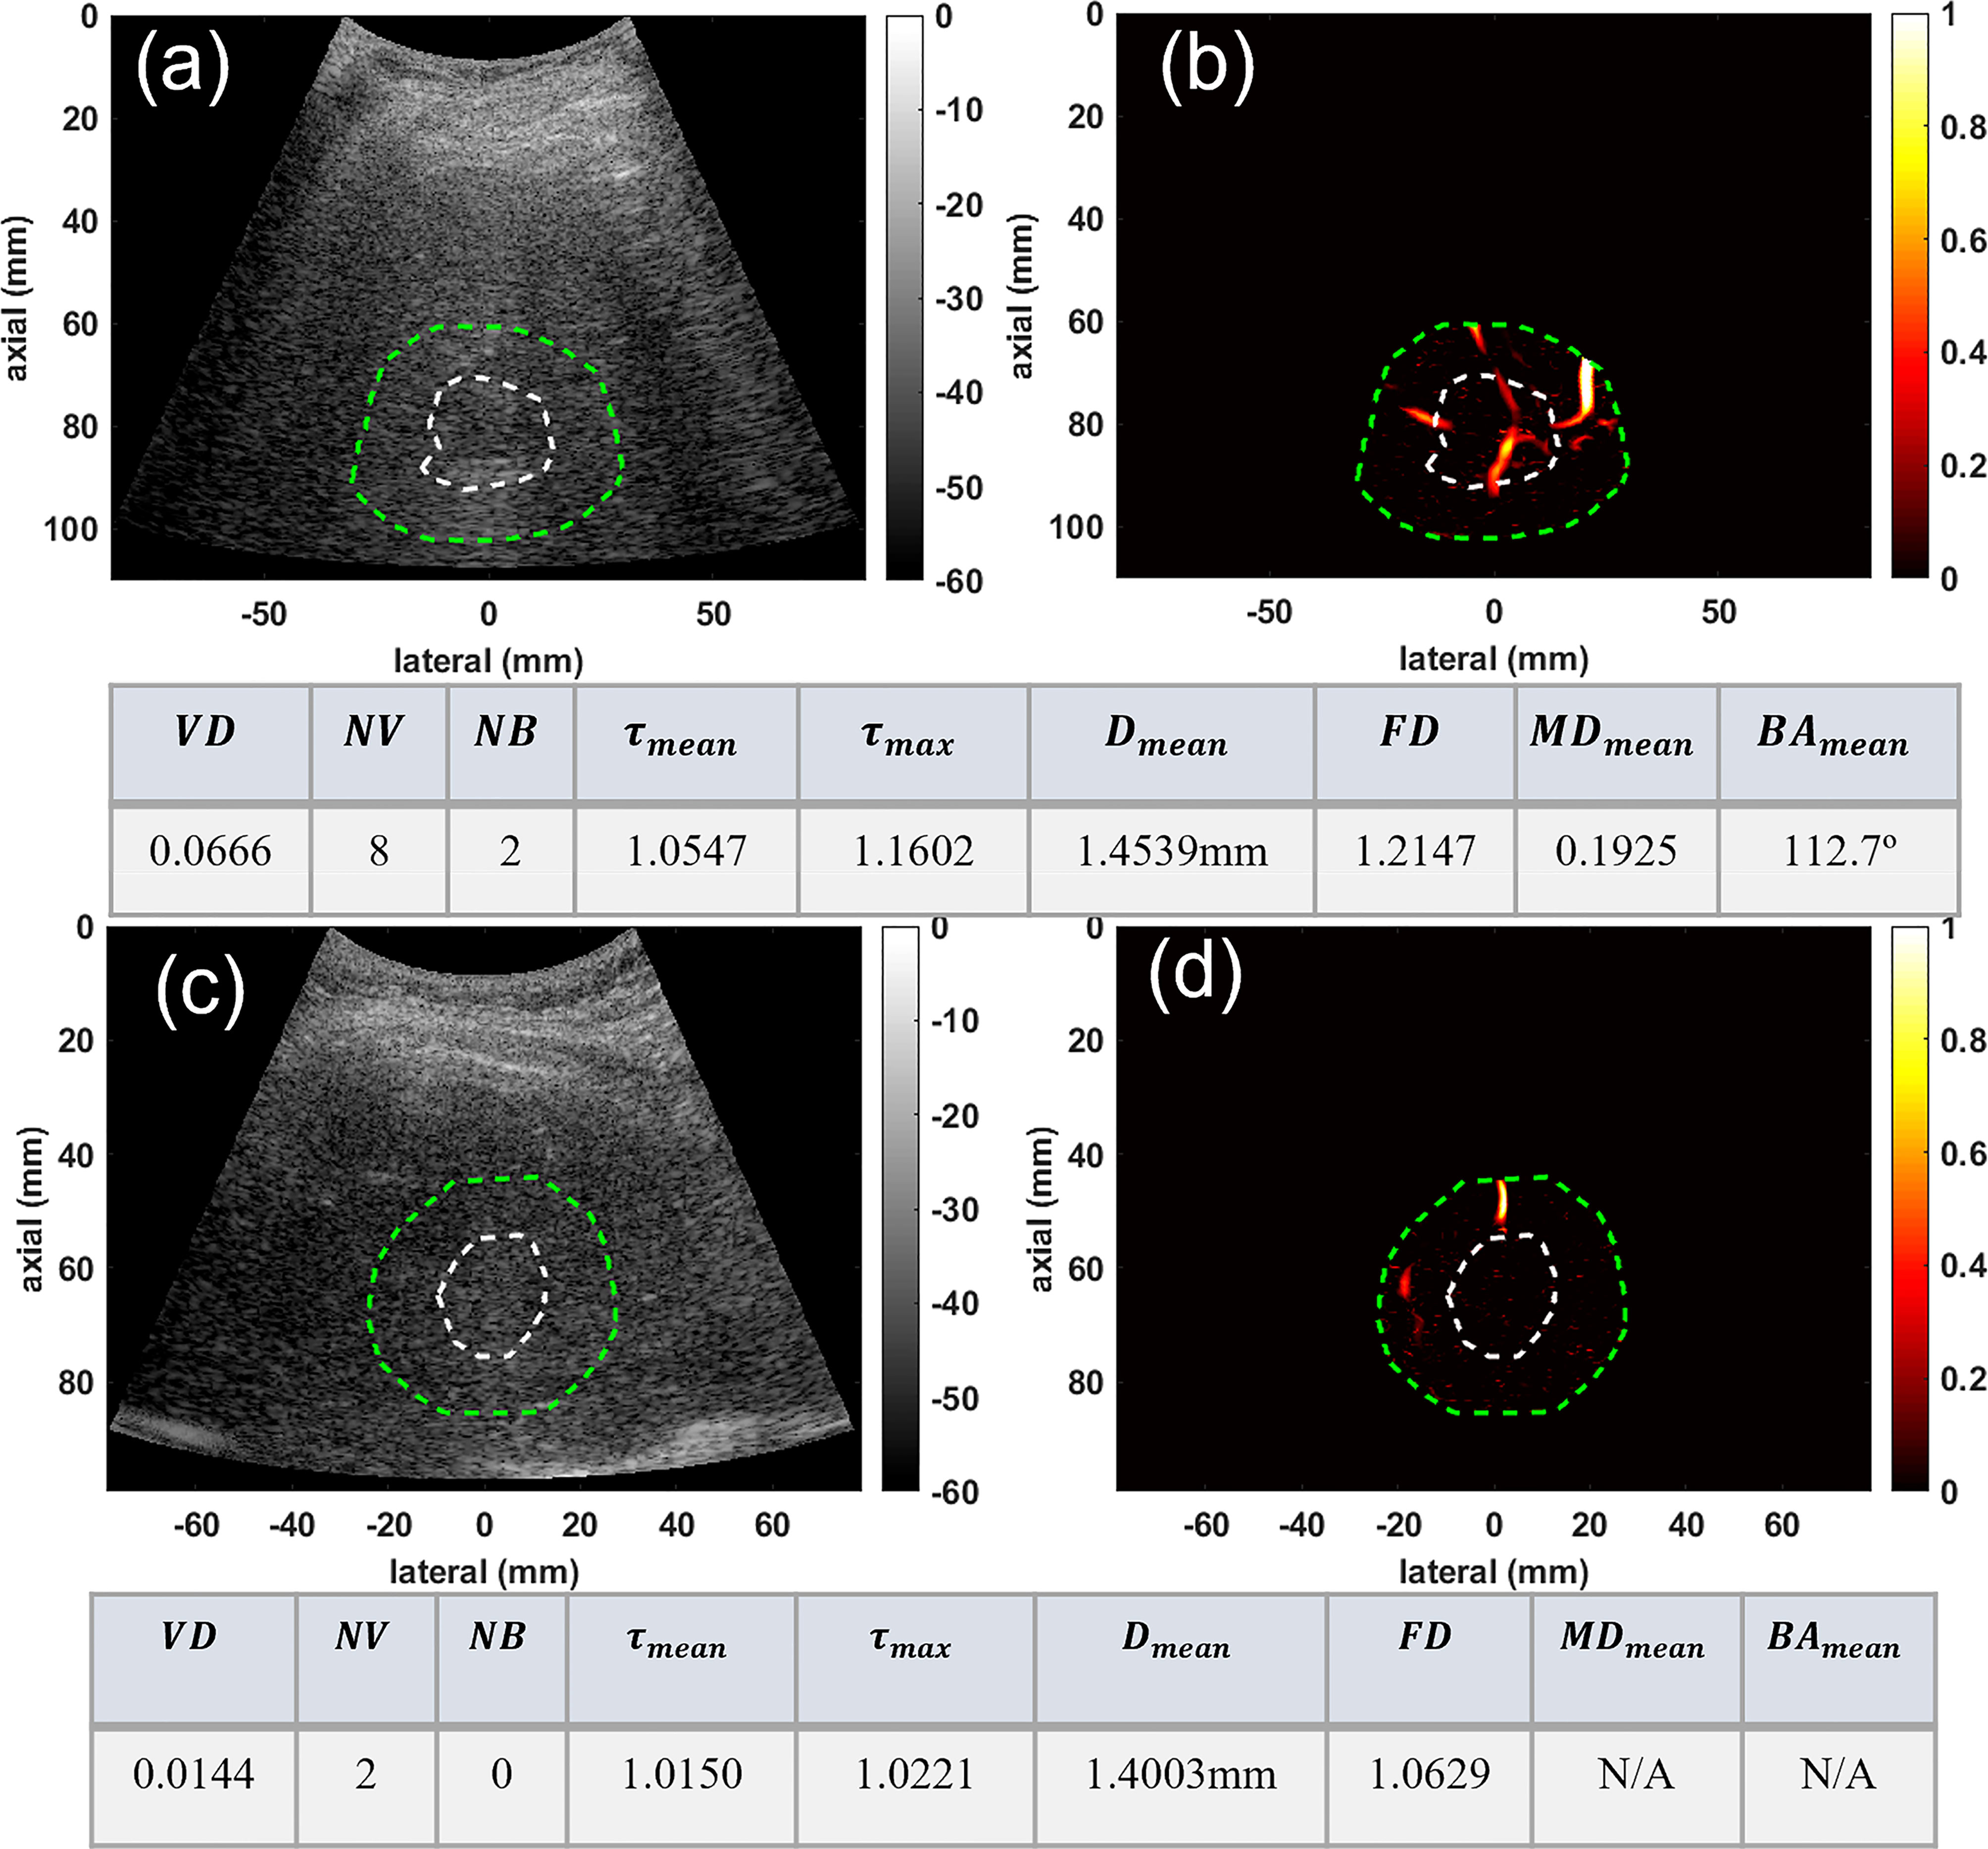
Figure 4 Visualization and quantification of small HCC and benign masses. (A) B-mode image of a 29mm HCC tumor (B) Microvasculature image inside the dilated HCC tumor mask (C) B-mode image of a 22mm benign lesion (D) Microvasculature image inside the dilated benign lesion mask. In all images the white dashed line indicates the boundaries of the lesion, and the green dashed line delineates the boundaries after a 10mm dilation. The tables below each row of images show metric values for the HCC (top) and benign (bottom) lesions.
3.2 Differentiating malignant from benign liver masses
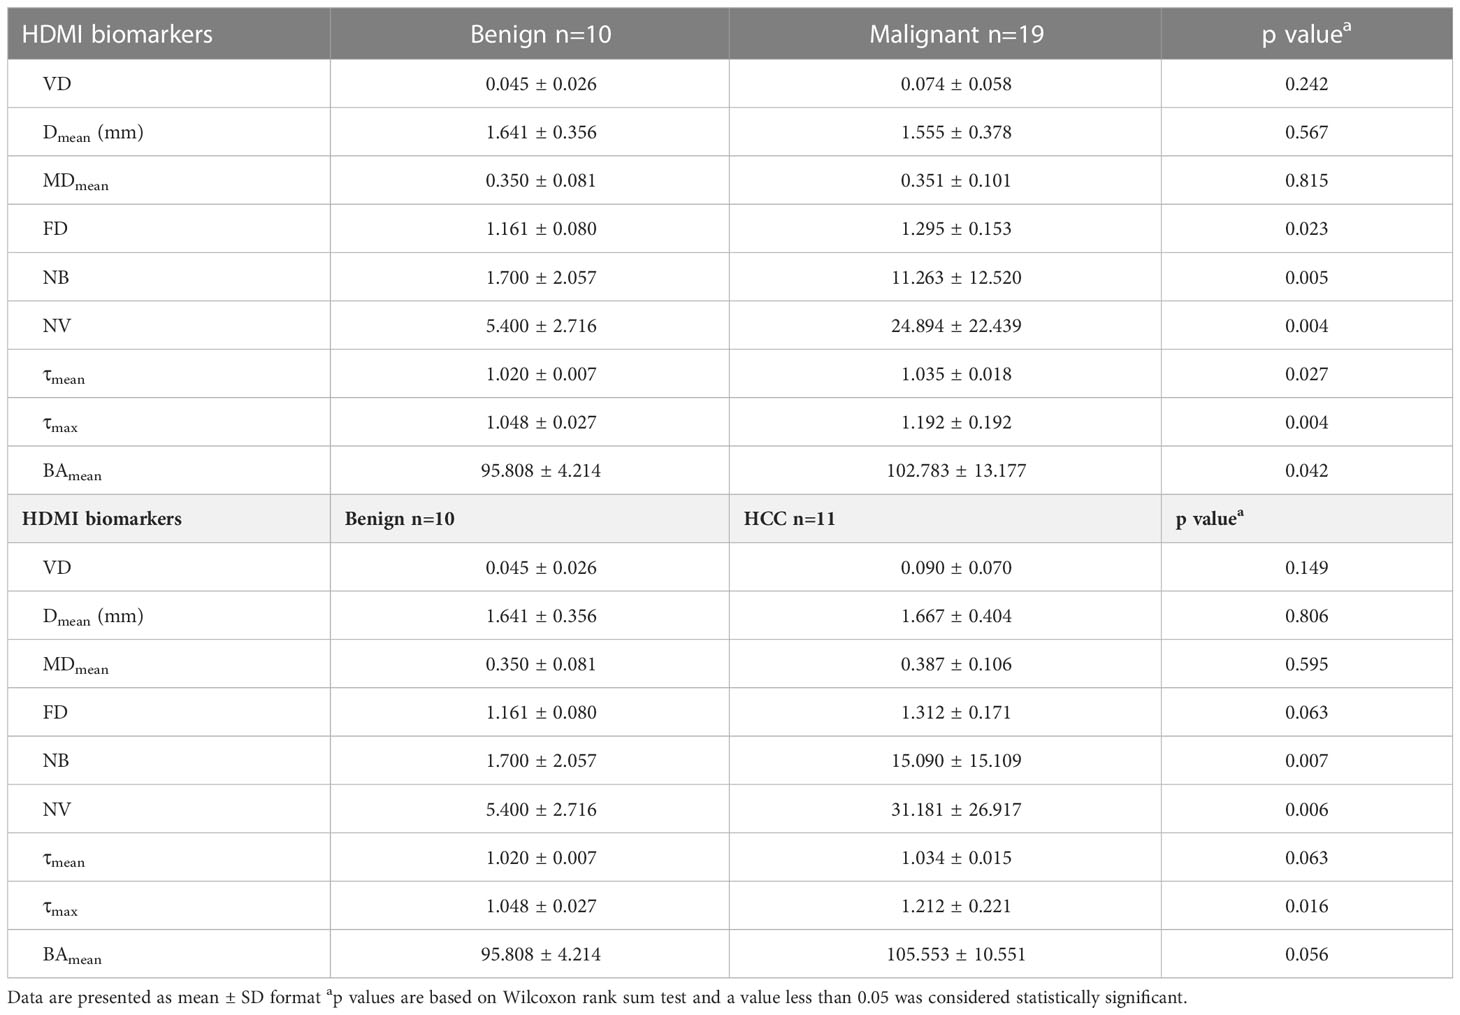
Out of the nine examined features in this study, six of them showed a statistically significant difference between benign and malignant lesions. These features included number of vessel segments (NV), number of branch points (NB), mean tortuosity (τmean), maximum tortuosity (τmax), fractal dimension (FD), and mean of bifurcation angle (BAmean). The corresponding p-values are 0.0035 for NV, 0.0042 for NB, 0.0260 for τmean, 0.0035 for τmax, 0.0231 for FD, and 0.0416 for BAmean.Figure 5 shows the distribution of these metrics. All the violin plots in this figure and subsequent figures are generated in MATLAB 2019a using Bechtold’s “Violin Plots for Matlab” package (49). Figure 5 shows composite boxplot/violin plots of distributions of features that exhibited statistically significant difference between benign and malignant lesions.
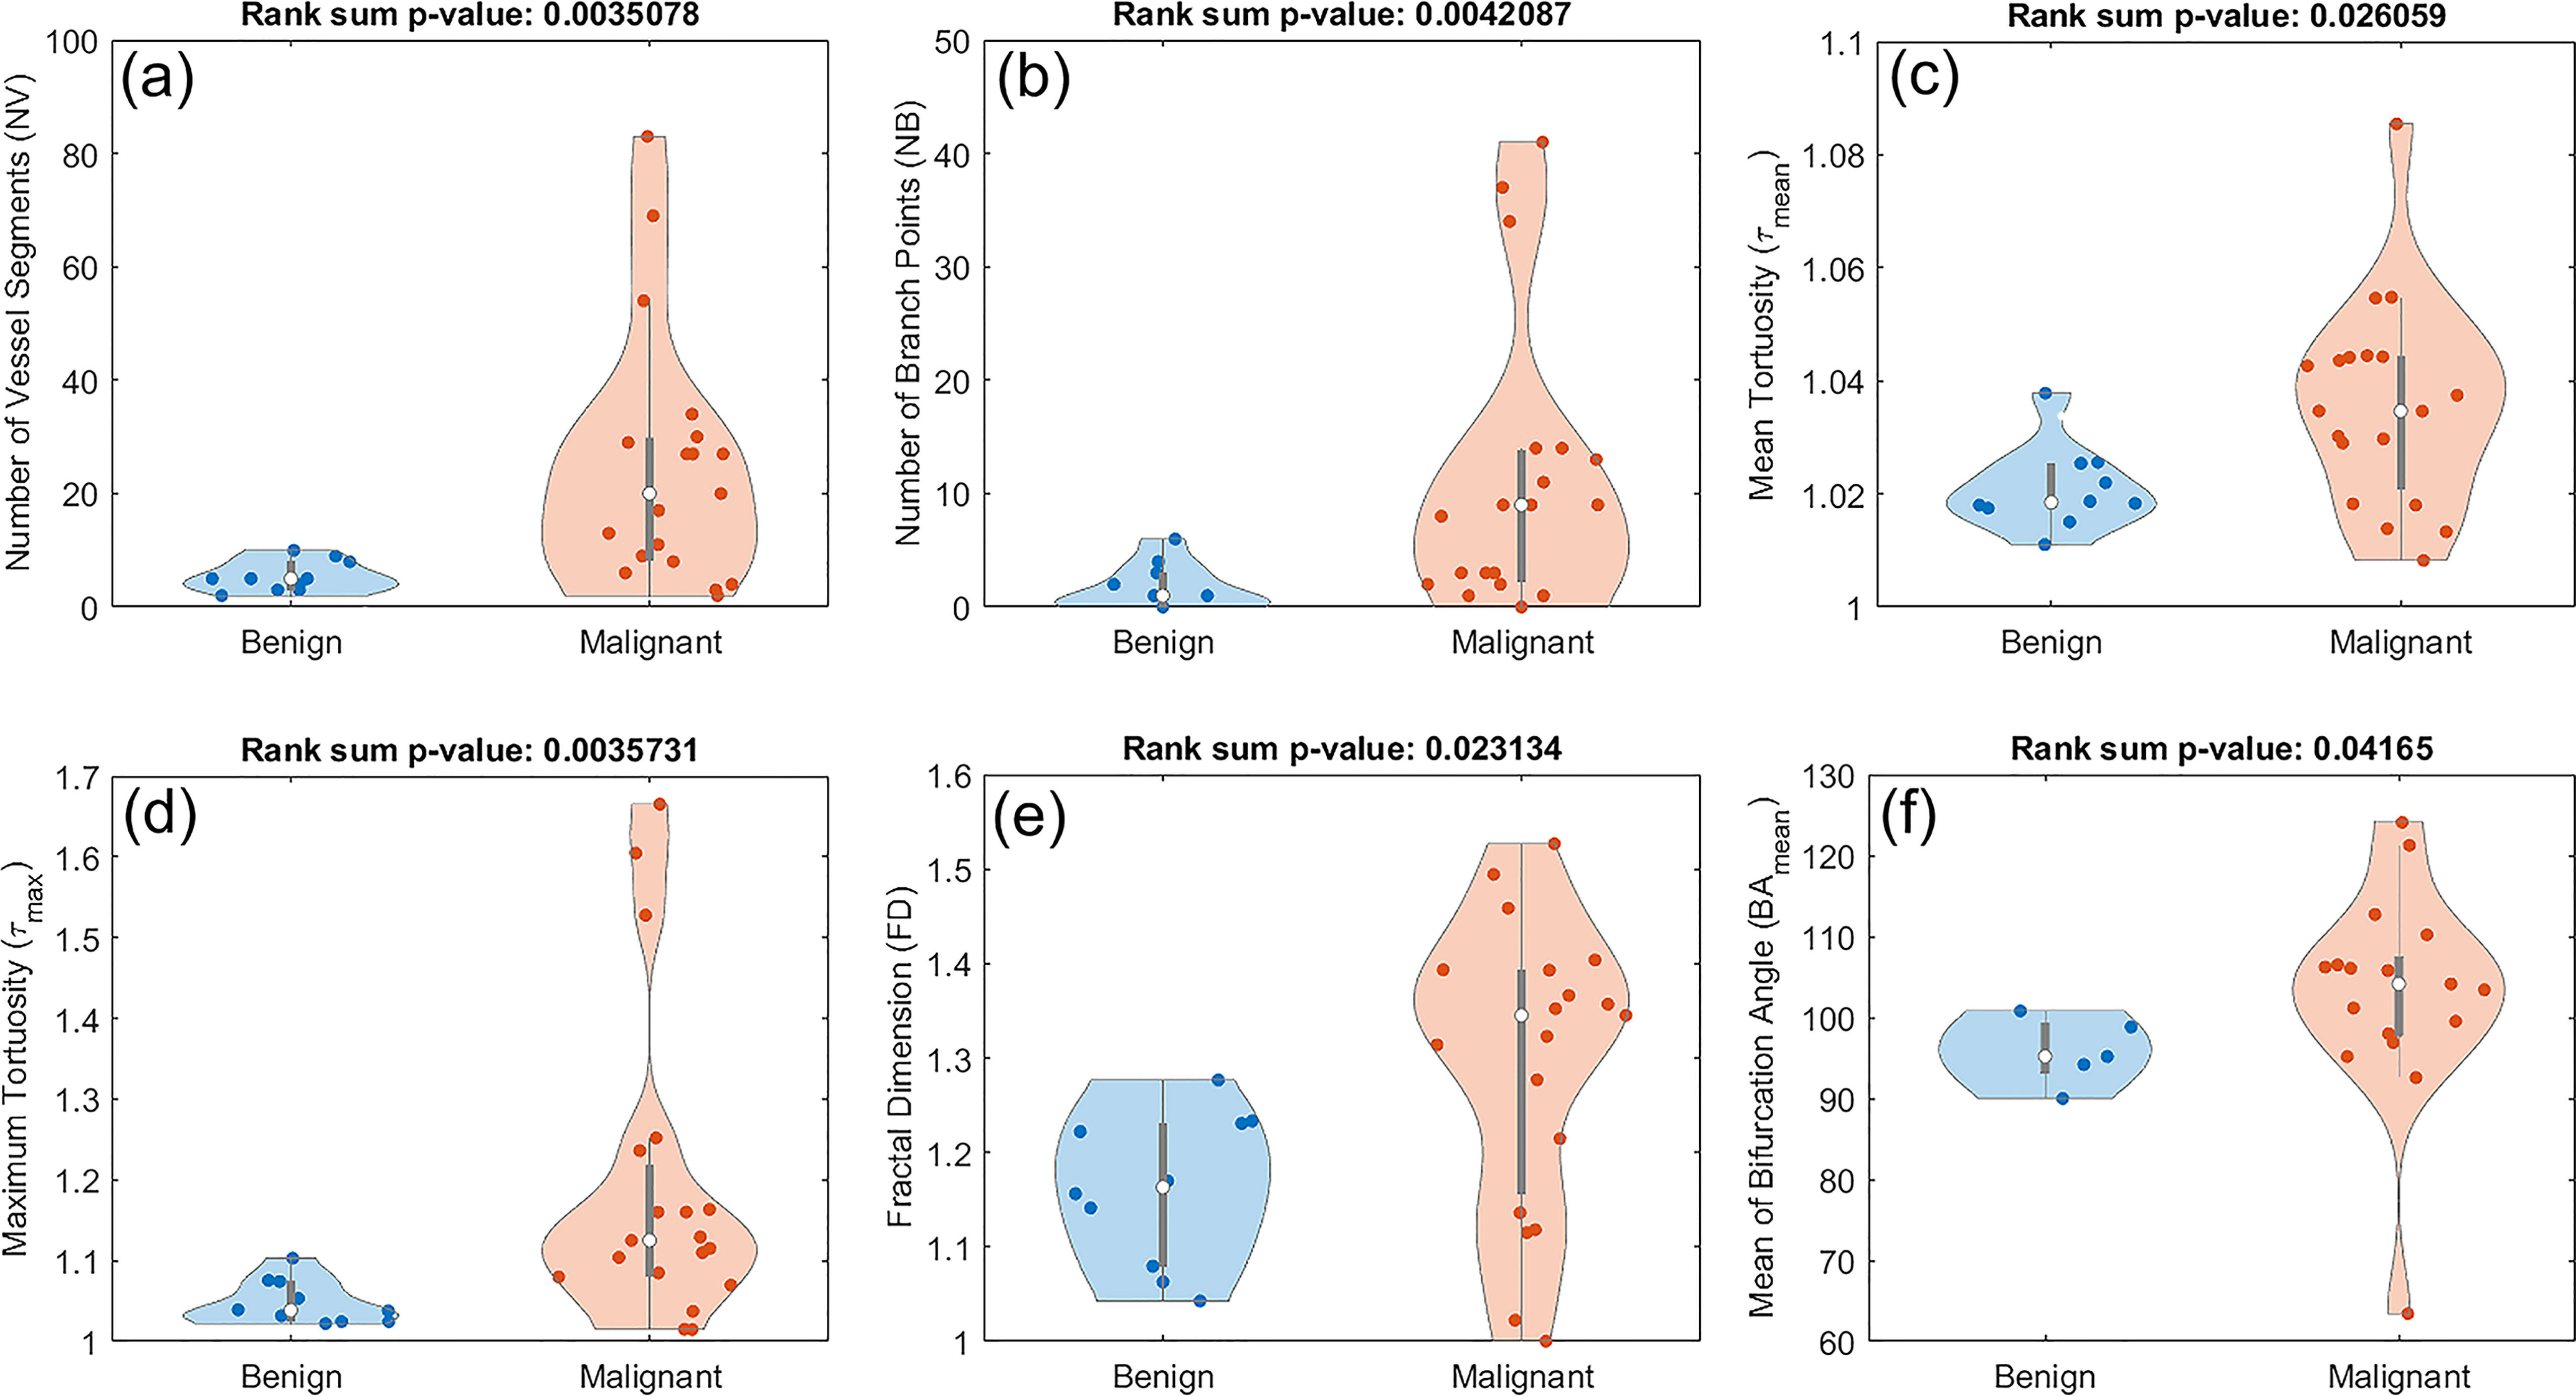
Figure 5 Composite boxplot/violin plots of distributions of features that exhibited statistically significant difference between benign and malignant lesions. (A) Number of vessel segments (NV) (B) Number of branch points (NB) (C) Mean tortuosity (τmean) (D) Maximum tortuosity (τmax). (E) Fractal dimension (FD) (F) Mean of bifurcation angle (BAmean).
Figure 6 shows the distribution of the six significant features for benign (blue lines) and malignant (orange lines) cases (figures on the diagonal). These plots are also in agreement with the violin plots and show the distinctive potential of these features between the two groups. The off-diagonal scatterplots depict the correlation between each pair of features for malignant (red dots) and benign (cyan dots). There is a correlation between some features such as NV, NB and FD, or similarly between τmean and τmax. However, a morphological feature such as bifurcation angle generally does not appear to be well-correlated with other metrics.
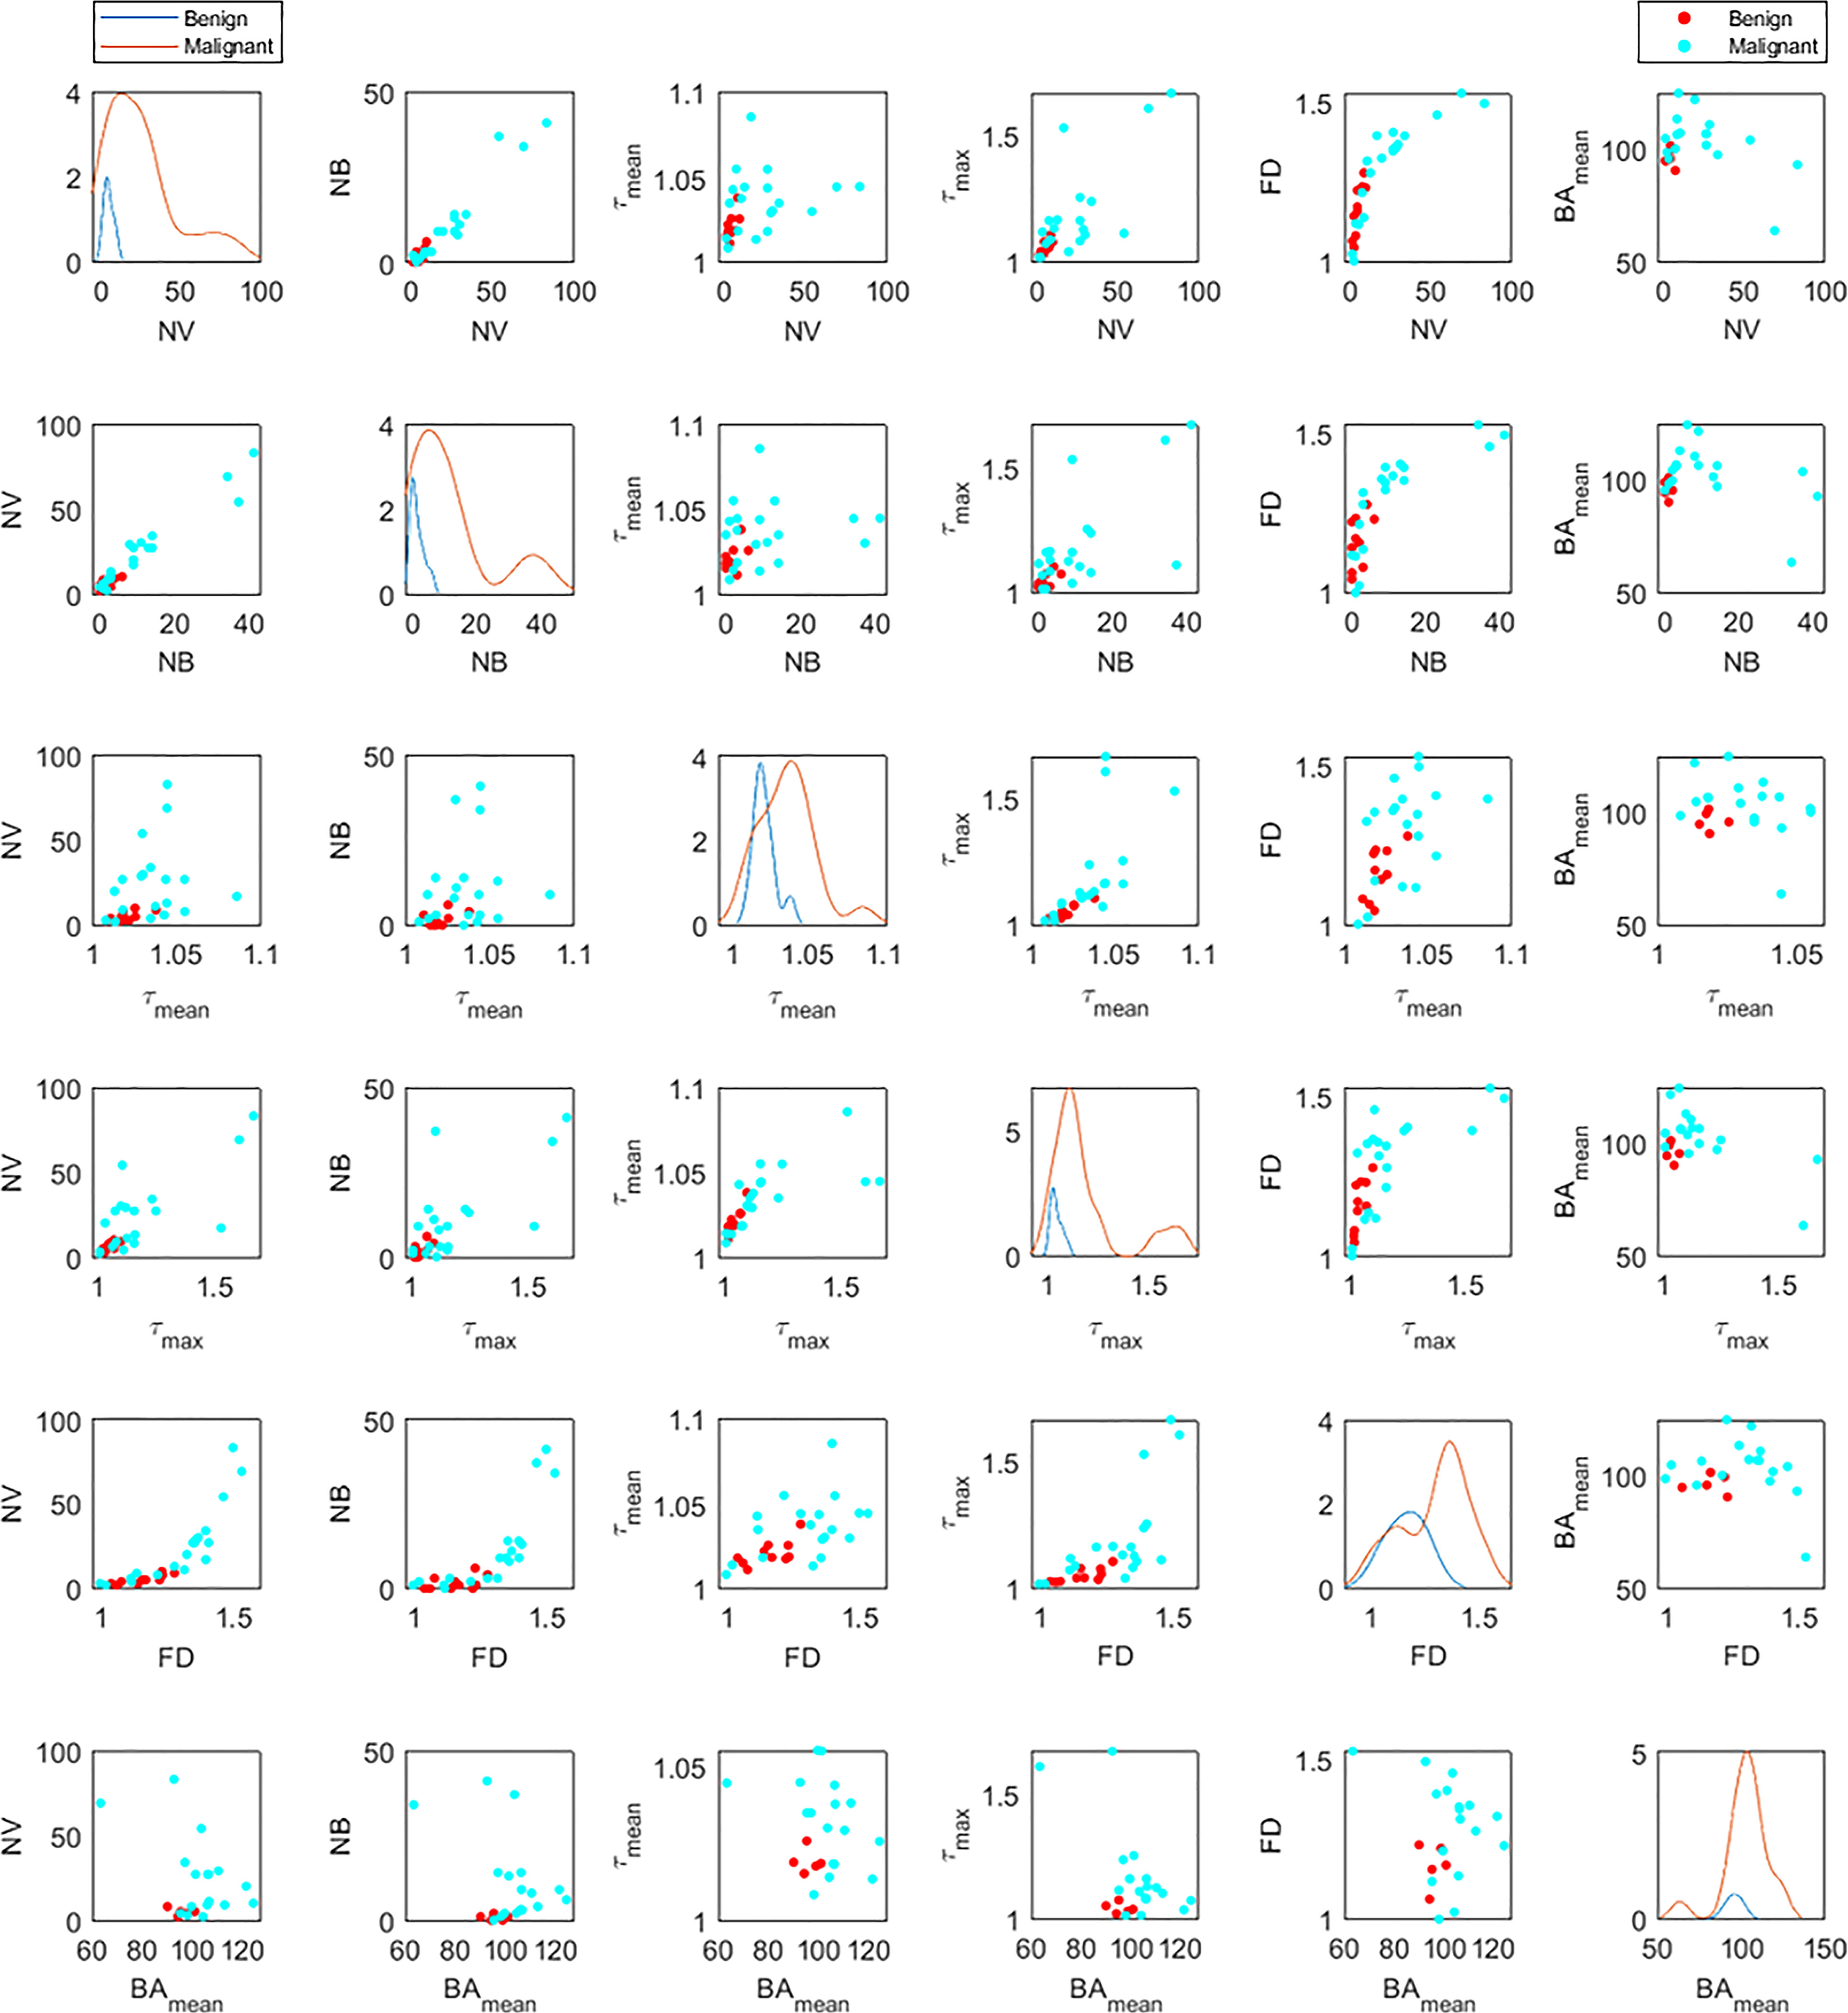
Figure 6 Distribution densities (diagonal) and bivariate scatterplots (off-diagonal) among statistically significant morphological variables for benign and malignant lesions. Variables include number of vessel segments (NV), number of branch points (NB), mean tortuosity (τmean), maximum tortuosity (τmax), fractal dimension (FD), and mean of bifurcation angle (BAmean). For each distribution graph (diagonal figures), the orange line corresponds to the malignant lesions and the blue to the benign ones. In the off-diagonal scatterplots, the red dots correspond to the malignant lesions and the cyan to the benign ones.
3.3 Differentiating HCC from benign liver masses
In this section we investigate whether the pool of only HCC lesions have enough distinctive features when compared to benign lesions. Using the rank sum test for the new set of classes, only three of the features have significantly distinct distributions. These include NV with a p-value of 0.0052, NB with a p-value of 0.0063, and τmax with a p-value of 0.0151. The distribution of these three metrics for this analysis are presented in Figure 7.

Figure 7 Composite boxplot/violin plots of distributions of features that exhibited statistically significant difference between benign lesions and HCC. (A) Number of vessel segments (NV) (B) Number of branch points (NB) (C) Maximum tortuosity (τmax).
The distributional summaries and analysis results of HDMI biomarkers for differentiation of benign and malignant as well as HCC and benign are detailed in Table 2.
3.4 Morphological features in HCC compared to other malignancies
To examine whether any observable distinctions can be found in the morphological characteristics of the vasculature in HCCs and other malignancies, we performed a similar statistical analysis comparing the two groups. As shown in Figure 8, no statistically significant difference was observed in any of the features under consideration. However, some patterns can be seen in some of the metrics. For instance, higher medians and wider distributions including higher tails can be seen in HCCs for metrics such as VD, NV, and NB.
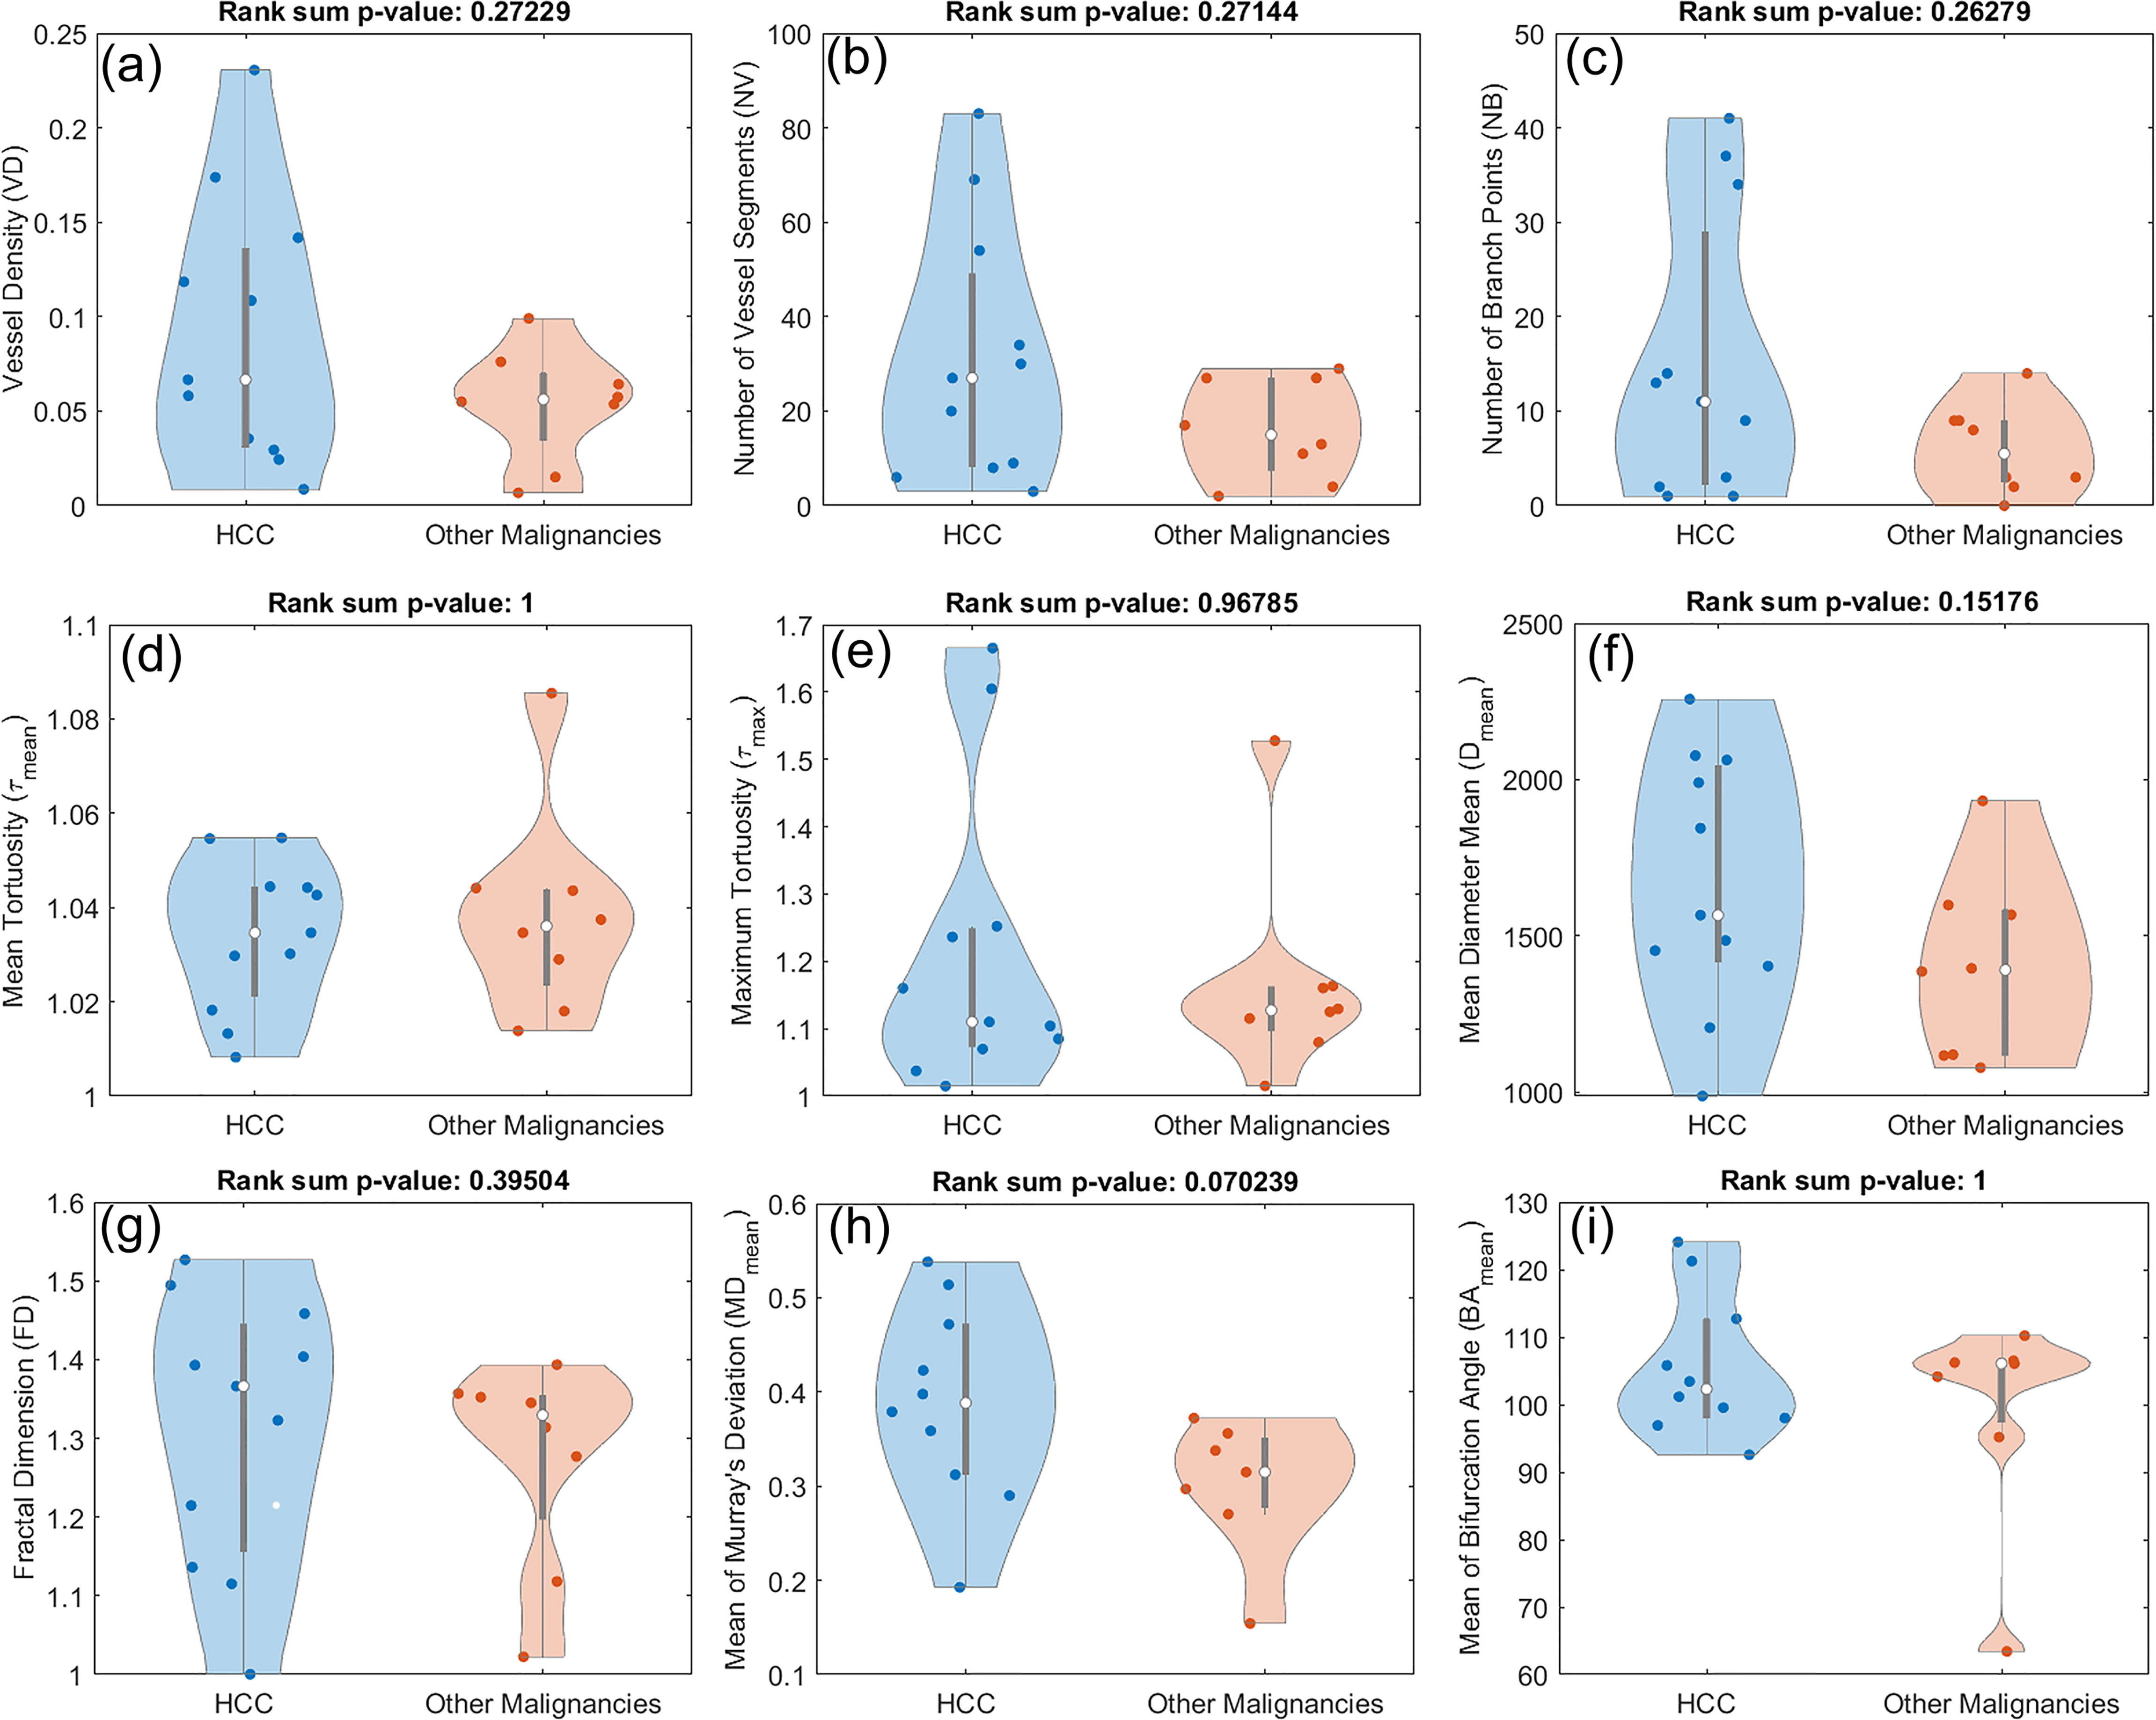
Figure 8 Composite boxplot/violin plots for all the utilized features in this study, comparing HCC with other malignant hepatic lesions (CCA and metastatic adenocarcinoma). None of the metrics proved distinctive between the two groups. (A) Vessel density (VD) (B) Number of vessel segments (NV) (B) Number of branch points (NB) (D) Mean tortuosity (τmean) (E) Maximum tortuosity (τmax) (F) Mean of mean diameter (Dmean) (G) Fractal dimension (FD) (H) Mean of Murray’s deviation (MDmean) (I) Mean of bifurcation angle (BAmean).
4 Discussion
This study investigated the discriminative potential of the quantitative biomarkers of contrast-free high-definition microvessel imaging (HDMI) for differentiating malignant and benign hepatic masses. Our findings show that HDMI biomarkers, NV, NB, FD, mean and maximum tortuosity (τmean and τmax) as well as BAmean showed significant distinctions between malignant and benign lesion groups. The current study also found that NV, NB, and τmax have better discrimination performance than any other individual biomarker in differentiating HCC from benign. Another finding of this study is that HDMI biomarkers did not show differences between HCC and other types of liver malignancies, however, the numbers of patients are not enough to draw a statistically meaningful conclusion.
HCC is a highly vascular tumor in which angiogenesis plays a major role in tumor growth and metastasis, with vascular endothelial growth factor being a major player in angiogenesis (50). A hallmark of new vessel formation in tumors is their structural and functional abnormality. This leads to an abnormal tumor microenvironment characterized by low oxygen tension (51, 52). Few studies have proposed ultrasound microvessel imaging for differentiation of liver mases with (53) and without (41) contrast agents, limited to a pixel count method and visual inspection of images for the assessment of vessel shapes and distribution. The current quantitative HDMI study includes a wide range of tumor microvessel morphological biomarkers tested on a group of patients with liver masses and objectively discriminates benign and malignant liver tumors. A further advantage of the proposed method is that the enhancement and visualization of tumor microvessels at the submillimeter level can be done without the need for contrast agents.
This research explores the performance of FD as a new biomarker of tumor microvessels in contrast-free ultrasound microvessel imaging for differentiation of liver masses. In the current study, FD was found to have higher values in malignant compared to benign liver lesions. This finding is in agreement with the results of other studies, indicating that microvascular complexity calculated by FD may provide important diagnostic and prognostic information as well as insight into tumor angiogenesis (54, 55). A similar observation was also found for vessel tortuosity. The mean and maximum vessel tortuosity were significantly higher in the malignant lesions compared to the benign liver lesions. This indicates that vessel tortuosity metric can offer complementary objective information and may offer an additive value in discrimination when benign and malignant tumors are both hypervascular (56). The increased numbers of vessel segments and branch points and in our study indicate a higher level of vessel sprouting, recommending them as discriminators for benign and malignant liver tumors (57). Moreover, we observed less correlation between metrics such as BAmean with others, which indicates it is capturing a different set of characteristics of the vasculature and suggesting that the added information coming from such metrics can be beneficial in designing predictive models in our future studies.
Visualization and quantification of vascular structures inside cancerous lesions can be used as a tool for early detection of malignant tumors in different organs. The current study demonstrated the capability of this new quantitative method in capturing angiogeneses in very small liver lesions as small as 16mm, which is in keeping with the shown capability of this method for detecting angiogenesis in breast lesions as small as 4mm (47). Early or very early-stage HCC, determined as a single tumor with the largest diameter of the lesion measuring less than 3cm and 2cm, respectively, is a distinct clinical entity with a high rate of surgical cure (58). Ultrasound imaging without the use of contrast agents as a non-invasive and inexpensive imaging modality is the most commonly utilized means of surveillance and screening liver malignancies and HCC in particular (59). Technologies enabling microvasculature visualization using ultrasound devices can be beneficial in more accurate detection of hepatic tumors, particularly at their earlier stages. The current study also observed lower VD, NV, NB, FD, and vessel diameter in intrahepatic cholangiocarcinomas than HCC. This is in agreement with the literature indicating that intrahepatic cholangiocarcinoma (CCA) is hypovascular relative to HCC, probably due to its extensive stroma, and can be differentiated from HCC by imaging angiogenesis (60, 61).
Results obtained in this work as a feasibility study indicate that there is a potential for contrast-free ultrasound microvessel imaging with subsequent morphological analysis for detection of HCCs. There is limited published experience focusing on the use of ultrasound for quantitative vascular imaging in hepatic lesions. Most of such studies either make use of contrast agents for improved resolution and contrast in the resulting images or employ available devices and technologies for blood flow imaging with limited quantitative capabilities.
While patients with very early-stage HCC have excellent clinical outcomes, with 5-year survival rates over 60 to 80% after curative treatments (62–64), diagnosing cancer at a very early-stage is technically challenging. Diagnosis of early HCC often requires multiphasic cross-sectional imaging, typically dynamic contrast-enhanced MRI or CT. Both very early and early-stage tumors are relatively small, but both are hypervascular in the arterial phase, with specific imaging features that facilitate the diagnosis of HCC (65). In addition to the high costs of MRI and CT, the characterization of HCC requires the use of intravenous contrast with associated risks in those patients with underlying renal disease. Therefore, US-based imaging and microvessel morphology analysis of tumor using HDMI offer promise for noninvasive assessment of HCC. Moreover, early diagnosis would assist in optimal treatment planning and reduce the burden on healthcare costs. HCC detected at an early stage may be treated with surgical resection or percutaneous treatment, both of which are potentially curative and may reduce the mortality of HCC in patients with cirrhosis (66). Very early-stage hepatocellular carcinoma patients are deemed too early for liver transplantation, as such strategies as surgical resection and thermal ablation have gained popularity (67). Quantitative HDMI can potentially be employed for noninvasive assessment of HCC treatment schemes.
One limitation associated with this study is that the sample size was small and as a result, more sophisticated statistical analysis and development of predictive models were not tenable. In the future, we plan to apply this method on a larger cohort of participants including smaller liver lesions suspected of malignancy for more accurate evaluation of its performance for early detection of HCC. Also, there is a potential for data degradation due to breathing motions. In the future we plan to utilize and expand the motion correction and denoising algorithms (68–72) to reduce potential motion artifacts. Our future direction also includes the use of deep learning technique (73, 74) to mitigate artifacts resulting from undesirable sources of motion.
5 Conclusions
Accurate diagnosis of hepatic lesions is a challenging task and is of even greater significance when it comes to aggressive tumors such as HCC. The use of accessible and inexpensive methods for early detection of such tumors can greatly help with accelerating and streamlining the treatment process for patients. In this feasibility study, we investigated the use of a non-invasive contrast-free ultrasound microvasculature imaging technique for detection of malignant hepatic lesions and HCC in particular. By evaluating the morphological features of microvasculature visualized using this method, we were able to differentiate between the malignant and benign lesions. Results of this feasibility study indicate the potential of this technique. In the future, we will focus more on the detection of early-stage HCC as well as investigating the possibility of discriminating between different hepatic malignancies.
Data availability statement
The raw data supporting the conclusions of this article will be made available by the authors, without undue reservation.
Ethics statement
The studies involving human participants were reviewed and approved by Mayo Clinic Institutional Review Board. The patients/participants provided their written informed consent to participate in this study.
Author contributions
Conceptualization, AA and MF. Methodology, AA and MF. Software, SS and RT. Validation, AA, MF, SS, NL, MO and TA. Formal Analysis, SS. Investigation, SS, RT, AA and MF. Resources AA and MF. Data Curation, SS and RT. Writing – SS. Writing – Review and Editing, SS, AA, MF, RT, NL, MO and TA. Visualization, SS and AA. Supervision, AA and MF. Project Administration, AA and MF. Funding Acquisition, AA and MF. All authors contributed to the article and approved the submitted version.
Funding
This work was supported in part by the grants from the National Cancer Institute at the National Institutes of Health, R01CA239548 and in part by the Mayo Clinic Ultrasound Research Center. The content is solely the responsibility of the authors and does not necessarily represent the official views of the NIH. The NIH did not have any additional role in the study design, data collection and analysis, decision to publish or preparation of the manuscript.
Acknowledgments
The authors would like to thank Mr. Duane Meixner, R.V.T., R.D.M.S., Ms. Kate Knoll, R.V.T., R.D.M.S for scanning patients, and Ms. Julie Simonson for their valuable help in patient recruitment.
Conflict of interest
Authors AA and MF, both hold US Patent 11,213,278 and patent EP 3 634 238 B1.
The remaining authors declare that the research was conducted in the absence of any commercial or financial relationships that could be construed as a potential conflict of interest.
Publisher’s note
All claims expressed in this article are solely those of the authors and do not necessarily represent those of their affiliated organizations, or those of the publisher, the editors and the reviewers. Any product that may be evaluated in this article, or claim that may be made by its manufacturer, is not guaranteed or endorsed by the publisher.
Supplementary material
The Supplementary Material for this article can be found online at: https://www.frontiersin.org/articles/10.3389/fonc.2023.1121664/full#supplementary-material
References
1. Singal AG, Lampertico P, Nahon P. Epidemiology and surveillance for hepatocellular carcinoma: New trends. J hepatology. (2020) 72(2):250–61. doi: 10.1016/j.jhep.2019.08.025
2. Zhu AX, Duda DG, Sahani DV, Jain RK. HCC and angiogenesis: possible targets and future directions. Nat Rev Clin Oncol (2011) 8(5):292–301. doi: 10.1038/nrclinonc.2011.30
3. Sung H, Ferlay J, Siegel RL, Laversanne M, Soerjomataram I, Jemal A, et al. Global cancer statistics 2020: GLOBOCAN estimates of incidence and mortality worldwide for 36 cancers in 185 countries. CA: Cancer J Clin (2021) 71(3):209–49. doi: 10.3322/caac.21660
4. Giannini EG, Cucchetti A, Erroi V, Garuti F, Odaldi F, Trevisani F. Surveillance for early diagnosis of hepatocellular carcinoma: how best to do it? World J gastroenterology: WJG (2013) 19(47):8808. doi: 10.3748/wjg.v19.i47.8808
5. Llovet JM, De Baere T, Kulik L, Haber PK, Greten TF, Meyer T, et al. Locoregional therapies in the era of molecular and immune treatments for hepatocellular carcinoma. Nat Rev Gastroenterol hepatology. (2021) 18(5):293–313. doi: 10.1038/s41575-020-00395-0
6. Tsuchiya N, Sawada Y, Endo I, Saito K, Uemura Y, Nakatsura T. Biomarkers for the early diagnosis of hepatocellular carcinoma. World J gastroenterology: WJG. (2015) 21(37):10573. doi: 10.3748/wjg.v21.i37.10573
7. Llovet JM, Bruix J. Novel advancements in the management of hepatocellular carcinoma in 2008. J hepatology. (2008) 48:S20–37. doi: 10.1016/j.jhep.2008.01.022
8. Volk ML, Marrero JA. Early detection of liver cancer: diagnosis and management. Curr Gastroenterol Rep (2008) 10(1):60–6. doi: 10.1007/s11894-008-0010-2
9. Ariff B, Lloyd CR, Khan S, Shariff M, Thillainayagam AV, Bansi DS, et al. Imaging of liver cancer. World J gastroenterology: WJG. (2009) 15(11):1289. doi: 10.3748/wjg.15.1289
10. Stefaniuk P, Cianciara J, Wiercinska-Drapalo A. Present and future possibilities for early diagnosis of hepatocellular carcinoma. World J gastroenterology: WJG. (2010) 16(4):418. doi: 10.3748/wjg.v16.i4.418
11. Shiani A, Narayanan S, Pena L, Friedman M. The role of diagnosis and treatment of underlying liver disease for the prognosis of primary liver cancer. Cancer control. (2017) 24(3):1073274817729240. doi: 10.1177/1073274817729240
12. Ayuso C, Rimola J, Vilana R, Burrel M, Darnell A, García-Criado Á, et al. Diagnosis and staging of hepatocellular carcinoma (HCC): current guidelines. Eur J radiology. (2018) 101:72–81. doi: 10.1016/j.ejrad.2018.01.025
13. Nam CY, Chaudhari V, Raman SS, Lassman C, Tong MJ, Busuttil RW, et al. CT and MRI improve detection of hepatocellular carcinoma, compared with ultrasound alone, in patients with cirrhosis. Clin Gastroenterol Hepatology. (2011) 9(2):161–7. doi: 10.1016/j.cgh.2010.09.017
14. Hanna RF, Miloushev VZ, Tang A, Finklestone LA, Brejt SZ, Sandhu RS, et al. Comparative 13-year meta-analysis of the sensitivity and positive predictive value of ultrasound, CT, and MRI for detecting hepatocellular carcinoma. Abdominal Radiology. (2016) 41(1):71–90. doi: 10.1007/s00261-015-0592-8
15. Osho A, Rich NE, Singal AG. Role of imaging in management of hepatocellular carcinoma: surveillance, diagnosis, and treatment response. Hepatoma Res (2020) 6:55. doi: 10.20517/2394-5079.2020.42
16. Bierig SM, Jones A. Accuracy and cost comparison of ultrasound versus alternative imaging modalities, including CT, MR, PET, and angiography. J Diagn Med Sonography. (2009) 25(3):138–44. doi: 10.1177/8756479309336240
17. Lee SS, Park SH. Radiologic evaluation of nonalcoholic fatty liver disease. World J gastroenterology: WJG. (2014) 20(23):7392. doi: 10.3748/wjg.v20.i23.7392
18. Folkman J. Tumor angiogenesis: therapeutic implications. New Engl J Med (1971) 285(21):1182–6. doi: 10.1056/NEJM197111182852108
19. Semela D, Dufour J-F. Angiogenesis and hepatocellular carcinoma. J hepatology. (2004) 41(5):864–80. doi: 10.1016/j.jhep.2004.09.006
20. Kamaya A, Maturen KE, Tye GA, Liu YI, Parti NN, Desser TS eds. Hypervascular liver lesions. In Seminars in Ultrasound, CT and MRI (2009) 30(5):387–407. WB Saunders
21. Morse MA, Sun W, Kim R, He AR, Abada PB, Mynderse M, et al. The role of angiogenesis in hepatocellular CarcinomaRole of angiogenesis in HCC. Clin Cancer Res (2019) 25(3):912–20. doi: 10.1158/1078-0432.CCR-18-1254
22. Burrel M, Llovet JM, Ayuso C, Iglesias C, Sala M, Miquel R, et al. MRI Angiography is superior to helical CT for detection of HCC prior to liver transplantation: an explant correlation. Hepatology (2003) 38(4):1034–42. doi: 10.1002/hep.1840380430
23. Ippolito D, Sironi S, Pozzi M, Antolini L, Ratti L, Alberzoni C, et al. Hepatocellular carcinoma in cirrhotic liver disease: functional computed tomography with perfusion imaging in the assessment of tumor vascularization. Acad radiology. (2008) 15(7):919–27. doi: 10.1016/j.acra.2008.02.005
24. Chen L, Zheng Y, Zhang H, Pan H, Liu Q, Zhou X, et al. Comparative analysis of tumor−associated vascular changes following TACE alone or in combination with sorafenib treatment in HCC: A retrospective study. Oncol Letters. (2018) 16(3):3690–8. doi: 10.3892/ol.2018.9055
25. Duan J, Hu C, Qiu Q, Zhang J, Meng H, Wang K, et al. Characterization of microvessels and parenchyma in in-line phase contrast imaging CT: Healthy liver, cirrhosis and hepatocellular carcinoma. Quantitative Imaging Med Surgery. (2019) 9(6):1037. doi: 10.21037/qims.2019.06.12
26. Tanaka S, Kitamura T, Fujita M, Nakanishi K, Okuda S. Color Doppler flow imaging of liver tumors. AJR Am J roentgenology. (1990) 154(3):509–14. doi: 10.2214/ajr.154.3.2154912
27. Lencioni R, Pinto F, Armillotta N, Bartolozzi C. Assessment of tumor vascularity in hepatocellular carcinoma: comparison of power Doppler US and color Doppler US. Radiology (1996) 201(2):353–8. doi: 10.1148/radiology.201.2.8888222
28. Kim AY, Choi BI, Kim TK, Han JK, Yun EJ, Lee KY, et al. Hepatocellular carcinoma: power Doppler US with a contrast agent–preliminary results. Radiology (1998) 209(1):135–40. doi: 10.1148/radiology.209.1.9769824
29. Choi BI, Kim TK, Han JK, Kim AY, Seong CK, Park SJ. Vascularity of hepatocellular carcinoma: assessment with contrast-enhanced secondharmonic versus conventional power Doppler US. Radiology (2000) 214(2):381–6. doi: 10.1148/radiology.214.2.r00fe01381
30. Gaiani S, Casali A, Serra C, Piscaglia F, Gramantieri L, Volpe L, et al. Assessment of vascular patterns of small liver mass lesions: value and limitation of the different Doppler ultrasound modalities. Am J gastroenterology. (2000) 95(12):3537–46. doi: 10.1111/j.1572-0241.2000.03372.x
31. Xu H-X, Liu L, Lu M-D, Li H-P, Liu G-J, Li J-P. Three-dimensional power Doppler imaging in depicting vascularity in hepatocellular carcinoma. J ultrasound Med (2003) 22(11):1147–54. doi: 10.7863/jum.2003.22.11.1147
32. Quaia E, D'Onofrio M, Cabassa P, Vecchiato F, Caffarri S, Pittiani F, et al. Diagnostic value of hepatocellular nodule vascularity after microbubble injection for characterizing malignancy in patients with cirrhosis. AJR Am J roentgenology. (2007) 189(6):1474. doi: 10.2214/AJR.07.2122
33. Lee DH, Lee JY, Han JK. Superb microvascular imaging technology for ultrasound examinations: Initial experiences for hepatic tumors. Eur J radiology. (2016) 85(11):2090–5. doi: 10.1016/j.ejrad.2016.09.026
34. He M-N, Lv K, Jiang Y-X, Jiang T-A. Application of superb microvascular imaging in focal liver lesions. World J Gastroenterology. (2017) 23(43):7765. doi: 10.3748/wjg.v23.i43.7765
35. Dubinsky TJ, Revels J, Wang S, Toia G, Sonneborn R, Hippe DS, et al. Comparison of superb microvascular imaging with color flow and power Doppler imaging of small hepatocellular carcinomas. J Ultrasound Med (2018) 37(12):2915–24. doi: 10.1002/jum.14654
36. Kang H-J, Lee JM, Jeon SK, Ryu H, Yoo J, Lee JK, et al. Microvascular flow imaging of residual or recurrent hepatocellular carcinoma after transarterial chemoembolization: comparison with color/power doppler imaging. Korean J Radiology. (2019) 20(7):1114–23. doi: 10.3348/kjr.2018.0932
37. Han H, Ding H, Ji Z, Zhang W, Wang Q, Wang W. Primary application of micro-flow imaging technology in the diagnosis of hepatic tumors. Ultrasound Med Biol (2019) 45(2):395–401. doi: 10.1016/j.ultrasmedbio.2018.09.025
38. Tierney J, Baker J, Borgmann A, Brown D, Byram B. Non-contrast power Doppler ultrasound imaging for early assessment of trans-arterial chemoembolization of liver tumors. Sci Rep (2019) 9(1):1–12. doi: 10.1038/s41598-019-49448-8
39. Bae JS, Lee JM, Jeon SK, Jang S. Comparison of MicroFlow imaging with color and power Doppler imaging for detecting and characterizing blood flow signals in hepatocellular carcinoma. Ultrasonography (2020) 39(1):85. doi: 10.14366/usg.19033
40. Brannigan M, Burns PN, Wilson SR. Blood flow patterns in focal liver lesions at microbubble-enhanced US. Radiographics (2004) 24(4):921–35. doi: 10.1148/rg.244035158
41. Yang F, Zhao J, Liu C, Mao Y, Mu J, Wei X, et al. Superb microvascular imaging technique in depicting vascularity in focal liver lesions: more hypervascular supply patterns were depicted in hepatocellular carcinoma. Cancer Imaging. (2019) 19(1):1–11. doi: 10.1186/s40644-019-0277-6
42. Oezdemir I, Wessner CE, Shaw C, Eisenbrey JR, Hoyt K. Tumor vascular networks depicted in contrast-enhanced ultrasound images as a predictor for transarterial chemoembolization treatment response. Ultrasound Med Biol (2020) 46(9):2276–86. doi: 10.1016/j.ultrasmedbio.2020.05.010
43. Bayat M, Fatemi M, Alizad A. Background removal and vessel filtering of noncontrast ultrasound images of microvasculature. IEEE Trans Biomed Engineering. (2018) 66(3):831–42. doi: 10.1109/TBME.2018.2858205
44. Ghavami S, Bayat M, Fatemi M, Alizad A. Quantification of morphological features in non-contrast-enhanced ultrasound microvasculature imaging. IEEE Access. (2020) 8:18925–37. doi: 10.1109/ACCESS.2020.2968292
45. Ternifi R, Wang Y, Polley EC, Fazzio RT, Fatemi M, Alizad A. Quantitative biomarkers for cancer detection using contrast-free ultrasound high-definition microvessel imaging: fractal dimension, murray’s deviation, bifurcation angle & spatial vascularity pattern. IEEE Trans Med imaging. (2021) 40(12):3891–900. doi: 10.1109/TMI.2021.3101669
46. Ternifi R, Wang Y, Gu J, Polley EC, Carter JM, Pruthi S, et al. Ultrasound high-definition microvasculature imaging with novel quantitative biomarkers improves breast cancer detection accuracy. Eur radiology. (2022) 32(11):7448–7462. doi: 10.1007/s00330-022-08815-2
47. Gu J, Ternifi R, Larson NB, Carter JM, Boughey JC, Stan DL, et al. Hybrid high-definition microvessel imaging/shear wave elastography improves breast lesion characterization. Breast Cancer Res (2022) 24(1):1–13. doi: 10.1186/s13058-022-01511-5
48. Montaldo G, Tanter M, Bercoff J, Benech N, Fink M. Coherent plane-wave compounding for very high frame rate ultrasonography and transient elastography. IEEE Trans ultrasonics ferroelectrics frequency control. (2009) 56(3):489–506. doi: 10.1109/TUFFC.2009.1067
49. Bechtold B, Fletcher P, seamusholden, Gorur-Shandilya S. bastibe/Violinplot-Matlab: A good starting point (v0.1). Zenodo (2021). doi: 10.5281/zenodo.4559847
50. Moawad AW, Szklaruk J, Lall C, Blair KJ, Kaseb AO, Kamath A, et al. Angiogenesis in hepatocellular carcinoma; pathophysiology, targeted therapy, and role of imaging. J hepatocellular carcinoma. (2020) 7:77. doi: 10.2147/JHC.S224471
51. Nagy J, Chang SH, Dvorak AM, Dvorak HF. Why are tumour blood vessels abnormal and why is it important to know? Br J Cancer (2009) 100(6):865–9. doi: 10.1038/sj.bjc.6604929
52. Xiao C-l, Zhong Z-p, Lü C, Guo B-j, Chen J-j, Zhao T, et al. Physical exercise suppresses hepatocellular carcinoma progression by alleviating hypoxia and attenuating cancer stemness through the Akt/GSK-3β/β-catenin pathway. J Integr Med (2023). doi: 10.1016/j.joim.2023.01.002
53. Nicolau C, Catalá V, Vilana R, Gilabert R, Bianchi L, Solé M, et al. Evaluation of hepatocellular carcinoma using SonoVue, a second generation ultrasound contrast agent: correlation with cellular differentiation. Eur radiology. (2004) 14(6):1092–9. doi: 10.1007/s00330-004-2298-0
54. Sabo E, Boltenko A, Sova Y, Stein A, Kleinhaus S, Resnick MB. Microscopic analysis and significance of vascular architectural complexity in renal cell carcinoma. Clin Cancer Res (2001) 7(3):533–7.
55. Chen C, Z-c H, Shi Y, Zhou W, Zhang X, Xiao H-l, et al. Microvascular fractal dimension predicts prognosis and response to chemotherapy in glioblastoma: an automatic image analysis study. Lab Invest (2018) 98(7):924–34. doi: 10.1038/s41374-018-0055-2
56. Bullitt E, Zeng D, Gerig G, Aylward S, Joshi S, Smith JK, et al. Vessel tortuosity and brain tumor malignancy: a blinded study1. Acad radiology. (2005) 12(10):1232–40. doi: 10.1016/j.acra.2005.05.027
57. Chappell JC, Wiley DM, Bautch VL. How blood vessel networks are made and measured. Cells Tissues Organs. (2012) 195(1-2):94–107. doi: 10.1159/000331398
58. Inoue K, Takayama T, Higaki T, Watanabe Y, Makuuchi M. Clinical significance of early hepatocellular carcinoma. Liver transplantation. (2004) 10(S2):S16–S9. doi: 10.1002/lt.20049
59. Morgan TA, Maturen KE, Dahiya N, Sun MR, Kamaya A. US LI-RADS: ultrasound liver imaging reporting and data system for screening and surveillance of hepatocellular carcinoma. Abdominal Radiology. (2018) 43(1):41–55. doi: 10.1007/s00261-017-1317-y
60. Banales JM, Marin JJ, Lamarca A, Rodrigues PM, Khan SA, Roberts LR, et al. Cholangiocarcinoma 2020: the next horizon in mechanisms and management. Nat Rev Gastroenterol Hepatology. (2020) 17(9):557–88. doi: 10.1038/s41575-020-0310-z
61. Fujita N, Asayama Y, Nishie A, Ishigami K, Ushijima Y, Takayama Y, et al. Mass-forming intrahepatic cholangiocarcinoma: Enhancement patterns in the arterial phase of dynamic hepatic CT-correlation with clinicopathological findings. Eur radiology. (2017) 27(2):498–506. doi: 10.1007/s00330-016-4386-3
62. Takayama T, Makuuchi M, Kojiro M, Lauwers GY, Adams RB, Wilson SR, et al. Early hepatocellular carcinoma: pathology, imaging, and therapy. Ann Surg Oncol (2008) 15:972–8. doi: 10.1245/s10434-007-9685-0
63. Roayaie S, Obeidat K, Sposito C, Mariani L, Bhoori S, Pellegrinelli A, et al. Resection of hepatocellular cancer≤ 2 cm: results from two Western centers. Hepatology (2013) 57(4):1426–35. doi: 10.1002/hep.25832
64. Hasegawa K, Kokudo N, Makuuchi M, Izumi N, Ichida T, Kudo M, et al. Comparison of resection and ablation for hepatocellular carcinoma: a cohort study based on a Japanese nationwide survey. J hepatology. (2013) 58(4):724–9. doi: 10.1016/j.jhep.2012.11.009
65. Kudo M. Early hepatocellular carcinoma: definition and diagnosis. Liver cancer. (2013) 2(2):69. doi: 10.1159/000343842
66. Yang JD, Mannalithara A, Piscitello AJ, Kisiel JB, Gores GJ, Roberts LR, et al. Impact of surveillance for hepatocellular carcinoma on survival in patients with compensated cirrhosis. Hepatology (2018) 68(1):78–88. doi: 10.1002/hep.29594
67. Sapisochin G, de Sevilla EF, Echeverri J, Charco R. Management of “very early” hepatocellular carcinoma on cirrhotic patients. World J Hepatology. (2014) 6(11):766. doi: 10.4254/wjh.v6.i11.766
68. Nayak R, Kumar V, Webb J, Fatemi M, Alizad A. Non-invasive small vessel imaging of human thyroid using motion-corrected spatiotemporal clutter filtering. Ultrasound Med Biol (2019) 45(4):1010–8. doi: 10.1016/j.ultrasmedbio.2018.10.028
69. Nayak R, Kumar V, Webb J, Gregory A, Fatemi M, Alizad A. Non-contrast agent based small vessel imaging of human thyroid using motion corrected power Doppler imaging. Sci Rep (2018) 8(1):1–15. doi: 10.1038/s41598-018-33602-9
70. Nayak R, MacNeill J, Flores C, Webb J, Fatemi M, Alizad A. Quantitative assessment of ensemble coherency in contrast-free ultrasound microvasculature imaging. Med physics. (2021) 48(7):3540–58. doi: 10.1002/mp.14918
71. Adabi S, Ghavami S, Fatemi M, Alizad A. Non-local based denoising framework for in vivo contrast-free ultrasound microvessel imaging. Sensors (2019) 19(2):245. doi: 10.3390/s19020245
72. Nayak R, Fatemi M, Alizad A. Adaptive background noise bias suppression in contrast-free ultrasound microvascular imaging. Phys Med Biol (2019) 64(24):245015. doi: 10.1088/1361-6560/ab5879
73. Pawar K, Chen Z, Shah NJ, Egan GF eds. (2018). Motion correction in MRI using deep convolutional neural network. In Proceedings of the ISMRM Scientific Meeting & Exhibition, Paris (Vol. 1174).
Keywords: angiogenesis, flow imaging, hepatocellular carcinoma, liver tumors, contrast-free ultrasound
Citation: Sabeti S, Ternifi R, Larson NB, Olson MC, Atwell TD, Fatemi M and Alizad A (2023) Morphometric analysis of tumor microvessels for detection of hepatocellular carcinoma using contrast-free ultrasound imaging: A feasibility study. Front. Oncol. 13:1121664. doi: 10.3389/fonc.2023.1121664
Received: 12 December 2022; Accepted: 21 March 2023;
Published: 13 April 2023.
Edited by:
Chang-quan Ling, Second Military Medical University, ChinaReviewed by:
Wenwu Ling, Sichuan University, ChinaMing Xu, The First Affiliated Hospital of Sun Yat-sen University, China
Xilin Feng, Fudan University, China
Copyright © 2023 Sabeti, Ternifi, Larson, Olson, Atwell, Fatemi and Alizad. This is an open-access article distributed under the terms of the Creative Commons Attribution License (CC BY). The use, distribution or reproduction in other forums is permitted, provided the original author(s) and the copyright owner(s) are credited and that the original publication in this journal is cited, in accordance with accepted academic practice. No use, distribution or reproduction is permitted which does not comply with these terms.
*Correspondence: Azra Alizad, QWxpemFkLmF6cmFAbWF5by5lZHU=
†Present address: Redouane Ternifi, Department Imaging and Animal Model, Bracco Suisse S.A., Geneva, Switzerland
 Soroosh Sabeti1
 Nicholas B. Larson
 Thomas D. Atwell
 Azra Alizad