 Honglei Wang
 Jinqiao Li2,3
- 1Department of Urology, Harbin Medical University Cancer Hospital, Harbin, China
- 2Heilongjiang Key Laboratory of Scientific Research in Urology, Fourth Hospital of Harbin Medical University, Harbin, China
- 3National Health Commission (NHC) Key Laboratory of Molecular Probes and Targeted Diagnosis and Therapy, Harbin Medical University, Harbin, China
- 4Department of Medical Oncology, Fourth Hospital of Harbin Medical University, Harbin, China
Cuproptosis, a newly discovered form of programmed cell death, plays a vital role in the occurrence and development of tumors. However, the role of cuproptosis in the bladder cancer tumor microenvironment remains unclear. In this study, we developed a method for predicting the prognostic outcomes and guiding the treatment selection for patients with bladder cancer. We obtained 1001 samples and survival data points from The Cancer Genome Atlas database and Gene Expression Omnibus database. Using cuproptosis-related genes (CRGs) identified in previous studies, we analyzed CRG transcriptional changes and identified two molecular subtypes, namely high- and low-risk patients. The prognostic features of eight genes (PDGFRB, COMP, GREM1, FRRS1, SDHD, RARRES2, CRTAC1, and HMGCS2) were determined. The CRG molecular typing and risk scores were correlated with clinicopathological features, prognosis, tumor microenvironment cell infiltration characteristics, immune checkpoint activation, mutation burden, and chemotherapy drug sensitivity. Additionally, we constructed an accurate nomogram to improve the clinical applicability of the CRG_score. qRT-PCR was used to detect the expression levels of eight genes in bladder cancer tissues, and the results were consistent with the predicted results. These findings may help us to understand the role of cuproptosis in cancer and provide new directions for the design of personalized treatment and prediction of survival outcomes in patients with bladder cancer.
1 Introduction
Bladder cancer (BC) is one of the most common solid tumors worldwide. It is the seventh most common malignant tumor in men and the tenth most common in women, with an estimated 550,000 new cases and 20,000 deaths yearly (1–4). BC is divided into urothelial carcinoma, squamous carcinoma, and adenocarcinoma. Bladder urothelial carcinoma is the most common subtype, accounting for more than 90% of cases (4, 5). Currently, the main treatment method for BC is surgery combined with other therapies; however, due to its high recurrence rate and frequent metastasis, the patient prognosis remains unsatisfactory (5, 6). Molecular typing by gene analysis has become a focus because BC occurrence and development is a complex pathological process (7). To improve the early management and survival rate of patients with BC, it is critical to find new biomarkers and explore new molecular subtypes to predict patient prognosis and drug treatment response.
Copper is an essential trace element for the human body and an important cofactor in many physiological processes, such as mitochondrial respiration and in antioxidants (8, 9). Abnormal copper levels are associated with a variety of diseases (10–12), including high levels in malignant tumors (13, 14). In patients with BC, copper has been found to be abnormal both in the serum and cancer tissues. Furthermore, copper enhances angiogenesis and is involved in the occurrence and development of BC (15, 16). Recent studies have identified a new and non-apoptotic form of programmed cell death induced by copper called cuproptosis (13, 17, 18). In a study published by Tsvetkov et al. (2), intracellular copper was found to bind to the stellated component of the TCA cycle (19, 20), which aggregates mitochondrial lipidated proteins and leads to reduced stability of iron-sulfur clustering (21, 22), leading to this unique type of cell death. Additionally, this report also identifies a series of key genes for cuproptosis.
However, this new form of cell death requires further investigation in BC development. Identifying the characteristics of cuproptosis-related genes in BC and patient subtyping will help to improve understanding of BC occurrence, development, and mechanisms, provide personalized treatment plans, and predict treatment response.
In this study, we combined BC sample transcript data from The Cancer Genome Atlas (TCGA) and Gene Expression Omnibus (GEO) databases to classify patients into two distinct molecular subtypes based on the differentially expressed cuproptosis-related genes. These groups showed different prognoses and immune characteristics. We also established a cuproptosis scoring system for BC, which can help evaluate the cuproptosis pathway in tumors and predict the prognosis of patients, the effects of immunotherapy, and personalized treatment plans.
2 Materials and methods
2.1 Acquisition of data
TCGA (https://portal.gdc.cancer.gov/) and GEO databases (https://www.ncbi.nlm.nih.gov/geo/) were used to download BC gene expression data and corresponding clinical information. The fragments per kilobase million value of the TCGA-BLCA cohort was converted into transcripts per million, which was merged with three GEO cohorts (GSE13507, GSE31684, and GSE32894). Patient data with missing survival information were removed. The batch effect was eliminated using the “ComBat” algorithm in the “sva” R program (23). In total, 1001 patients were included in the analysis. Somatic mutation data and copy number variation data were downloaded from the TCGA database. Thirteen cuproptosis-related genes (CRGs) were obtained from these data.
2.2 Consensus cluster analysis of CRGs
An unsupervised consensus cluster analysis was performed on the 13 CRGs using the “ConsensusClusterPlus” R package (24) to classify the patients into different molecular subtypes. The number of clusters was set from 2 to 9, and selection was based on the following criteria: the concordant product distribution function curve had a small slope of decline, there was no small sample size group, and clustering showed high intra-group correlation and low inter-group correlation. Principal component analysis was used to reduce the dimensions and distinguish different subtypes of information.
2.3 Relationship between molecular subtypes, clinical features, and prognosis of patients with BC
The R package “beeswarm” (25) was used to compare the clinical value of the two subtypes. The correlation between clinical parameters age (≤ 65 years or > 65 years), sex (female or male), tumor stage (T1, T2, T3, or T4), grade (high or low grade), and the prognosis was evaluated and illustrated with heatmaps.
2.4 Identification and functional analysis of DEG
Using the “limma” R package (26), we set the filter criteria as log(Fold Change) > 1 and adjusted the p-value to be < 0.05 to obtain differentially expressed genes (DEGs) between different cuproptosis subtypes. These DEGs were then subjected to functional enrichment analysis using Gene Ontology and Kyoto Encyclopedia of Genes and Genomes analyses in the “clusterProfiler” R package (27).
2.5 Construction of the cuproptosis-related prognostic score model
First, univariate COX regression analysis was performed on the DEGs between the two subtypes, and the genes related to prognosis were screened. Unsupervised consensus cluster analysis was performed using the “ConsensusClusterPlus” R package (24) to classify the BC patients in the combined cohort into different gene subtypes. Next, the patients were randomly divided into either the training or testing groups. The optimal results were obtained by LASSO regression analysis of the training group data using the R package “glmnet” (28). A “multiCox” analysis was performed to obtain eight central genes and correlation coefficients. Furthermore, a prognostic model of cuproptosis was established, named CRG_score, where CRG_score = (expression of each gene × correlation coefficient). Based on the median value of the risk score, patients in the training group were divided into high- and low-risk groups. Kaplan–Meier survival analysis was performed, and a receiver operating characteristic curve (ROC) was constructed. To verify the predictive ability of the model, we evaluated its prognosis, sensitivity, and specificity in the testing group. In addition, the “rms” package was used to create a prognostic nomogram and a calibration map.
2.6 Tumor microenvironment analysis of CRG_score
To evaluate the relationship between the CRG_score and TME, the “CIBERSORT” R package (29) was used to evaluate the abundance of immune cells infiltrating tumors in high- and low-risk samples. The correlation between the score and infiltrating cell abundance was analyzed using linear analysis and a heatmap. Simultaneously, the immune cells, matrix, and ESTIMATE scores of patients with BC were calculated using the ESTIMATE algorithm. In addition, we analyzed the differences in the expression of immune test genes in the different CRG_score groups.The single-cell tumor microenvironment expression of cuproptosis-related genes in the tumor microenvironment was analyzed using the TISCH database(http://tisch.comp-genomics.org/).
2.7 Drug sensitivity analysis
To explore the sensitivity of BC high- and low-risk groups to chemotherapies, we calculated the half-maximal inhibitory concentration (IC50) values of four commonly used BC drugs using the “pRRophetic” R package (30) based on the Cancer Drug Sensitivity Genomics database. Drug sensitivity was positively correlated with IC50 values.
2.8 Tissue sample collection
This study was approved by the Ethics Committee of the Fourth Affiliated Hospital of Harbin Medical University. All patients provided signed informed consent before participating in the study. Thirty BC tissue samples and 30 normal BC epithelial tissue samples were collected from patients undergoing surgical resection at the Department of Urology, Fourth Affiliated Hospital of Harbin Medical University. The obtained tissue samples were snap-frozen in liquid nitrogen and stored at −80°C.
2.9 RNA extraction and quantitative reverse transcription-polymerase chain reaction
RNA was extracted from the tissues using TRIzol reagent (Invitrogen, Carlsbad, CA, USA) according to the manufacturer’s instructions. The isolated RNA was reverse transcribed into cDNA using a reverse transcription kit (Takara Bio, Iapan). qRT-PCR was performed using the SYBR Green PCR Master Mix (Takara Bio). The following thermal cycling conditions were used: amplification reactions were performed at 95°C for 1 min and 95°C for 15 min, followed by 40 cycles at 95°C for 15 s and at 52°C for 15 s. All qRT-PCR reactions were performed in duplicates. The primer sequences used are listed in Supplementary Table 2. The relative quantitative method 2−ΔCT was used to analyze the expression data.
2.10 Statistical analyses
All statistical analyses were performed using the R software (version 4.0.5). Statistical significance was set at P < 0.05. In all figures: ∗ < 0.05, ∗∗ < 0.01, ∗∗∗ < 0.001.
3 Results
3.1 Genetic and transcriptional alterations of CRGs in BC
We analyzed the somatic mutation rates of 13 CRGs in the TCGA-BLCA cohort and found 43 mutations (10.39%) in the BC samples. The highest mutation frequency was observed in ATP7B (Figure 1A). However, we noticed that all CRGs had copy number variation (CNV) changes, among which ATP7B, PDHB, FDX1, and DLATD had the most significant decrease in copy number, whereas LIPT1 and GCSH had a significant increase in copy number (Figure 1B). The chromosomal positions of CRGs with CNV changes are shown in Figure 1C.
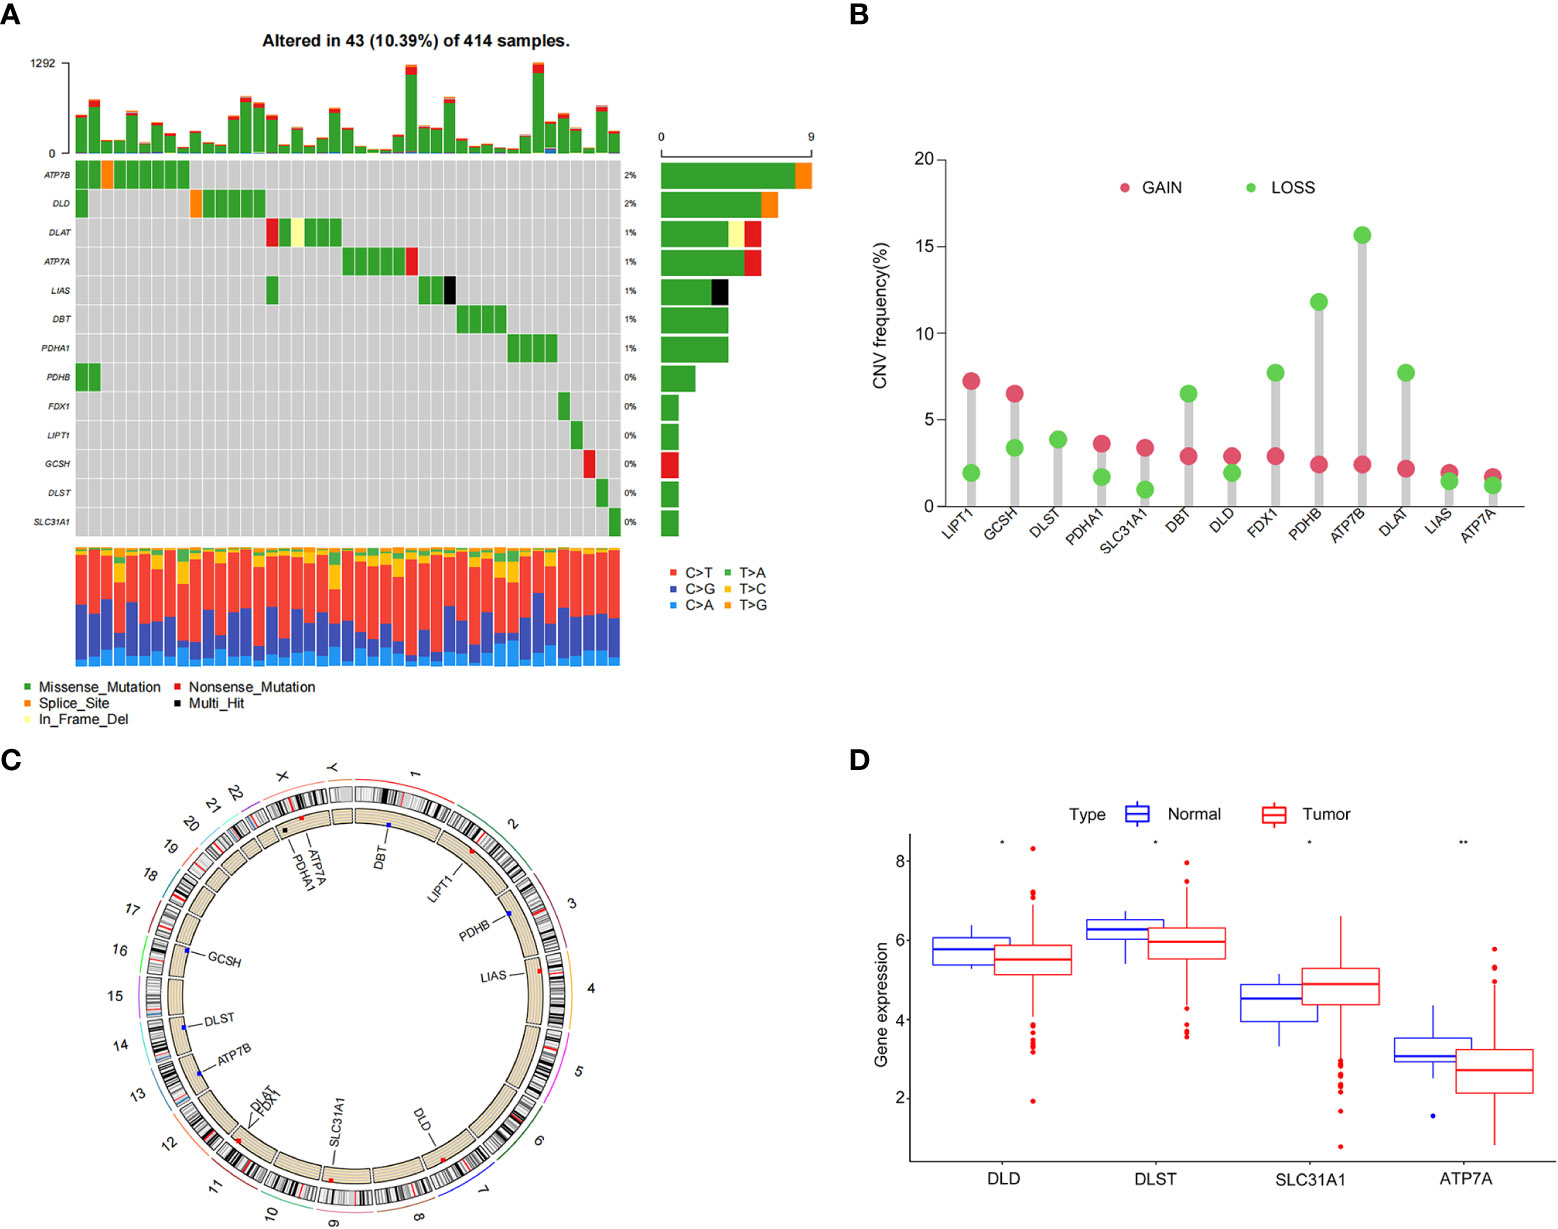
Figure 1 Genetic and transcriptional alterations of cuproptosis-related genes in bladder cancer. (A) Frequency of cuproptosis-related gene (CRG) somatic mutations in patients with bladder cancer in The Cancer Genome Atlas cohort. (B) Copy number variations (CNVs) in CRGs. (C) The chromosomal positions of CRGs with CNV. (D) Differential expression of CRGs in normal bladder tissue and bladder cancer tissue. *P < 0.05, **P < 0.01.
Next, we analyzed the differences in CRG expression between tumor and normal tissues in the TCGA-BLCA cohort. Significant differences were observed in DLD, DLST, SLC31A1, and ATP7A expression, which was partially consistent with the CNV (Figure 1D). However, the expression of CRGs with a higher frequency of CNVs did not differ between BC and normal tissues. These results showed that there were differences in the genetics and expression levels of CRGs between BC samples and normal tissues, suggesting a potential role for CRGs in BC.
3.2 Identification of cuproptosis subtypes in BC
A total of 1001 patients from three eligible BC cohorts (TCGA dataset, GSE13507, GSE31684, and GSE32894) were integrated for further analysis. Using the expression levels of 13 CRGs, the patients were divided into K groups (k = 2–9). Two molecular subtypes (k = 2) were optimal (Figure 2A). Principal component analysis revealed a significant separation between the transcriptional profiles of cuproptosis genes of the two subtypes (Figure 2B). Kaplan–Meier survival analysis was performed, and the results are shown in Figure 2C. We also analyzed and compared the patient clinicopathological features (Figure 2D). In addition, GSCV enrichment analysis was performed. We found that subtype A is mainly enriched in 14 pathways related to metabolisms, such as amino acid, propionate, and pyruvate metabolism. In subtype B, we found significant enrichment in pathways involving the extracellular matrix receptor, neuroactive ligand-receptor, and cytokine-receptor interactions, which are related to carcinogenesis and metastasis (Figure 2E). Next, we investigated the differences in TME immune infiltration. We identified 19 immune cells that were significantly different in abundance between the two subtypes Figure 2F. In addition to T helper cells, two cell types showed more infiltration in subtype A, and other immune cells, including activated B cells, CD4+ T cells, CD8+ T cells, dendritic cells, immature B cells, regulatory T cells, and ten other immune cells were significantly more abundant in subtype B.
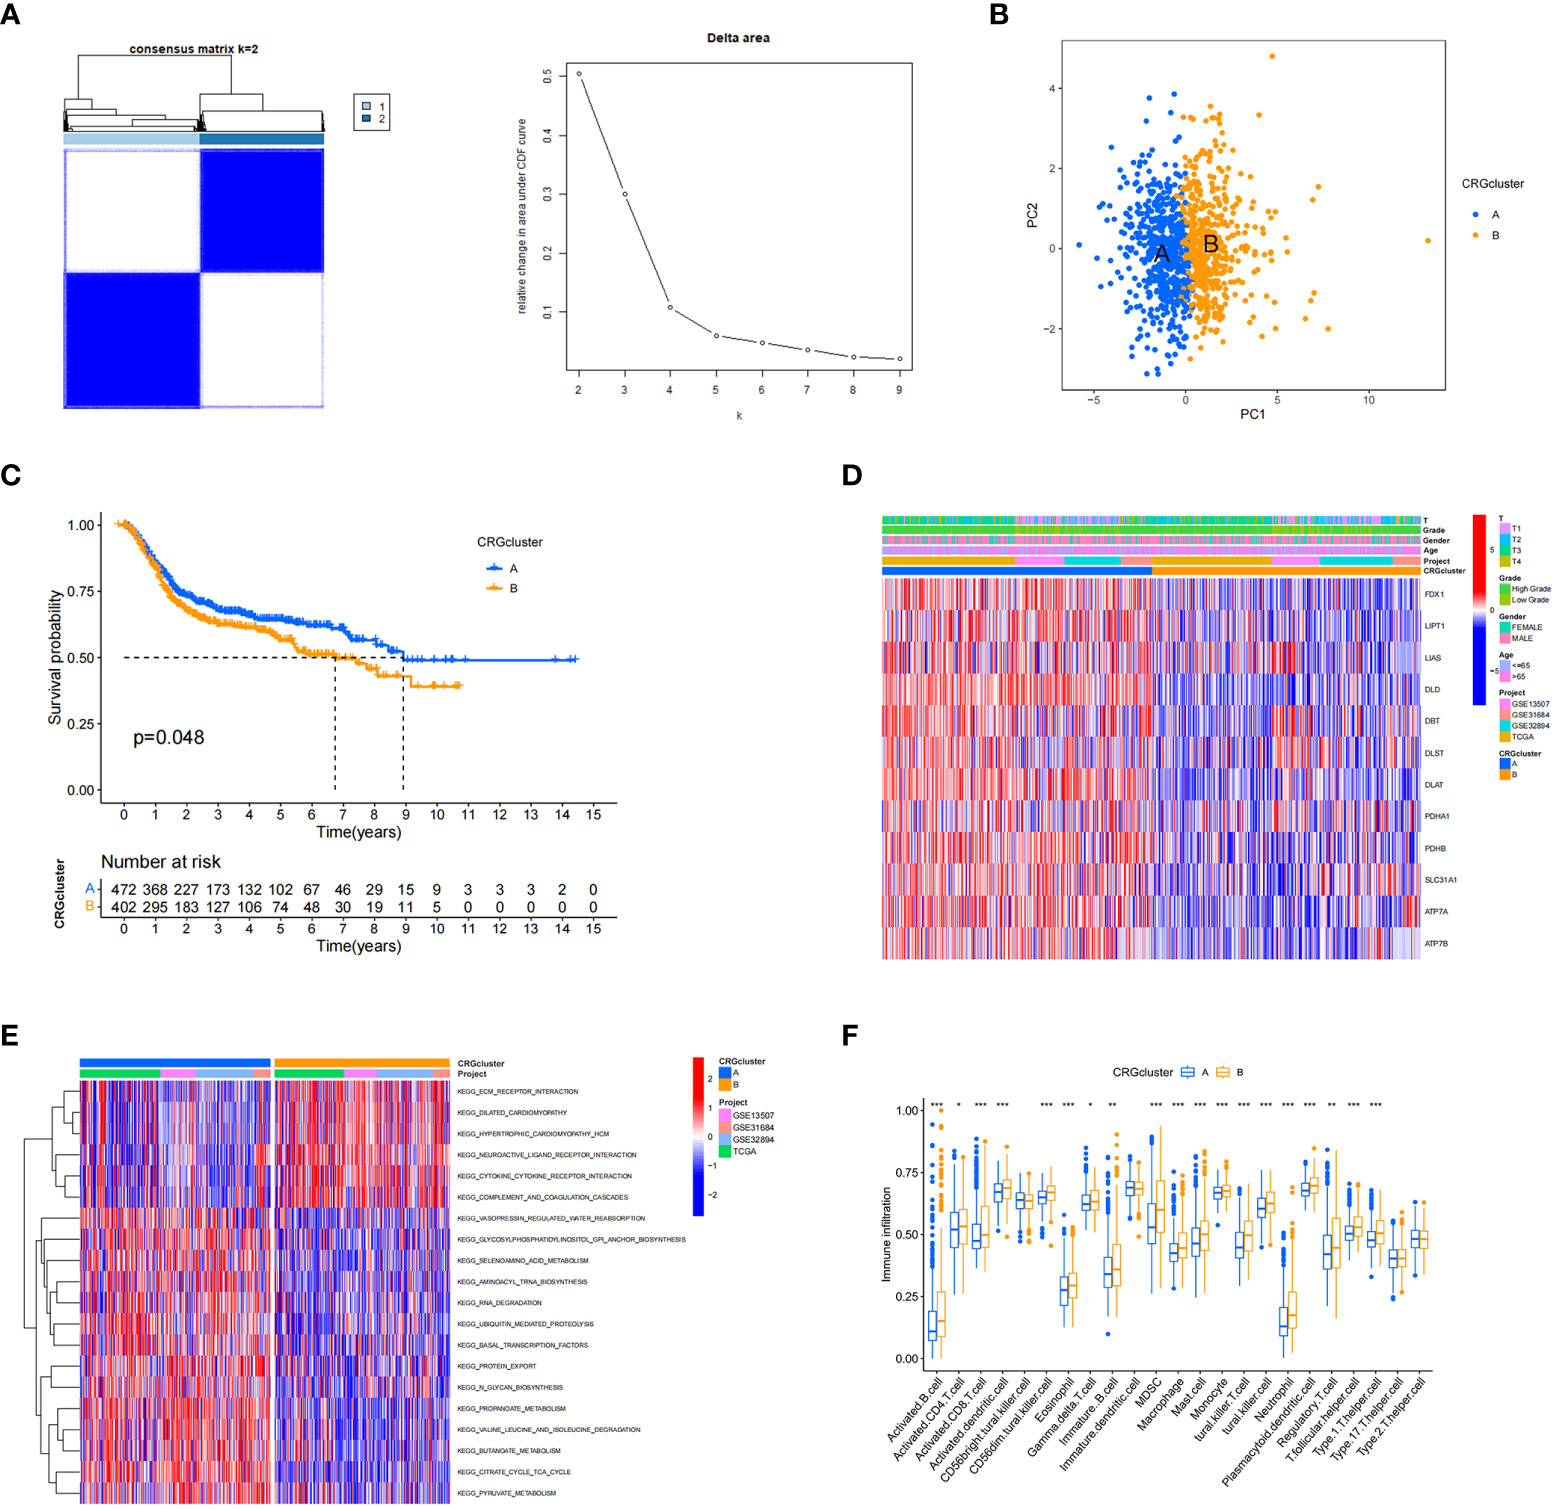
Figure 2 Cuproptosis-related gene subtypes and clinicopathological and biological characteristics of two different subtype samples partitioned by consistent clustering. (A) Consensus matrix heatmap defining two clusters (k = 2) and their associated regions. (B) Principal component analysis showing a significant separation of transcriptional profiles between the two subtypes. (C) Kaplan–Meier survival analysis curves of the two subtypes. (D) Heatmap of clinicopathological features between cuproptosis-related gene (CRG) subtypes. (E) Gene set variation analysis of biological pathways between CRG subtypes, where red and blue represent activated and inhibitory pathways, respectively. (F) Differences in immune cell infiltration in the two subtypes. *P < 0.05, **P < 0.01, ***P < 0.001
3.3 Identification of gene subtypes based on differentially expressed genes
Next, we explored the biological differences between the cuproptosis subtypes in BC. First, 126 DEGs associated with cuproptosis subtypes were identified. Gene Ontology analysis showed that DEGs were significantly enriched in extracellular matrix-related biological processes (Figure 3A). Kyoto Encyclopedia of Genes and Genomes enrichment analysis showed that these DEGs were enriched in collagen fibril organization, connective tissue development, wound healing, extracellular matrix organization, and extracellular structure organization (Figure 3B). Thus, cuproptosis plays an important role in processes related to tumor invasion and metastasis through reordering the extracellular matrix. Univariate COX regression analysis identified 82 genes associated with prognosis. Using these prognostic DEGs, we divided the patients into two genotypes (type A and type B) using a consensus clustering algorithm, which showed that subtype A had significantly lower overall survival than subtype B (Figure 3C). The heatmap in Figure 3D depicts the correlation between clinical data and genotyping. The two gene subtypes showed significant differences in CRG expression levels, which was consistent with the cuproptosis pattern (Figure 3E).
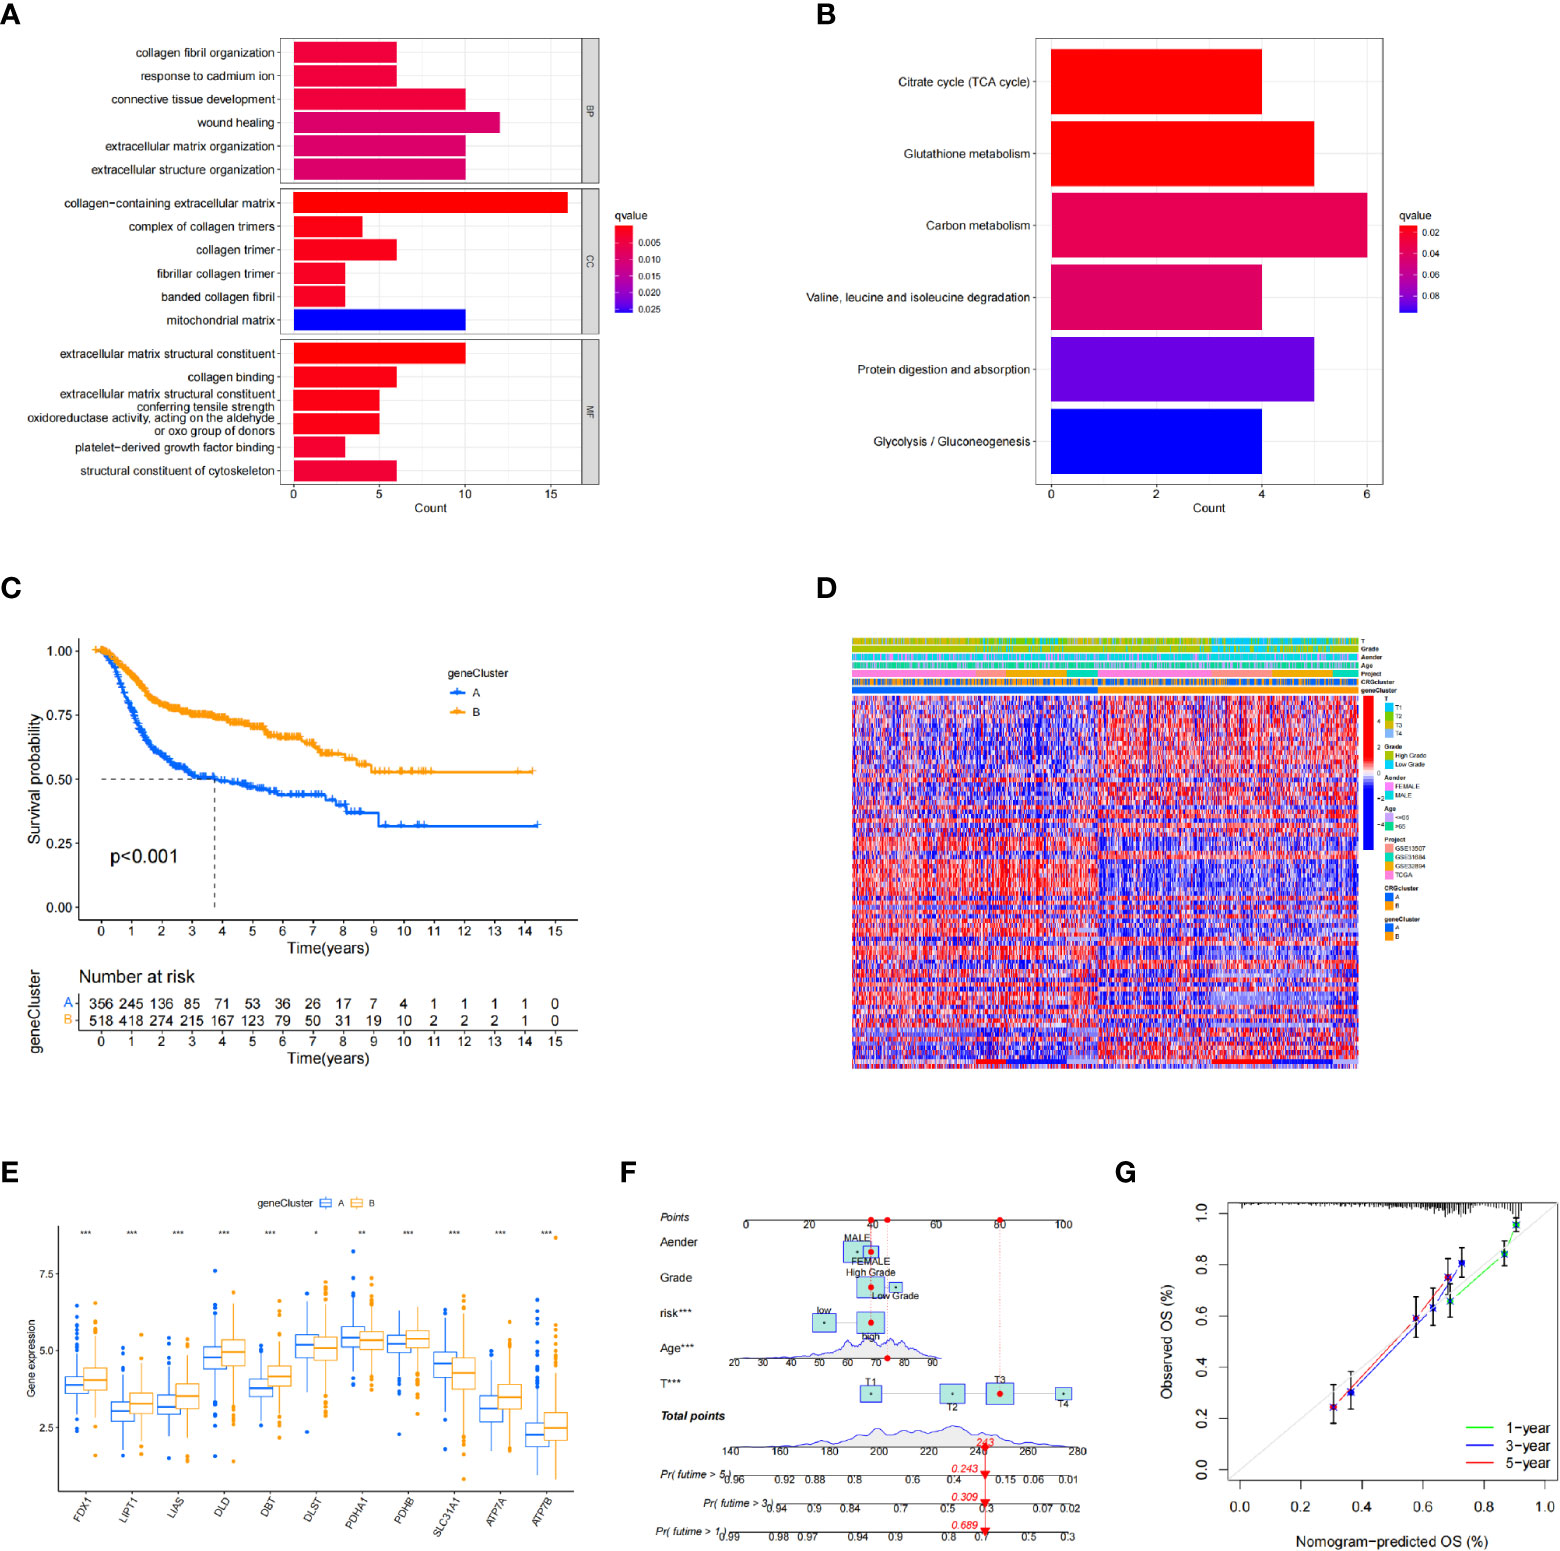
Figure 3 Identification of differentially expressed gene subtypes. (A, B) Gene Ontology and Kyoto Encyclopedia of Genes and Genomes enrichment analysis. (C) Kaplan–Meier survival analysis curves of the two subtypes. (D) Clinical case characteristics of differentially expressed gene subtypes. (E) Differences in immune cell infiltrates in the two subtypes. (F, G) Nomogram and calibration curve for bladder cancer patients using the CRG_score. *P < 0.05, **P < 0.01, ***P < 0.001
3.4 Construction of a cuproptosis-related model
The patient samples were randomly divided into training (n = 438) and test (n = 437) groups at a ratio of 1:1. First, from the 13 prognostic DEGs, the best fit of LASSO regression (Figures 4A, B) and multivariate COX regression analysis was used to select eight genes. Among them were the high-risk genes PDGFRB, COMP, GREM1, and FRRS1 and the low-risk genes SDHD, RARRES2, CRTAC1, and HMGCS2. Next, we constructed the prognostic features, and the CRG_score was calculated. The patient distribution in the cuproptosis subtypes, genotypes, and two prognostic risk score subtypes is shown in a Sankey diagram (Figure 4C). We also explored the relationship between CRC_scores and cuproptosis subtypes A and B and genotypes A and B. The CRG_score was significantly higher in subtype A than in subtype B, suggesting that a low CRG_score may be related to extracellular matrix-related features (Figure 4D). We also found that an increase in the CRG_score resulted in a decrease in survival time and an increase in mortality (Figures 4E, F).
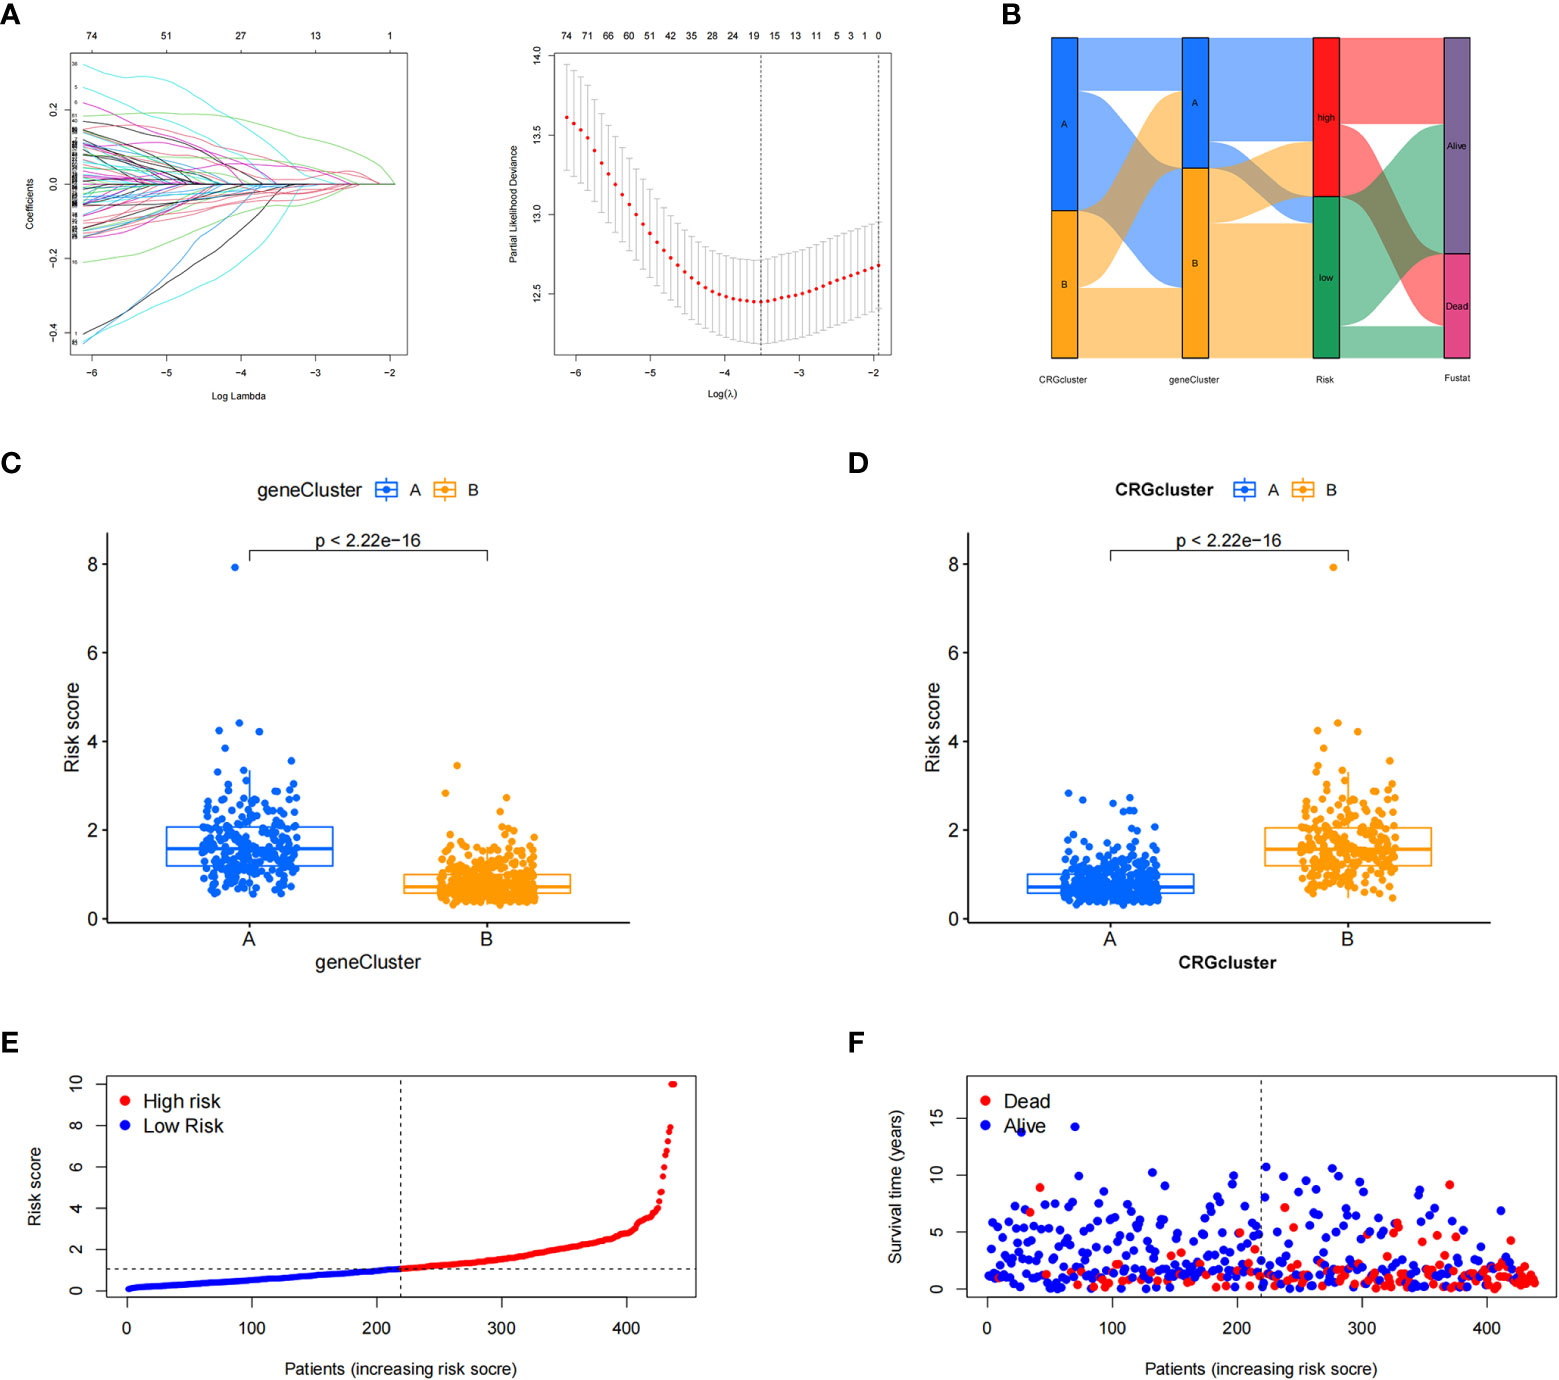
Figure 4 Construction of the cuproptosis-related gene scores. (A) Using the Trial group samples to find the best fit of LASSO regression. (B) Alluvial plot of the distribution of cuproptosis-related gene (CRG) subtypes and genotypes in different risk groups. (C) Differences in risk scores between genotypes. (D) Differences in risk scores between CRG subtypes. (E, F) Ordinal point and scatter plots of CRG risk score distribution and patient survival.
3.5 Validation of the cuproptosis-related model
Kaplan–Meier survival curve analysis and log-rank tests showed that in both the training and testing groups, patients in the high-risk group had significantly lower survival rates than those in the low-risk group (Figures 5A, B). At the same time, we also examined the sensitivity and specificity of CRG_score. The ROC results showed that the area under the curve of the 1-, 3-, and 5-year survival times of the training group was 0.644, 0.657, and 0.609, respectively, and the area under the curve of the 1-, 3-, and 5-year survival time of the testing group was 0.688, 0.750, and 0.773, respectively, indicating that the CRG_score can robustly and reliably predict the prognosis of patients with BC (Figures 5C, D).
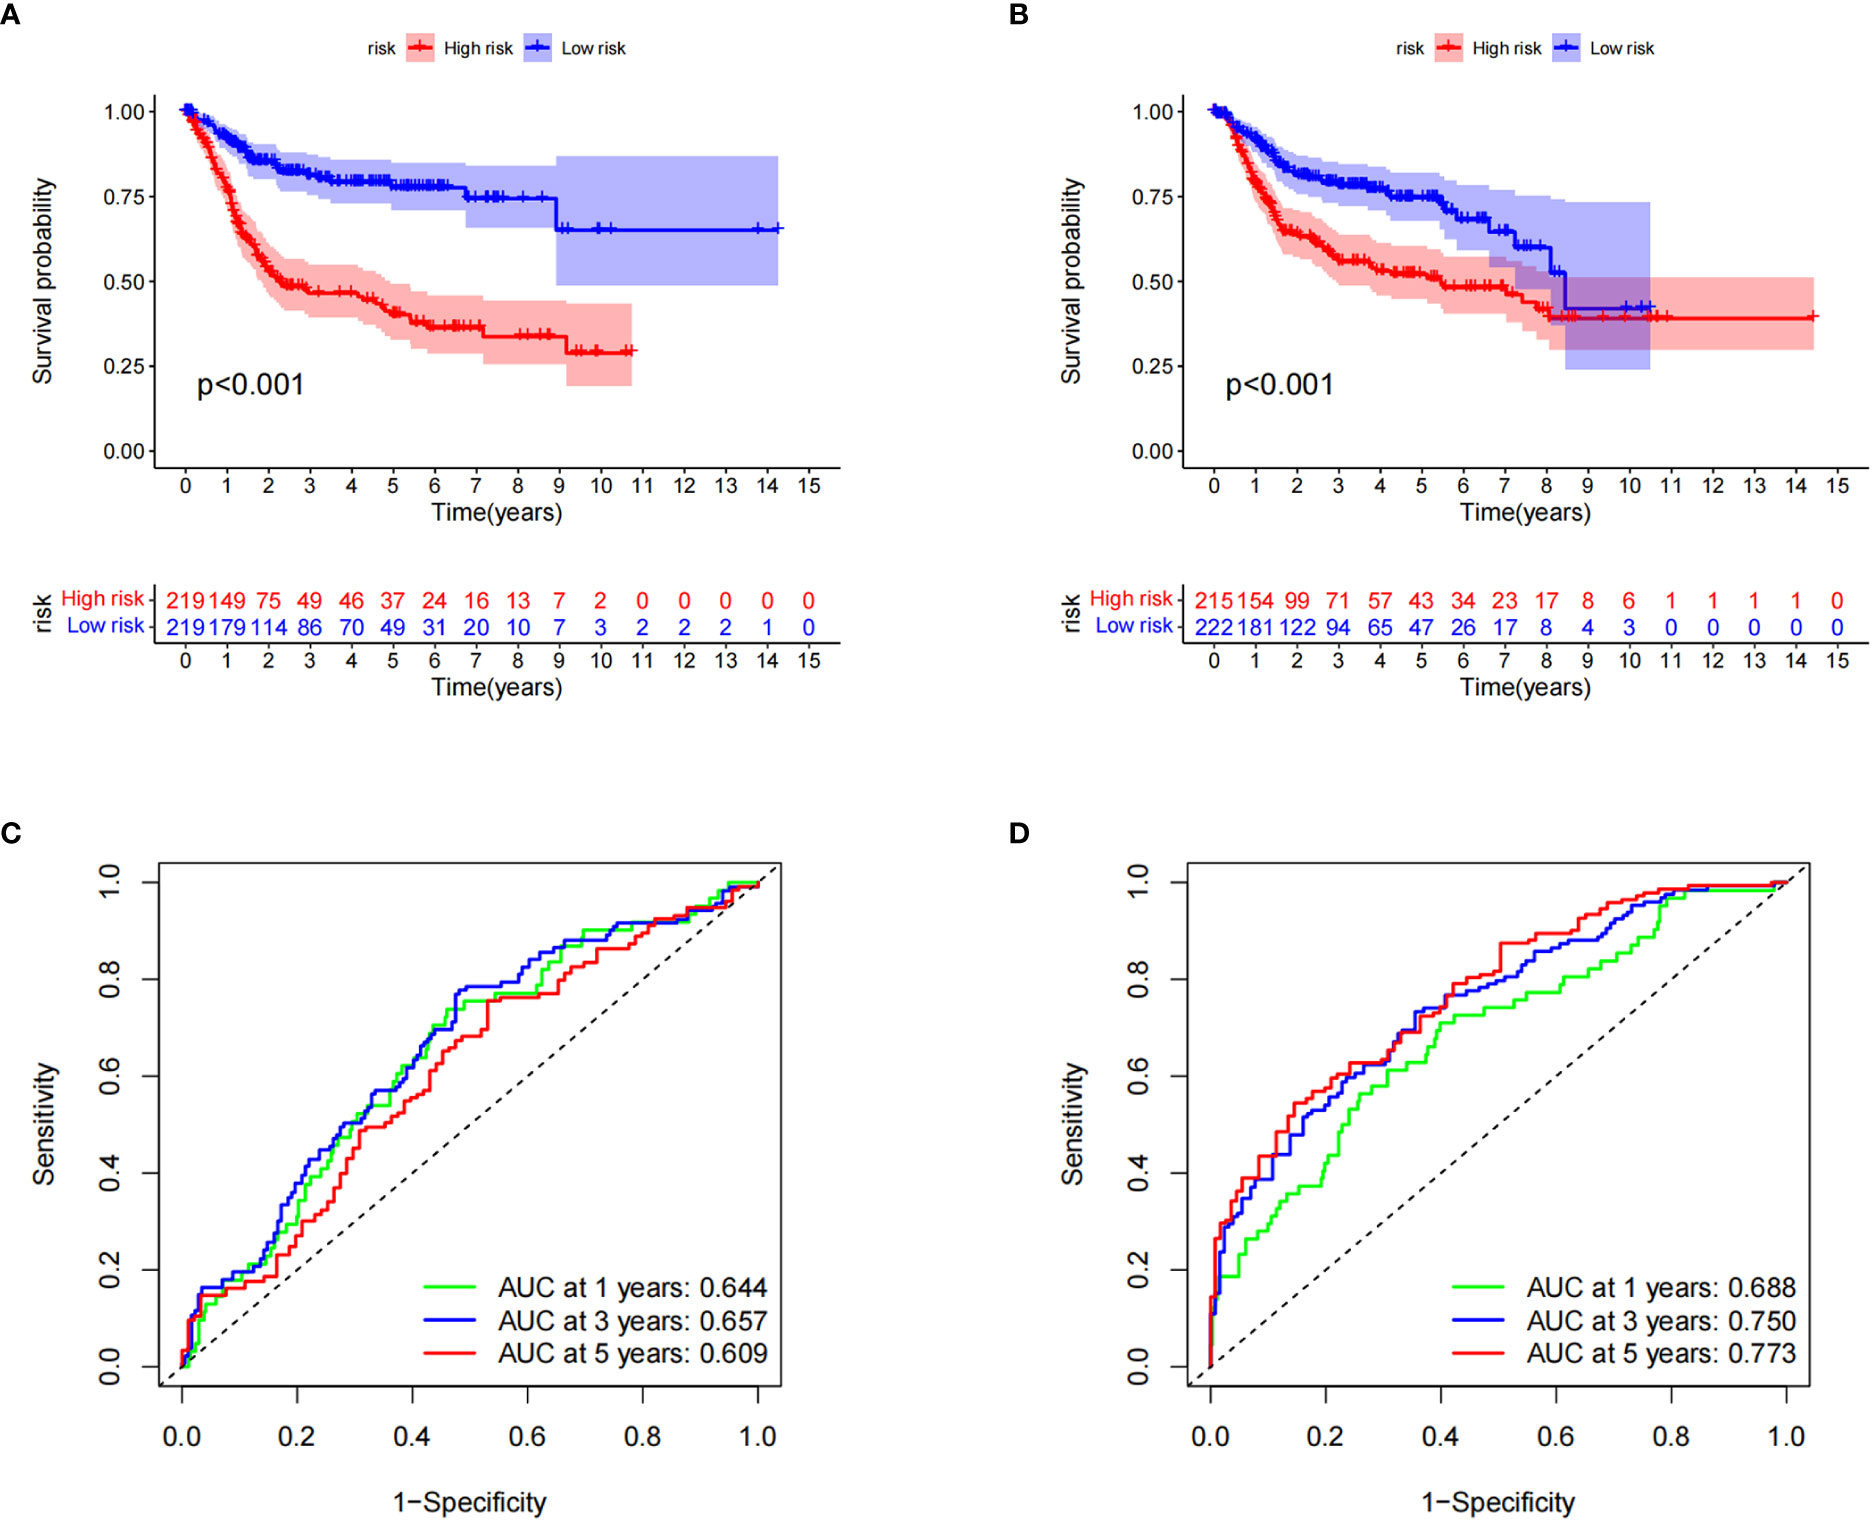
Figure 5 Verification of cuproptosis-related gene scores. (A) Kaplan–Meier survival analysis curves of the two groups in the training set. (B) Kaplan–Meier survival analysis curves of the two patient groups in the test set. (C) Receiver operating characteristic curves for predicting the sensitivity and specificity of 1-, 3-, and 5-year survival rates using the cuproptosis-related gene score (CRG_score) in the training set. (D) Receiver operating curves for the sensitivity and specificity of CRG_score in predicting 1-, 3-, and 5-year survival in the test set.
3.6 Construction of the nomogram
A nomogram is a tool that can be easily applied clinically to predict tumor prognosis. Due to the inconvenience of direct application of the CRG_score, we created a nomogram of BC based on the CRG_score and independent risk factors (patient sex and age, cancer grade, and tumor stage) (Figure 3F). In addition, we assessed nomogram accuracy using calibration curves, which showed high agreement between the clinical observations and nomogram predictions for 1-, 3-, and 5-year overall survival probabilities (Figure 3G).
3.7 Evaluation of TME and checkpoints between the two risk groups
Next, we explored the correlation between CRG_score and immune cell infiltration characteristics in the TME. The scatter plot results showed that the CRG_score was negatively correlated with naive B cells, activated dendritic cells, plasma cells, γδ T cells, and regulatory T cells and positively correlated with M0 and M1 macrophages, neutrophils, and activated NK cells (Figure 6A). The high-risk group had significantly lower StromalScore, ImmuneScore, and ESTIMATE scores than the low-risk group (Figure 6B). We also analyzed the relationship between the eight key genes and immune cell abundance, and all were significantly associated with the abundance of multiple infiltrating immune cells (Figure 6C). Furthermore, we investigated the association between the immune checkpoints and our risk model. Figure 6D shows that 33 immune checkpoints are differentially expressed in the two groups, including PD-1 and PD-L1. These results indicated that the cuproptosis score was closely related to TME. In addition, we analyzed the expression of cuproptosis-related genes in the single-cell immune microenvironment through the BLCA_GSE149652 dataset in the TISCH database. The BLCA_GSE149652 data set divides cells into 17 clusters and contains 6 types of immune cells (Figure 6E). The results of the analysis showed that SDHD was expressed in a variety of immune cells, while PDGFRB was less expressed, and none of the other genes were detected (Figure 6F).
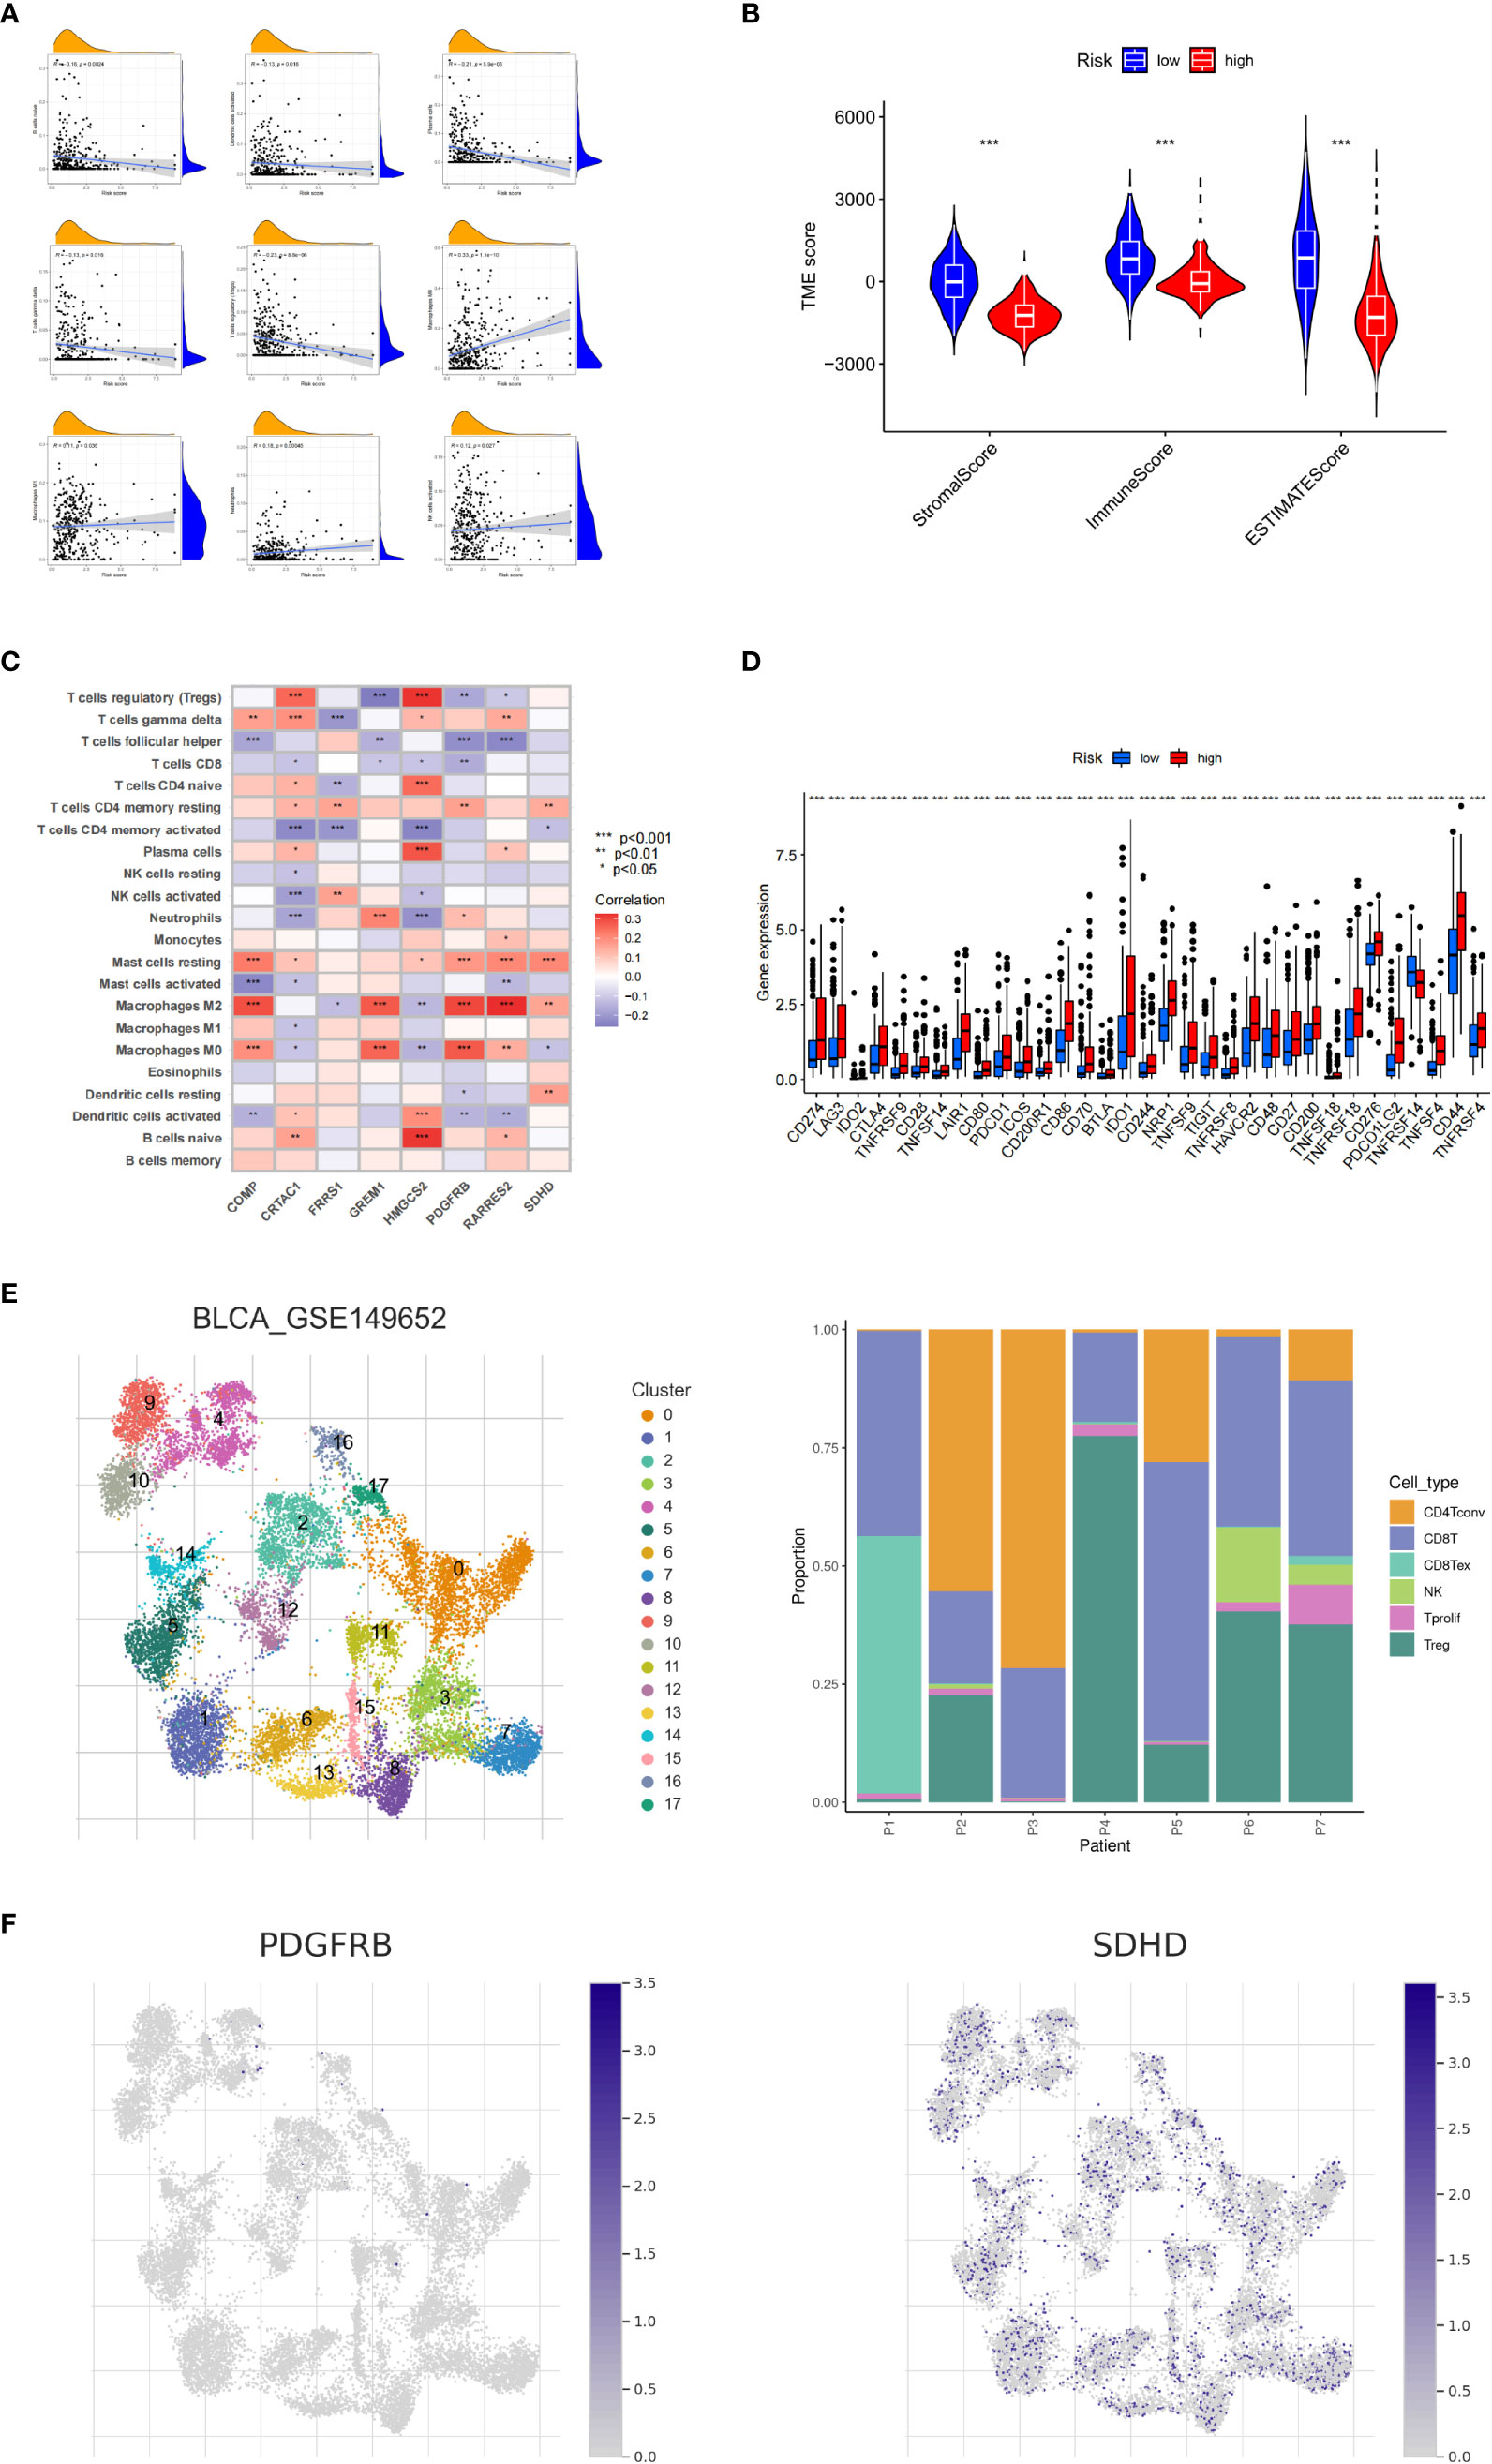
Figure 6 Tumor microenvironment and immune checkpoints for cuproptosis-related gene scores. (A) Correlation between cuproptosis-related gene scores (CRG_score) and immune cell type. (B) Correlation between CRG_score and immune and stromal scores. (C) Correlation between the abundance of immune cell infiltrates and cuproptosis-related genes. (D) Differences in immune checkpoint expression among different risk groups. (E) Information of BLCA_GSE149652. (F) The expression level of SDHD and PDGFRB in TME in single cells. *P < 0.05, **P < 0.01, ***P < 0.001
3.8 Validation of prognostic signature gene expression
The qRT-PCR analysis of 20 pairs of BC and adjacent non-tumor tissues showed that the expression of PDGFRB, COMP, GREM1, and FRRS1 was higher in BC tissues than in non-tumor tissues. SDHD, RARRES2, CRTAC1, and HMGCS2 were lowly expressed in BC tissues (Figures 7A–H).
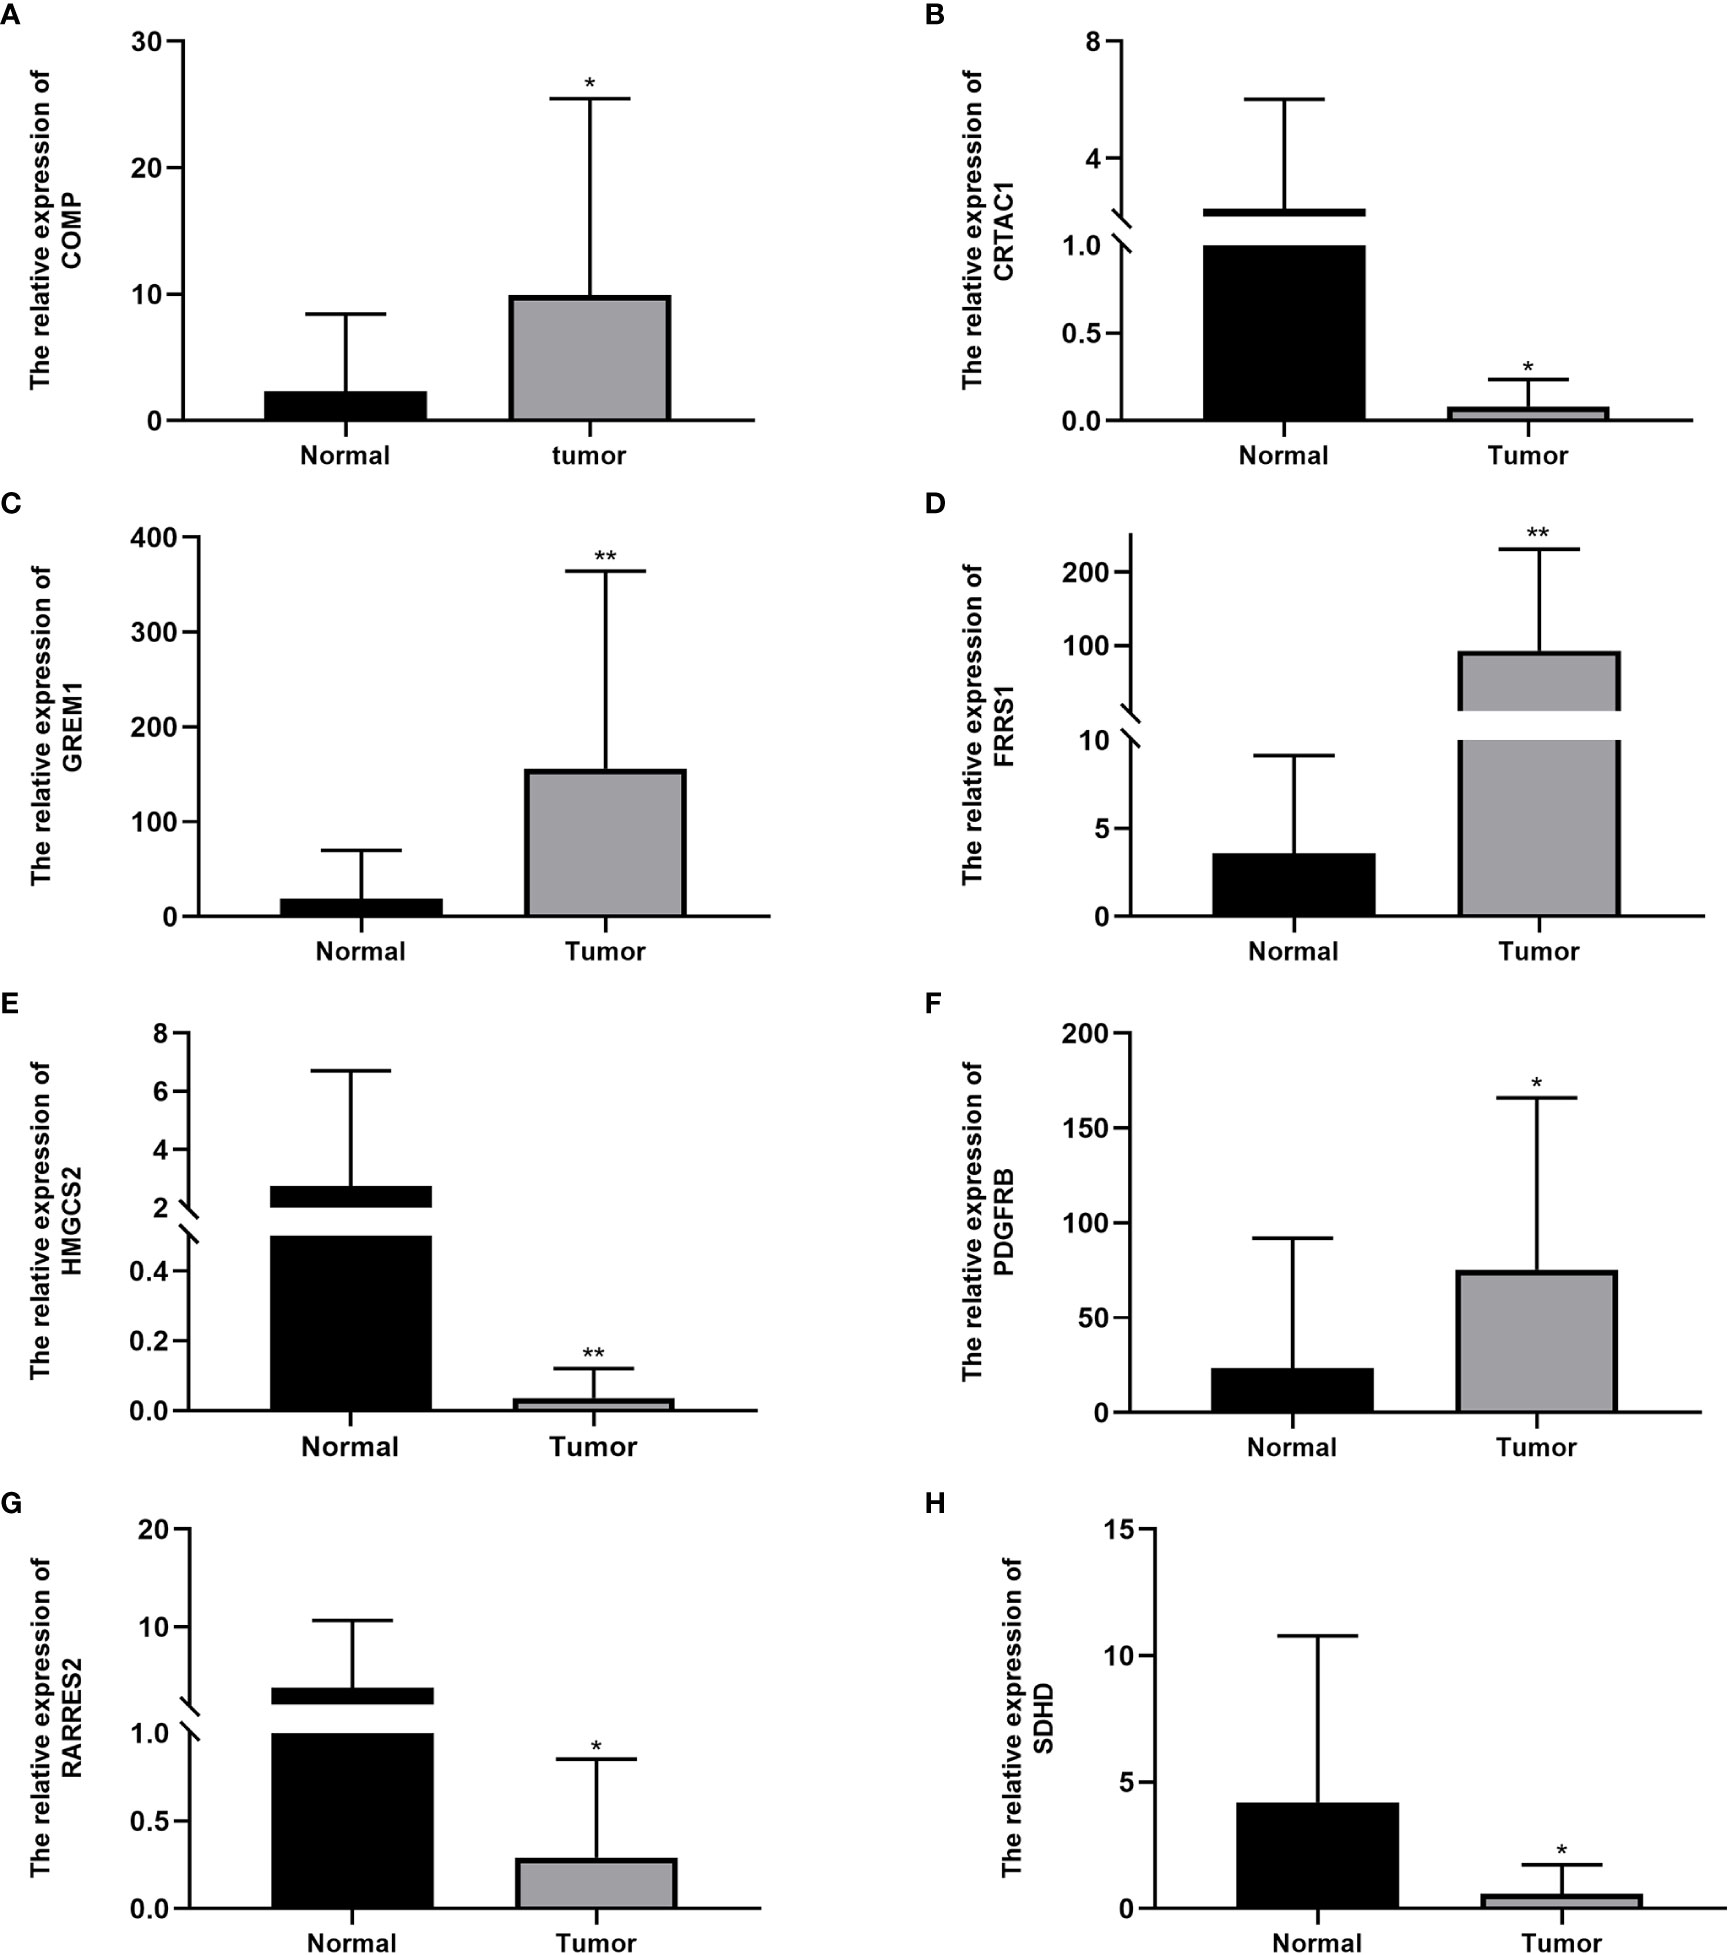
Figure 7 Expression levels of cuproptosis-related genes in bladder cancer tissues and normal tissues: (A) COMP, (B) CRTAC1, (C) GREM1, (D) FRRS1, (E) HMGCS2, (F) PDGFRB, (G) RARRES2, and (H) SDHD. Data are presented as the mean ± standard deviation. *P < 0.05, **P < 0.01.
3.9 Correlation of tumor mutational burden and drug sensitivity
To further explore the somatic mutations among BC cuproptosis score-related subtypes, we analyzed the data from the TCGA database. Most samples in the high- and low-risk groups had somatic mutations. The five genes with the highest frequency were TP53, TTN, KMT2D, MUC16, and ARID1A. TP53, KMT2D, and ARID1A showed higher mutation frequencies in the high cuproptosis score group, while the opposite was observed for other genes, such as MUC16, SYNE, and RYR2, in the low-risk group compared with those in the high-risk group (Figures 8A, B). We also evaluated the linear relationship between the CRG_score and cancer stem cell (CSC) index. The cuproptosis score was negatively correlated with the CSC index (R = −0.33, P < 0.001). BC cells with lower CRG_scores had a lower degree of cell differentiation and more abundant stem cell properties (Figure 8C). In addition, we investigated the relationship between CRG_score and the efficacy of commonly used chemotherapies and targeted therapies for BC (Figure 8D). The results showed that the CRG_score was associated with the response to 84 drugs. Among the clear first-line and second-line treatment drugs for BC, patients with low CRG_scores were associated with lower IC50 values of methotrexate, while patients with high CRG_scores had lower IC50 values for vinblastine, docetaxel, bleomycin, cisplatin, and paclitaxel. These results suggest that the CRG_score can be used as a predictor of drug response in BC.
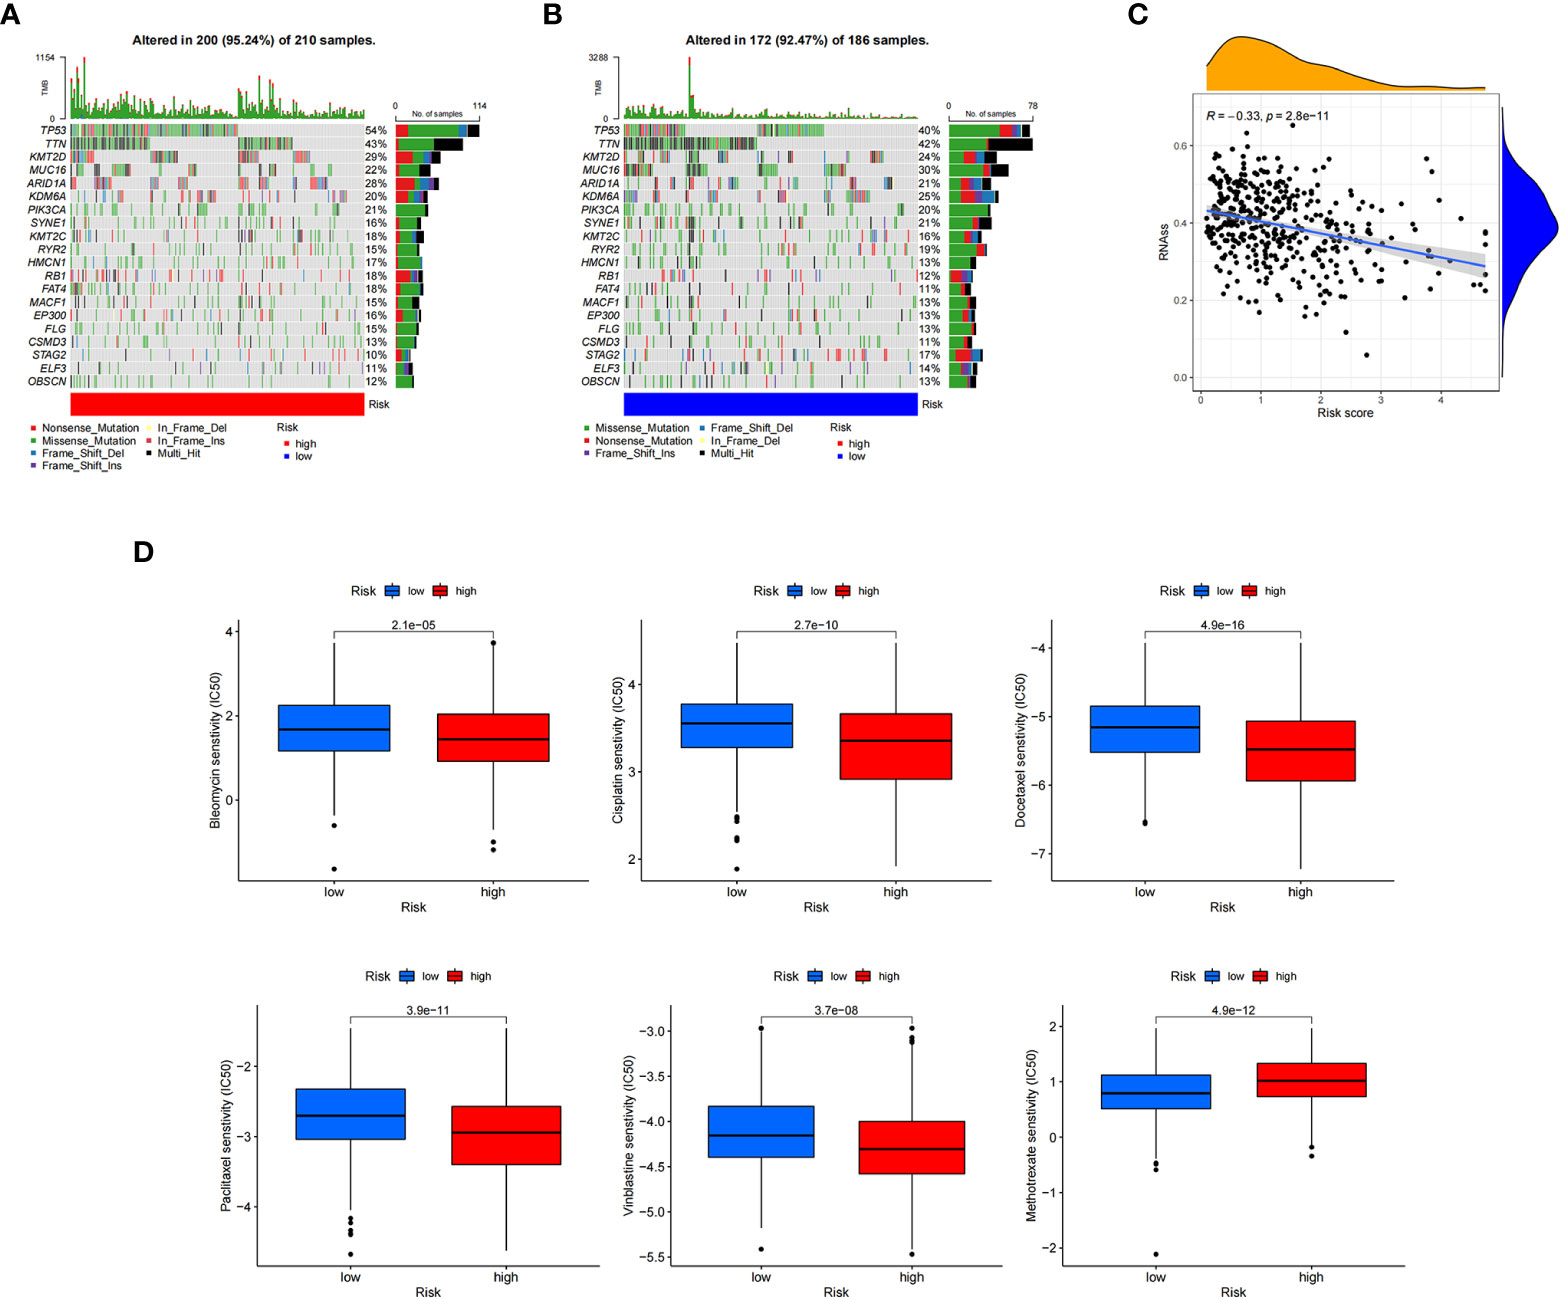
Figure 8 Calculating tumor mutational burden and chemosensitivity by cuproptosis-related gene scores. (A, B) Waterfall plot of somatic mutation signature of high- and low-risk groups by cuproptosis-related gene score (CRG_score). (C) Relationship between CRG_score and cancer stem cell index. (D) Relationship between CRG_score and chemotherapeutic drug sensitivity.
4 Discussion
Although treatment methods are constantly developing, the overall survival rate of patients with BC is still not ideal. Therefore, developing new and more effective molecular subtypes, more accurate prognostic evaluations, and personalized treatments are crucial to improving the survival rate of patients with BC. Copper dysregulation has been found in many tumors (31), and many studies have confirmed that copper is related to the occurrence and development of tumors, TME, and immunotherapy responses (32, 33). A new concept of non-apoptotic cell death, cuproptosis (34), has also been described recently, but its effects on BC remain unknown. Therefore, we investigated the expression and mutation changes of cuproptosis-related genes in BC, explored the impact of CRGs on patient prognosis and TME, and established a cuproptosis-related risk score system to predict patient prognosis and guide treatment selection.
The TME refers to the local environment of the tumor where immune and stromal cells, including mesenchymal and endothelial cells, are the two major non-tumor components. There are also secreted products, such as cytokines and chemokines, and the extracellular matrix, consisting of collagen, laminin, and proteoglycans, which constitute the non-cell components (35–37). Tumor cells can reshape the TME, which in turn can further affect the behavior, differentiation level, and tumor cell state, thus affecting patient prognosis (36). Programmed cell death can regulate the immune-related TME (38) and refers to the active and orderly manner of cell death determined by genes and reactive oxygen species level, and these processes are apoptosis, necroptosis (39, 40), pyroptosis (41), and ferroptosis (42). Programmed cell death can affect the tumor immune microenvironment by releasing cell contents, regulating effector cells, or enriching immune cells (43). As a newly discovered mode of programmed cell death, cuproptosis is characterized by the direct binding of copper ions to the lipoacylated components of the TCA cycle in mitochondrial respiration, which leads to the aggregation of lipoacylated proteins and the downregulation of iron-sulfur cluster proteins (44). Lipoacylated components and iron-sulfur cluster proteins are widely present in cells, and they may be targets for tumor therapy.
In this study, we identified and validated two cuproptosis subtypes in BC, where Subtype A has a high level of CRG expression and low levels of immune cell infiltration and highly expresses metabolic pathways. Subtype B CRGs have lower expression levels, but a higher number of immune cell infiltrates, showing characteristics related to the metastatic pathway, which is a low metabolic and high immune infiltration subtype. The two subtypes also showed differences in gene expression and clinical features. We observed that subtype A had better overall survival than subtype B, but there was no evident trend in clinical features. In terms of immunity, subtype B showed higher immune cell infiltration.
We constructed a prognostic model based on the cuproptosis subtype-related prognostic DEGs by LASSO and multivariate COX regression analysis, which consisted of eight gene predictors (PDGFRB, COMP, GREM1, FRRS1, SDHD, RARRES2, CRTAC1, and HMGCS2). Black et al. found that PDGFRB co-expressed with EGRF, exerted a combinatorial effect to induce resistance to EGFR-targeted therapy, and increased the tumorigenicity and invasiveness of bladder tumors (45). This gene encodes for non-collagenous extracellular matrix proteins, which participate in tumorigenesis, cancer development, and the epithelial-mesenchymal transition. The COMP gene predictor increases colon cancer cell proliferation and may be a predictor in BC. GREM1 is a BMP antagonist expressed in bone marrow mesenchymal stem cells and fibroblasts. GREM1 can inhibit tumor cell proliferation, migration, and invasion in various cancers. FPRS1, an enzyme that reduces ferric to ferrous iron prior to its transport to the cytoplasm, is a potential tumor regulator. It is a key enzyme located in the inner mitochondrial membrane and is involved in the TCA cycle and electron transport chain. SDHD, which encodes SDH, has a role in tumor suppression. Abnormal RARRES2 expression has been detected in tumor cells. RARRES2 acts as a chemokine through recruitment and plays an important role in tumor immunity. CRTAC1 is an extracellular matrix protein-coding gene in cartilage and can promote cell proliferation, migration, and extracellular matrix remodeling. Abnormal CRTAC1 expression is related to the occurrence and development of BC. HMGCS2 is a mitochondrial enzyme involved in the ketogenic pathway and can be a tumor suppressor by altering lipid metabolism and adjusting cholesterol synthesis. The expression of these predictors was further confirmed by qRT-PCR in paired BC and normal bladder tissues. The relationship between these predictors and BC has not been reported; therefore, this study provides a new direction for developing prediction and therapeutic targets for BC.
We also studied the cuproptosis score’s effect on immune infiltration. There was a clear correlation between this score and immune cells, immune score, and immune checkpoints. Tumor-associated immune cells within the TME play an important role in the occurrence and development of tumors through pro- or anti-tumor mechanisms. Normally, immune cells recognize and destroy nascent tumor cells; however, because of the unstable cancer genotype, these immune cells may become tumor-associated or supporters, thus promoting tumor survival. In the high-risk group, we found naive B cells, activated dendritic cells, plasma cells, γδ T cells, and regulatory T cells were decreased, but M0 and M1 macrophages, neutrophils, and NK cells were increased. In addition, the CRG_score was positively correlated with the StromalScore, ImmuneScore, and ESTIMATEScore. We also demonstrated that high- and low-score groups of CRG_score have different immune checkpoint pathways activated. We also indicated the optimal drug therapy regimens for treating BC. We measured the sensitivity of patients to different drugs in the CRG_score group. According to IC50 values, vincristine, docetaxel, bleomycin, cisplatin, and paclitaxel showed a better response in the high-risk CRG_score group, whereas methotrexate showed a better response in the low-risk group. These results provide a basis for the individualized treatment selection for patients with BC.
However, our study has some limitations. The data were from public databases, and there was a selection bias. Additionally, our analysis was retrospective and needed to be confirmed by larger prospective studies, and further in vivo and in vitro experiments are required to confirm our results. Lastly, gene interactions are incredibly complex, and we should continue to explore new and practical modeling methods in future studies.
Data availability statement
Publicly available datasets were analyzed in this study. This data can be found here: https://portal.gdc.cancer.gov; https://www.ncbi.nlm.nih.gov/geo/query/acc.cgi?acc=GSE13507; https://www.ncbi.nlm.nih.gov/geo/query/acc.cgi?acc=GSE31684; https://www.ncbi.nlm.nih.gov/geo/query/acc.cgi?acc=GSE32894.
Ethics statement
The studies involving human participants were reviewed and approved by the Ethics Committee of the Fourth Affiliated Hospital of Harbin Medical University. The patients/participants provided their written informed consent to participate in this study.
Author contributions
Conceptualization, HW and XY. Methodology, HW. Software, HW and JL. Validation, HW and XZ. Formal analysis, HW. Investigation, HW. Resources, HW. Data curation, XY. Writing—original draft preparation, HW. Writing—review and editing, HW. Visualization, HW. Supervision, XY. All authors have read and agreed to the published version of the manuscript.
Conflict of interest
The authors declare that the research was conducted in the absence of any commercial or financial relationships that could be construed as a potential conflict of interest.
Publisher’s note
All claims expressed in this article are solely those of the authors and do not necessarily represent those of their affiliated organizations, or those of the publisher, the editors and the reviewers. Any product that may be evaluated in this article, or claim that may be made by its manufacturer, is not guaranteed or endorsed by the publisher.
Supplementary material
The Supplementary Material for this article can be found online at: https://www.frontiersin.org/articles/10.3389/fonc.2023.1116305/full#supplementary-material
References
1. Liu L, Hu J, Wang Y, Sun T, Zhou X, Li X, et al. Establishment of a novel risk score model by comprehensively analyzing the immunogen database of bladder cancer to indicate clinical significance and predict prognosis. Aging (2020) 12:11967–89. doi: 10.18632/aging.103364
2. Powles T, Bellmunt J, Comperat E, De Santis M, Huddart R, Loriot Y, et al. Bladder cancer: ESMO clinical practice guideline for diagnosis, treatment and follow-up. Ann Oncol (2022) 33:244–58. doi: 10.1016/j.annonc.2021.11.012
3. Sung H, Ferlay J, Siegel RL, Laversanne M, Soerjomataram I, Jemal A, et al. Global cancer statistics 2020: GLOBOCAN estimates of incidence and mortality worldwide for 36 cancers in 185 countries. CA: Cancer J Clin (2021) 71:209–49. doi: 10.3322/caac.21660
4. Tran L, Xiao JF, Agarwal N, Duex JE, Theodorescu D. Advances in bladder cancer biology and therapy. Nat Rev Cancer (2021) 21:104–21. doi: 10.1038/s41568-020-00313-1
5. Dobruch J, Oszczudłowski M. Bladder cancer: Current challenges and future directions. Medicina (Kaunas Lithuania) (2021) 57:749. doi: 10.3390/medicina57080749
6. Yan Y, Huang Z, Cai J, Tang P, Zhang F, Tan M, et al. Identification of a novel immune microenvironment signature predicting survival and therapeutic options for bladder cancer. Aging (2020) 13:2780–802. doi: 10.18632/aging.202327
7. Ma Y, Feng XF, Yang WX, You CG. Exploring the pathological mechanism of bladder cancer based on tumor mutational burden analysis. BioMed Res Int (2019) 2019:1093815. doi: 10.1155/2019/1093815
8. Maung MT, Carlson A, Olea-Flores M, Elkhadragy L, Schachtschneider KM, Navarro-Tito N, et al. The molecular and cellular basis of copper dysregulation and its relationship with human pathologies. FASEB J (2021) 35:e21810. doi: 10.1096/fj.202100273RR
9. Tsang T, Davis CI, Brady DC. Copper biology. Curr biol: CB (2021) 31:R421–r7. doi: 10.1016/j.cub.2021.03.054
10. Jakubowski H. Copper, heart disease and homocysteine thiolactone. J Internal Med (2021) 290:229–30. doi: 10.1111/joim.13074
11. Li YP, Ben Fekih I, Chi Fru E, Moraleda-Munoz A, Li X, Rosen BP, et al. Antimicrobial activity of metals and metalloids. Annu Rev Microbiol (2021) 75:175–97. doi: 10.1146/annurev-micro-032921-123231
12. Tarnacka B, Jopowicz A, Maślińska M. Copper, iron, and manganese toxicity in neuropsychiatric conditions. Int J Mol Sci (2021) 22:7820. doi: 10.3390/ijms22157820
13. Ge EJ, Bush AI, Casini A, Cobine PA, Cross JR, DeNicola GM, et al. Connecting copper and cancer: from transition metal signalling to metalloplasia. Nat Rev Cancer (2022) 22:102–13. doi: 10.1038/s41568-021-00417-2
14. Shanbhag VC, Gudekar N, Jasmer K, Papageorgiou C, Singh K, Petris MJ. Copper metabolism as a unique vulnerability in cancer. Biochim Biophys Acta Mol Cell Res (2021) 1868:118893. doi: 10.1016/j.bbamcr.2020.118893
15. Dogan C, Yazıcı CM, Akgül M, Türker P. The evaluation of the relation between bladder cancer and oxidative stress using NRF-2/KEAP-1 pathway, zinc and copper levels. Urol J (2021) 18:422–8. doi: 10.22037/uj.v18i.6439
16. Wigner P, Grębowski R, Bijak M, Saluk-Bijak J, Szemraj J. The interplay between oxidative stress, inflammation and angiogenesis in bladder cancer development. Int J Mol Sci (2021) 22:4483. doi: 10.3390/ijms22094483
17. Cobine PA, Brady DC. Cuproptosis: Cellular and molecular mechanisms underlying copper-induced cell death. Mol Cell (2022) 82:1786–7. doi: 10.1016/j.molcel.2022.05.001
18. Jiang Y, Huo Z, Qi X, Zuo T, Wu Z. Copper-induced tumor cell death mechanisms and antitumor theragnostic applications of copper complexes. Nanomed (London England) (2022) 17:303–24. doi: 10.2217/nnm-2021-0374
19. Lutsenko S. Dynamic and cell-specific transport networks for intracellular copper ions. J Cell Sci (2021) 134:jcs240523. doi: 10.1242/jcs.240523
20. Zhong CC, Zhao T, Hogstrand C, Chen F, Song CC, Luo Z. Copper (Cu) induced changes of lipid metabolism through oxidative stress-mediated autophagy and Nrf2/PPARγ pathways. J Nutr Biochem (2022) 100:108883. doi: 10.1016/j.jnutbio.2021.108883
21. Blades B, Ayton S, Hung YH, Bush AI, La Fontaine S. Copper and lipid metabolism: A reciprocal relationship. Biochim Biophys Acta Gen Subj (2021) 1865:129979. doi: 10.1016/j.bbagen.2021.129979
22. Cui L, Gouw AM, LaGory EL, Guo S, Attarwala N, Tang Y, et al. Mitochondrial copper depletion suppresses triple-negative breast cancer in mice. Nat Biotechnol (2021) 39:357–67. doi: 10.1038/s41587-020-0707-9
23. Leek JT, Johnson WE, Parker HS, Jaffe AE, Storey JD. The sva package for removing batch effects and other unwanted variation in high-throughput experiments. Bioinf (Oxford England) (2012) 28:882–3. doi: 10.1093/bioinformatics/bts034
24. Wilkerson MD, Hayes DN. ConsensusClusterPlus: a class discovery tool with confidence assessments and item tracking. Bioinf (Oxford England) (2010) 26:1572–3. doi: 10.1093/bioinformatics/btq170
25. Fife D. Flexplot: Graphically-based data analysis. Psychol Methods (2022) 27:477–96. doi: 10.1037/met0000424
26. Ritchie ME, Phipson B, Wu D, Hu Y, Law CW, Shi W, et al. Limma powers differential expression analyses for RNA-sequencing and microarray studies. Nucleic Acids Res (2015) 43:e47. doi: 10.1093/nar/gkv007
27. Wu T, Hu E, Xu S, Chen M, Guo P, Dai Z, et al. clusterProfiler 4.0: A universal enrichment tool for interpreting omics data. Innovation (Cambridge (Mass)) (2021) 2:100141. doi: 10.1016/j.xinn.2021.100141
28. Friedman J, Hastie T, Tibshirani R. Regularization paths for generalized linear models via coordinate descent. J Stat software (2010) 33:1–22. doi: 10.18637/jss.v033.i01
29. Newman AM, Liu CL, Green MR, Gentles AJ, Feng W, Xu Y, et al. Robust enumeration of cell subsets from tissue expression profiles. Nat Methods (2015) 12:453–7. doi: 10.1038/nmeth.3337
30. Geeleher P, Cox N, Huang RS. pRRophetic: an r package for prediction of clinical chemotherapeutic response from tumor gene expression levels. PloS One (2014) 9:e107468. doi: 10.1371/journal.pone.0107468
31. Cobine PA, Moore SA, Leary SC. Getting out what you put in: Copper in mitochondria and its impacts on human disease. Biochim Biophys Acta Mol Cell Res (2021) 1868:118867. doi: 10.1016/j.bbamcr.2020.118867
32. Hinshaw DC, Shevde LA. The tumor microenvironment innately modulates cancer progression. Cancer Res (2019) 79:4557–66. doi: 10.1158/0008-5472.Can-18-3962
33. Oliveri V. Selective targeting of cancer cells by copper ionophores: An overview. Front Mol Biosci (2022) 9:841814. doi: 10.3389/fmolb.2022.841814
34. Li SR, Bu LL, Cai L. Cuproptosis: lipoylated TCA cycle proteins-mediated novel cell death pathway. Signal Transduction Targeted Ther (2022) 7:158. doi: 10.1038/s41392-022-01014-x
35. Lei X, Lei Y, Li JK, Du WX, Li RG, Yang J, et al. Immune cells within the tumor microenvironment: Biological functions and roles in cancer immunotherapy. Cancer Lett (2020) 470:126–33. doi: 10.1016/j.canlet.2019.11.009
36. Xiao Y, Yu D. Tumor microenvironment as a therapeutic target in cancer. Pharmacol Ther (2021) 221:107753. doi: 10.1016/j.pharmthera.2020.107753
37. Yang M, Li J, Gu P, Fan X. The application of nanoparticles in cancer immunotherapy: Targeting tumor microenvironment. Bioactive Mater (2021) 6:1973–87. doi: 10.1016/j.bioactmat.2020.12.010
38. Nagata S, Tanaka M. Programmed cell death and the immune system. Nat Rev Immunol (2017) 17:333–40. doi: 10.1038/nri.2016.153
39. Li L, Jiang M, Qi L, Wu Y, Song D, Gan J, et al. Pyroptosis, a new bridge to tumor immunity. Cancer Sci (2021) 112:3979–94. doi: 10.1111/cas.15059
40. Loveless R, Bloomquist R, Teng Y. Pyroptosis at the forefront of anticancer immunity. J Exp Clin Cancer Res CR (2021) 40:264. doi: 10.1186/s13046-021-02065-8
41. Khan I, Yousif A, Chesnokov M, Hong L, Chefetz I. A decade of cell death studies: Breathing new life into necroptosis. Pharmacol Ther (2021) 220:107717. doi: 10.1016/j.pharmthera.2020.107717
42. Yuan H, Pratte J, Giardina C. Ferroptosis and its potential as a therapeutic target. Biochem Pharmacol (2021) 186:114486. doi: 10.1016/j.bcp.2021.114486
43. Bedoui S, Herold MJ, Strasser A. Emerging connectivity of programmed cell death pathways and its physiological implications. Nat Rev Mol Cell Biol (2020) 21:678–95. doi: 10.1038/s41580-020-0270-8
44. Ruiz LM, Libedinsky A, Elorza AA. Role of copper on mitochondrial function and metabolism. Front Mol Biosci (2021) 8:711227. doi: 10.89/fmolb.2021.711227
Keywords: bladder cancer, prognosis, cuproptosis, tumor microenvironment, therapy
Citation: Wang H, Li J, Zi X and Yuan X (2023) Comprehensive analysis of cuproptosis-related genes on bladder cancer prognosis, tumor microenvironment invasion, and drug sensitivity. Front. Oncol. 13:1116305. doi: 10.3389/fonc.2023.1116305
Received: 05 December 2022; Accepted: 30 January 2023;
Published: 21 February 2023.
Edited by:
Thierry Massfelder, (INSERM), FranceReviewed by:
Hao Chi, Southwest Medical University, ChinaFanen Yuan, University of Pittsburgh, United States
Zhu Zeng, Guizhou Medical University, China
Copyright © 2023 Wang, Li, Zi and Yuan. This is an open-access article distributed under the terms of the Creative Commons Attribution License (CC BY). The use, distribution or reproduction in other forums is permitted, provided the original author(s) and the copyright owner(s) are credited and that the original publication in this journal is cited, in accordance with accepted academic practice. No use, distribution or reproduction is permitted which does not comply with these terms.
*Correspondence: Xueli Yuan, eXVhbnh1ZWxpQGhyYm11LmVkdS5jbg==