 Sumaira Mubarik
 Fang Wang2
 Chuanhua Yu
95% of researchers rate our articles as excellent or good
Learn more about the work of our research integrity team to safeguard the quality of each article we publish.
Find out more
ORIGINAL RESEARCH article
Front. Oncol. , 10 February 2023
Sec. Cancer Epidemiology and Prevention
Volume 13 - 2023 | https://doi.org/10.3389/fonc.2023.1101249
This article is part of the Research Topic Update on Diagnostic and Prognostic Biomarkers for Women's Cancers View all 12 articles
Background: Precise breast cancer–related mortality forecasts are required for public health program and healthcare service planning. A number of stochastic model–based approaches for predicting mortality have been developed. The trends shown by mortality data from various diseases and countries are critical to the effectiveness of these models. This study illustrates the unconventional statistical method for estimating and predicting the mortality risk between the early-onset and screen-age/late-onset breast cancer population in China and Pakistan using the Lee–Carter model.
Methods: Longitudinal death data for female breast cancer from 1990 to 2019 obtained from the Global Burden of Disease study database were used to compare statistical approach between early-onset (age group, 25–49 years) and screen-age/late-onset (age group, 50–84 years) population. We evaluated the model performance both within (training period, 1990–2010) and outside (test period, 2011–2019) data forecast accuracy using the different error measures and graphical analysis. Finally, using the Lee–Carter model, we predicted the general index for the time period (2011 to 2030) and derived corresponding life expectancy at birth for the female breast cancer population using life tables.
Results: Study findings revealed that the Lee–Carter approach to predict breast cancer mortality rate outperformed in the screen-age/late-onset compared with that in the early-onset population in terms of goodness of fit and within and outside forecast accuracy check. Moreover, the trend in forecast error was decreasing gradually in the screen-age/late-onset compared with that in the early-onset breast cancer population in China and Pakistan. Furthermore, we observed that this approach had provided almost comparable results between the early-onset and screen-age/late-onset population in forecast accuracy for more varying mortality behavior over time like in Pakistan. Both the early-onset and screen-age/late-onset populations in Pakistan were expected to have an increase in breast cancer mortality by 2030. whereas, for China, it was expected to decrease in the early-onset population.
Conclusion: The Lee–Carter model can be used to estimate breast cancer mortality and so to project future life expectancy at birth, especially in the screen-age/late-onset population. As a result, it is suggested that this approach may be useful and convenient for predicting cancer-related mortality even when epidemiological and demographic disease data sets are limited. According to model predictions for breast cancer mortality, improved health facilities for disease diagnosis, control, and prevention are required to reduce the disease’s future burden, particularly in less developed countries.
Cancer is one of the leading causes of death and disability worldwide. Breast cancer (BC) is the most common cancer diagnosed in women and is the first leading cause of cancer-related mortality in women (1, 2). It develops from a single cell that divides and multiplies into a lump that can be detected clinically. Its severe form from cancer’s prolonged development is the metastasis phase that is the more challenging treated phase (3, 4). The most common clinical manifestations of BC are a tumorous mass in the breast, enlarged lymph nodes in the armpits, and distant metastases. Recent studies have found that chronic inflammation plays a role in the development and progression of BC, in addition to genetics and the environment (5–7). Stage at diagnosis has been confirmed as a key prognostic factor for BC, and the previous study revealed that the advanced (III) and metastatic stage (IV) are highly associated with lower survival rates (8). Consequently, addressing healthcare policies for early diagnosis may reduce the morbidity and mortality of BC.
The burden of BC has been rising faster in low- and middle-income countries (LMICs) compared with high-income countries in last three decades due to the lack of healthcare policies. Drafting public health policy and devising interventions against cancer require accurate data in LMICs. However, because of insufficient and demographic and disease registration data in LMICs, statisticians are unable to evaluate disease consequences. Among the previous studies on BC mortality predictive models, some studies used simple models such as the joinpoint model or single-population model (9), and some have used machine learning algorithms to predict specific mortality for BC based on specific populations (10), but the application of dynamic predictions and models for whole population or age-specific mortality is still lacking. The introduction of stochastic mortality models provides us an opportunity to forecast cancer-specific mortality in LMICs. A number of suitable statistical approaches for mortality prediction have been proposed, and the performance of these models differs in various diseases and countries (11–13).
Several efforts have been directed toward finding an appropriate model for the accurate prediction of age-specific death patterns. In this regard, various parametric curves (14, 15) were considered to predict the mortality rate by year. Following these concepts, different approaches are established to predict mortality rates using stochastic models (16–19). As part of stochastic mortality models, the Lee–Carter (LC) method of mortality forecasting has become one of the most useful tools for forecasting age-specific mortality rates, and it has been previously employed for this purpose in several works (20–22). The model posits that variations in mortality trends over time are governed solely by a single parameter ( kt. )the mortality index. The mortality forecast is created using this index by selecting an appropriate time series model (23). LC-based modeling frameworks are one of the most efficient and transparent methods of modeling and projecting mortality dynamics (13, 16, 20, 24–29). Moreover, this model has also been suggested for predicting cause-specific mortality rate, for instance, BC causes mortality, which follows a smooth curvilinear and rapid change pattern over time (24).
Most Asian countries are facing an increased BC burden and do not have sufficient health-related facilities like proper diagnosis, screening, and treatment. Moreover, because of population aging and increasing life expectancy, the disease burden has been shifting from communicable to non-communicable diseases in these countries. These countries are having similar circumstances related to population expansion and aging (13). Furthermore, because of the shortcomings in these countries’ statistical registry systems, researchers are constantly confronted with the challenge of insufficient and unsatisfactory demographic and disease registration data sets to undertake suitable statistical analysis. Given the scarcity of data and its poor quality, advanced statistical approaches may be useful in modeling and predicting the mortality patterns in developing countries, and the LC model is one of the good options (11, 12).
Age-specific BC incidence curves have been shown to superimpose two distinct rate curves, one for early-onset BC with a median age of diagnosis below 50 years and another for late-onset BC with a median age of diagnosis above 70 years, disproving the long-held belief that the inflection point in the overall curve occurs around menopause (30, 31). Therefore, this study investigates the application of the LC model for BC mortality prediction between early-onset and age-screen/late-screen female populations in China and Pakistan. In our study, two age groups of 25–49 years and 50–84 years are stratified to assess the model applicability, and the early-onset population was defined as BC occurring in women under the age of 50, whereas the late-onset population was recognized as BC occurring in women aged 50–84 years. It is proved that early-onset BC has more aggressive clinicopathological characteristic and worse prognosis (32), so more specific studies are needed to compare the disparities of BC mortality trends between the early-onset and screen-age/late-onset female population. To the best our knowledge, this is the first study using advanced statistical methods in evaluating and predicting the BC-related mortality trends between the early-onset and screen-age/late-onset population for two developing countries.
The annual mortality rates of the two Asian countries due to BC from 1990 to 2019 at the early-onset (age category of 25–49 years) and screen-age/late-onset (age category of 50–84 years) population were selected to run the application of the LC model. The Institute for Health Metrics and Evaluation (http://ghdx.healthdata.org/gbd-results-tool) provided BC mortality data for two Asian countries: China and Pakistan (33, 34). The availability of data and the sources are both included in the “Data and materials availability” declaration at the end of this study. BC mortality rates were calculated using the ratio of “number of deaths” to “exposure to risk”, which was grouped in a matrix for the specific age x and time t. We separated the data set into two parts to study the within-sample and out-of-sample model performance: training data set (1990–2010) and test data set (2011–2019). We fitted the) model on the training data set and evaluated the model performance using within and outside forecast accuracy.
The LC model (16) estimates mortality index kt. utilizing age-specific death rates. This assessment is made for the early-onset and screen-age/late-onset female population for China and Pakistan. The estimated model is evaluated for both goodness of fit and accuracy of forecast ability. Using the mortality index ( kt. )stimation, BC death rates and life expectancy may be predicted.
The LC model considers a statistical and demographic model that predicts mortality rates to derive life tables (16). The fundamental assumption of the model is that there is a linear connection between the age-specific death rates on logarithm scale ( mx,t). age interval x and time t. This relationship is described as follows:
Equation (1) can be expressed by taking natural logarithm on both sides as follows:
In Equation (2), mx,t. represents age-specific death rate for the x age interval and year t, ax. notes the average age-specific mortality, kt represents the mortality index in the year t, bx. a mortality deviation caused by changes in the kt. index, ext is the random error, and ω. the start of the last age interval (35).
There are various issues with parameter estimation when the bilinear term bxkt is present. Lee and Carter used a technique known as the singular value decomposition (SVD) to partially alleviate these issues. This method necessitates the assumption that the random component is homoscedastic. According to research, the sample’s variance is not distributed uniformly (36, 37). For instance, when contrasting the variance between the age ranges of 25–50 years and 50+ years, this phenomena is very obvious. The greatest likelihood method is an alternative to the SVD approach. We assume that the number of deaths is a random variable with a Poisson distribution while using this estimation technique.
The earlier research demonstrates that mortality modeling can be done successfully using the LC models. To estimate structural parameters, one can utilize the greatest likelihood technique. However, when simulating the number of deaths, additional distributions in addition to the Poisson distribution should be utilized. Previous studies have demonstrated that using the negative binomial distribution can produce positive outcomes when dealing with heterogeneous populations. In that instance, the LC model offered better results in terms of goodness of fit (36).
To get an estimate for the values of ax, bx and kt, a system of simultaneous equations is needed to be solved, which is called the system’s solutions. Therefore, death rates for various age groups (r) observed at different points in time (n) produces a system of equations containing 2r+n unknown variables that correspond to the total of the r values of ax, r values of bx, n values of kt, and the total number of equations is r×n. The matrix form of such system of equations can be represented as below:
D is an matrix of the order r×n, and an element Di, j represents the age-specific death rate (on natural logarithm scale) in the age group i in year j. A denotes a matrix with of order r×n. For the same year j, the elements that belong to the same categories are identical: aij=a2j=...arj, while b represents a vector of order r×1 and k is a vector of order 1×n
A unique solution of equation (3) can be arrived by imposing following two restrictions: .
When such restrictions are applied, the ax coefficient represents mean mortality rate over time. Therefore, the parameter bx and kt are calculated individually. The coefficients of ax are obtained from the following equation.
When the matrix A is computed, the system (3) may be recast as follows:
The aforementioned system offers a unique solution when these restrictions are met. The SVD technique is used to estimate the b and k parameters. This technique is used to get the best fit of least squares. D* can be expressed as the product of two matrices using SVD. The element (i, j) in D* shows the product of the ith row of B and the jth row of K, resulting in the following:
As a result, the decomposition yields r terms that exactly match the D* matrix element. Lee and Carter (16) proposed D* as the product of the b and k vectors. When employing SVD, these were regarded first-order approximations, i.e., D′ can be represented as follows:
Finally, B1=B and K1=K are computed, implying an initial estimate of the model’s parameters in equation (14).
In general, the results produced from the model’s initial estimates do not offer an acceptable match to the observed data. Lee and Carter (16) and Bell (38) point out that there may be deviations from the predictions. Therefore, a second step is required to estimate the parameters. This step utilizes the ax and bx values from the previous step to get a new estimate of kt reflecting that a total number of deaths for the given year must be observed. The goal is to determine kt values, which satisfy the following condition:
In Equation (8), Dt is the total number of deaths during the calendar year t. The population in the x age interval in the year t is denoted by Nx, t and ω is the age of the final observed group in mortality tables (16). The model estimation is carried out using the ilc package in R programming language (Development Core Team, 2008).
After obtaining the time series for the kt index as described in section (2, 3), autoregressive integrated moving average (ARIMA) model may be used to forecast such an index; then, it is possible to obtain the death rates for the anticipated years. In the equation, the predicted values of kn+h e substituted.
In Equation (9), n represents the most recent year for which data are available, h represents the prediction horizon, and x represents the age group. Equation (9) is used to forecast death rates based on the most recent death rate. To anticipate death rates, the LC model offered an approximate prediction interval (16). The interval is calculated using estimates of bx pameters and standard errors of the kt projections.
Age-specific life expectancy estimates the average number of years left in a person’s life, assuming that current mortality rates remain unchanged. It is computed by considering age-specific death rates (39). The standard technique of Chiang (40) is used to calculate life expectancy at birth using projected death rates. The life expectancy at x, ex., is stated as follows:
Tx presents the total number of years that the cohort has lived during the age interval and subsequent age intervals, and lx denotes number of individuals alive at the start of the x age interval from a population of l0 newborn infants. This is generally expressed as l0 =100,000 (23).
The predictive ability of the model was evaluated by mean absolute percent error (MAPE), using the following formula:
where , and H denotes the number of predicted sample size.
To assess the forecast ability of the model, both within-sample and out-of-sample forecast accuracy were tested. A model is deemed to be well-fit if it delivers a strong fit within-sample to the historical data and good out-of-sample forecasts. As a result, out-of-sample predictive accuracy was investigated to confirm the model’s predictive accuracy with consistency. The following steps were taken into account when evaluating forecast accuracy. To begin, we must select the metric of interest, which includes the anticipated variable. Forecasted variable measurements could include death rates, life expectancy, or future survival rates. As this study aims to examine the feasibility of stochastic mortality model on BC mortality data, therefore, we focused on BC mortality rates. We forecasted BC mortality rates from 2011 to 2019 using the fitted model and calculated life expectancy by comparing forecasts with the actual values.
We found that BC mortality has gradually grown with time when we examined the variations in BC mortality rates related to both age x and period t. Figure 1 depicts the general patterns in BC mortality rates from 1990 to 2019 for two countries to investigate this process. We may also see that death trends are not consistent between ages and throughout time. In both countries, there is an increasing disparity among older age groups (>50 years), particularly around the age of 84 years.
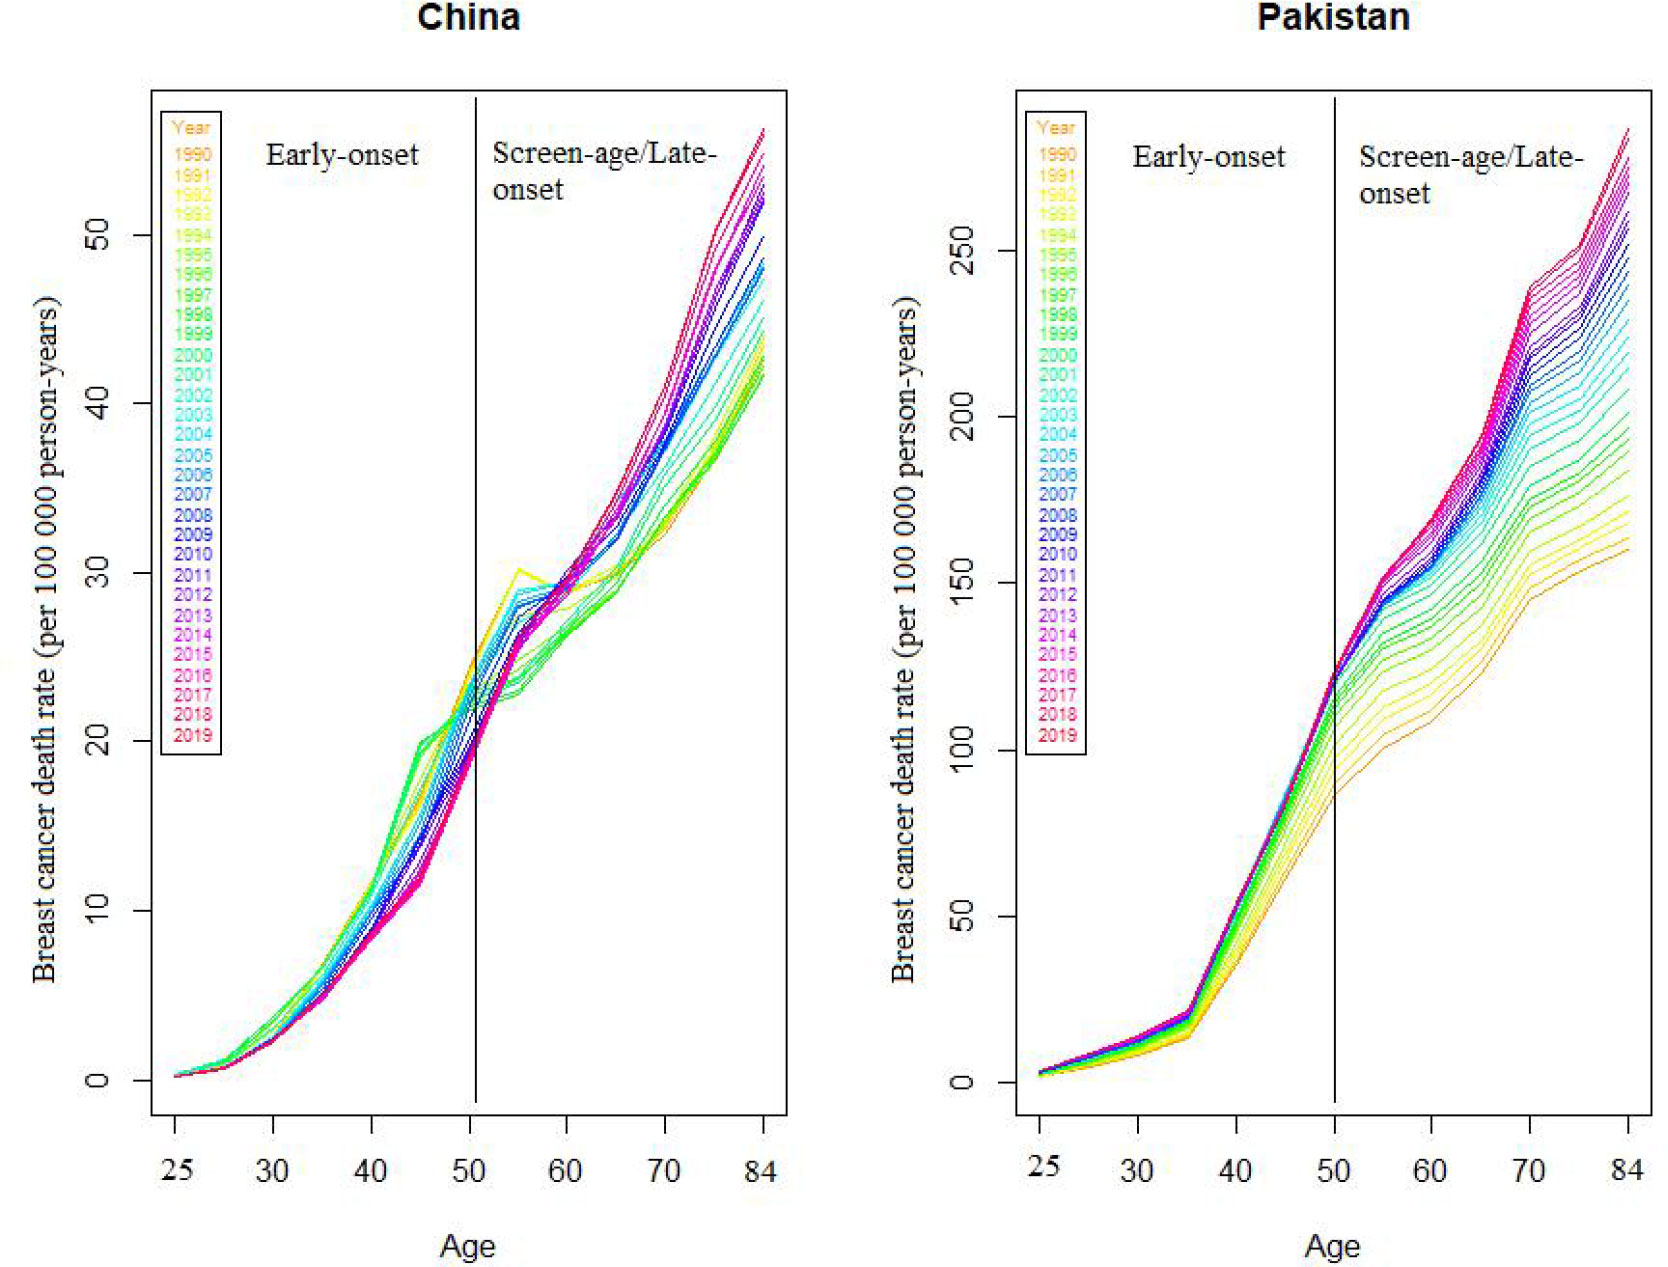
Figure 1 Death rates (per 100,000) due to female breast cancer in China and Pakistan, 1990–2019.
To assess the model’s within-sample and out-of-sample performance, we modified the model by removing the last 9 years of data from both countries’ data sets. Fitting the stochastic mortality model (LC) for both the early-onset and screen-age/late-onset population is the initial stage in the analytical process. Figure 2 shows the estimated parameters of the LC model for China and Pakistan for both the early-onset and screen-age/late-onset population. The model’s percentage of variation (PV) was around 86% and 89% between the early-onset and screen-age/late-onset population for the China, and 98% for both the early-onset and screen-age/late-onset population for Pakistan. The variation in PV between two countries’ data sets is caused by BC mortality patterns and various data features, as shown in Figure 1. We could show that the BC mortality rates at older ages were less consistent in Pakistani data than in China; as a result, the LC model fit the Pakistan data better and explained the higher PV in the screen-age/late-onset population than in China.
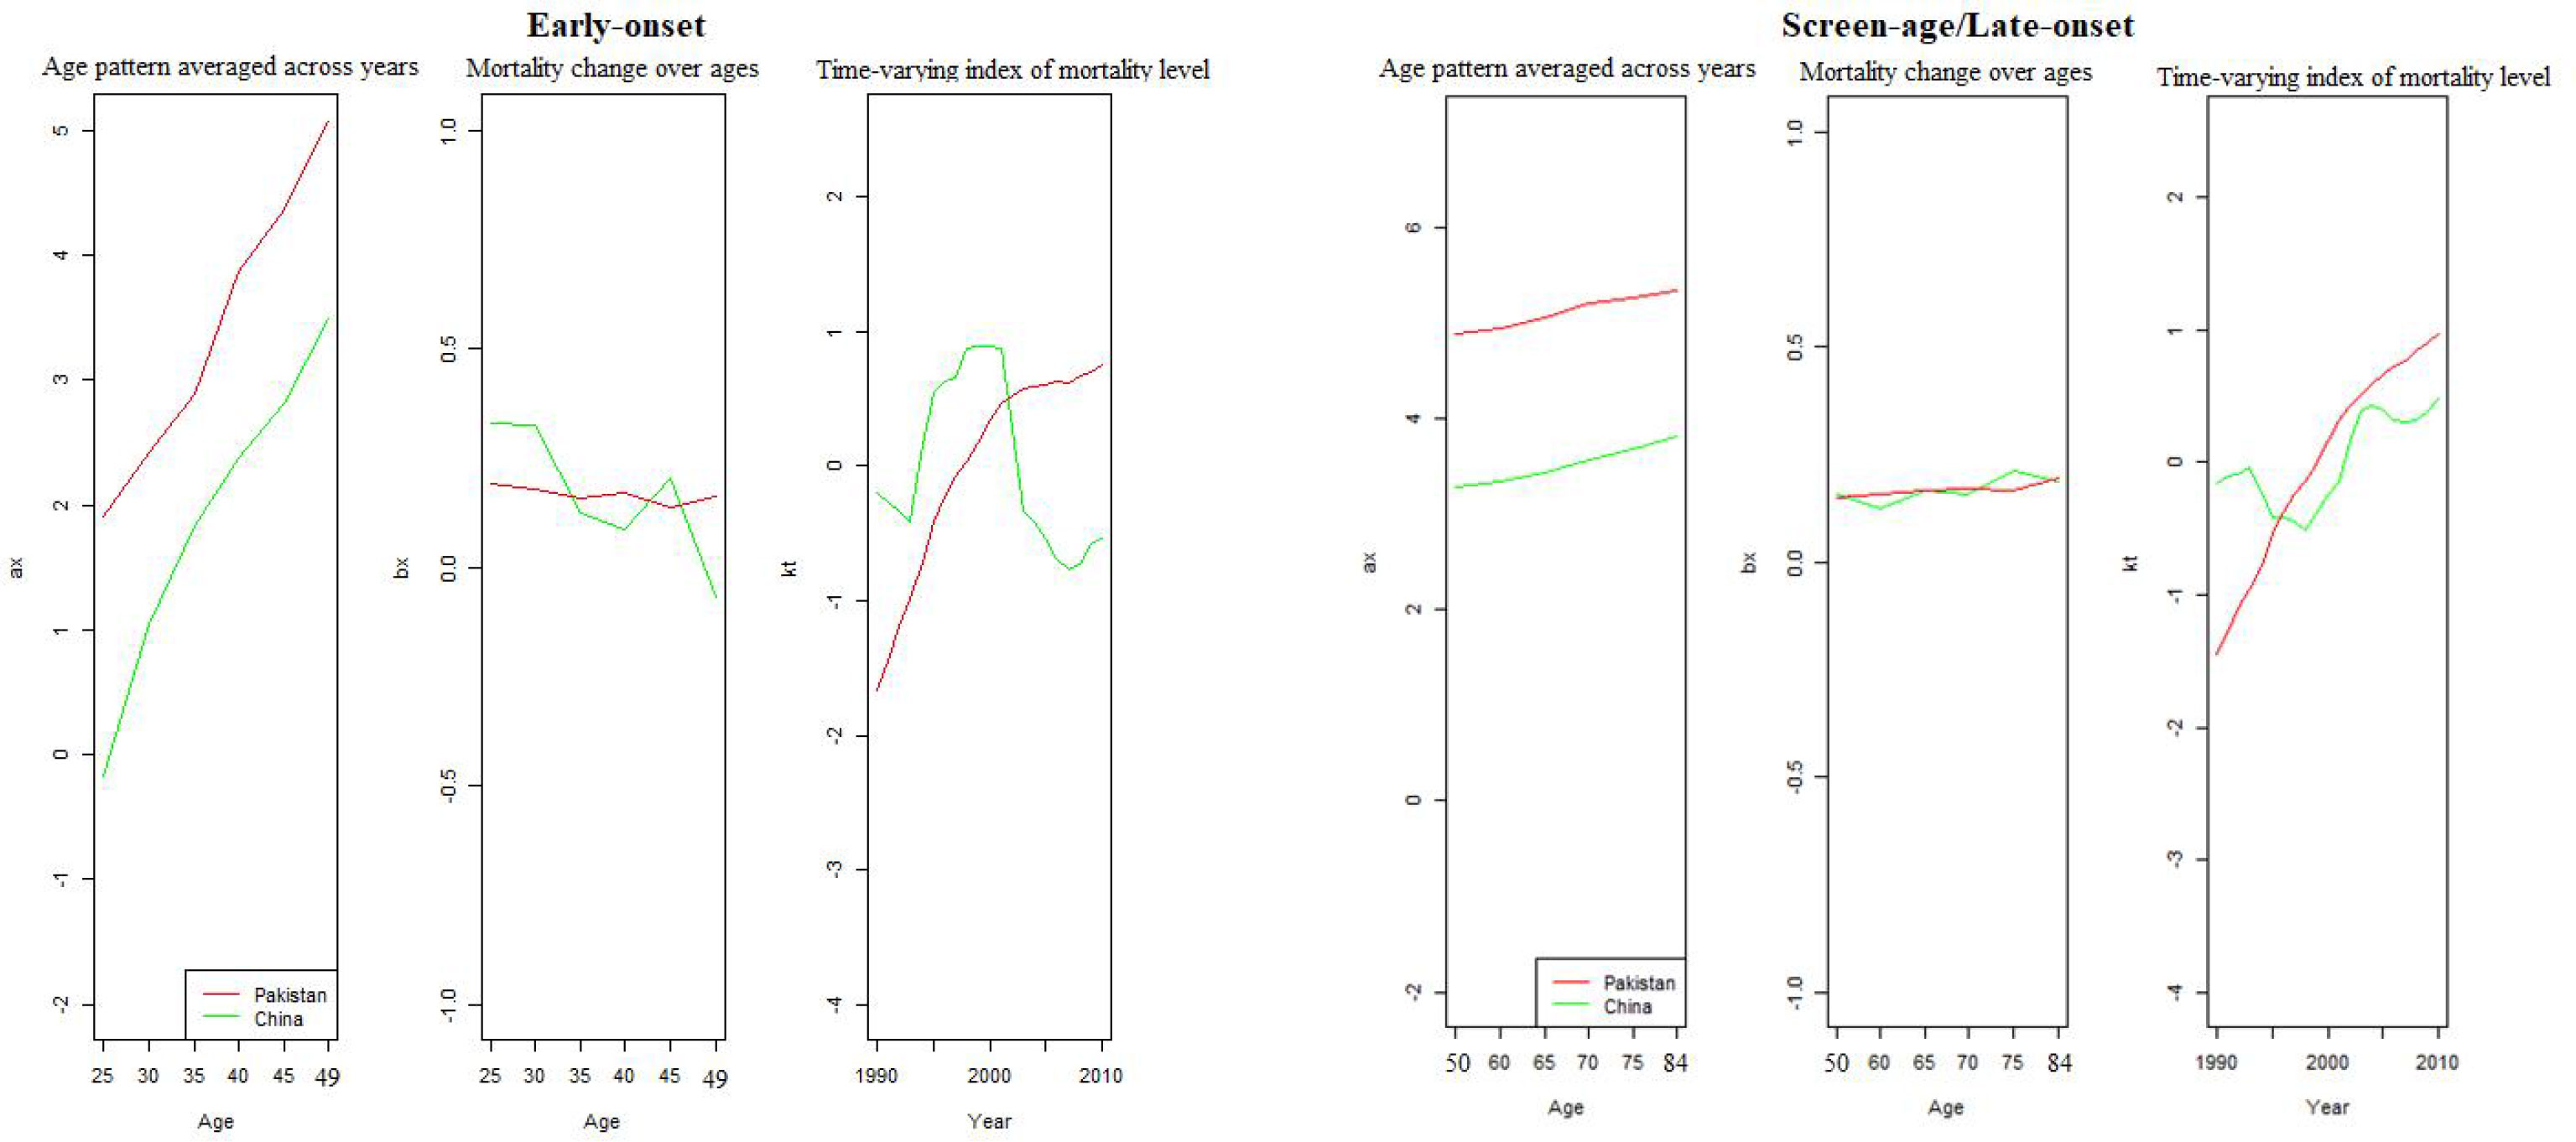
Figure 2 Model estimation between the early-onset and screen-age/late-onset population for China and Pakistan.
We can observe that the variance trend ( bx) among screen-age/late-onset population is gradually increasing with age for both China and Pakistan, whereas, over time (kt), these mortality differences are steadily growing after 2000; particularly, these differences were higher for Pakistan than that for China (Figure 2). Moreover, the fitted BC mortality rates by age and year through the LC model for both the early-onset and screen-age/late-onset population for China and Pakistan are depicted in Figure 3.
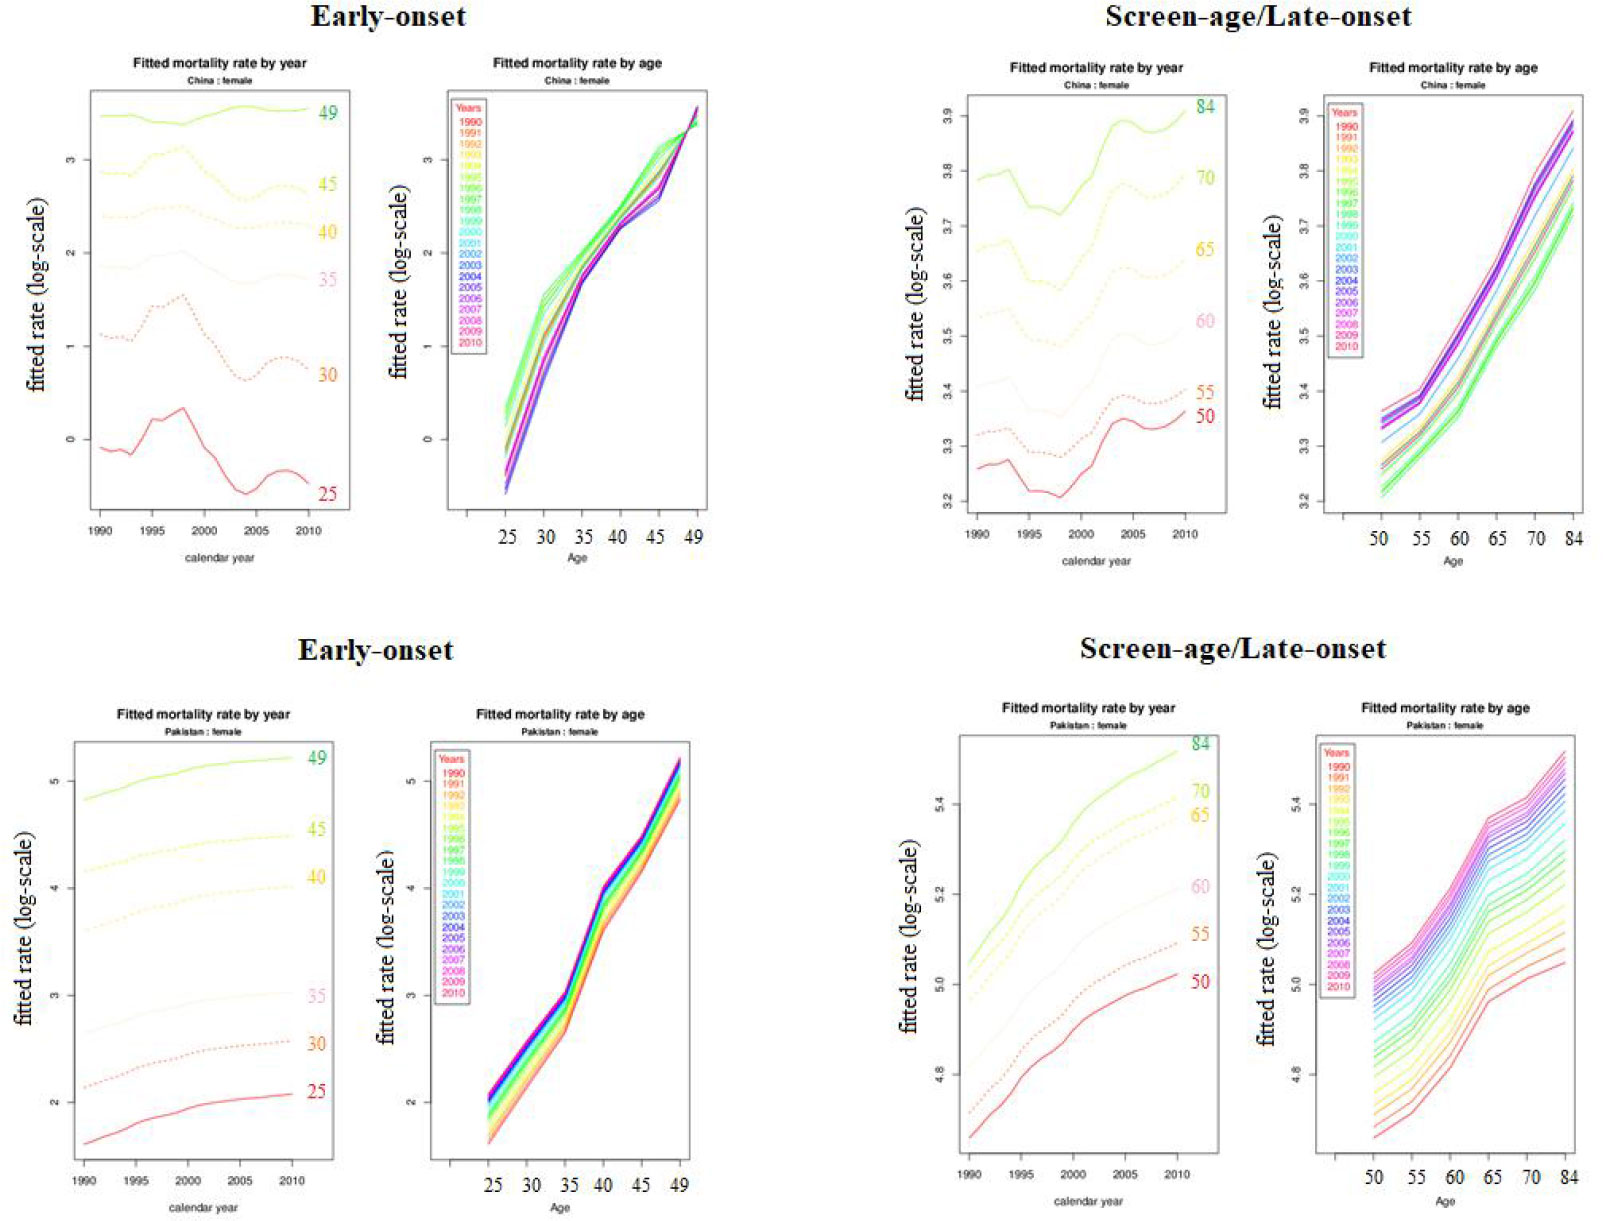
Figure 3 Fitted breast cancer mortality rate (log-scale) between the early-onset and screen-age/late-onset population for China and Pakistan.
When the residuals are independent and identically distributed, a matching fit is seen. To validate this condition, the fitted model’s residual death rates by age and year were calculated (Figure 4). In the screen-age/late-onset population, residual death rates by age and years were predicted to be more consistent. In Pakistan, these errors were lower than in China. Furthermore, error estimates were produced to confirm the error disparities across different population models, as shown in Table 1. By evaluating the error between the early-onset and screen-age/late-onset population, we noticed that the error measures for screen-age/late-onset model are smaller than the early-onset model. Between China and Pakistan, these errors were lower in the Pakistan’s data set compared with that in China (Table 1).
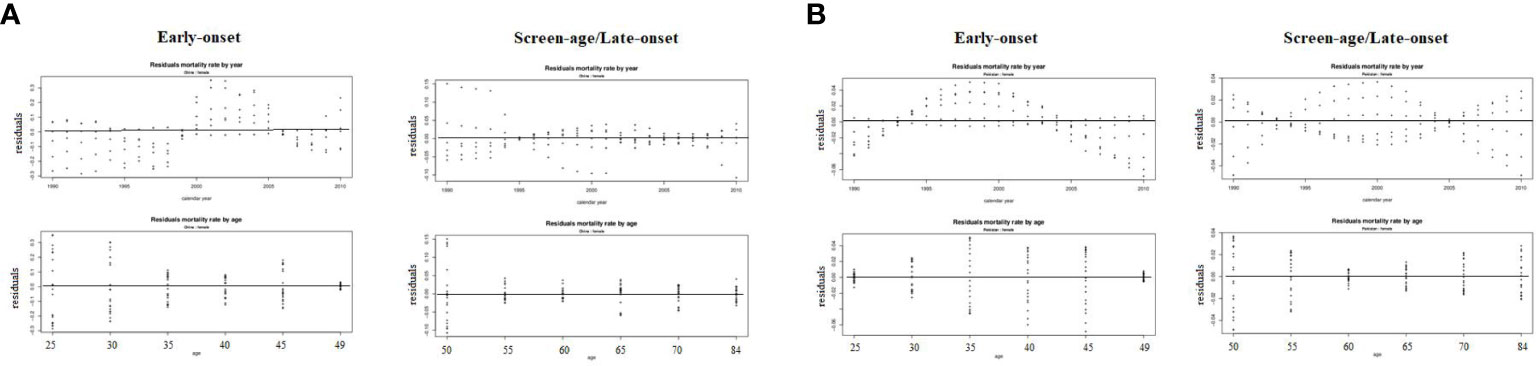
Figure 4 Residuals mortality rates by age and year from the LC model between the early-onset and screen-age/late-onset population in (A) China and (B) Pakistan.
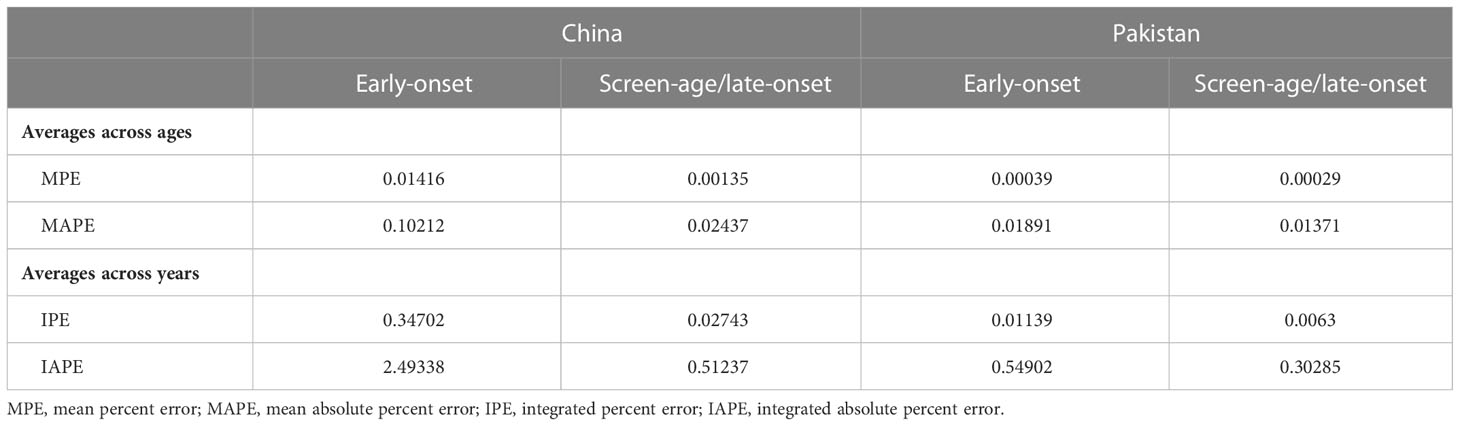
Table 1 Error measures from fitted Lee–Carter model of the early-onset and screen-age/late-onset breast cancer population for China and Pakistan.
Forecasts were calculated in our study on the basis of the evolution of time parameter ( kt); and errors in age parameters (ax and bx) were not considered because, according to the literature, the standard errors of (ax) and (bx) become less significant over forecast time in comparison to the standard error of parameter ( kt) (16). The model predicting ability for both the early-onset and screen-age/late-onset population for China and Pakistan is shown in Figure 5. Overall, we observe that the prediction error for the screen-age/late-onset model was lower than that for the early-onset model for both China and Pakistan. Furthermore, we observed that the LC approach has provided almost comparable results between the early-onset and screen-age/late-onset populations in forecasting accuracy for less invariant mortality behavior over time like in Pakistan (Figure 5). Moreover, the trend in forecast error (test data set) was gradually decreased in the screen-age/late-onset BC population than early-onset for both China and Pakistan (Figure 6).
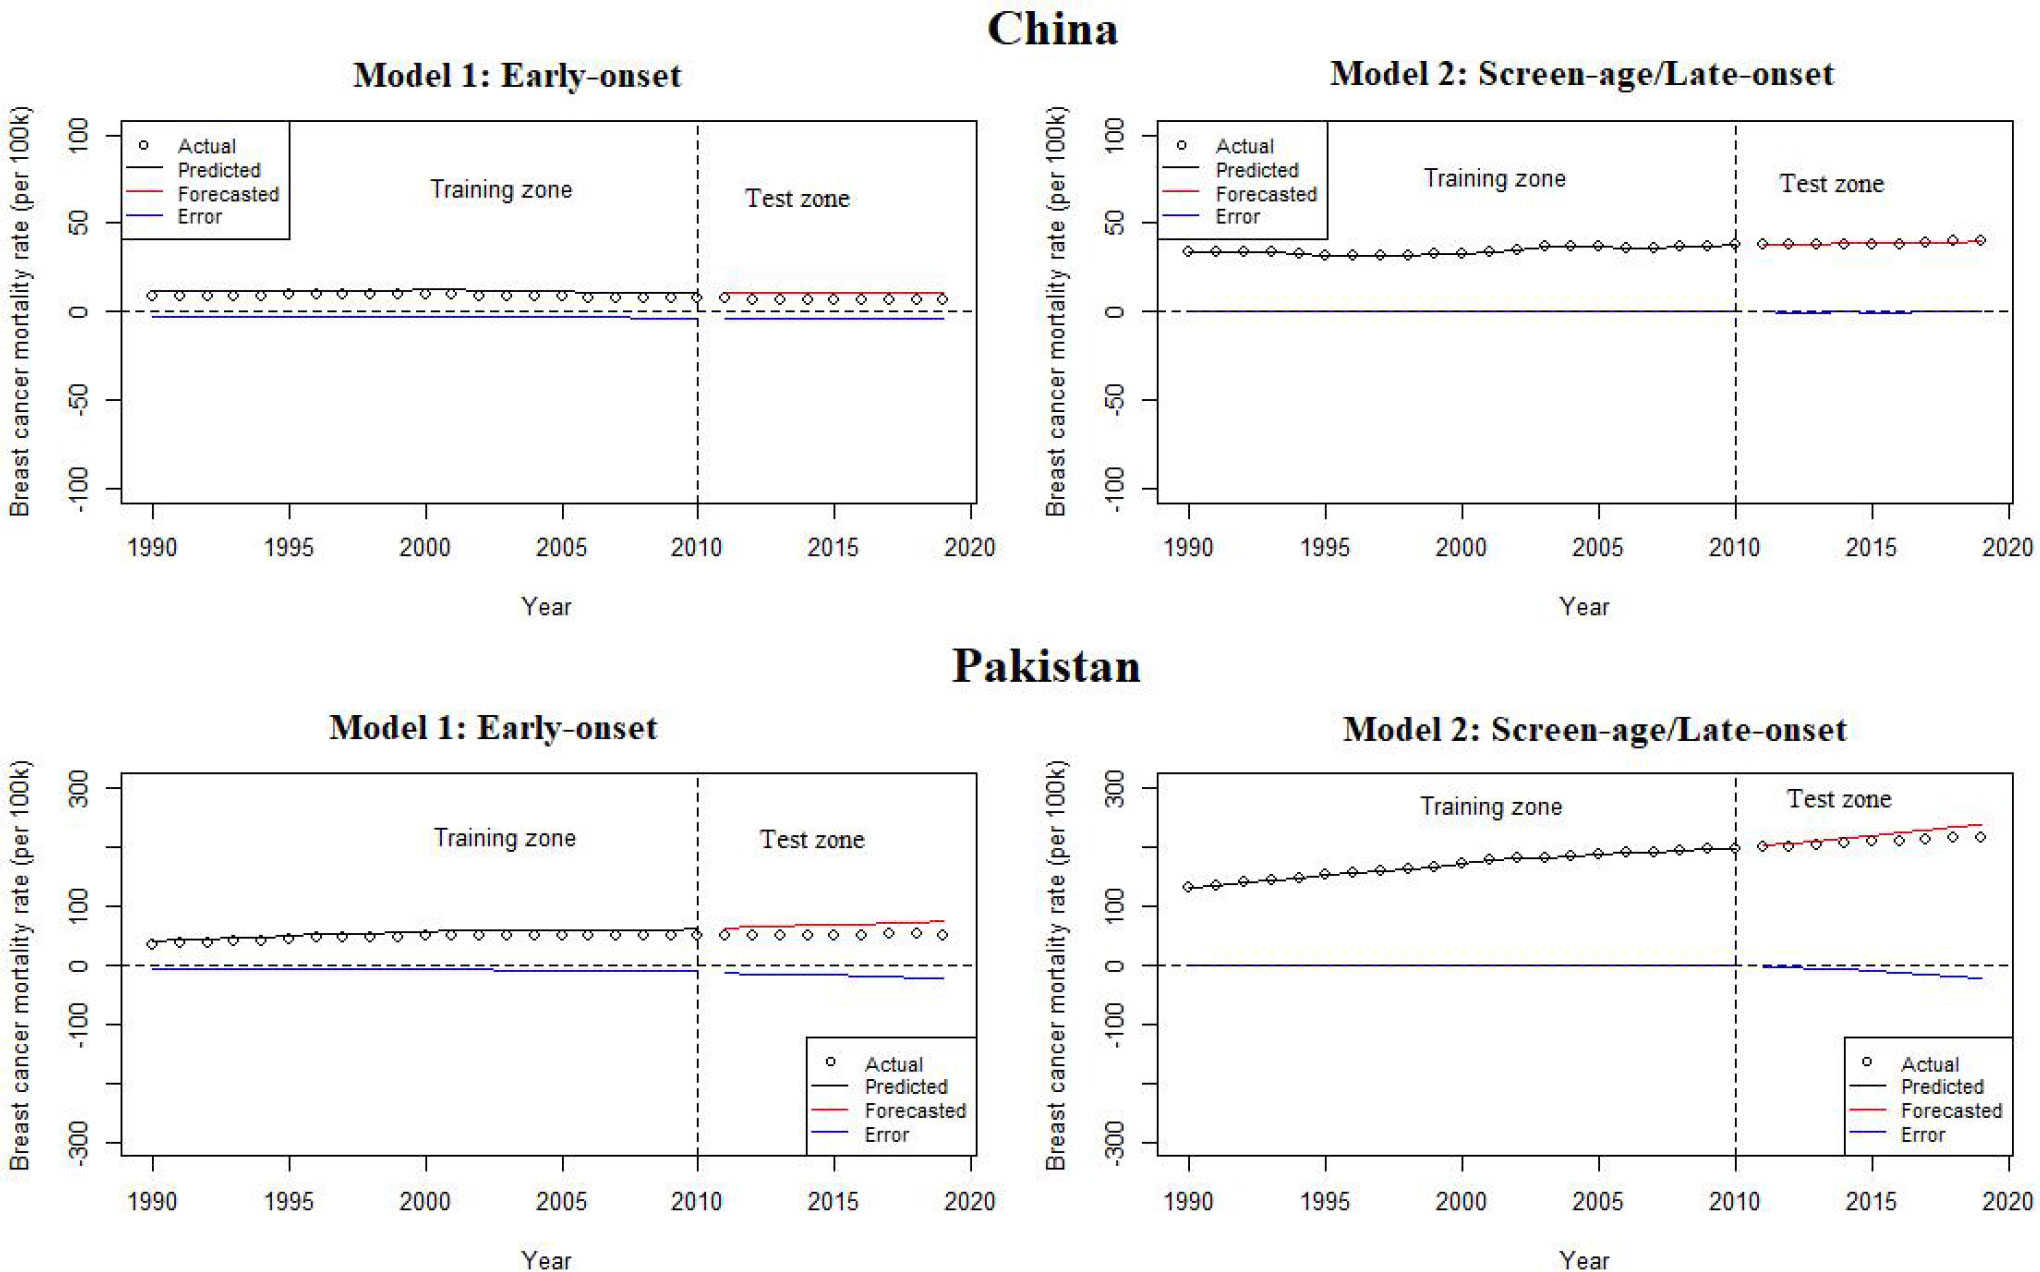
Figure 5 Lee–Carter model predicting ability between the early-onset and screen-age/late-onset population in China and Pakistan.
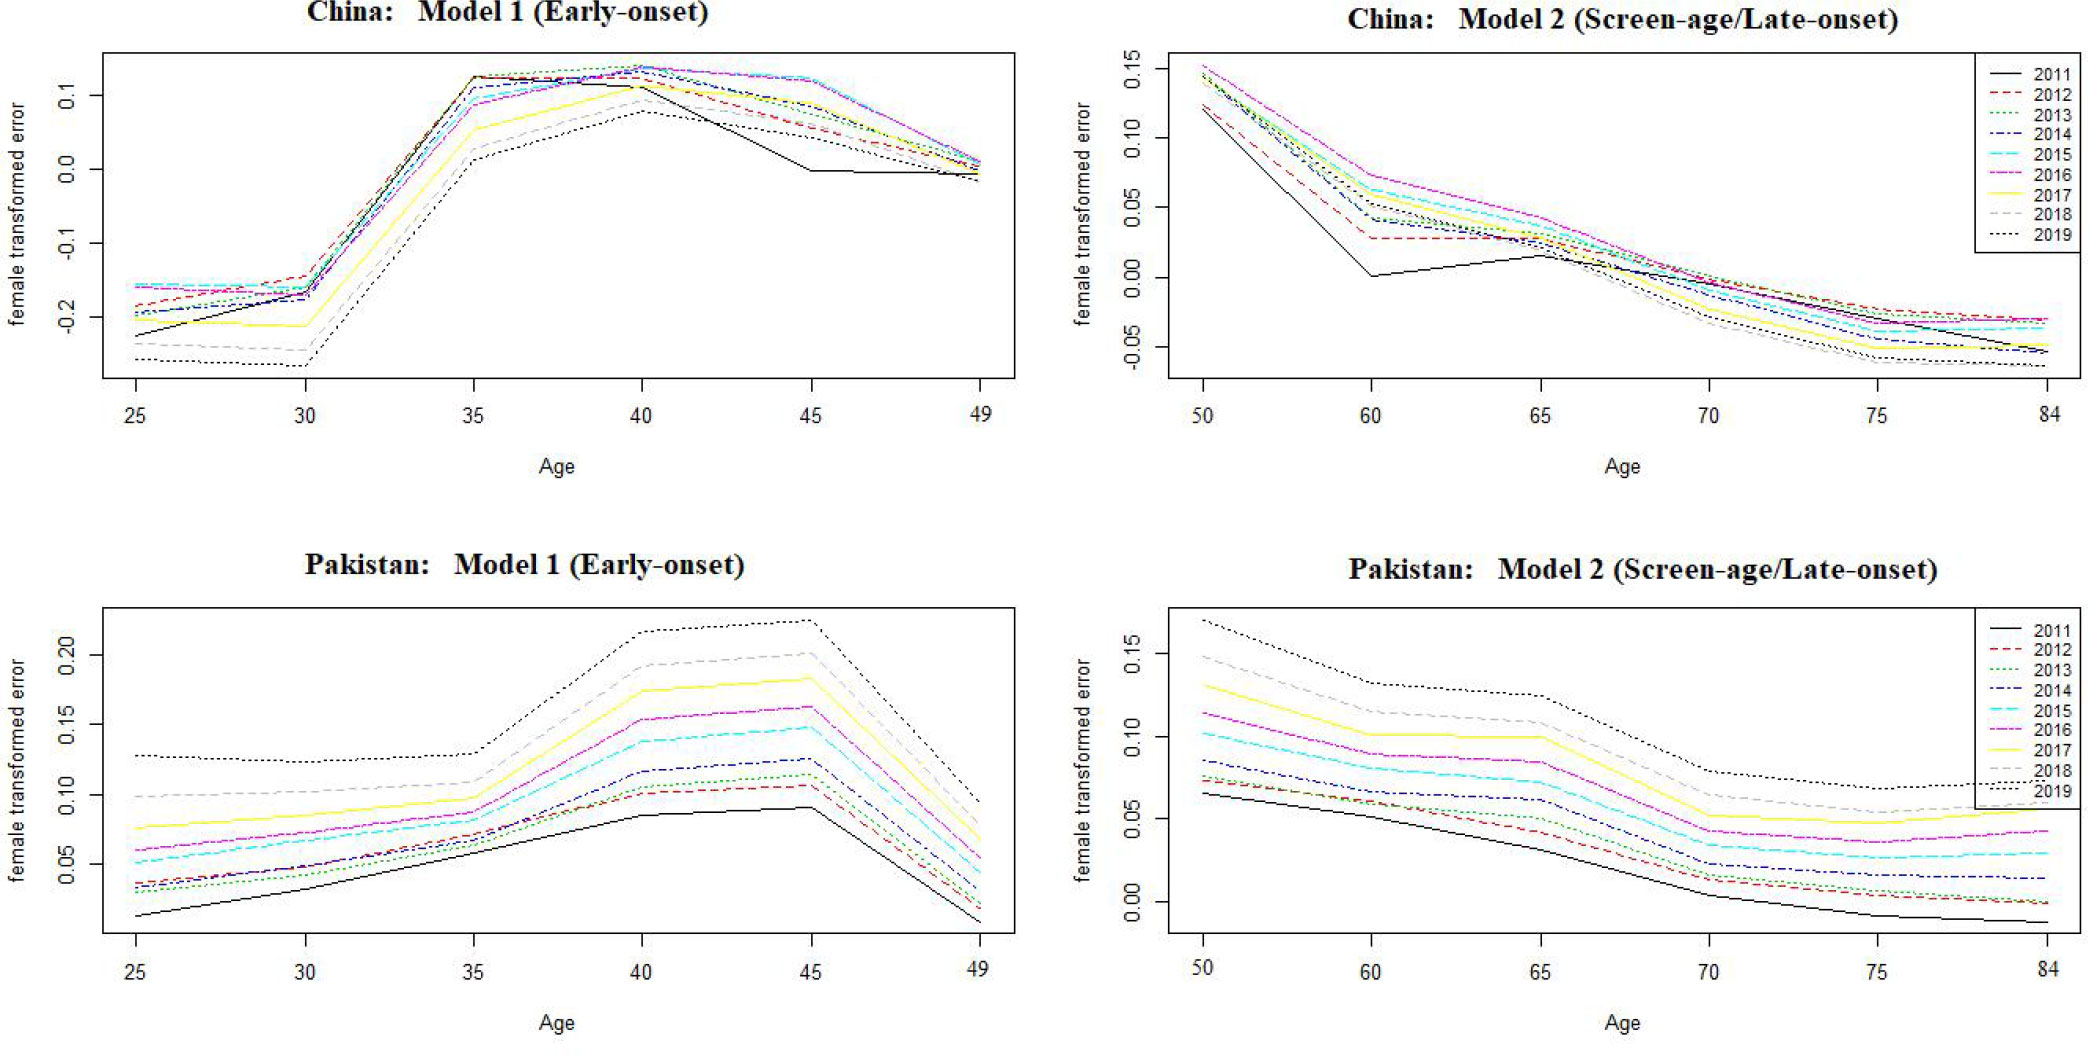
Figure 6 Forecast error over ages between the early-onset and screen-age/late-onset population in China and Pakistan.
To confirm the out-of-sample forecast accuracy, we also looked at the mean and variance of life expectancy forecast errors over the projected period. Table 2 demonstrates the minimum variance of life expectancy forecast error for both countries’ screen-age/late-onset populations. Finally, according to the model prediction, the BC mortality was predicted to increase by 2030 for both the early-onset and screen-age/late-onset population in Pakistan, whereas, for China, it was expected to decrease in early-onset population (Figure 7).
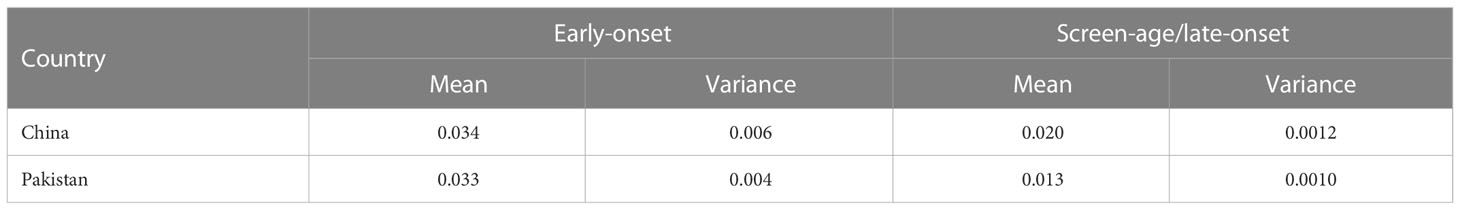
Table 2 Mean and variance of forecast error in life expectancy derived from the Lee–Carter model.
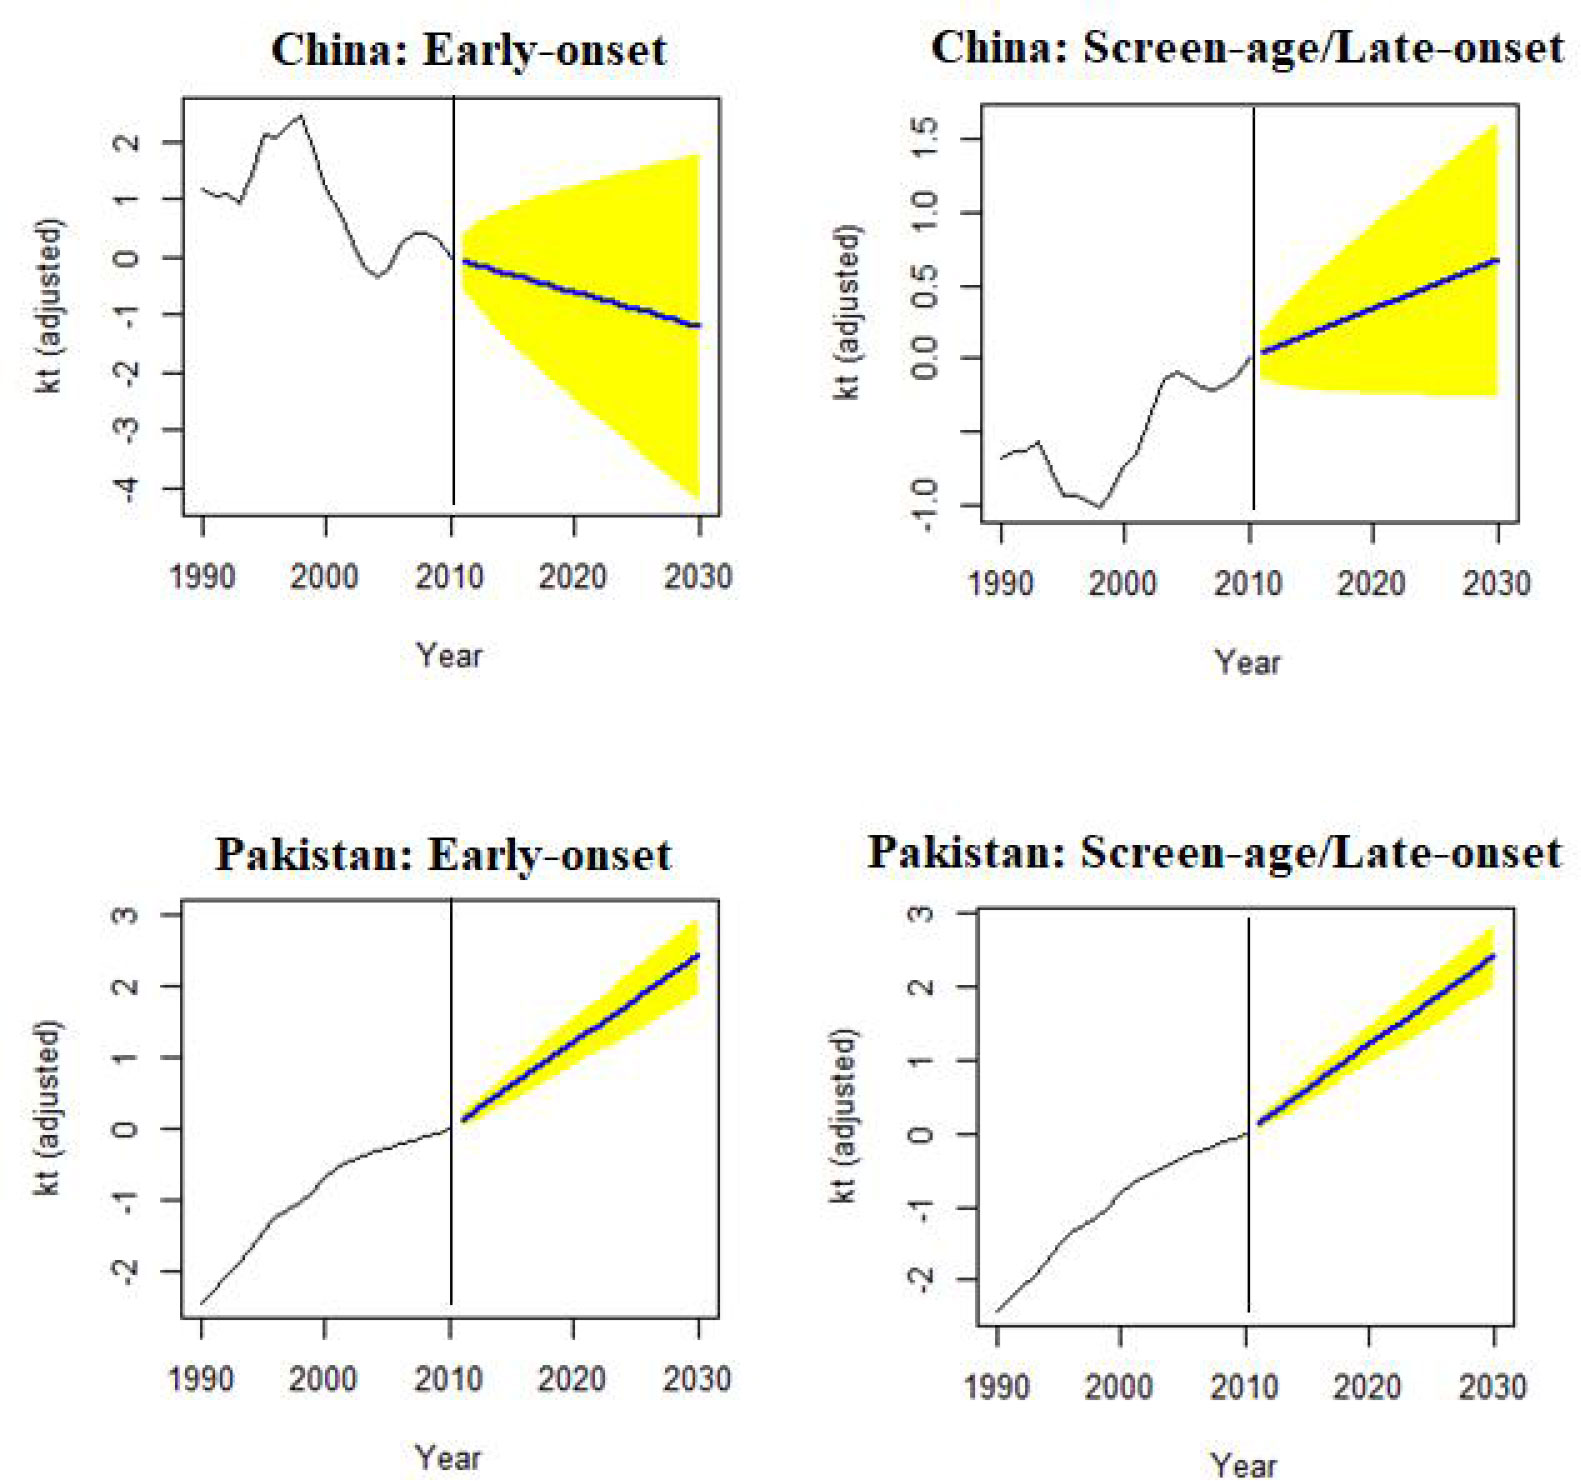
Figure 7 Forecast of mortality index (kt) to 2030, in the early-onset and screen-age/late-onset female breast cancer population for China and Pakistan.
This study presented the application and evaluation of the LC model on age-specific BC death rates between the early-onset and screen-age/late-onset female populations in China and Pakistan for the period 1990–2019. We separated the data set into two parts to study the within-sample and out-of-sample model performance: training data set (1990–2010) and test data set (2011–2019). We test the model on the training data set and assessed its performance using within and outside forecast accuracy. The index of the level of BC mortality between the early-onset and screen-age/late-onset population as well as and shape and sensitivity coefficient by age were found through this approach. The mortality rates for the period 2020 to 2030 were predicted using the ARIMA model between the early-onset and screen-age/late-onset in the female population for each country under study, and it is necessary to highlight that the period under this study represents the maximum period of data availability. The LC approach presented in this study provides the adequate fit on BC mortality data between the early-onset and screen-age/late-onset female populations for China and Pakistan. However, there were some differences in forecast accuracy measure between the early-onset and screen-age/late-onset population, where we have observed the most accurate fit and strong predictive ability of model for screen-age/late-onset population for both countries. The reason might be the more smoothing mortality behavior in this population as compared to the early-onset. In some the previous studies, the LC approach has been suggested for mortality prediction among older populations (13).
According to the recent estimation of Global Burden of Disease GBD, among women, BC caused the most disability-adjusted life years, deaths, and years lived with disability (41). The differences in age-specific BC mortality between the early-onset and screen-age/late-onset female population in China and Pakistan followed a smooth function with minor observational error. Our findings showed that BC has a high variance in older age groups, where the population is lesser, and, among younger age group too, the mortality rates were low. These findings are consistent with the previous studies, which revealed considerable variability in rates based on geography and age group, notably for mortality rates (42, 43). A related study found a similar pattern in US mortality statistics, where statisticians discovered that age-specific mortality was higher than 1.0/100,000 for very small populations (44). Stochastic mortality models represent forecasting mortality trend based on such data pattern, and these approaches have been applied in various studies in different countries for all-cause and cause-specific mortality prediction (28, 44–46).
The general mortality index (kt) is a time series analysis representing the variability over time. It shows a declining trend in BC mortality for the early-onset Chinese population and increasing trend for the screen-age/late-onset population in both China and Pakistan. The plausible reasons for the predicted decline in BC mortality are not yet clear and demand more research. Proper health infrastructure and therapies availability might explain some portion of predicted reductions in China among the young population. This method increases early detection while also providing efficient treatment. Most women under the age of 50 who work in cities have access to employer-sponsored services such as medical exams and free breast ultrasounds once or twice a year. Previous research has demonstrated that an ultrasound is performed before to Chinese women’s mammography to prevent and control BC (47). Mubarik et al. (2020) analyzed the trends and forecasts in BC mortality and predicted greater BC mortality rates among older populations in numerous Asian countries, including Pakistan, in 2030 (13). The rising behaviors in the patterns of BC mortality might be due to lack of BC early screening, diagnosis, and treatment regime, as compared with developed countries (13). The proposed model for risk factors and their roles in triggering BC therapy may be used in future studies to improve healthcare tactics targeting this disease.
This study presents the application and evaluation of the Lee and Carter’s approach for BC mortality prediction. As the LC method appears to be a method with probabilistic support, this strategy generates many measurements and outcomes that characterize current and future patterns in BC mortality. As in many other countries, the use of this strategy in China and Pakistan produced better outcomes in terms of least forecast error and diagnostic measures. It is important to note that the study duration is significantly shorter than those of Sweden, the United States, and Chile (16, 35, 48). These three investigations covered time spans of more than 100 years. The amount of projections that can be generated is affected by the time period under consideration. Because the LC model is entirely reliant on historical mortality and population statistics, it is critical to have solid data over a long period of time. This demonstrates the significance of obtaining data efficiently and keeping records up to date in a certain region, country, or sub-national level.
This study has some strengths. First of all, our study examined the applicability of the multi-population random mortality models, the LC dynamic mortality assessment model, in the prediction of BC mortality in China and Pakistan. The LC model is considered as one of the most representative dynamic models in the random prediction methods, but, as far as we know, this is the first time to verify the statistical model of BC mortality prediction in two developing countries. In addition, we further compared the differences in mortality trends of BC between the early-onset and screen-age/late-onset population and verified that the model was more accurate in predicting age/late onset group, filling the gap in this regard. Similarly, this study has some limitations. First, we conducted our analysis based on secondary data; therefore, the accuracy of the model simulation is limited by the accuracy of GBD estimates. Second, we did not consider other covariates that may affect the risk of death from BC in the two countries in the model evaluation, such as health policies and treatment conditions. Third, our model was trained and tested for different parts of the same data set, and the actual effect may not be as good as the alternative, which is to train on one data set and validated on the other data set, so that the external validation is more able to demonstrate the generality of the model. As, for validation, our work made use of a comparable data set. If screening, diagnostic, and treatment methods change between different centers and over time, further analysis using an independent data set would be helpful to assure adaptability.
The LC model can be considered to forecast BC mortality to project the future life expectancy at birth, particularly among the screen-age/late-onset population. By model prediction, BC mortality is expected to increase to 2030 for both the early-onset and screen-age/late-onset population in Pakistan. In China, it is likely to decrease for the early-onset population. Hence, this approach may be helpful and convenient to predict the cancer related mortality even for insufficient epidemiological and demographic disease data set. According to model prediction to BC mortality, better health facilities in terms of disease diagnosis, control, and prevention are needed to minimize this disease’s future burden, particularly in less developing countries.
Publicly available datasets were analyzed in this study. This data can be found here: The dataset analyzed during the current study are available in the Institute for Health Metrics and Evaluation (IHME): http://ghdx.healthdata.org/gbd-results-tool.
CY supervised the study. SM and CY conceptualized the analysis. SM did the data analysis and wrote the first draft of the paper. FW, LL, and KH reviewed and provided comments on the first draft. All authors reviewed and approved the final manuscript.
This research was funded by the National Natural Science Foundation of China (Grant No. 82173626) and Health Commission of Hubei Province Scientific Research Project (Grant No. WJ2019H304). The funders had no role in the study design, data collection, analysis, and decision to publish or preparation of the manuscript.
We acknowledge the contributions made by GBD study in Data.
The authors declare that the research was conducted in the absence of any commercial or financial relationships that could be construed as a potential conflict of interest.
All claims expressed in this article are solely those of the authors and do not necessarily represent those of their affiliated organizations, or those of the publisher, the editors and the reviewers. Any product that may be evaluated in this article, or claim that may be made by its manufacturer, is not guaranteed or endorsed by the publisher.
BC, breast cancer; LC, Lee–Carter; SVD, singular value decomposition; LMICs, low- and middle-income countries; GBD, global burden of diseases; DR, death rates; PV, percentage of variation; ASMR, age-standardized mortality rates; ARIMA, autoregressive integrated moving average; MAPE, mean absolute percent error.
1. Siegel RL, Miller KD, Fuchs HE, Jemal A. Cancer statistics, 2022. CA Cancer J Clin (2022) 72(1):7–33. doi: 10.3322/caac.21708
2. Giaquinto AN, Sung H, Miller KD, Kramer JL, Newman LA, Minihan A, et al. Breast cancer statistics, 2022. CA Cancer J Clin (2022) 72(6):524–41. doi: 10.3322/caac.21754
3. Polyak K. Breast cancer: Origins and evolution. J Clin Invest. (2007) 117(11):3155–63. doi: 10.1172/JCI33295
4. Agostinetto E, Gligorov J, Piccart M. Systemic therapy for early-stage breast cancer: Learning from the past to build the future. Nat Rev Clin Oncol (2022) 19(12):763–74. doi: 10.1038/s41571-022-00687-1
5. Hanahan D, Weinberg RA. Hallmarks of cancer: The next generation. Cell (2011) 144(5):646–74. doi: 10.1016/j.cell.2011.02.013
6. Cortazar P, Zhang L, Untch M, Mehta K, Costantino JP, Wolmark N, et al. Pathological complete response and long-term clinical benefit in breast cancer: The CTNeoBC pooled analysis. Lancet (2014) 384(9938):164–72. doi: 10.1016/S0140-6736(13)62422-8
7. Savas P, Salgado R, Denkert C, Sotiriou C, Darcy PK, Smyth MJ, et al. Clinical relevance of host immunity in breast cancer: From TILs to the clinic. Nat Rev Clin Oncol (2016) 13(4):228–41. doi: 10.1038/nrclinonc.2015.215
8. Arnold M, Morgan E, Rumgay H, Mafra A, Singh D, Laversanne M, et al. Current and future burden of breast cancer: Global statistics for 2020 and 2040. Breast. (2022) 66:15–23. doi: 10.1016/j.breast.2022.08.010
9. Wojtyla C, Bertuccio P, Wojtyla A, La Vecchia C. European Trends in breast cancer mortality, 1980–2017 and predictions to 2025. Eur J Cancer. (2021) 152:4–17. doi: 10.1016/j.ejca.2021.04.026
10. Zhou C-M, Xue Q, Wang Y, Tong J, Ji M, Yang J-J. Machine learning to predict the cancer-specific mortality of patients with primary non-metastatic invasive breast cancer. Surg Today (2021) 51(5):756–63. doi: 10.1007/s00595-020-02170-9
11. Mubarik S, Sharma R, Hussain SR, Iqbal M. Breast cancer mortality trends and predictions to 2030 and its attributable risk factors in East and south Asian countries. Front Nutr (2022) 9. doi: 10.3389/fnut.2022.847920
12. Lee S, Zelen M. Chapter 11: A stochastic model for predicting the mortality of breast cancer. JNCI Monographs. (2006) 2006(36):79–86. doi: 10.1093/jncimonographs/lgj011
13. Mubarik S, Wang F, Fawad M, Wang Y, Ahmad I, Yu C. Trends and projections in breast cancer mortality among four Asian countries (1990–2017): Evidence from five stochastic mortality models. Sci Rep (2020) 10(1):1–12. doi: 10.1038/s41598-020-62393-1
14. Pérez CYG, Guzmán VMG. Pronósticos estadísticos de mortalidad y su impacto sobre el sistema de Pensiones de México. Mexico (2007).
15. Gompertz B XXIV. On the nature of the function expressive of the law of human mortality, and on a new mode of determining the value of life contingencies. In a letter to Francis Baily, Esq. FRS &c. Philosophical transactions of the Royal Society of London London: Philosophical transactions of the Royal Society (1825) 31(115):513–83. doi: 10.1098/rstl.1825.0026
16. Lee RD, Carter LR. Modeling and forecasting US mortality. J Am Stat Assoc (1992) 87(419):659–71. doi: 10.1080/01621459.1992.10475265
17. Bell WR, Monsell B. Using principal components in time series modeling and forecasting of age-specific mortality rates. In: Proceedings of the American statistical association, social statistics section. Suitland: US Bureau of the Census. (1991) 154–9 pp.
18. McNown R, Rogers A. Forecasting mortality: A parameterized time series approach. Demography (1989) 26(4):645–60. doi: 10.2307/2061263
19. McNown R, Rogers A. Forecasting cause-specific mortality using time series methods. Int J Forecasting. (1992) 8(3):413–32. doi: 10.1016/0169-2070(92)90056-F
20. Li N, Lee R, Tuljapurkar S. Using the Lee–carter method to forecast mortality for populations with limited data. Int Stat Review. (2004) 72(1):19–36. doi: 10.1111/j.1751-5823.2004.tb00221.x
21. Booth H, Tickle L, Smith L. Evaluation of the variants of the Lee-carter method of forecasting mortality: a multi-country comparison. New Z Population Review. (2005) 31(1):13–34.
22. Dhandevi W, Kang HM, Ponnusamy RR. Lee-Carter Mortality Forecasting: Application to Mauritian Population. no. 2019. International Journal of Recent Technology and Engineering (IJRTE) (2019) 7(5S):169–75.
23. Alho JM. Stochastic methods in population forecasting. International Journal of forecasting. (1990) 6(4):521–30.
24. Mubarik S, Hu Y, Yu C. A multi-country comparison of stochastic models of breast cancer mortality with p-splines smoothing approach. BMC Med Res methodol (2020) 20(1):1–16. doi: 10.1186/s12874-020-01187-5
25. Booth H, Maindonald J, Smith L. Applying Lee-carter under conditions of variable mortality decline. Population Stud (2002) 56(3):325–36. doi: 10.1080/00324720215935
26. Koissi M-C, Shapiro AF, Högnäs G. Evaluating and extending the Lee–carter model for mortality forecasting: Bootstrap confidence interval. Insurance: Math Economics. (2006) 38(1):1–20. doi: 10.1016/j.insmatheco.2005.06.008
27. Booth H, Hyndman RJ, Tickle L, De Jong P. Lee-Carter mortality forecasting: A multi-country comparison of variants and extensions. Demog Res (2006) 15:289–310. doi: 10.4054/DemRes.2006.15.9
28. D'Amato V, Piscopo G, Russolillo M. The mortality of the italian population: Smoothing techniques on the lee–carter model. The Annals of Applied Statistics. Institute of Mathematical Statistics (2011) 5(2A):705–25. doi: 10.1214/10-AOAS394
29. Lyu P, Waegenaere AD, Melenberg B. A multi-population approach to forecasting all-cause mortality using cause-of-Death mortality data. North Am Actuarial J (2021) 25(sup1):S421–56. doi: 10.1080/10920277.2019.1662316
30. Benz CC. Impact of aging on the biology of breast cancer. Crit Rev Oncol Hematol (2008) 66(1):65–74. doi: 10.1016/j.critrevonc.2007.09.001
31. Matsuno RK, Anderson WF, Yamamoto S, Tsukuma H, Pfeiffer RM, Kobayashi K, et al. Early- and late-onset breast cancer types among women in the united states and Japan. Cancer Epidemiol Biomarkers Prev (2007) 16(7):1437–42. doi: 10.1158/1055-9965.EPI-07-0108
32. Li L, Yi Z, Li C, Guan X, Xu B, Ma F. Integrative clinical genomics of early-onset breast cancer. Journal of Clinical Oncology (2018) 36(15_suppl):1541. doi: 10.1200/JCO.2018.36.15_suppl.1541
33. Wang H, Abbas KM, Abbasifard M, Abbasi-Kangevari M, Abbastabar H, Abd-Allah F, et al. Global age-sex-specific fertility, mortality, healthy life expectancy (HALE), and population estimates in 204 countries and territories, 1950–2019: A comprehensive demographic analysis for the global burden of disease study 2019. Lancet (2020) 396(10258):1160–203. doi: 10.1016/S0140-6736(20)30977-6
34. Vos T, Lim SS, Abbafati C, Abbas KM, Abbasi M, Abbasifard M, et al. Global burden of 369 diseases and injuries in 204 countries and territories, 1990–2019: A systematic analysis for the global burden of disease study 2019. Lancet (2020) 396(10258):1204–22. doi: 10.1016/S0140-6736(20)30925-9
35. Wang JZ. Fitting and forecastin mortality for Sweden: Applying the Lee-carter model: Matematisk statistik. Stockholms universitet (2007).
36. Jodź K. Mortality in a heterogeneous population-Lee-Carter's methodology. arXiv preprint (2018) arXiv:1803.11233. doi: 10.48550/arXiv.1803.11233
38. Bell WR. Comparing and assessing time series methods for forecasting age-specific fertility and mortality rates. J Off Statistics. (1997) 13(3):279.
39. Ortega A. Aplicacion de la tabla de mortalidad en estudios de poblacion. En: Tablas de mortalidad-LC/DEM/CR/G. (1987) 16-1987:203–88.
40. Chiang CL. A stochastic study of the life table and its applications: II. Sample variance of the observed expectation of life and other biometric functions. Human biology. (1960) 32(3):221–38.
41. Kocarnik JM, Compton K, Dean FE, Fu W, Gaw BL, Harvey JD, et al. Cancer incidence, mortality, years of life lost, years lived with disability, and disability-adjusted life years for 29 cancer groups from 2010 to 2019: A systematic analysis for the global burden of disease study 2019. JAMA Oncol (2022) 8(3):420–44. doi: 10.1001/jamaoncol.2021.6987
42. Hu K, Ding P, Wu Y, Tian W, Pan T, Zhang S. Global patterns and trends in the breast cancer incidence and mortality according to sociodemographic indices: an observational study based on the global burden of diseases. BMJ Open (2019) 9(10):e028461. doi: 10.1136/bmjopen-2018-028461
43. Lima SM, Kehm RD, Terry MB. Global breast cancer incidence and mortality trends by region, age-groups, and fertility patterns. EClinicalMedicine (2021) 38:100985. doi: 10.1016/j.eclinm.2021.100985
44. Booth H, Hyndman RJ, Tickle L. Prospective life tables. In: Computational Actuarial Science with R. England and wales: Taylor and Francis group (2014) 319–44.
45. Camarda CG. MortalitySmooth: An r package for smoothing poisson counts with p-splines. J Stat Software (2012) 50(1):1–24. doi: 10.18637/jss.v050.i01
46. Currie ID, Durban M, Eilers PH. Smoothing and forecasting mortality rates. Stat model (2004) 4(4):279–98. doi: 10.1191/1471082X04st080oa
47. Shen S, Zhou Y, Xu Y, Zhang B, Duan X, Huang R, et al. A multi-centre randomised trial comparing ultrasound vs mammography for screening breast cancer in high-risk Chinese women. Br J cancer. (2015) 112(6):998–1004. doi: 10.1038/bjc.2015.33
Keywords: breast cancer, Lee-Carter model, forecast accuracy, life expectancy, MAPE
Citation: Mubarik S, Wang F, Luo L, Hezam K and Yu C (2023) Evaluation of Lee–Carter model to breast cancer mortality prediction in China and Pakistan. Front. Oncol. 13:1101249. doi: 10.3389/fonc.2023.1101249
Received: 25 November 2022; Accepted: 27 January 2023;
Published: 10 February 2023.
Edited by:
Ming Yi, Zhejiang University, ChinaReviewed by:
Yang Deng, Shandong First Medical University, ChinaCopyright © 2023 Mubarik, Wang, Luo, Hezam and Yu. This is an open-access article distributed under the terms of the Creative Commons Attribution License (CC BY). The use, distribution or reproduction in other forums is permitted, provided the original author(s) and the copyright owner(s) are credited and that the original publication in this journal is cited, in accordance with accepted academic practice. No use, distribution or reproduction is permitted which does not comply with these terms.
*Correspondence: Chuanhua Yu, eXVjaHVhQHdodS5lZHUuY24=
†ORCID: Kamal Hezam, orcid.org/0000-0001-6041-1061
Chuanhua Yu, orcid.org/0000-0002-5467-2481
Disclaimer: All claims expressed in this article are solely those of the authors and do not necessarily represent those of their affiliated organizations, or those of the publisher, the editors and the reviewers. Any product that may be evaluated in this article or claim that may be made by its manufacturer is not guaranteed or endorsed by the publisher.
Research integrity at Frontiers
Learn more about the work of our research integrity team to safeguard the quality of each article we publish.