 Tiantian Wang1†
 Ding Yan2†Zhaodi Liu3Lianxiang Xiao4
 Changhu Liang5
 Haotian Xin6
 Mengmeng Feng6
 Zijian Zhao2*
 Yong Wang1
- 1Department of Thyroid Surgery, the Second Affiliated Hospital of Zhejiang University College of Medicine, Hangzhou, China
- 2School of Control Science and Engineering, Shandong University, Jinan, China
- 3School of Medicine, Zhejiang University, Hangzhou, China
- 4Shandong Provincial Maternal and Child Health Care Hospital, Shandong University, Jinan, China
- 5Department of Radiology, Shandong Provincial Hospital Affiliated to Shandong First Medical University, Jinan, China
- 6Department of Radiology, Shandong Provincial Hospital, Shandong University, Jinan, China
Introduction: The incidence of thyroid diseases has increased in recent years, and cervical lymph node metastasis (LNM) is considered an important risk factor for locoregional recurrence. This study aims to develop a deep learning-based computer-aided diagnosis (CAD) method to diagnose cervical LNM with thyroid carcinoma on computed tomography (CT) images.
Methods: A new deep learning framework guided by the analysis of CT data for automated detection and classification of LNs on CT images is proposed. The presented CAD system consists of two stages. First, an improved region-based detection network is designed to learn pyramidal features for detecting small nodes at different feature scales. The region proposals are constrained by the prior knowledge of the size and shape distributions of real nodes. Then, a residual network with an attention module is proposed to perform the classification of LNs. The attention module helps to classify LNs in the fine-grained domain, improving the whole classification network performance.
Results: A total of 574 axial CT images (including 676 lymph nodes: 103 benign and 573 malignant lymph nodes) were retrieved from 196 patients who underwent CT for surgical planning. For detection, the data set was randomly subdivided into a training set (70%) and a testing set (30%), where each CT image was expanded to 20 images by rotation, mirror image, changing brightness, and Gaussian noise. The extended data set included 11,480 CT images. The proposed detection method outperformed three other detection architectures (average precision of 80.3%). For classification, ROI of lymph node metastasis labeled by radiologists were used to train the classification network. The 676 lymph nodes were randomly divided into 70% of the training set (73 benign and 401 malignant lymph nodes) and 30% of the test set (30 benign and 172 malignant lymph nodes). The classification method showed superior performance over other state-of-the-art methods with an accuracy of 96%, true positive and negative rates of 98.8 and 80%, respectively. It outperformed radiologists with an area under the curve of 0.894.
Discussion: The extensive experiments verify the high efficiency of the proposed method. It is considered instrumental in a clinical setting to diagnose cervical LNM with thyroid carcinoma using preoperative CT images. The future research can consider adding radiologists' experience and domain knowledge into the deep-learning based CAD method to make it more clinically significant.
Conclusion: The extensive experiments verify the high efficiency of the proposed method. It is considered instrumental in a clinical setting to diagnose cervical LNM with thyroid carcinoma using preoperative CT images.
1 Introduction
The incidence of functional thyroid diseases has increased in recent years, and such diseases have become the second most common endocrine disorders (1). Although differentiated thyroid cancers have a good prognosis and low mortality rate, cervical lymph node metastasis (LNM) has been reported in 60–70% of patients and is considered an important risk factor for locoregional recurrence (2–7). Therefore, accurate preoperative diagnosis of cervical LNM in thyroid carcinoma is crucial for the proper selection of clinical treatment regimens and the prognosis of patients (8).
Although ultrasonography is considered the first choice for evaluating cervical LNM in thyroid cancer patients (9–12), it has not shown sufficient accuracy in the diagnosis of LNM in previous studies (13–15). Ultrasonography can only detect 20-31% of patients with central cervical LNM, whereas the detection rate for lateral cervical LNM is 70-93.8% (14, 15). Computed tomography (CT) is recommended for preoperative examinations of cervical LNM as an adjunct to ultrasonography in recent research and treatment guidelines (16–19). However, CT scans’ spatial resolution and contrast resolution are not high enough for cervical lymph nodes (LNs) to be accurately detected, as these LNs are not obvious and cannot be easily distinguished from accompanying blood vessels. Therefore, the diagnostic accuracies using CT depends on the level of radiologists, which puts less experienced radiologists at a greater risk of misdiagnosis or missed diagnosis. Especially for determining the surgical extent with cervical LNs on CT, undertreatment of metastatic neck nodes during primary surgery due to underdiagnosis will cause local recurrence, overtreatment with prophylactic lateral compartment dissection will increase surgical morbidity (10, 11).
Recently, deep learning techniques, especially convolutional neural networks (CNNs) (20), have successfully solved different classification tasks using CT images in the computer-aided diagnosis (CAD) domain (21–24). Following this trend, Lee et al. evaluated the performance of eight CNNs (ResNet50 performed best) in diagnosing cervical LNM on CT images (7) and compared the diagnostic performance with that of radiologists using an external validation set (25), which only proved the effectiveness of deep learning in diagnosing cervical LNM using CT images, but ignored an important clinic question of CAD: how to find LNs on the CT images by deep learning.
This study attempts to make the CAD process more consistent with radiologists’ diagnostic considerations by introducing a novel deep learning framework guided by the analysis of CT data for automated detection and classification of LNs in CT images. The proposed CAD framework consists of two main steps: (1) detecting the LN locations by an improved Faster R-CNN network; (2) classifying detected LNs with a residual network with an attention module. In the first step, an improved faster region-based convolutional neural network (Faster R-CNN) (26) is constructed to detect LNs at several scales, where lower-level feature maps are considered for small LN detection. Also, to further improve detection performance, the real distributions of LN size and shape are applied to design reliable anchors of each feature scale in the proposed detection network, leading to better detection. In the second step, the network integrating a residual network with an attention module is constructed to classify LNs. The attention module helps to classify LNs in the fine-grained domain, which leads to better performance of the whole classification network. The experimental results demonstrate that the proposed approach effectively diagnoses LNM with superior diagnostic performance than those of the three existing CAD methods and experienced radiologists.
2 Materials
The protocol of this retrospective study was approved by the Ethics Committee of the Institutional Review Committee of the Second Affiliated Hospital of the Zhejiang University, China. The patients who underwent CT examinations for surgical planning between January 2019 and June 2020 were prospectively recruited from a single institution, namely the Second Affiliated Hospital of Zhejiang University, China. All LNs included in the dataset were confirmed by fine-needle aspiration (FNA) and/or surgical pathology. A total of 574 axial CT images (including 676 lymph nodes: 103 benign and 573 malignant lymph nodes) were retrieved from 196 patients who underwent CT for the assessment as “suspicious” malignancy in the earlier examinations. Typical LNM CT images are shown in Figure 1. Compared with the whole CT image, the features in ROI area are more conducive to the judgment in the deep learning classification network. For each image, experienced radiologists draw the ground-truth region of interest (ROI) for LN detection, such as the red box in Figure 1. The dataset analysis shows that LNs (both benign and malignant) do not have a wide variety of sizes and shapes. The size is defined as the ratio of the LN area of the entire CT image; the width-to-height aspect ratio describes the shape. Figure 2A depicts the size and shape distributions of the LNs included in the adopted dataset. One can observe that most LNs are very small (size<0.5%) and fall into the aspect ratio domain of (0.5~2). The joint distribution map of the size and shape of LNs in the dataset is shown in Figure 2B, reflecting that benign and malignant LNs have a great overlap in size and shape. Therefore, it is difficult for radiologists to judge the benign and malignant LNs based on the size and shape information, so the image texture information of LNs in ROI is also required to simplify this task.
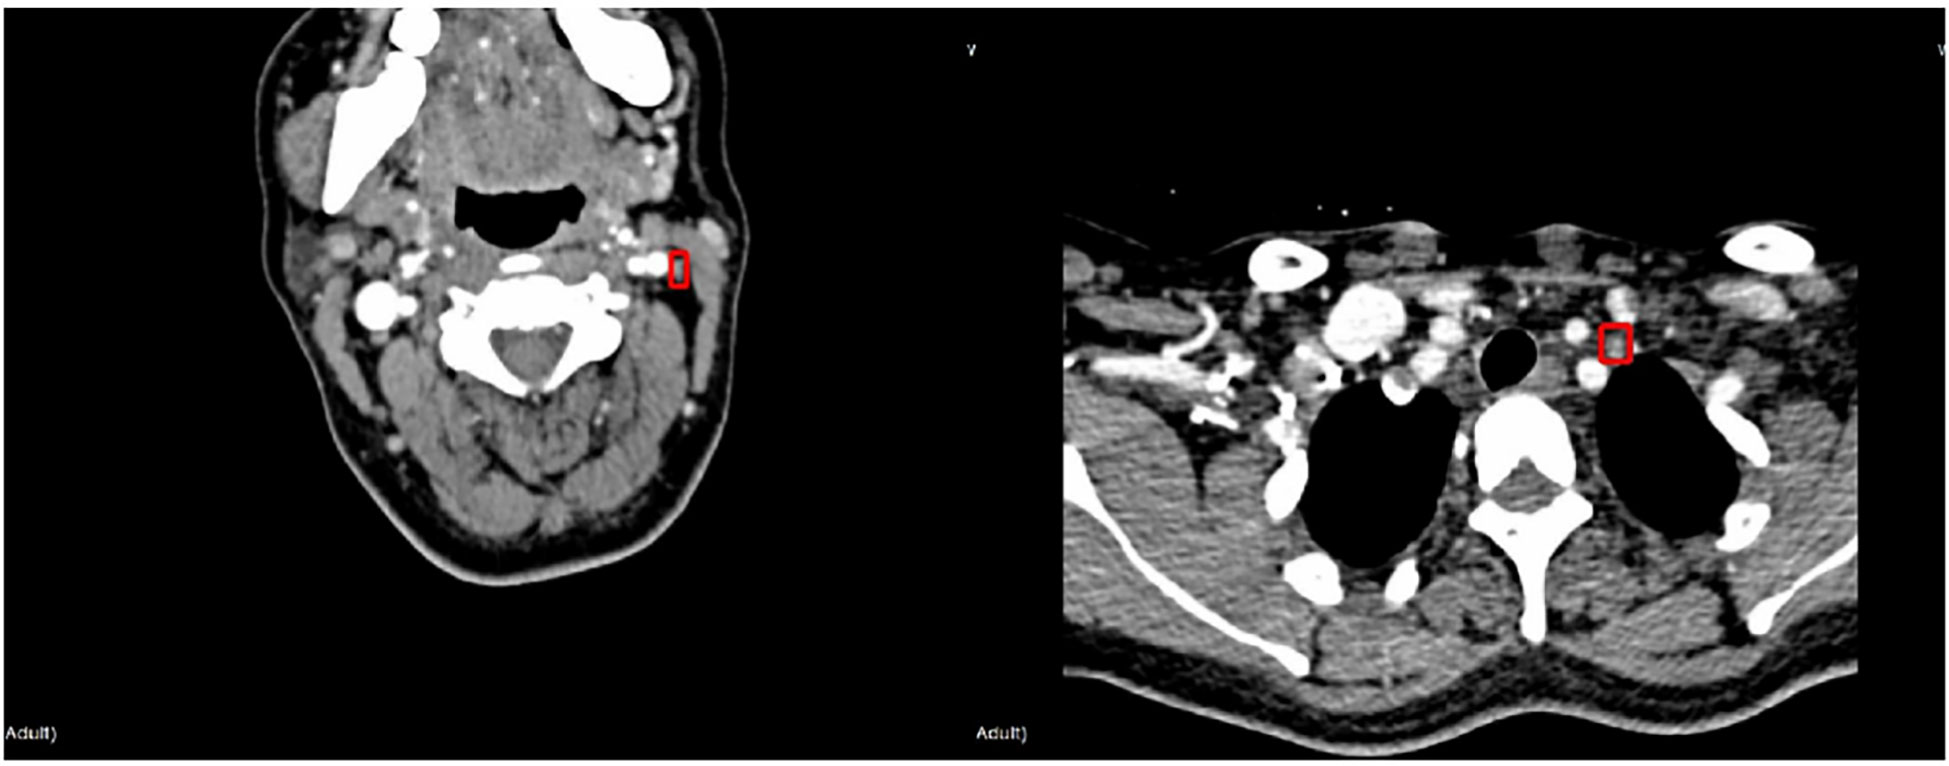
Figure 1 Illustration of typical LNMs: Benign case (left), malignant case (right).
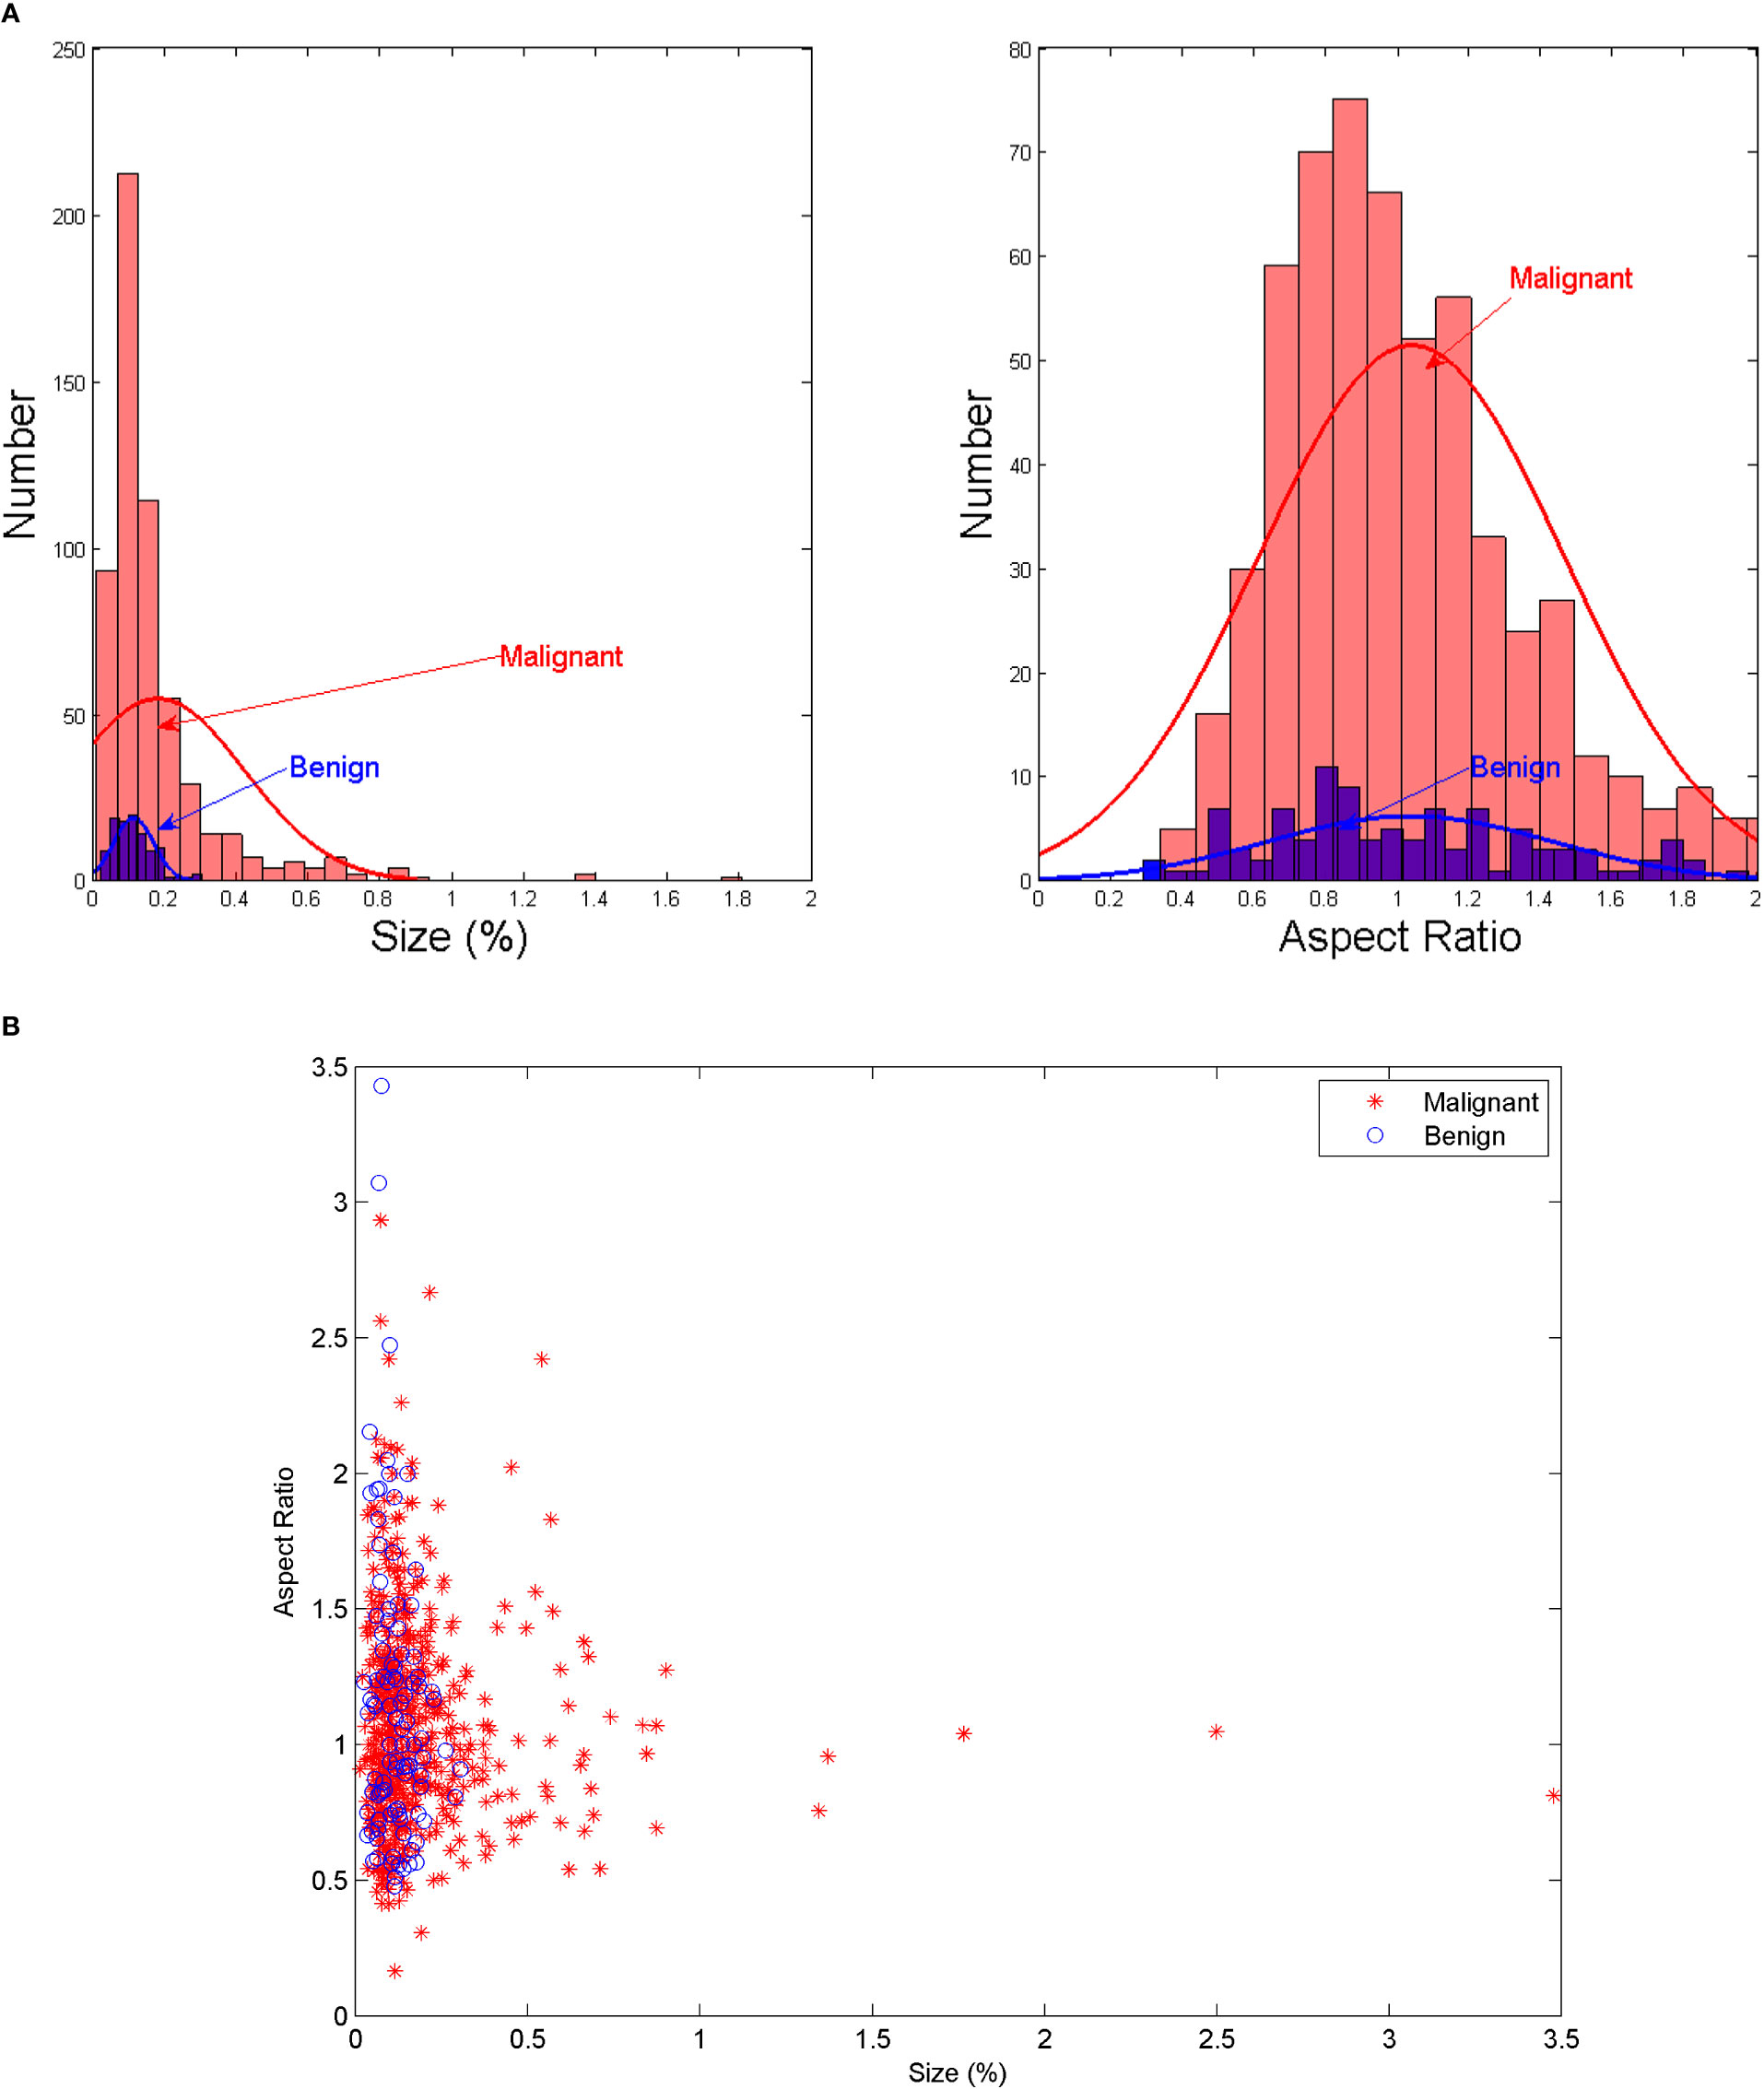
Figure 2 (A) The size and shape histograms of LNs (B) Joint distribution map of the size and shape of LNs.
All CT images were obtained using 64 to 128 channel multi-detector CT scanners (SOMATOM Definition Flash, Siemens Healthineers; Brilliance, Philips Healthcare). Contrast-enhanced CT scanning was performed 40s after the intravenous injection of a 90-mL bolus of iodinated nonionic contrast material (300–350 mgI/mL) into the right arm, with a subsequent injection of a 20–30-mL saline flush at 3 mL/s using an automated injector. CT images were obtained with0.5–0.75 mm collimation and reconstructed into axial images every 2.0 mm on a 512×512 matrix using iterative reconstruction algorithms associated with each vendor’s CT scanner.
For detection, the 676 lymph nodes were randomly divided into 70% of the training set (73 benign and 401 malignant lymph nodes) and 30% of the testing set (30 benign and 172 malignant lymph nodes). Each CT image in the training and testing sets was expanded to 20 images by rotation, mirror image, changing brightness, and Gaussian noise. The extended data set included 11,480 CT images. For classification, ROI of lymph node metastasis labeled by radiologists were used to train the classification network. The training and testing sets for classification were set as same as the detection.
3 Methods
3.1 The combined detection and classification approach
The proposed method combined two deep convolutional networks to detect and diagnose LNs accurately. Figure 3 shows the pipeline of the proposed method, where an improved Faster R-CNN was first designed to automatically locate LNs in CT images. Then, a residual network with an attention module was built to extract fine features for the LN classification.
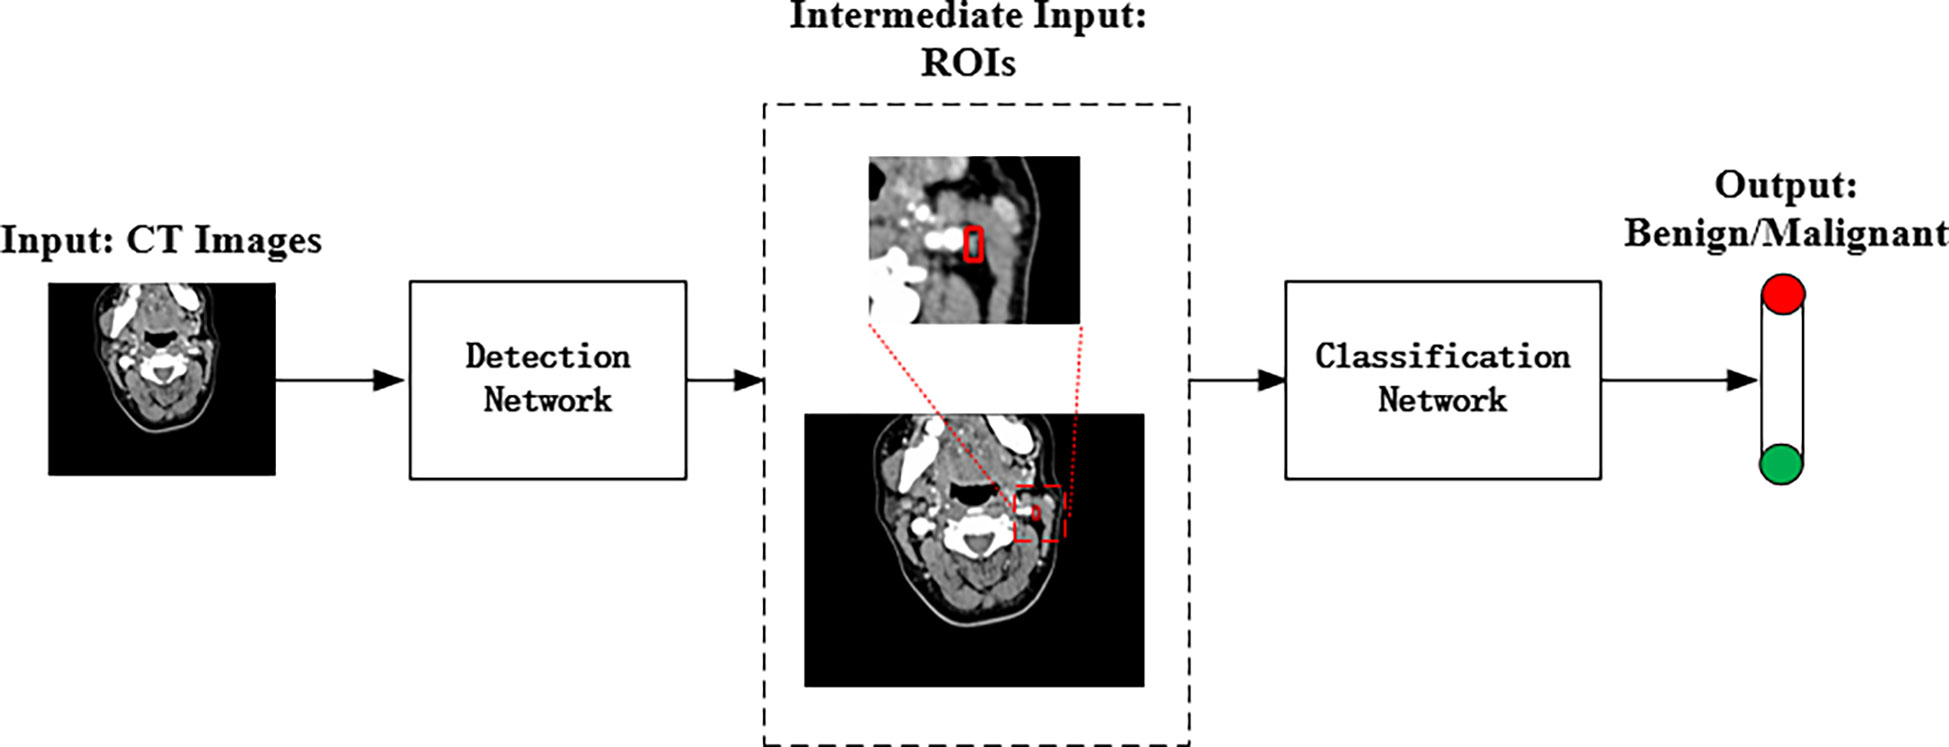
Figure 3 The pipeline of the proposed deep learning method for automated LN detection and classification.
3.1.1 Detection network
According to Figure 2, the LN detection belongs to the category of small object detection. The Faster R-CNN has shown exciting performance in various object detection tasks (27–29). It comprises three modules: feature extraction layer, region proposal network (RPN), and classification layer. The Faster R-CNN is used to detect LNs, and the detection flowchart is shown in Figure 4. For a better adaptation of the system to the small-target detection task, the Faster R-CNN network was improved as follows: ResNet50+FPN (Feature Pyramid Network) was used to replace Visual Geometry Group (VGG) network as the extracted feature network; the region of interest (ROI) pooling (26) was replaced by the ROI align (30); the appropriate anchors were designed.

Figure 4 The pipeline of the improved Faster R-CNN.
A) Backbone network. Although ResNet50 (31) alleviates the problems of difficult network training and reduced performance caused by the deepening of the network, making its high-level features rich in semantic information, their low resolution is not conducive to detecting small-target objects. To solve this problem, the FPN proposed by Lin et al. (32) was adopted to fuse the feature from low to high levels and improve the detection precision of the model. The architecture of the backbone network (ResNet50+ FPN) in Faster R-CNN is shown in Figure 5. A 1×1 convolutional layer was attached to C2, C3, C4, and C5 (the feature activation of conv2, conv3, conv4, and conv5 outputs of ResNet50), and then the spatial resolution was upsampled by a factor of 2 using the nearest neighbor upsampling. The upsampled map was then merged with the corresponding bottom-up map by the element-wise addition. Finally, a 3×3 convolution was appended on each merged map to generate the final feature map. Multi-scale feature maps (P2, P3, P4, and P5) need to be input into the RPN network to generate candidate boxes and serve as the input part of classification and regression operation in the second stage. The feature map (P6) generated from the feature map of the topmost layer of ResNet50 after the maximum pooling was only used as the input part of RPN. The function of RPN is to combine the prior anchors to classify the background and foreground areas. After classification, a large number of prior anchors are screened out, making the anchors closer to the real target. In the RPN, the public Feature Map of Faster RCNN is processed by sliding window, which can also be regarded as a 3x3 convolution operation on the feature map, and then two full connection operations are performed on each feature vector, one gets 2 scores, and one gets 4 coordinates, and then combined with the predefined anchors, the candidate anchors is obtained after processing.
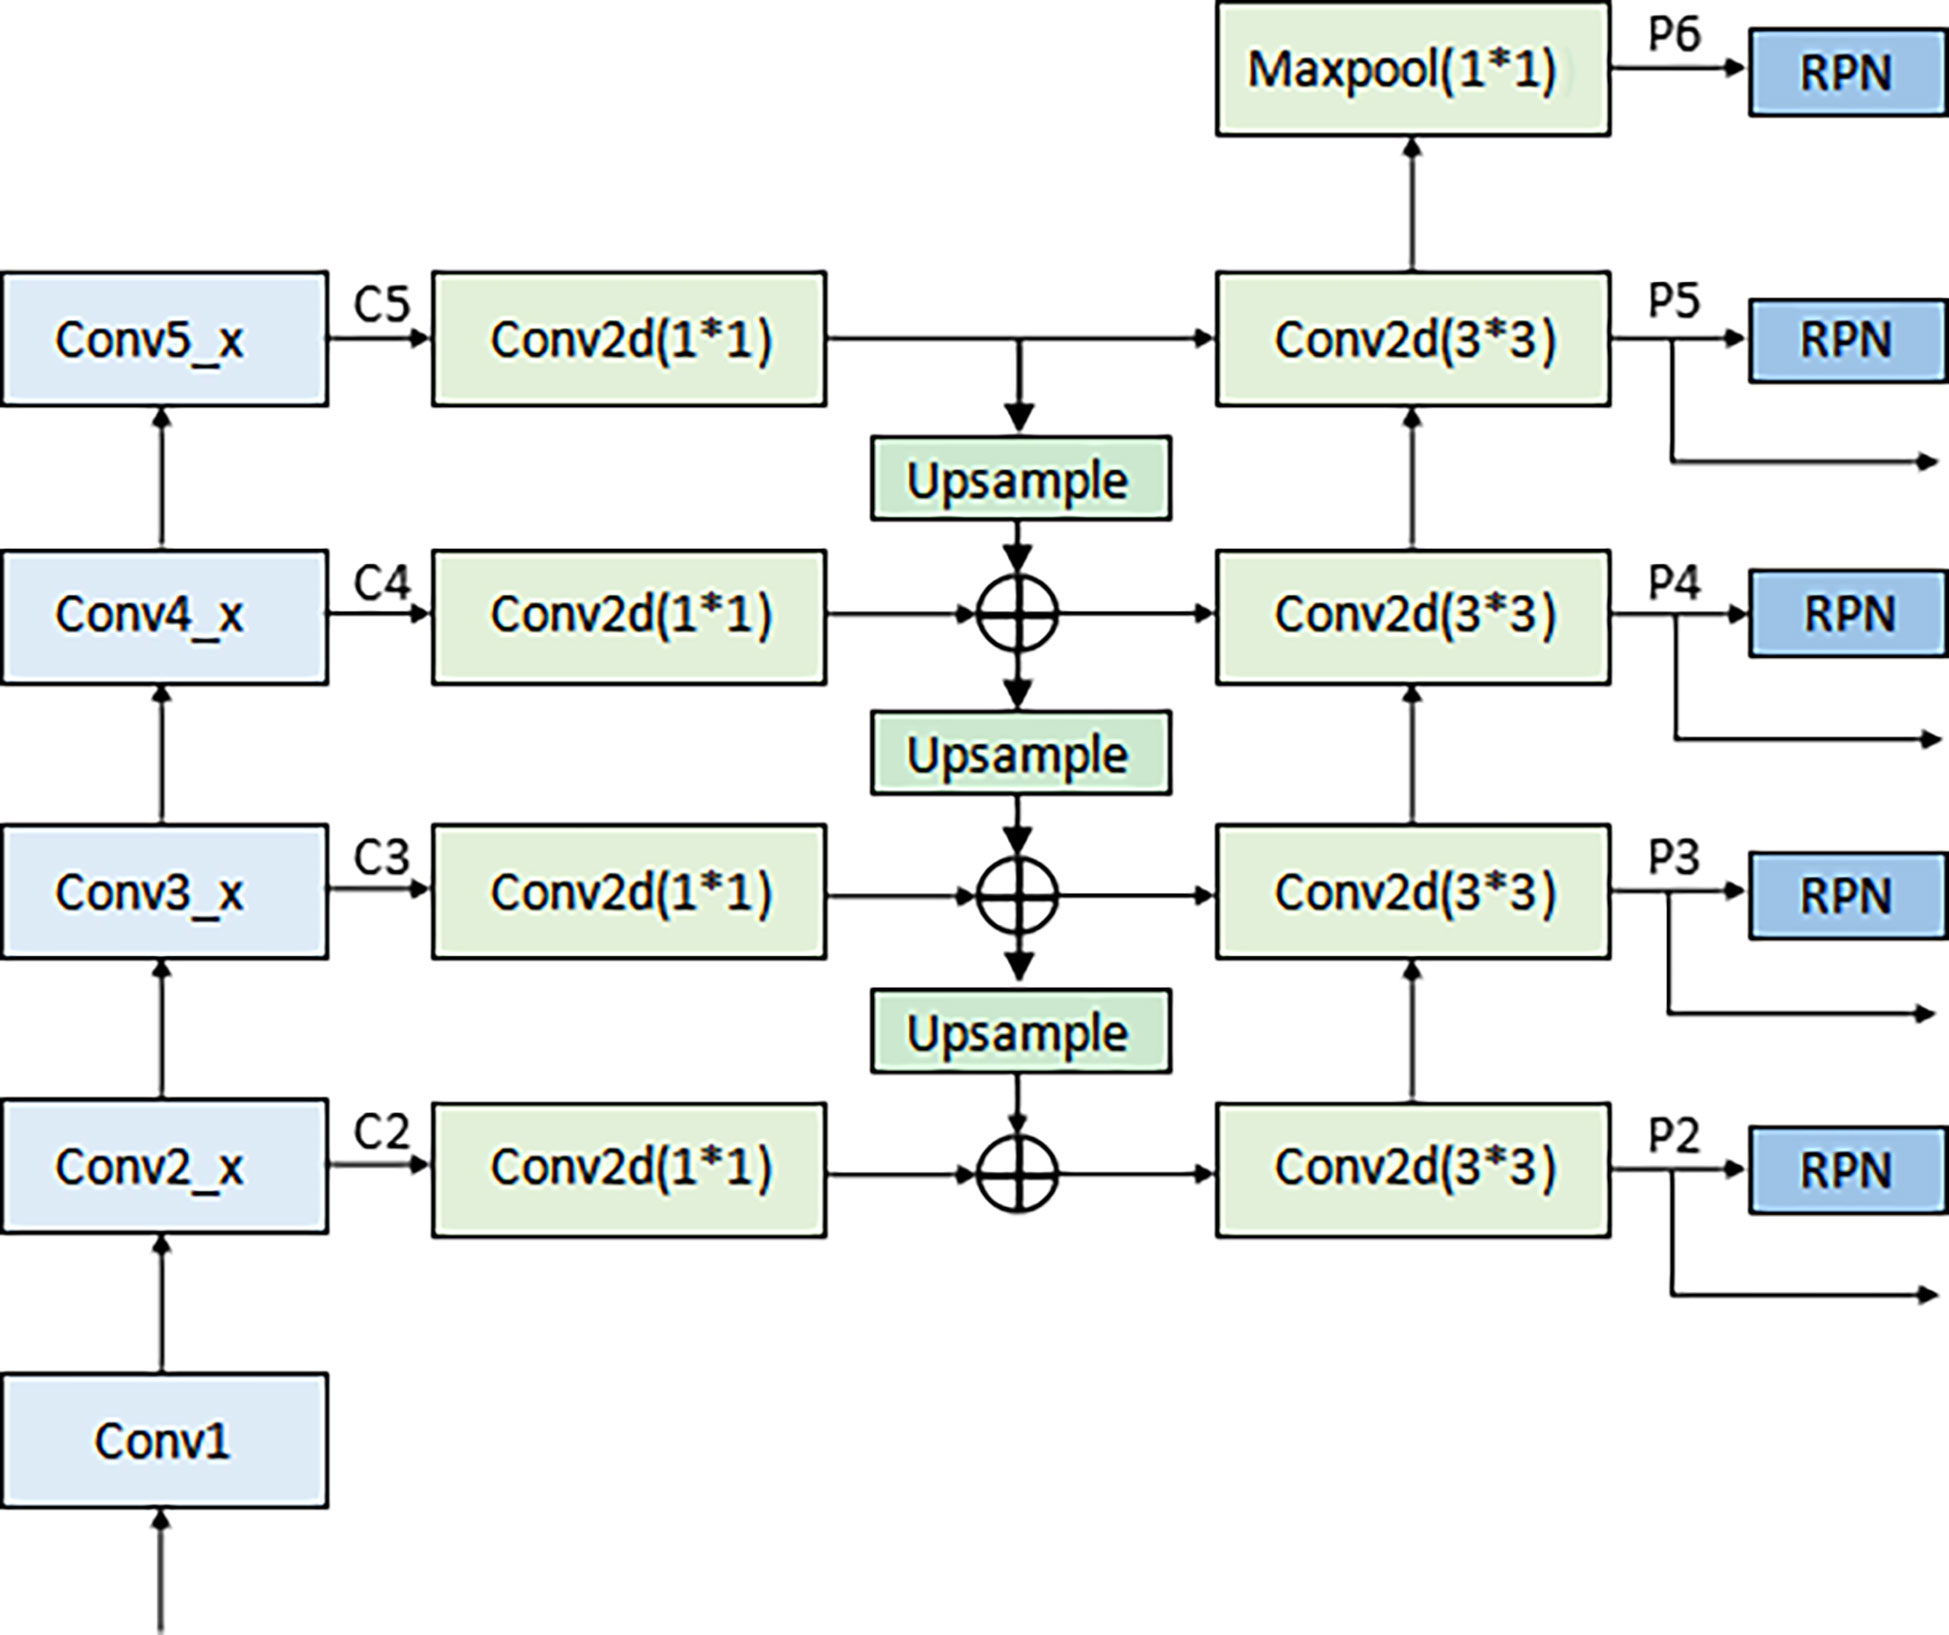
Figure 5 The architecture of backbone network in Faster R-CNN (ResNet50+ FPN).
B) Input of the RPN. The full name of RPN is Region Proposal Network, which is called region generation network. It is a classless object detector that calculates regional targets through sliding windows. The input is an image of any scale, and the output is a series of rectangular candidate regions.
C) ROI Align. ROI pooling was used in the original Faster R-CNN network to convert ROI features of different sizes into the same feature map. In this process, the calculation results of coordinates were rounded twice: (i) when the region proposal when mapped to the shared feature map and (ii) when the feature map was fixed to a unified size. These round operations introduced misalignments between the ROI and the extracted features, which harmed the predictive accuracy of the small-target location. To solve this problem, ROI Align was used instead of ROI Pooling. RoI Pooling can intercept the feature of each Region of Interest in the feature map, and replace it with the feature output of the same size. Each quantization operation corresponds to a slight misalignment of regional features, and these quantization operations introduce bias between RoI and extracted features. The core idea of RoI Align is bilinear interpolation. The bilinear interpolation algorithm makes full use of the four real pixel values around the virtual point in the source image to jointly determine a pixel value in the target image. For a destination pixel, set the floating point coordinates obtained by inverse transformation. The coordinates are (i+u,j+v) (where i and j are the integer parts of floating-point coordinates, and u and v are the fractional parts of floating-point coordinates, which are floating-point numbers in the range [0,1)], Then the value of this pixel f(i+u,j+v) can be obtained from the coordinates in the original image as (i,j), (i+1,j), (i,j+1), (i+1,j+ 1) The value of the corresponding four surrounding pixels is determined. If the fixed feature graph had a small size, bilinear interpolation 33 and floating-point number were used to record the coordinate results, which improved the accuracy of locating small targets.
D) Anchor design. Anchor is the core of RPN network, and the generation of anchor without convolution operation, which is equivalent to sliding window calculation. After the image is input, Windows of different sizes are obtained by calculating the proportion of the sliding window center to the target size, length, width and multiple, which is called the basic standard window, through several stride, the map is reduced by many times. When the image is convolved at the last layer, the pixel will be reduced to the corresponding multiple, and tens of thousands can be obtained through the sliding window mapping to the input image based on the basic standard window of the output image. The preliminary selection of anchors in the original Faster R-CNN network was manually performed. The aspect ratio distribution in terms of the LN size on the dataset was pre-computed with the results shown in Figure 2. As seen in Figure 2, the LN aspect ratio roughly ranged from 0.5 to 2, and the LN size mainly ranged from 0 to 0.2%. This implies that the aspect ratio and size of anchors and proposed regions should also be selected within these ranges. Therefore, the anchors were assigned the areas of 256, 576, 1282, 1600, 3136 pixels (corresponding to the LN size of 0.01, 0.03, 0.06, 0.08, and 0.15%) on feature maps P2, P3, P4, P5, and P6 respectively. Besides, anchors of multiple aspect ratios (1:2, 1:1, 2:1) were used at each level. This amounted to the total number of fifteen 15 anchors in the FPN.
The loss function of Faster R-CNN can be roughly divided into two parts: multi-task loss of RPN and multi-task loss of Fast R-CNN. When training RPN network, the loss function of a picture is defined as:
where Lcls is the classification loss, Lreg is the bounding box regression loss. pi is the probability that the ith anchor is the target object; pi* is the real label. ti is the boundary box regression parameter for predicting the ith anchor. ti* is the regression parameter of the real box corresponding to the ith anchor. Ncls is the number of all samples in a small batch; Nreg is the number of anchor positions; The default value of λ is 10. The loss function of Fast R-CNN is defined as:
where Lcls is the classification loss, Lloc is the bounding box regression loss. p is the Softmax probability distribution predicted by classifier. u is the corresponding target real category tag; [u≥1] indicates that the value is 1 when u≥1, and 0 in other cases. tu is the regression parameter of the corresponding category u predicted by the boundary box regression; v is the bounding box regression parameter of the real target.
3.1.2 Classification network
After detecting the location of LNMs by the improved Faster R-CNN network, we feed the detected ROIs into our attention-based classification network for LNM fine-grained classification.
ResNet50 was selected as the backbone network for the proposed model due to its excellent performance in diagnosing cervical LNM reported in the earlier study (7). The initial ResNet50 introduced by He et al. (31) consisted of one convolutional layer (Conv1) and four residual modules (Conv2_x to Conv5_x). A max-pooling layer followed each of them to downsample the feature maps by a scale factor of 2. Conv2_x to Conv5_x had 3, 4, 6, and 3 bottleneck blocks, respectively.
According to Figure 2B, the differentiation of benign and malignant LNs is not obvious. For better fine-grained classification, a coordinate attention (CA) module (33) was incorporated in the proposed model, as shown in Figure 6A. This module made it possible to focus on important texture features and suppress unnecessary ones. The CA encoded both channel relationships and long-range dependencies with precise positional information in two steps: (i) coordinate information embedding and (ii) CA generation. Moreover, wide residual blocks were developed by setting twice the number of channels of the initial ResNet50 in each bottleneck block to improve the classification performance, referring to the previous study (34). The refined model was intuitively named A-ResNet50-W (A standing for attention module and W for wide residual block). The proposed model structure is shown in Figure 6B.The convolution layer and output image size of Resnet50 at each stage are shown in Table 1.
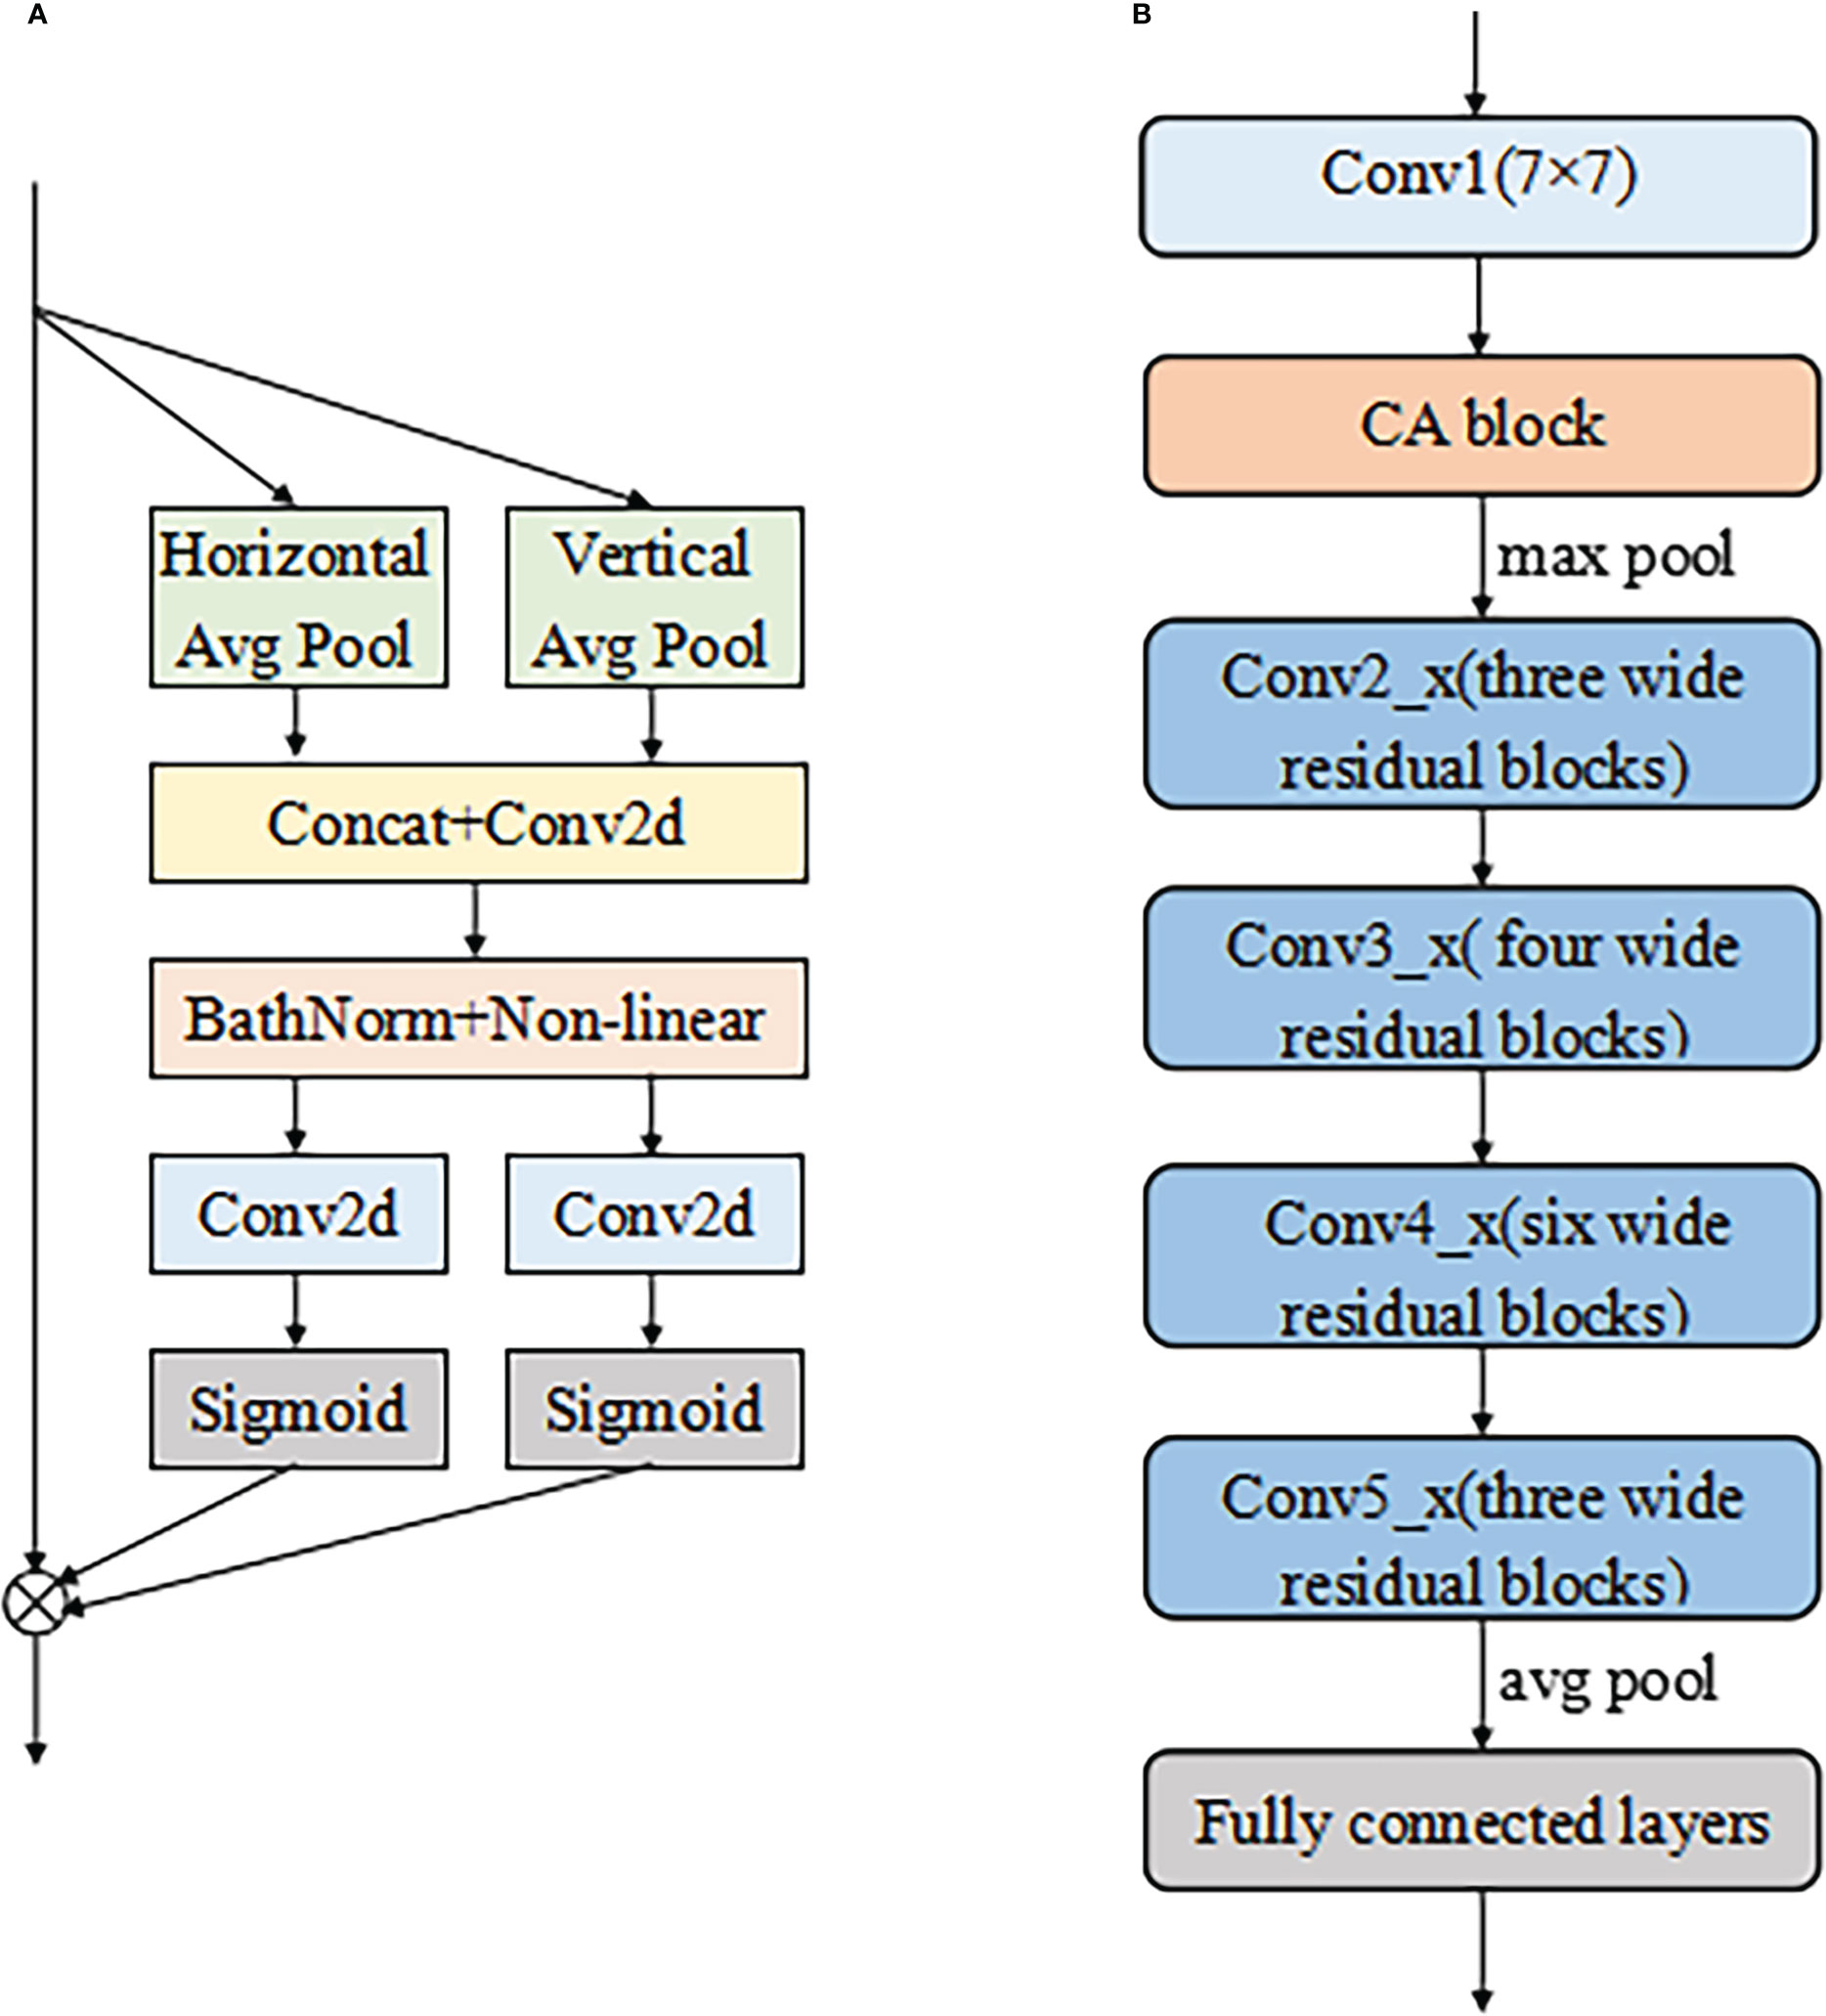
Figure 6 The structure of CA module (A) and the proposed A-ResNet50-W model (B). Here the symbol ⊗ represents multiplicatio.
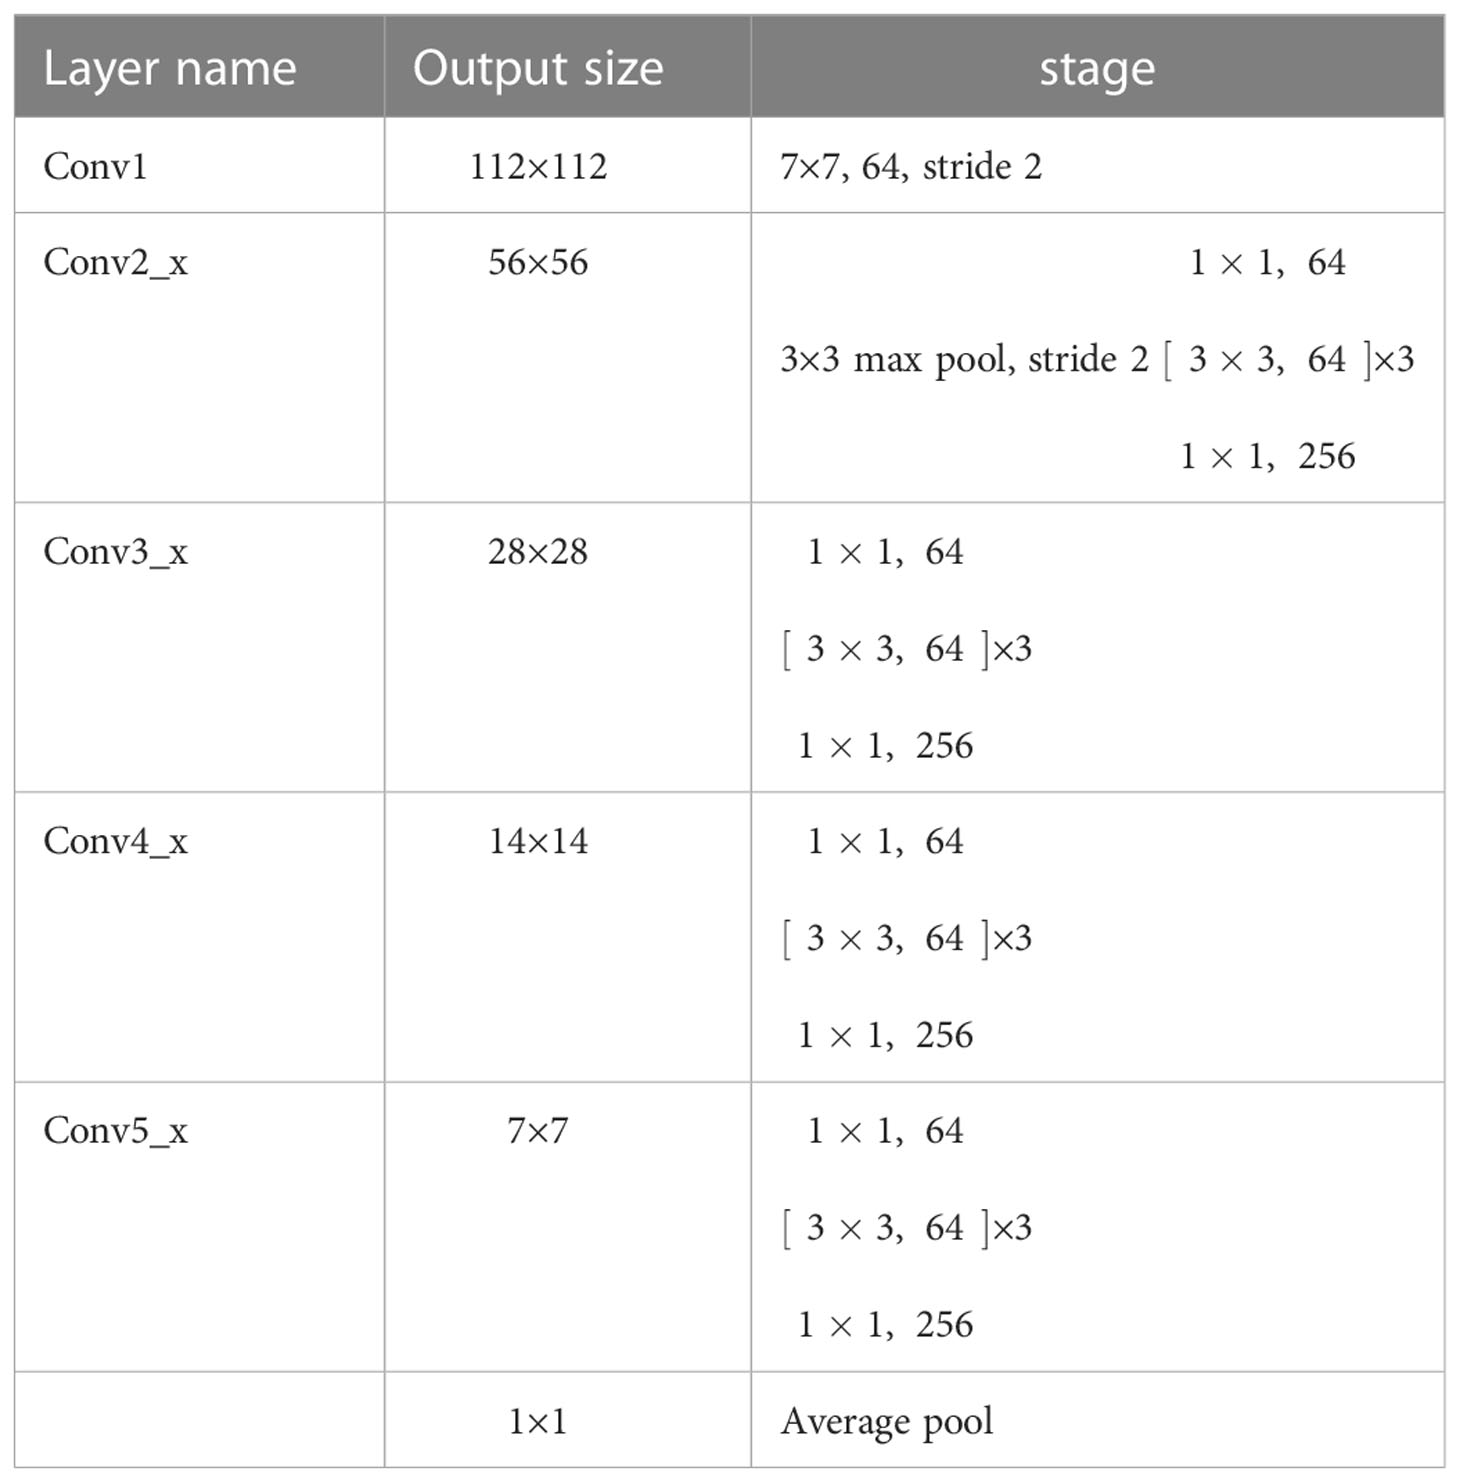
Table 1 Convolution layer and output image size of Resnet50 at each stage.
3.2 Performance and statistics
Firstly, the automated detection performance of the proposed detection network was assessed and compared with that of three state-of-the-art detection methods. Next, the LN recognition performance of the proposed classification network was evaluated and subjected to a comparative analysis against several state-of-the-art classification methods. Finally, the developed networks trained on the proposed dataset were used to classify testing images. Their classification results were compared with the diagnoses of three senior radiologists with six to ten years of clinical experience on LNM diagnosis. The radiologists were unaware of the final diagnosis and the deep learning analysis results. Their “blind reviews” were based on the same image viewer, with freely scrollable images and adjustable window level/width. Finally, the radiologists identified these CT images as benign or malignant LNMs.
3.2.1 Detection results
Ablation experiments of Faster R-CNN were conducted with four structures: (i) ResNet50, (ii) ResNet50 + FPN, (iii) ResNet50 + FPN + ROI Align, and (iv) ResNet50 + FPN + ROI Align + Anchor Design. The latter structure was proposed in this study. The detection performances are summarized in Table 2. The average precision (denoted as AP50) was used to quantitatively evaluate the detection performance, with the Intersection over Union (IoU) threshold of 0.5. As shown in Table 1, the proposed structure for the Faster R-CNN achieved the best AP50 and was considered suitable for detecting small LNs.
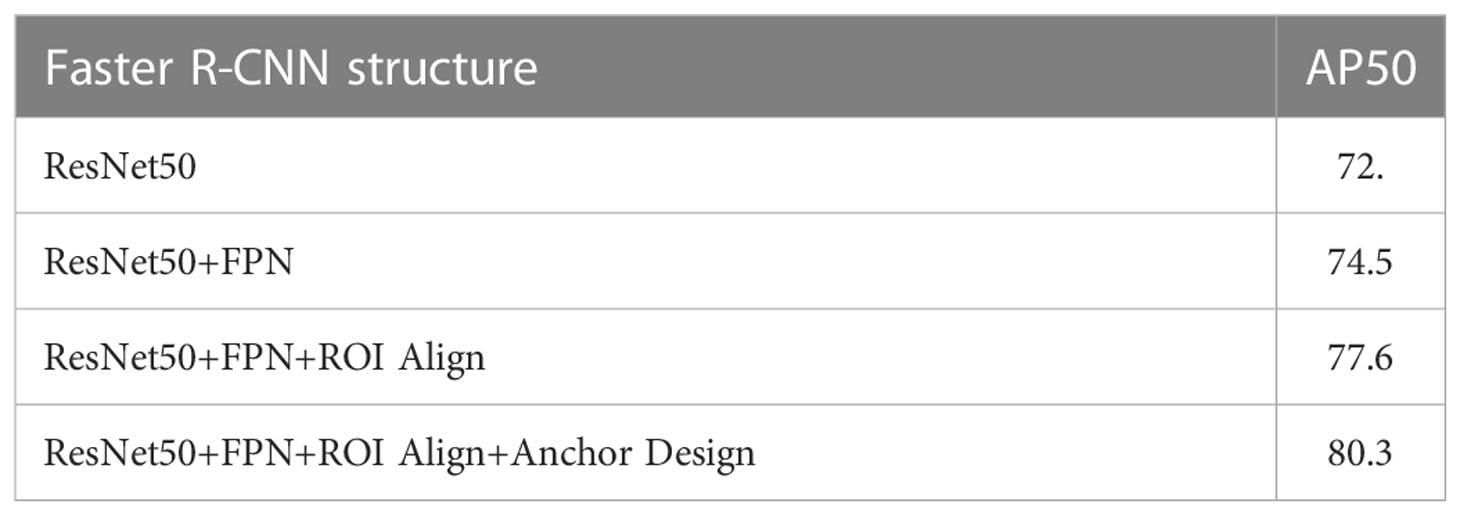
Table 2 Detection performance of different structures.
Some convolutional neural networks have been successfully applied to detection tasks, exhibiting a good performance. In this study, the proposed method was compared with three state-of-the-art neural networks, namely Faster R-CNN(ResNet50) (26), SSD (35), and Yolov3 (36). The detection samples of the proposed method are shown in Figure 7. The AP50 values of detection by the four methods are listed in Table 3, which indicates that the proposed detection method outperformed all others in AP50 over the other three methods by 2-4%.
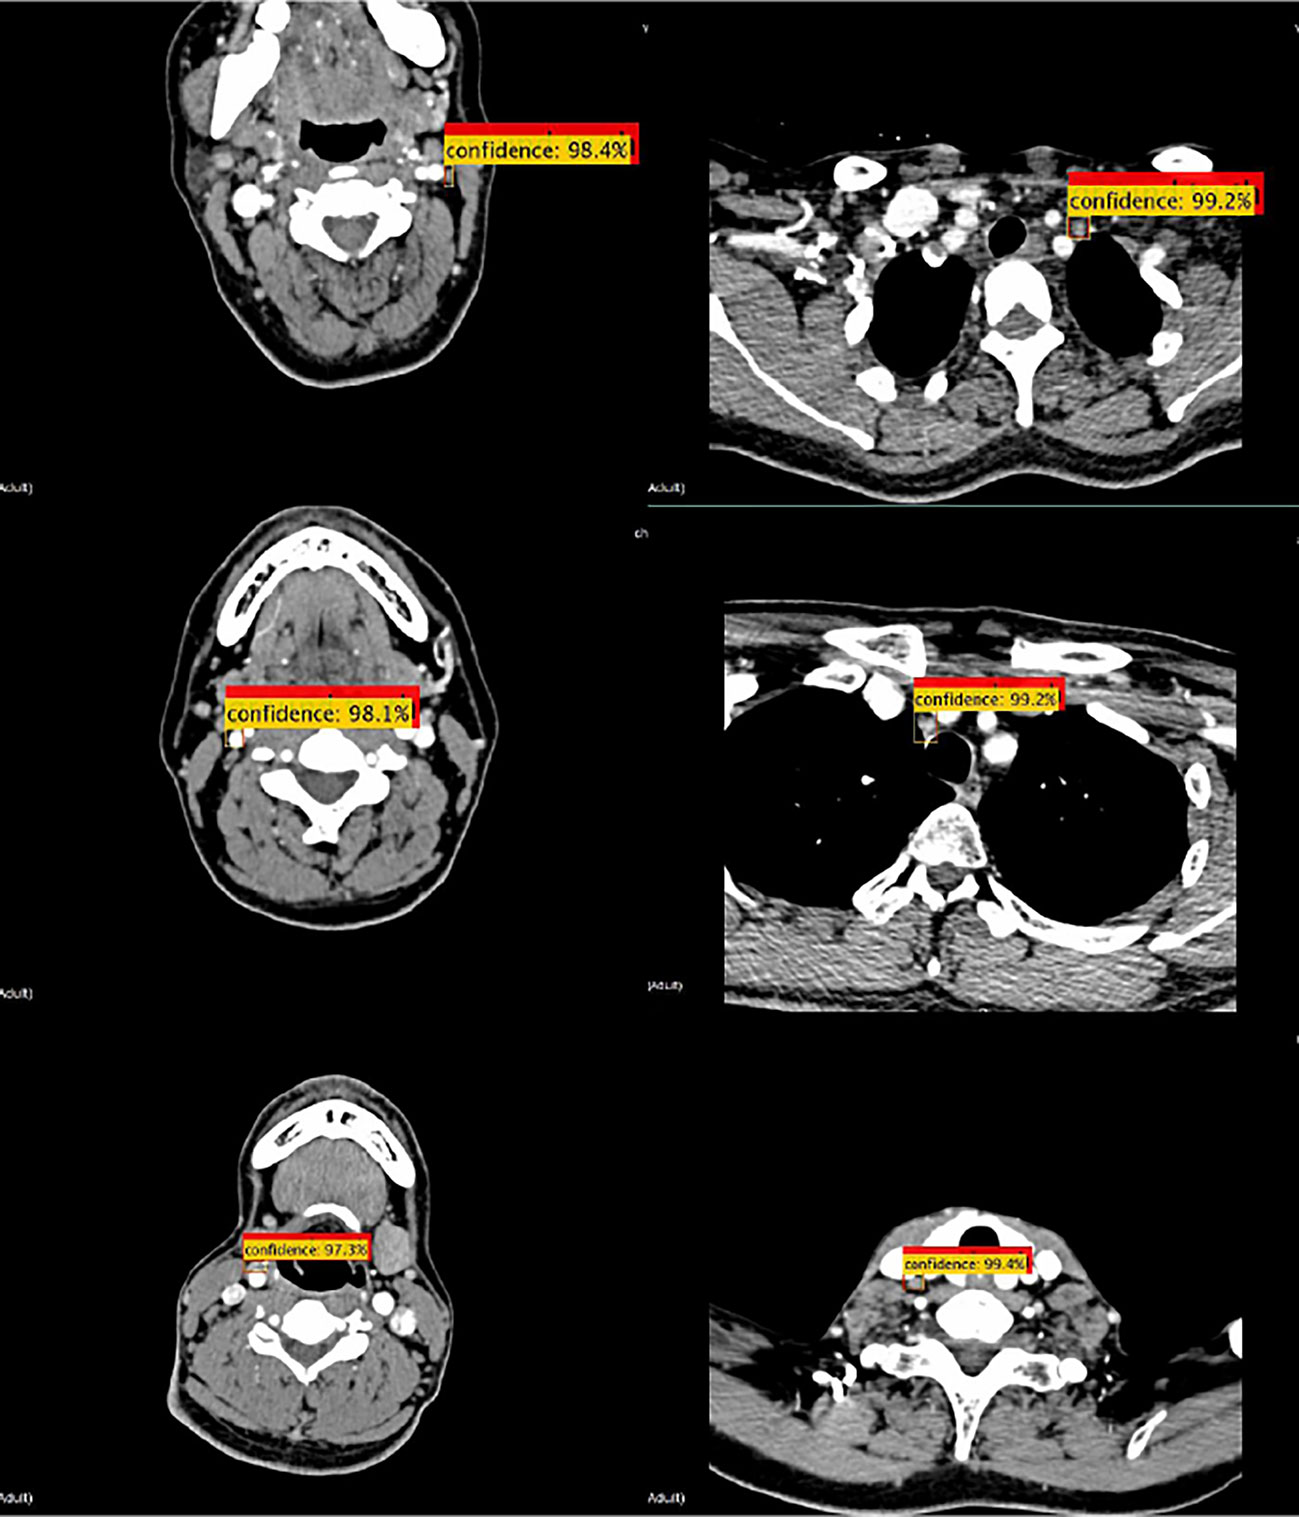
Figure 7 Detection samples of the proposed method. Red boxes illustrate the ground truth ROIs, while yellow boxes illustrate the successfully detected LNs and their confidence.
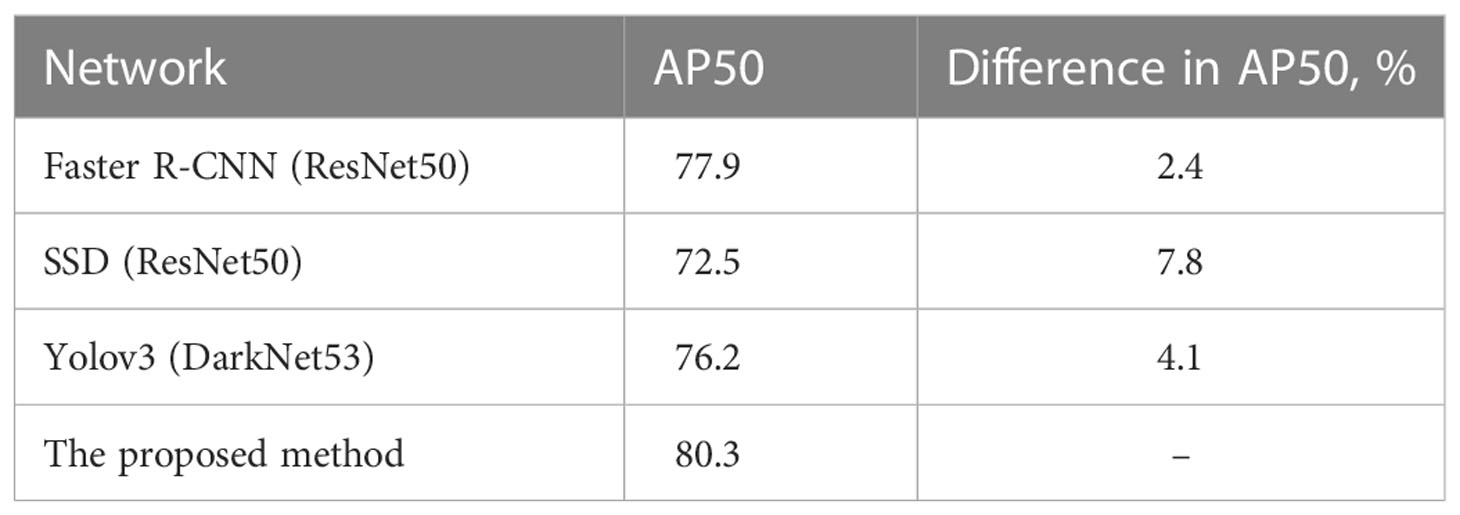
Table 3 Detection performance in different networks for the testing set.
3.2.2 Classification results
The ablation experiments were performed on the same dataset with four structures: (i) a reference ResNet50 structure, (ii) the proposed structure A-ResNet50-W with the CA block (A) and the wide residual block (W), (iii) the proposed structure without the CA block (ResNet50-W), and (iv) the proposed structure without the wide residual block (A-ResNet50). The classification performances are summarized in Table 3. Quite naturally, the proposed structure (i.e., A-ResNet50-W) outperformed its “light versions” and the original ResNet50 network by ACC and TPR parameters. Insofar as both A-ResNet50 and ResNet50-W also surpassed the ResNet50 in ACC and TPR values, the CA and wide residual blocks were instrumental in the classification task execution. Meanwhile, TNR values of the proposed and ResNet50 networks were the same (80.0%).
The results obtained by the proposed method were compared with those predicted by other eight start-of-the-art neural networks, namely MobileNet_V2 (37), ShuffleNet_V2 (38), DenseNet121 (39), EfficientNet (40), ResNet34 (31), ResNet50 (31), ResNext50 (41) and RegNet (42). As shown in Fig 8, the MobileNet_V2, ShuffleNet_V2, DenseNet121, EfficientNet, ResNet34, ResNet50, ResNext50, RegNet, and the proposed method provided the following results: ACC of 93.1, 93.1, 93.1, 94.1, 92.6, 95, 94.5, 94.5 and 96%; TPR of 98.3, 97.7, 95.9, 99.4, 97.1, 97.7, 97.7, 99.4, and 98.8%; TNR of 63.3, 66.7, 76.7, 63.3, 66.7, 80.0, 76.7, 66.7, and 80%, respectively. Thus, the proposed classification network outperformed all eight state-of-the-art ones in ACC, seven in TNR, and six in TPR. Among the alternative networks, ResNet50 had the highest TNR value of 80.0%, which was equal to that of the proposed network, while its ACC and TPR values (95.0 and 97.7%) did not reach the proposed network’s ACC=96% and TPR=98.8%. Noteworthy is that EfficientNet and RegNet had higher TPR values (99.4%) than the proposed network (98.8%) but lower TNR values (63.3 and 66.7%) versus the proposed one (80%). Given their worse ACC parameters (93.1 and 94.5% versus 96%), the proposed method had the best integrated predictive performance among the other eight networks under study.
Besides the comparison with deep learning methods, the proposed method’s predictions were compared against those of three radiologists with six to ten years of clinical experience in LNM diagnosis. Table 4 shows the ACC, TPR, TNR, and AUC values provided in the testing set by the proposed method and three experienced radiologists. The corresponding ROC curves are plotted in Figure 8. It can be found that the area under the corresponding curves of A-ResNet50-W (in orange) is larger than that of the other three radiologists, which intuitively indicates that the classification method proposed in this paper has better diagnostic performance for LNMs on CT images than that of radiologists.
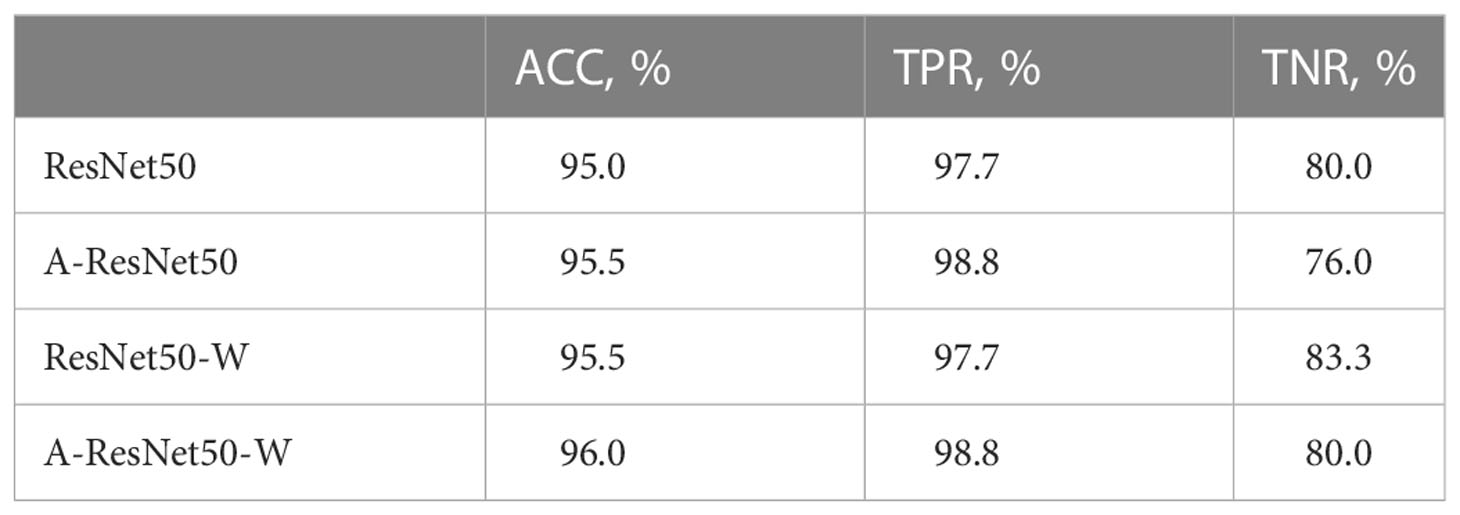
Table 4 Classification performance of different structures.
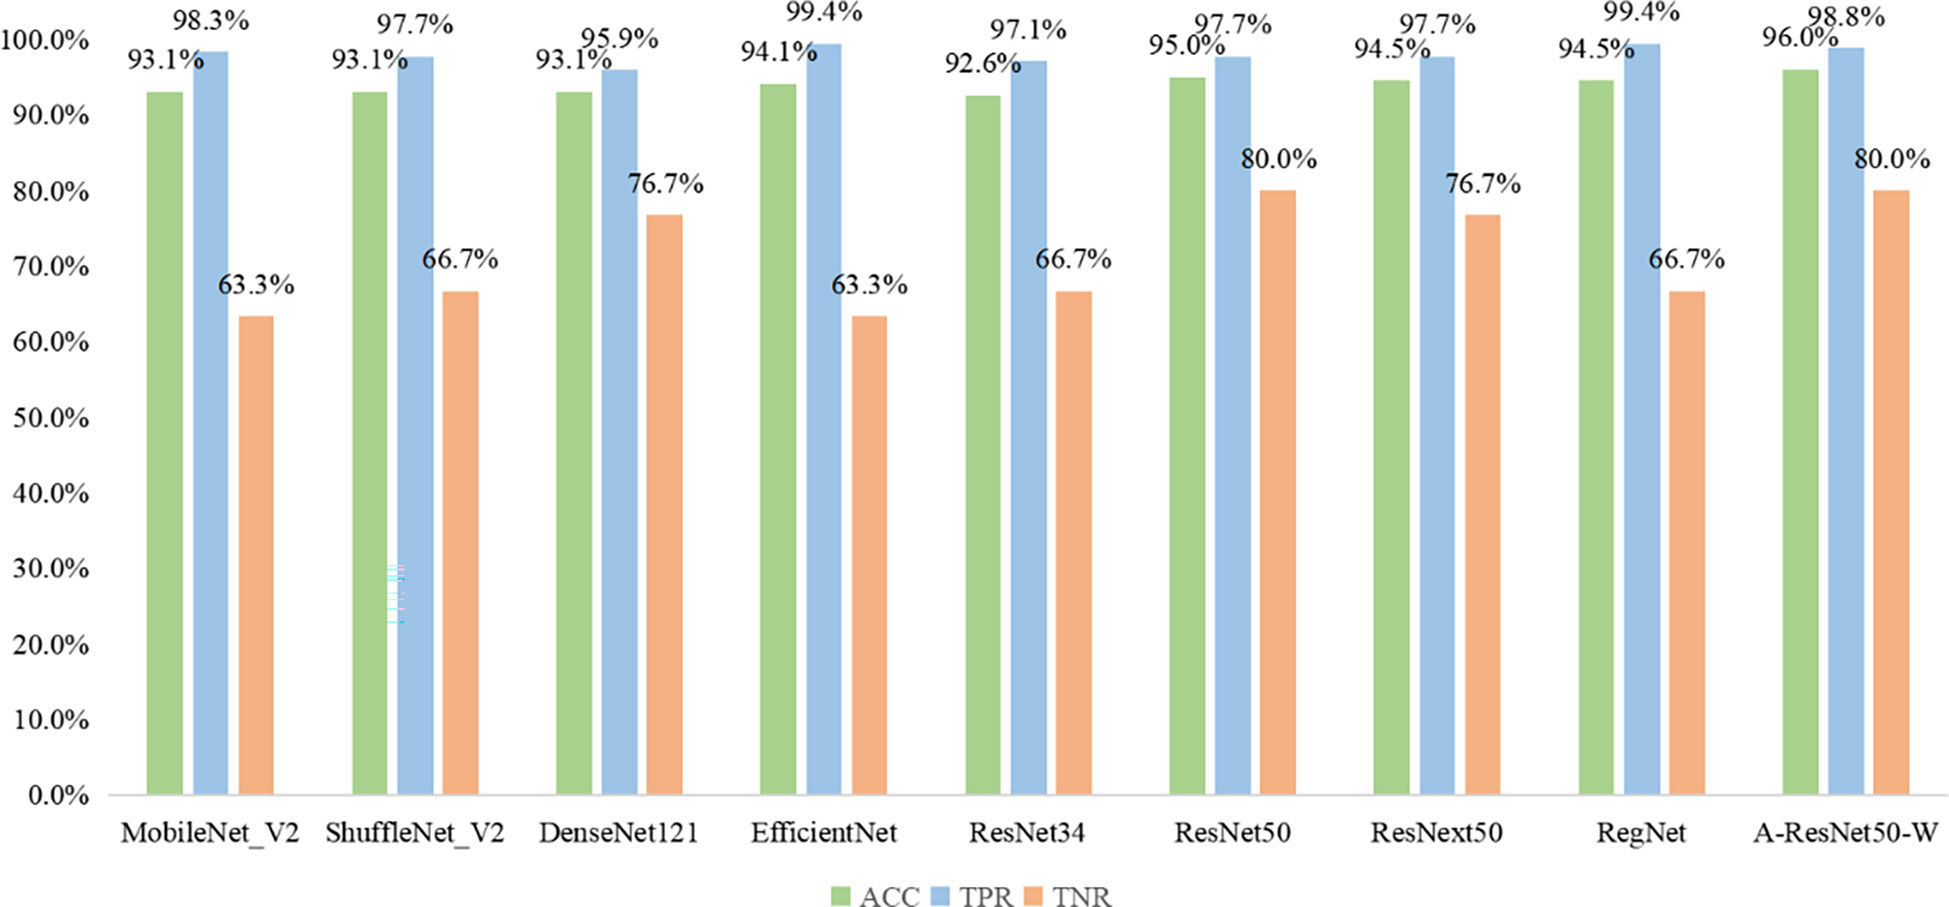
Figure 8 ROC curves of the proposed model vs. radiologists in the testing set.
As shown in Table 5, the proposed method achieved an AUC of 0.894, which significantly exceeded the estimates of the three radiologists. Specifically, the averaged AUC value of three radiologists was 0.731, with the lowest AUC estimate of 0.695 and the highest of 0.779. By TPR and TNR parameters, the diagnostic performance of the proposed method surpassed that of three experienced radiologists. The averaged TNR value of three radiologists was 68.9% (21/30) versus (80.0%, 24/30) of the proposed A-ResNet50-W network. The averaged TPR of three radiologists reached 78.1%, which is much lower than that of A-ResNet50-W (98.8%). Moreover, compared to the ACC of radiologists, that of A-ResNet50-W was improved by 19.3% (96.0% vs. 76.7%). The above findings indicate that proposed method had a significantly improved diagnostic performance of cervical LNM in CT images, as compared to that of three experienced radiologists.
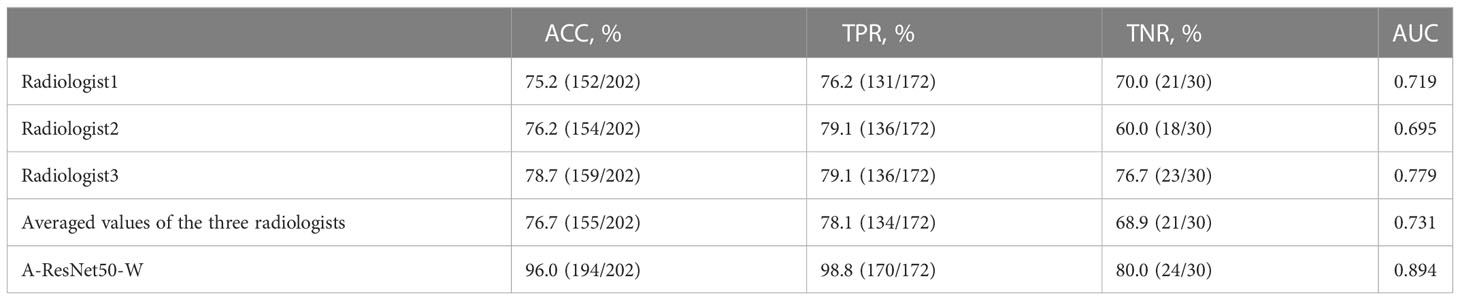
Table 5 Classification performance of the proposed method and three radiologists in the testing set.
3.3 Experimental setup
The detection network was trained with a stochastic gradient descent via an Nvidia Titan XP graphics card with graphic processing units (GPUs). The maximum learning iteration, learning rate, decay rate, and gamma were set at 500, 0.001, 0.0005, and 0.33, respectively. The detection performance was evaluated by average precision (denoted as AP50) with the threshold of the Intersection over Union (IoU) of 0.5.
The classification network was trained with stochastic gradient descent on an Nvidia Titan XP graphics card with graphic processing units (GPUs). The maximum learning iteration, learning rate, decay rate, and gamma were set at 1000, 0.001, 0.0005, and 0.1, respectively. The classification performance was evaluated by accuracy (ACC), true positive rate (TPR), true negative rate (TNR), the receiver operating characteristic (ROC) curve, and the area under the curve (AUC) parameters.
4 Discussion & conclusions
This study presents a deep learning-based model to diagnose cervical LNM with thyroid carcinoma using preoperative CT images. To the best of the authors’ knowledge, this was the first attempt to apply small object detection to find LNs in CT images. Compared with the other three state-of-the-art detection networks, the proposed network achieved the best AP50 parameter, as shown in Table 3. Besides, this study was the first to apply the attention mechanism to the classification of cervical LNM in CT images to allow the model to learn more important texture information. The comparative analysis of the proposed network’s accuracy with those of several state-of-the-art classification networks proved that the proposed model outperformed the available algorithms in the classification of cervical LNM in CT images, as shown in Figure 9. According to the model’s visualization results listed in Table 4, its ACC, TPR, TNR, and AUC parameters in diagnosing cervical LNMs exceeded the respective averaged values of three experienced radiologists. Therefore, the proposed method is considered instrumental in a clinical setting to diagnose cervical LNM with thyroid carcinoma using preoperative CT images.
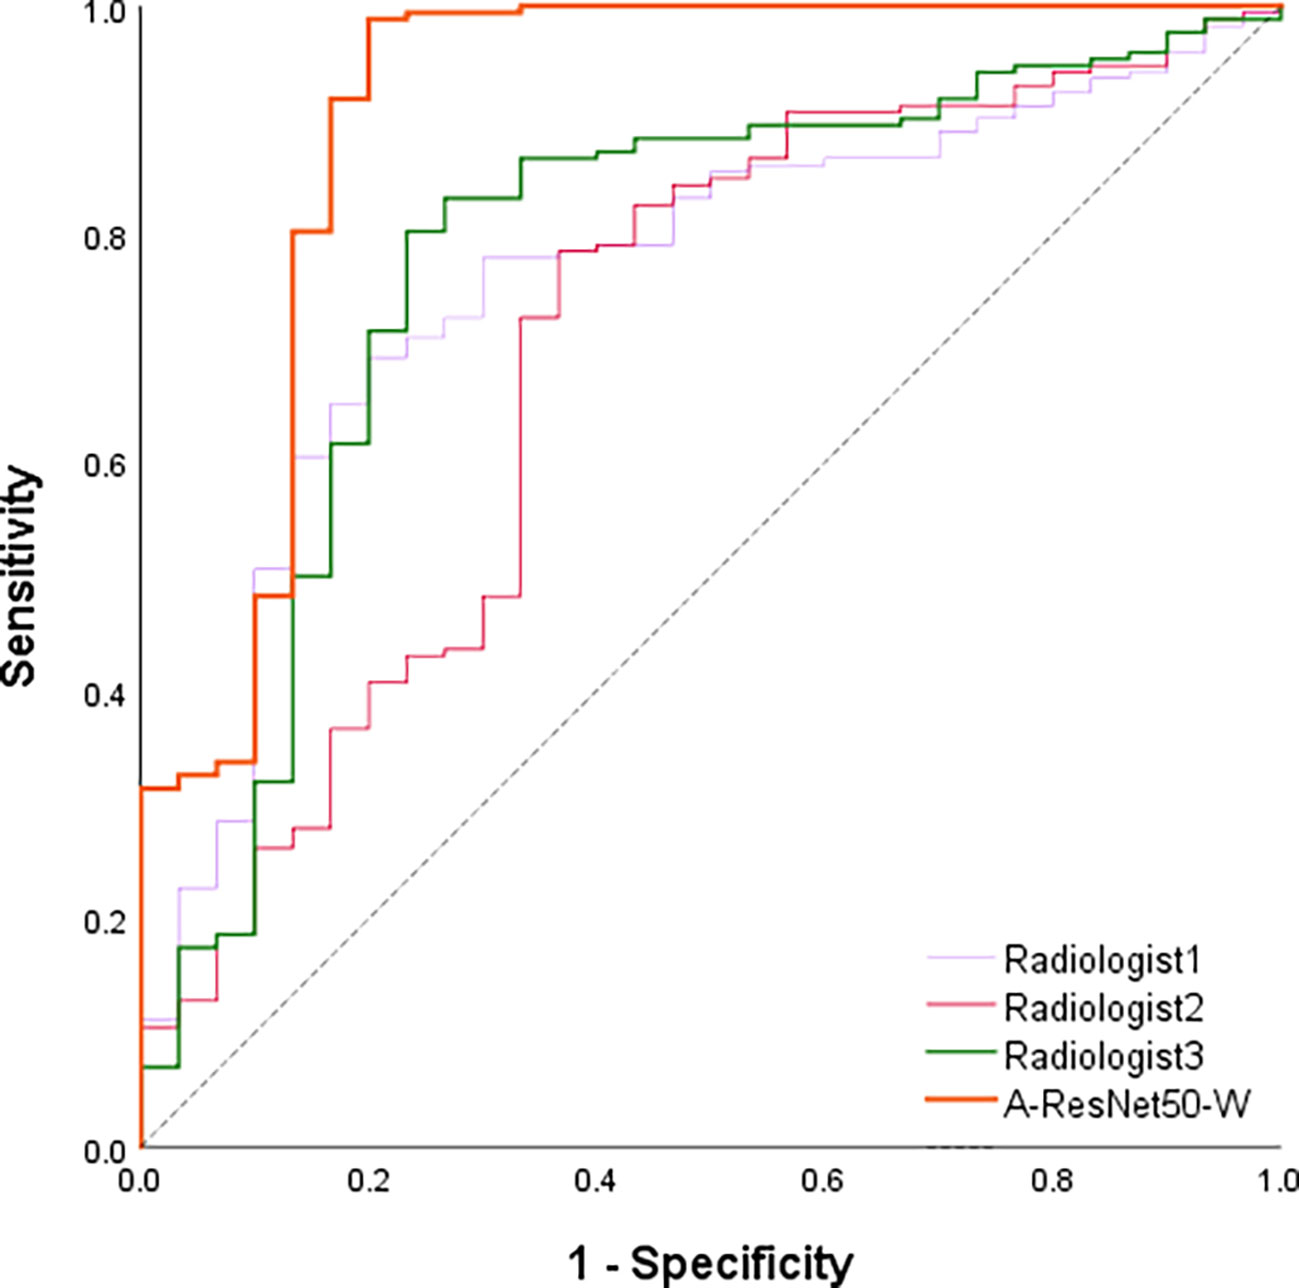
Figure 9 The classification performance of cervical LNM using CT images for different networks.
The proposed CAD method implementation can mitigate several clinical problems. Firstly, the CAD method can reduce the radiologist’s workload by reducing the inherent dependence of the diagnostic process on radiologists. Secondly, diagnostic results of different radiologists on the same CT images may be biased by the human factor, while the application of quantitative criteria in the CAD method ensures accurate and consistent results, which would potentially eliminate the obstacle of inter-observer variability (43). Thirdly, the CAD method has good diagnostic performance and can be used as an auxiliary tool to help radiologists make clinical diagnosis for LNM. Finally, the CAD method may potentially reduce the frequency of unnecessary FNAs for benign LNs. In the future, we are also going to use the breast cancer dataset for testing our proposed network. The experimental results would help us to improve the detection and classification networks we proposed.
However, this study has several limitations. Firstly, relatively few CT images of LNM were collected in this paper due to the limitation of time. Secondly, the experiment was only conducted on the CT dataset from the Second Affiliated Hospital of the Zhejiang University, without multi-center verification. So the results can be systematically biased. Thirdly, the ROIs of LNM was labeled by the radiologist, so the results highly depended on the radiologist’s experience.
In conclusion, a deep-learning-based CAD framework guided by the CT dataset analysis, consisting of an improved Faster R-CNN and the A-ResNet50-W classification network, was proposed for lymph node (LN) detection and classification in CT images in this study. The proposed method outperformed three state-of-the-art detection and classification networks and three experienced radiologists in terms of both detection and classification accuracy. The proposed CAD method can be used as a reliable second opinion for radiologists to help them avoid misdiagnosis due to work overload. Furthermore, it can give helpful suggestions for junior radiologists with limited clinical experience. The follow-up studies envision collecting more CT images of cervical LNM from multiple hospitals to make the CAD method more robust. Besides, unsupervised or weakly supervised learning should be suggested for model training to reduce the burden of data annotation. Finally, future research can consider adding radiologists’ experience and domain knowledge into the deep-learning based CAD method to make it more clinically significant.
Data availability statement
The raw data supporting the conclusions of this article will be made available by the authors, without undue reservation.
Author contributions
TW: substantially contributed to the conception and design of the work, and data processing, and doing experiments and the writing of the manuscript, and be accountable for the manuscript’s contents. DY: substantially contributed to the conception and design of the work, and data processing, and doing experiments and the writing of the manuscript, and approved the final version of the manuscript. ZL: substantially contributed to CT data collection. LX, CL, HX, MF: substantially contributed to CT data labling. ZZ: substantially contributed to the conception and design of the work, and investigation, and the revision of the manuscript, and approved the final version of the manuscript, and be accountable for the manuscript’s contents. YW: substantially contributed to writing the final version of the manuscript. All authors contributed to the article and approved the submitted version.
Funding
This research was funded by the National Key Research and Development Program of China under Grant 2019YFB1311300.
Conflict of interest
The authors declare that the research was conducted in the absence of any commercial or financial relationships that could be construed as a potential conflict of interest.
Publisher’s note
All claims expressed in this article are solely those of the authors and do not necessarily represent those of their affiliated organizations, or those of the publisher, the editors and the reviewers. Any product that may be evaluated in this article, or claim that may be made by its manufacturer, is not guaranteed or endorsed by the publisher.
References
1. Qiao T, Liu S, Cui Z, Yu X, Cai H, Zhang H, et al. Deep learning for intelligent diagnosis in thyroid scintigraphy. J Int Med Res (2021) 49(1):300060520982842. doi: 10.1177/0300060520982842
2. Tufano RP, Clayman G, Heller KS, Inabnet WB, Kebebew E, Shaha A, et al. Management of Recurrent/Persistent nodal disease in patients with differentiated thyroid cancer: A critical review of the risks and benefits of surgical intervention versus active surveillance. Thyroid. (2015) 25(1):15–27. doi: 10.1089/thy.2014.0098
3. Yeh MW, Bauer AJ, Bernet VA, Ferris RL, Loevner LA, Mandel SJ, et al. American Thyroid association statement on preoperative imaging for thyroid cancer surgery. Thyroid. (2015) 25(1):3–14. doi: 10.1089/thy.2014.0096
4. Durante C, Montesano T, Torlontano M, Attard M, Monzani F, Tumino S, et al. Papillary thyroid cancer: Time course of recurrences during postsurgery surveillance. J Clin Endocrinol Metab (2013) 98(2):636–42. doi: 10.1210/jc.2012-3401
5. Stack BC Jr., Ferris RL, Goldenberg D, Haymart M, Shaha A, Sheth S, et al. American Thyroid association consensus review and statement regarding the anatomy, terminology, and rationale for lateral neck dissection in differentiated thyroid cancer. Thyroid. (2012) 22(5):501–8. doi: 10.1089/thy.2011.0312
6. Al-Saif O, Farrar WB, Bloomston M, Porter K, Ringel MD, Kloos RT. Long-term efficacy of lymph node reoperation for persistent papillary thyroid cancer. J Clin Endocrinol Metab (2010) 95(5):2187–94. doi: 10.1210/jc.2010-0063
7. Lee JH, Ha EJ, Kim JH. Application of deep learning to the diagnosis of cervical lymph node metastasis from thyroid cancer with CT. Eur Radiology. (2019) 29(10):5452–7. doi: 10.1007/s00330-019-06098-8
8. Wei Q, Wu D, Luo H, Wang X, Zhang R, Liu Y. Features of lymph node metastasis of papillary thyroid carcinoma in ultrasonography and CT and the significance of their combination in the diagnosis and prognosis of lymph node metastasis. J Buon. (2018) 23(4):1041–8.
9. Kim SK, Woo J-W, Park I, Lee JH, Cho J-H, Kim J-H, et al. Computed tomography-detected central lymph node metastasis in ultrasonography node-negative papillary thyroid carcinoma: Is it really significant? Ann Surg Oncol (2017) 24(2):442–9. doi: 10.1245/s10434-016-5552-1
10. Haugen BR, Alexander EK, Bible KC, Doherty GM, Mandel SJ, Nikiforov YE, et al. 2015 American Thyroid association management guidelines for adult patients with thyroid nodules and differentiated thyroid cancer the American thyroid association guidelines task force on thyroid nodules and differentiated thyroid cancer. Thyroid (2016) 26(1):1–133. doi: 10.1089/thy.2015.0020
11. Shin JH, Baek JH, Chung J, Ha EJ, Kim J-H, Lee YH, et al. Ultrasonography diagnosis and imaging-based management of thyroid nodules: Revised Korean society of thyroid radiology consensus statement and recommendations. Korean J Radiology. (2016) 17(3):370–95. doi: 10.3348/kjr.2016.17.3.370
12. Gharib H, Papini E, Paschke R, Duick DS, Valcavi R, Hegedüs L, et al. American Association of clinical endocrinologists, associazione Medici endocrinologi, and European thyroid association medical guidelines for clinical practice for the diagnosis and management of thyroid nodules: Executive summary of recommendations. Endocrine Pract (2010) 16(3):468–75. doi: 10.4158/EP.16.3.468
13. Mulla MG, Knoefel WT, Gilbert J, McGregor A, Schulte K-M. Lateral cervical lymph node metastases in papillary thyroid cancer: A systematic review of imaging-guided and prophylactic removal of the lateral compartment. Clin Endocrinology. (2012) 77(1):126–31. doi: 10.1111/j.1365-2265.2012.04336.x
14. Moon HJ, Kim E-K, Yoon JH, Kwak JY. Differences in the diagnostic performances of staging us for thyroid malignancy according to experience. Ultrasound Med Biol (2012) 38(4):568–73. doi: 10.1016/j.ultrasmedbio.2012.01.002
15. Mulla M, Schulte K-M. Central cervical lymph node metastases in papillary thyroid cancer: a systematic review of imaging-guided and prophylactic removal of the central compartment. Clin Endocrinology. (2012) 76(1):131–6. doi: 10.1111/j.1365-2265.2011.04162.x
16. Lee Y, J-h K, JH B, Jung SL, Park SW, Kim J, et al. Value of CT added to ultrasonography for the diagnosis of lymph node metastasis in patients with thyroid cancer. Head Neck-Journal Sci Specialties Head Neck. (2018) 40(10):2137–48. doi: 10.1002/hed.25202
17. Li L, Cheng S-N, Zhao Y-F, Wang X-Y, Luo D-H, Wang Y. Diagnostic accuracy of single-source dual-energy computed tomography and ultrasonography for detection of lateral cervical lymph node metastases of papillary thyroid carcinoma. J Thorac Disease. (2019) 11(12):5032–41. doi: 10.21037/jtd.2019.12.45
18. Yoo R-E, J-h K, Hwang I, Kang KM, Yun TJ, Choi SH, et al. Added value of computed tomography to ultrasonography for assessing LN metastasis in preoperative patients with thyroid cancer: Node-by-Node correlation. Cancers (2020) 12(5):1190. doi: 10.3390/cancers12051190
19. Cho SJ, Suh CH, Baek JH, Chung SR, Choi YJ, Lee JH. Diagnostic performance of CT in detection of metastatic cervical lymph nodes in patients with thyroid cancer: a systematic review and meta-analysis. Eur Radiology. (2019) 29(9):4635–47. doi: 10.1007/s00330-019-06036-8
20. Simonyan K, Zisserman AJCS. Very deep convolutional networks for Large-scale image recognition. arXiv (2014), 1409.1556. doi: 10.48550/arXiv.1409.1556
21. Marentakis P, Karaiskos P, Kouloulias V, Kouloulias V, Kelekis N, Argentos S, et al. Lung cancer histology classification from CT images based on radiomics and deep learning models. Med Biol Eng Computing. (2021) 59(1):215–26. doi: 10.1007/s11517-020-02302-w
22. Li C, Yang Y, Liang H, Wu B. Transfer learning for establishment of recognition of COVID-19 on CT imaging using small-sized training datasets. Knowledge-based systems. (2021) 218:106849–9. doi: 10.1016/j.knosys.2021.106849
23. Fujima N, Andreu-Arasa VC, Onoue K, Weber PC, Hubbell RD, Setty BN, et al. Utility of deep learning for the diagnosis of otosclerosis on temporal bone CT. Eur Radiol (2021) 31:5206–211. doi: 10.1007/s00330-020-07568-0
24. Zhao H-B, Liu C, Ye J, Chang LF, Xu Q, Shi BW, et al. Comparison of deep learning convolutional neural network with radiologists in differentiating benign and malignant thyroid nodules on CT images. Endokrynologia Polska (2021) 72(3):217–25. doi: 10.5603/EP.a2021.0015
25. Lee JH, Ha EJ, Kim D. Application of deep learning to the diagnosis of cervical lymph node metastasis from thyroid cancer with CT: External validation and clinical utility for resident training. Eur Radiology. (2020) 30(6):3066–72. doi: 10.1007/s00330-019-06652-4
26. Ren S, He K, Girshick R, Sun J. Faster r-CNN: Towards real-time object detection with region proposal networks. IEEE Trans Pattern Anal Mach Intelligence. (2017) 39(6):1137–49. doi: 10.1109/TPAMI.2016.2577031
27. Wu X, Ling X. Facial expression recognition based on improved faster RCNN. CAAI Trans Intelligent Systems. (2021) 16(2):210–7. doi: 10.11992/tis.20191002
28. Su Y, Li D, Chen X. Lung nodule detection based on faster r-CNN framework. Comput Methods Programs Biomedicine. (2021) 200:105866. doi: 10.1016/j.cmpb.2020.105866
29. Alzraiee H, Leal Ruiz A, Sprotte R. Detecting of pavement marking defects using faster r-CNN. J Perform Constructed Facilities (2021) 35(4). doi: 10.1061/(ASCE)CF.1943-5509.0001606
30. He K, Gkioxari G, Dollar P, Girshick R. Mask r-CNN. IEEE Trans Pattern Anal Mach Intell (2020) 42(2):386–97. doi: 10.1109/TPAMI.2018.2844175
31. Kaiming H, Xiangyu Z, Shaoqing R, Jian S Deep residual learning for image recognition, in: 2016 IEEE Conference on Computer Vision and Pattern Recognition (CVPR), Las Vegas, NV, USA, (2016) 770–8. doi: 10.1109/cvpr.2016.90:770-778
32. Lin T-Y, Dollar P, Girshick R, He K, Hariharan B, Belongie S, et al. Feature pyramid networks for object detection, in: 30th IEEE/CVF Conference on Computer Vision and Pattern Recognition (CVPR) (2017), Honolulu, HI, USA 936–44.
33. Hou Q, Zhou D, Feng JJA. Coordinate attention for efficient mobile network design. 2021 IEEE/CVF Conference on Computer Vision and Pattern Recognition (CVPR), Nashville, TN, USA (2021) 13708–17. doi: 10.1109/CVPR46437.2021.01350
34. Zagoruyko S, Komodakis N. Wide residual networks arXiv. arXiv (2016) (BMVA Press) 87:13. doi: 10.48550/arXiv.1605.07146
35. Liu W, Anguelov D, Erhan D, Reed S, Fu C-Y, Berg AC, et al. (2016). SSD: Single shot MultiBox detector, in: 14th European Conference on Computer Vision (ECCV), (Cham: Springer) 9905.
36. Redmon J, Farhadi A. YOLOv3: An incremental improvement. arXiv (2018) 1804.02767. doi: 10.48550/arXiv.1804.02767
37. Sandler M, Howard A, Zhu M, Zhmoginov A, Chen L-C, Ieee. MobileNetV2: Inverted residuals and linear bottlenecks, in: Ieee/Cvf Conference on Computer Vision and Pattern Recognition (2018), (Salt Lake City, UT, USA) 4510–20. doi: 10.1109/cvpr.2018.004742018:4510-4520
38. Ma N, Zhang X, Zheng H-T, Sun J. ShuffleNet V2: Practical guidelines for efficient CNN architecture design. In: Ferrari V, Hebert M, Sminchisescu C, Weiss Y, editors. Computer vision - eccv (2018) (Germany, Cham: Springer).
39. Huang G, Liu Z, van der Maaten L, Weinberger KQ, Ieee. Densely connected convolutional networks, in: 30th Ieee Conference on Computer Vision and Pattern Recognition (2018), (Honolulu, HI, USA), 2261–9. doi: 10.1109/cvpr.2017.2432017:2261-2269
40. Mingxing T, Le QV. EfficientNet: Rethinking model scaling for convolutional neural networks arXiv. arXiv (2019) 97:6105–14. doi: 10.48550/arXiv.1905.11946
41. Xie S, Girshick R, Dollar P, Tu Z, He K, Ieee. Aggregated residual transformations for deep neural networks, in: 30th Ieee Conference on Computer Vision and Pattern Recognition (2017), (Honolulu, HI, USA), 5987–95. doi: 10.1109/cvpr.2017.6342017:5987-5995
42. Radosavovic I, Kosaraju RP, Girshick R, Kaiming H, Dollar P. Designing network design spaces. 2020 IEEE/CVF Conference on Computer Vision and Pattern Recognition (CVPR) Seattle, WA, USA, (2020) 10425–33. doi: 10.1109/cvpr42600.2020.010442020
43. Lee HJ, Yoon DY, Seo YL, Lim KJ, Cho YK, Yun EJ, et al. Intraobserver and interobserver variability in ultrasound measurements of thyroid nodules. J Ultrasound Med (2018) 37(1):173–8. doi: 10.1002/jum.14316
Keywords: computer-aided diagnosis, deep learning, lymph node metastasis, computed tomography, neural network
Citation: Wang T, Yan D, Liu Z, Xiao L, Liang C, Xin H, Feng M, Zhao Z and Wang Y (2023) Diagnosis of cervical lymph node metastasis with thyroid carcinoma by deep learning application to CT images. Front. Oncol. 13:1099104. doi: 10.3389/fonc.2023.1099104
Received: 15 November 2022; Accepted: 10 January 2023;
Published: 26 January 2023.
Edited by:
Olivier Gires, Ludwig-Maximilians-University, GermanyReviewed by:
Kristian Unger, Helmholtz Association of German Research Centres (HZ), GermanyPalash Ghosal, Sikkim Manipal University, India
Copyright © 2023 Wang, Yan, Liu, Xiao, Liang, Xin, Feng, Zhao and Wang. This is an open-access article distributed under the terms of the Creative Commons Attribution License (CC BY). The use, distribution or reproduction in other forums is permitted, provided the original author(s) and the copyright owner(s) are credited and that the original publication in this journal is cited, in accordance with accepted academic practice. No use, distribution or reproduction is permitted which does not comply with these terms.
*Correspondence: Zijian Zhao, emhhb3ppamlhbkBzZHUuZWR1LmNu
†These authors have contributed equally to this work and share first authorship