- Department of Obstetrics and Gynecology, Shengjing Hospital of China Medical University, Shenyang, Liaoning, China
Background: Endometrial cancer (EC) is a common gynecological cancer worldwide and the sixth most common female malignant tumor. A large number of studies conducted through database mining have identified many biomarkers that may be related to survival and prognosis. However, the predictive ability of single-gene biomarkers is not sufficiently accurate. In recent years, tumors have been shown to interact closely with their microenvironment, and tumor-infiltrating immune cells in the tumor microenvironment were associated with therapeutic effects. Furthermore, sequencing technology has evolved and allowed the identification of genetic signatures that may improve prediction results. The purpose of this research was to discover the Cancer Genome Atlas (TCGA) data to evaluate new genetic features that can predict the prognosis of EC.
Methods: mRNA expression profiling was analyzed in patients with EC identified in the TCGA database (n = 530). Differentially expressed genes at different stages of EC were screened using the immune cell enrichment score (ImmuneScore). Univariate and multivariate Cox regression analyses was applied to evaluate genes significantly related to overall survival and establish the prognostic risk parameter formula. Kaplan–Meier survival curves and the logarithmic rank method were applied to verify the importance of risk parameters for the prognostic forecast. The accuracy of survival prediction was confirmed using the nomogram and Receiver Operating Characteristic (ROC) curve analysis. The mRNA expression of eight genes were measured by qRT-PCR. According to COX and HR values, NBAT1, a representative gene among 8 genes, was selected for CCK-8 assay, colony formation assay and transwell invasion assay to verify the effect on survival.
Results: Eight related genes (NBAT1, GFRA4, PTPRT, DLX4, RANBP3L, UNQ6494, KLRB1, and PRAC1) were discovered to be significantly associated with the overall survival rate. According to these eight-gene signatures, 530 patients with EC were assigned to high- and low-risk subgroups. The prognostic capability of the eight-gene signature was not influenced by other elements.
Conclusions: Eight related gene markers were identified using ImmuneScore, which could predict prognosis and survival in patients with EC. These findings provide a basis for understanding the application of biological information in tumors and identifying the poor prognosis of EC.
1. Introduction
In recent years, due to the extension of life expectancy and increase in the overall prevalence of obesity and metabolic syndrome, the incidence and mortality of endometrial cancer (EC) compared to other cancers have been continuously increasing (1). There were 382,069 new estimated cases and 89,929 estimated deaths caused by this disease in 2018 (2). EC usually occurs in postmenopausal women and only about 4% of patients are under 40 years of age (3). It is predicted that by 2025, the number of new cases and deaths will increase by 20.3% and 17.4%, respectively (2). Although most patients can be diagnosed early, some are already in the advanced stage of the disease at the time of diagnosis. Moreover, patients at identical stages can also show different responses to the same treatment and different prognoses. The mortality of EC is directly related to the poor prognostic factors that drive tumor recurrence (4). Therefore, the discovery of effective biomarkers is important to assess prognosis and identify patients at high risk for EC.
An increasing number of studies have shown the significance of tumor microenvironment (TME) in tumor progression. Synergistic interaction between cancer cells and their support cells contributes to the malignant phenotype of cancer, for example, continuous diffusion, anti-apoptosis, and evasion of immune surveillance. Therefore, TME has a significant impact on the treatment effect and clinical outcomes in cancer patients (5, 6). The main structural parts of TME are permanent stromal cells and recruited immune cells. However, the role of stromal cells in tumor angiogenesis and extracellular matrix remodeling is not completely understood (7). Some research has concentrated on the influence of immune cells in the TME on tumor growth and spread. An increasing number of studies have shown that tumor-infiltrating immune cells (TICs) in the TME are promising indicators of therapeutic effects (8).
With the advancement of high-throughput sequencing technology, investigators have set up genome databases of many diseases to understand genomic changes more systematically and clearly. Through database mining, scientists have found several biomarkers that may be related to prognosis in patients with cancer (9, 10). However, the predictive ability of single-gene biomarkers is still not sufficiently accurate. Studies have shown that evaluating genetic characteristics involving multiple genes can improve prognosis (11, 12). The polygenic prognostic characteristics of primary tumor biopsies have a guiding role in treatment. There are reports wherein the impact of multigene signatures in EC has been studied to assess prognosis and identify potential patients at high risk for EC (13, 14).
To identify biomarkers, differential gene expression analysis usually involves comparing expression levels in genes between groups and focusing on the genes whose expression levels are significantly regulated. As an emerging method, ImmuneScore can determine the difference in survival rate in patients with EC between different disease stages and finally obtain the best gene combination. This is important for tumor prognosis and survival assessment (15).
We identified new genetic characteristics that predict the prognosis of EC. We explored the Cancer Genome Atlas (TCGA) data and selected the relevant genes using ImmuneScore. Furthermore, we applied mRNA expression data from TCGA to survey and draw marker genomes in 530 patients with EC. We identified 99 mRNAs significantly related to immune cells and established a risk profile of eight genes to effectively predict the prognosis in EC patients. The risk factors obtained through ImmuneScore can independently assess the prognosis in high-risk patients and identify and verify new genetic features and biomarkers.
2. Materials and methods
2.1. Patient clinical data and mRNA expression dataset
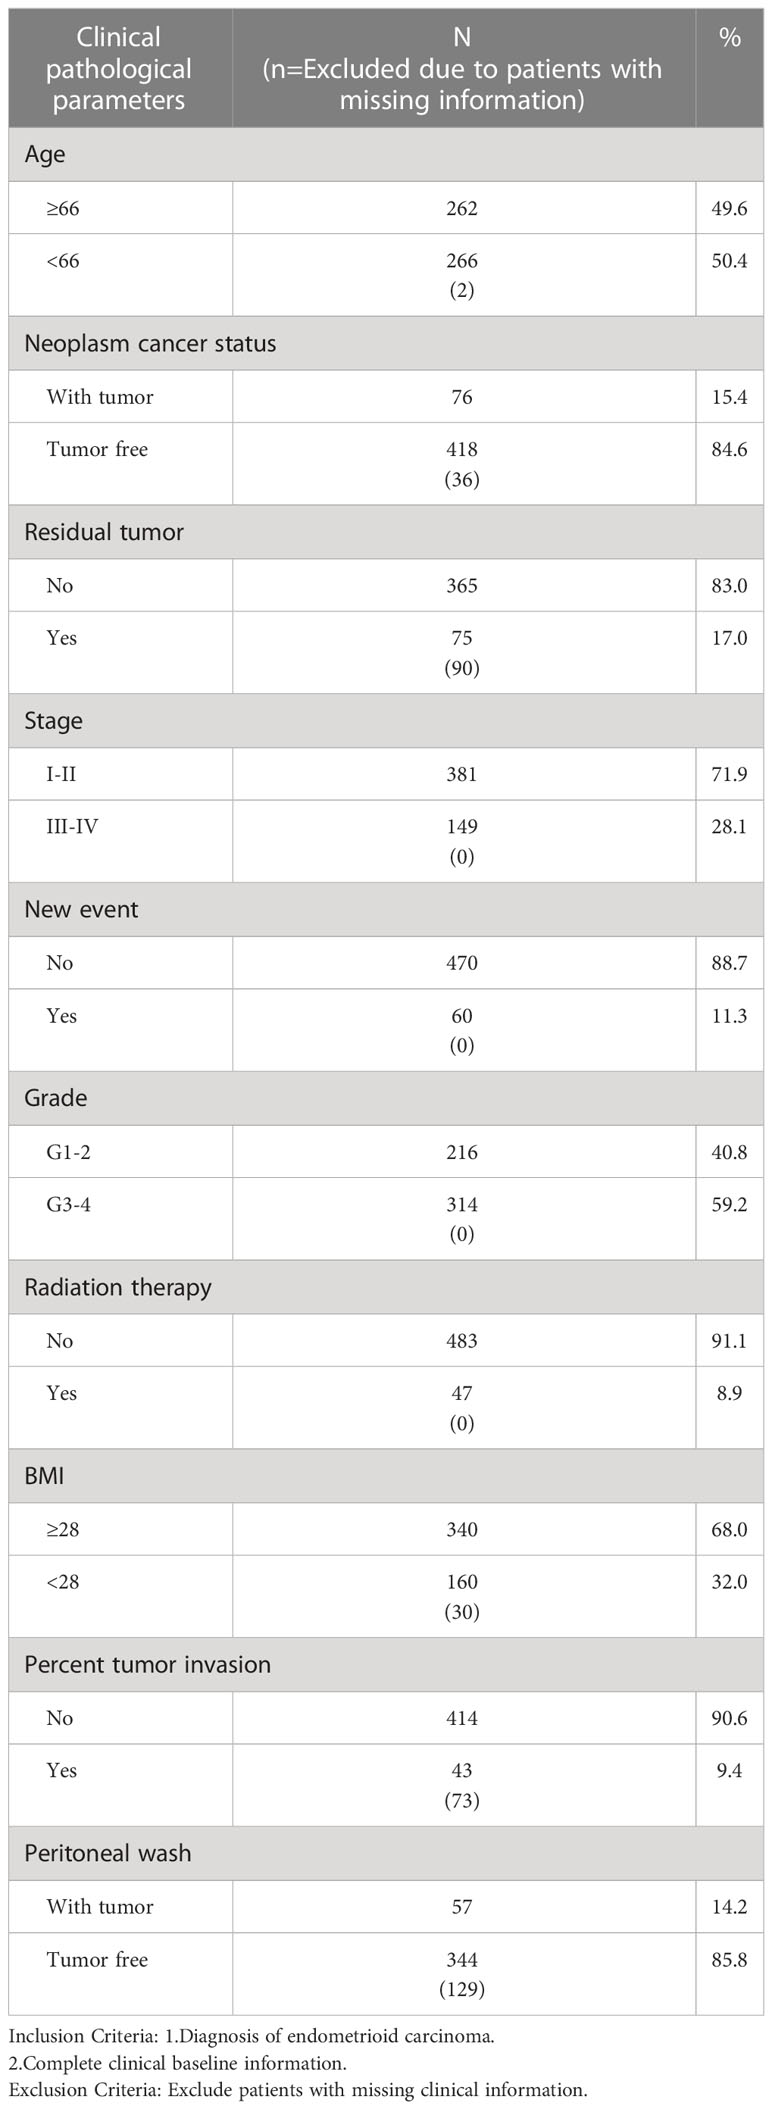
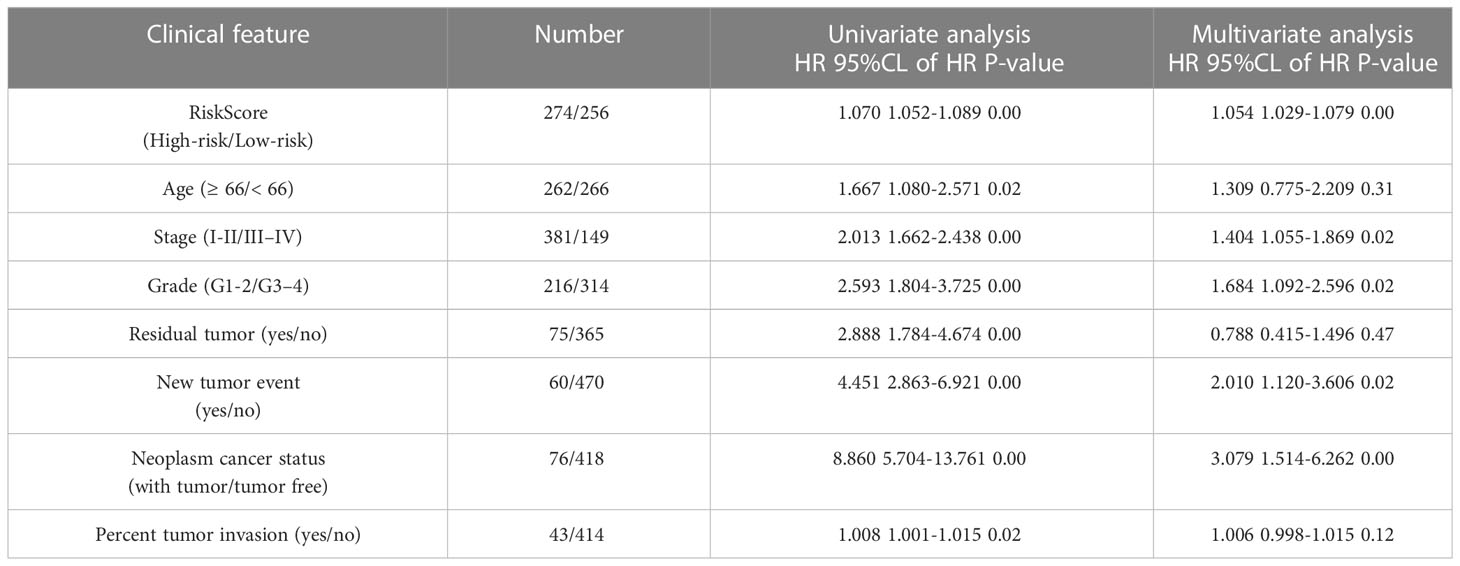
We collected clinical data and mRNA expression profiles of EC patients from TCGA (https://cancergenome.nih.gov/) (16). The research included clinical data from 530 patients with the following parameters: matching age, stage, grade, radiation therapy, neoplasm cancer status, residual tumor, body mass index (BMI), percentage of tumor invasion, new events, and peritoneal wash (Table 1).
2.2. Immune cell enrichment score (ImmuneScore)
We used ImmuneScore to evaluate the difference in survival rates among the EC patient groups at different stages, and thereafter assigned them as high- and low-risk groups. Used the ESTIMATE package to calculate the ImmuneScore(proportion of immune component), StromalScore(proportion of stromal component) and ESTIMATEScore(sum of the above two scores) of the EC samples. The higher the score, Represented the higher proportion of the corresponding components (immune, stromal, and tumor purity) in TME. Then, We used the edgeR algorithm (http://bioconductor.org) for preliminary screening to generate differentially expressed genes. EdgeR is a bioconductor software package used to examine the differential expression of replicated count data. Next, we used the least absolute shrinkage and selection operator (LASSO) model to select statistically significant prognostic markers from the differentially expressed genes. We analyzed the expression standards of 24,991 mRNAs in EC specimens and neighboring non-cancerous tissues. Last, we used the normalized P-value (P < 0.05) to determine the function for subsequent analyses.
2.3. Data screening and risk-parameter calculation
Log2 transformation was applied to normalize the expression profile of each mRNA. Univariate Cox regression analysis was applied to determine genes correlated with overall survival (OS), and multivariate Cox regression analysis was applied to identify genes associated with prognosis and obtain their coefficients. The selected mRNAs were then assigned as risk type (hazard ratio, HR > 1) and protective type (0 < HR < 1). By linear combination of the filtered gene expression value (weighted by its coefficient), we constructed the following hazard parameter formula: hazard parameter = ∑ (βn × gene n expression). Applying the median hazard parameter as a cut-off value, 530 patients were assigned to high- and low-risk subgroups.
2.4. Quantitative real-time -PCR samples and patients
A total of 20 EC tissues and 20 normal endometrial tissues were obtained from patients in the Department of Gynecology and Obstetrics of Shengjing Hospital affiliated with the China Medical University. Normal tissues were taken from patients who underwent hysterectomy for unrelated diseases of the endometrium. All patients gave informed consent. This study was approved by the Ethics Committee of Shengjing Hospital affiliated with the China Medical University. The histological diagnosis and staging were evaluated by experienced pathologists according to the International Federation of Gynecology and Obstetrics (FIGO) 2009 staging system. None of the patients received systemic treatment before surgery. Data for endometrial cancer patients are presented in Supplementary Table S1.
2.5. RNA extraction and qRT-PCR
TRIzol reagent (Vazyme, Nanjing, China) was used to extract total RNA from the tissue. PrimeScript RT-polymerase (Vazyme) was used for reverse transcription to obtain cDNAs corresponding to the target mRNAs. qRT-PCR was performed using SYBR-Green Premix (Vazyme) and specific PCR primers (Sangon Biotech Co., Ltd, Shanghai, China). Glyceraldehyde-3-phosphate dehydrogenase (GAPDH) was used as an internal control. Primer sequences are shown in Supplementary Table S2. The 2−ΔΔCt method was used to calculate the relative fold-changes in mRNA expression.
2.6. Transfection of cells
SiRNA sequences targeting NBAT1, and their respective negative control (NC) counterparts were purchased from GenePharma (Shanghai, China). According to the manufacturer’s instructions, Lipofectamine 3000 (Invitrogen) was used to transfect cells with siRNA for the following experiments. Sequences of siRNA are listed in Supplementary Table S3.
2.7. Cell culture
Ishikawa cells and HEC-1A cells were cultured with RPMI 1640 (Gibco, Carlsbad, CA, USA). A 10% fetal bovine serum (FBS) (Gibco) and 1% penicillin–streptomycin was added to the medium of the cells. All cells were cultured in a humidified incubator at 37°C with 5% CO2.
2.8. Colony formation assay
To explore the effects of NBAT1 expression on cell proliferation, cells (1000/well) transfected with NC-siRNA or siRNA, and without si-RNA as a blank(-) group were added to each well of 6-well culture plates and incubated for two weeks. Cells were stained with 0.1% crystal violet. Finally, the number of colonies was counted by light microscopy.
2.9. CCK−8 assay
Ishikawa cells and HEC-1A cells were seeded in 96-well plates, CCK-8 reagent (10 µL) (Dojindo, Japan) was added to each well, and then incubated at 37°C with 5% CO2 for 3 h. The microplate reader was used to measure OD450 values of eachwell at 0h, 24h, 48h, and 72h after treatment.
2.10. Cell invasion assay
Transwell chambers (Corning, NY, USA) with a pore size of 8μm were used to detect cell invasion. Cells were placed into the upper chamber with 200μl serum-free medium and the chambers were precoated with Matrigel solution (BD, Franklin Lakes, NJ, USA). The lower chamber contained 10%FBS medium. After incubation for 24h,invaded cells on the lower membrane surface were fixed with 4% paraformaldehyde and stained with 0.1% crystal violet.
2.11. Statistical analysis
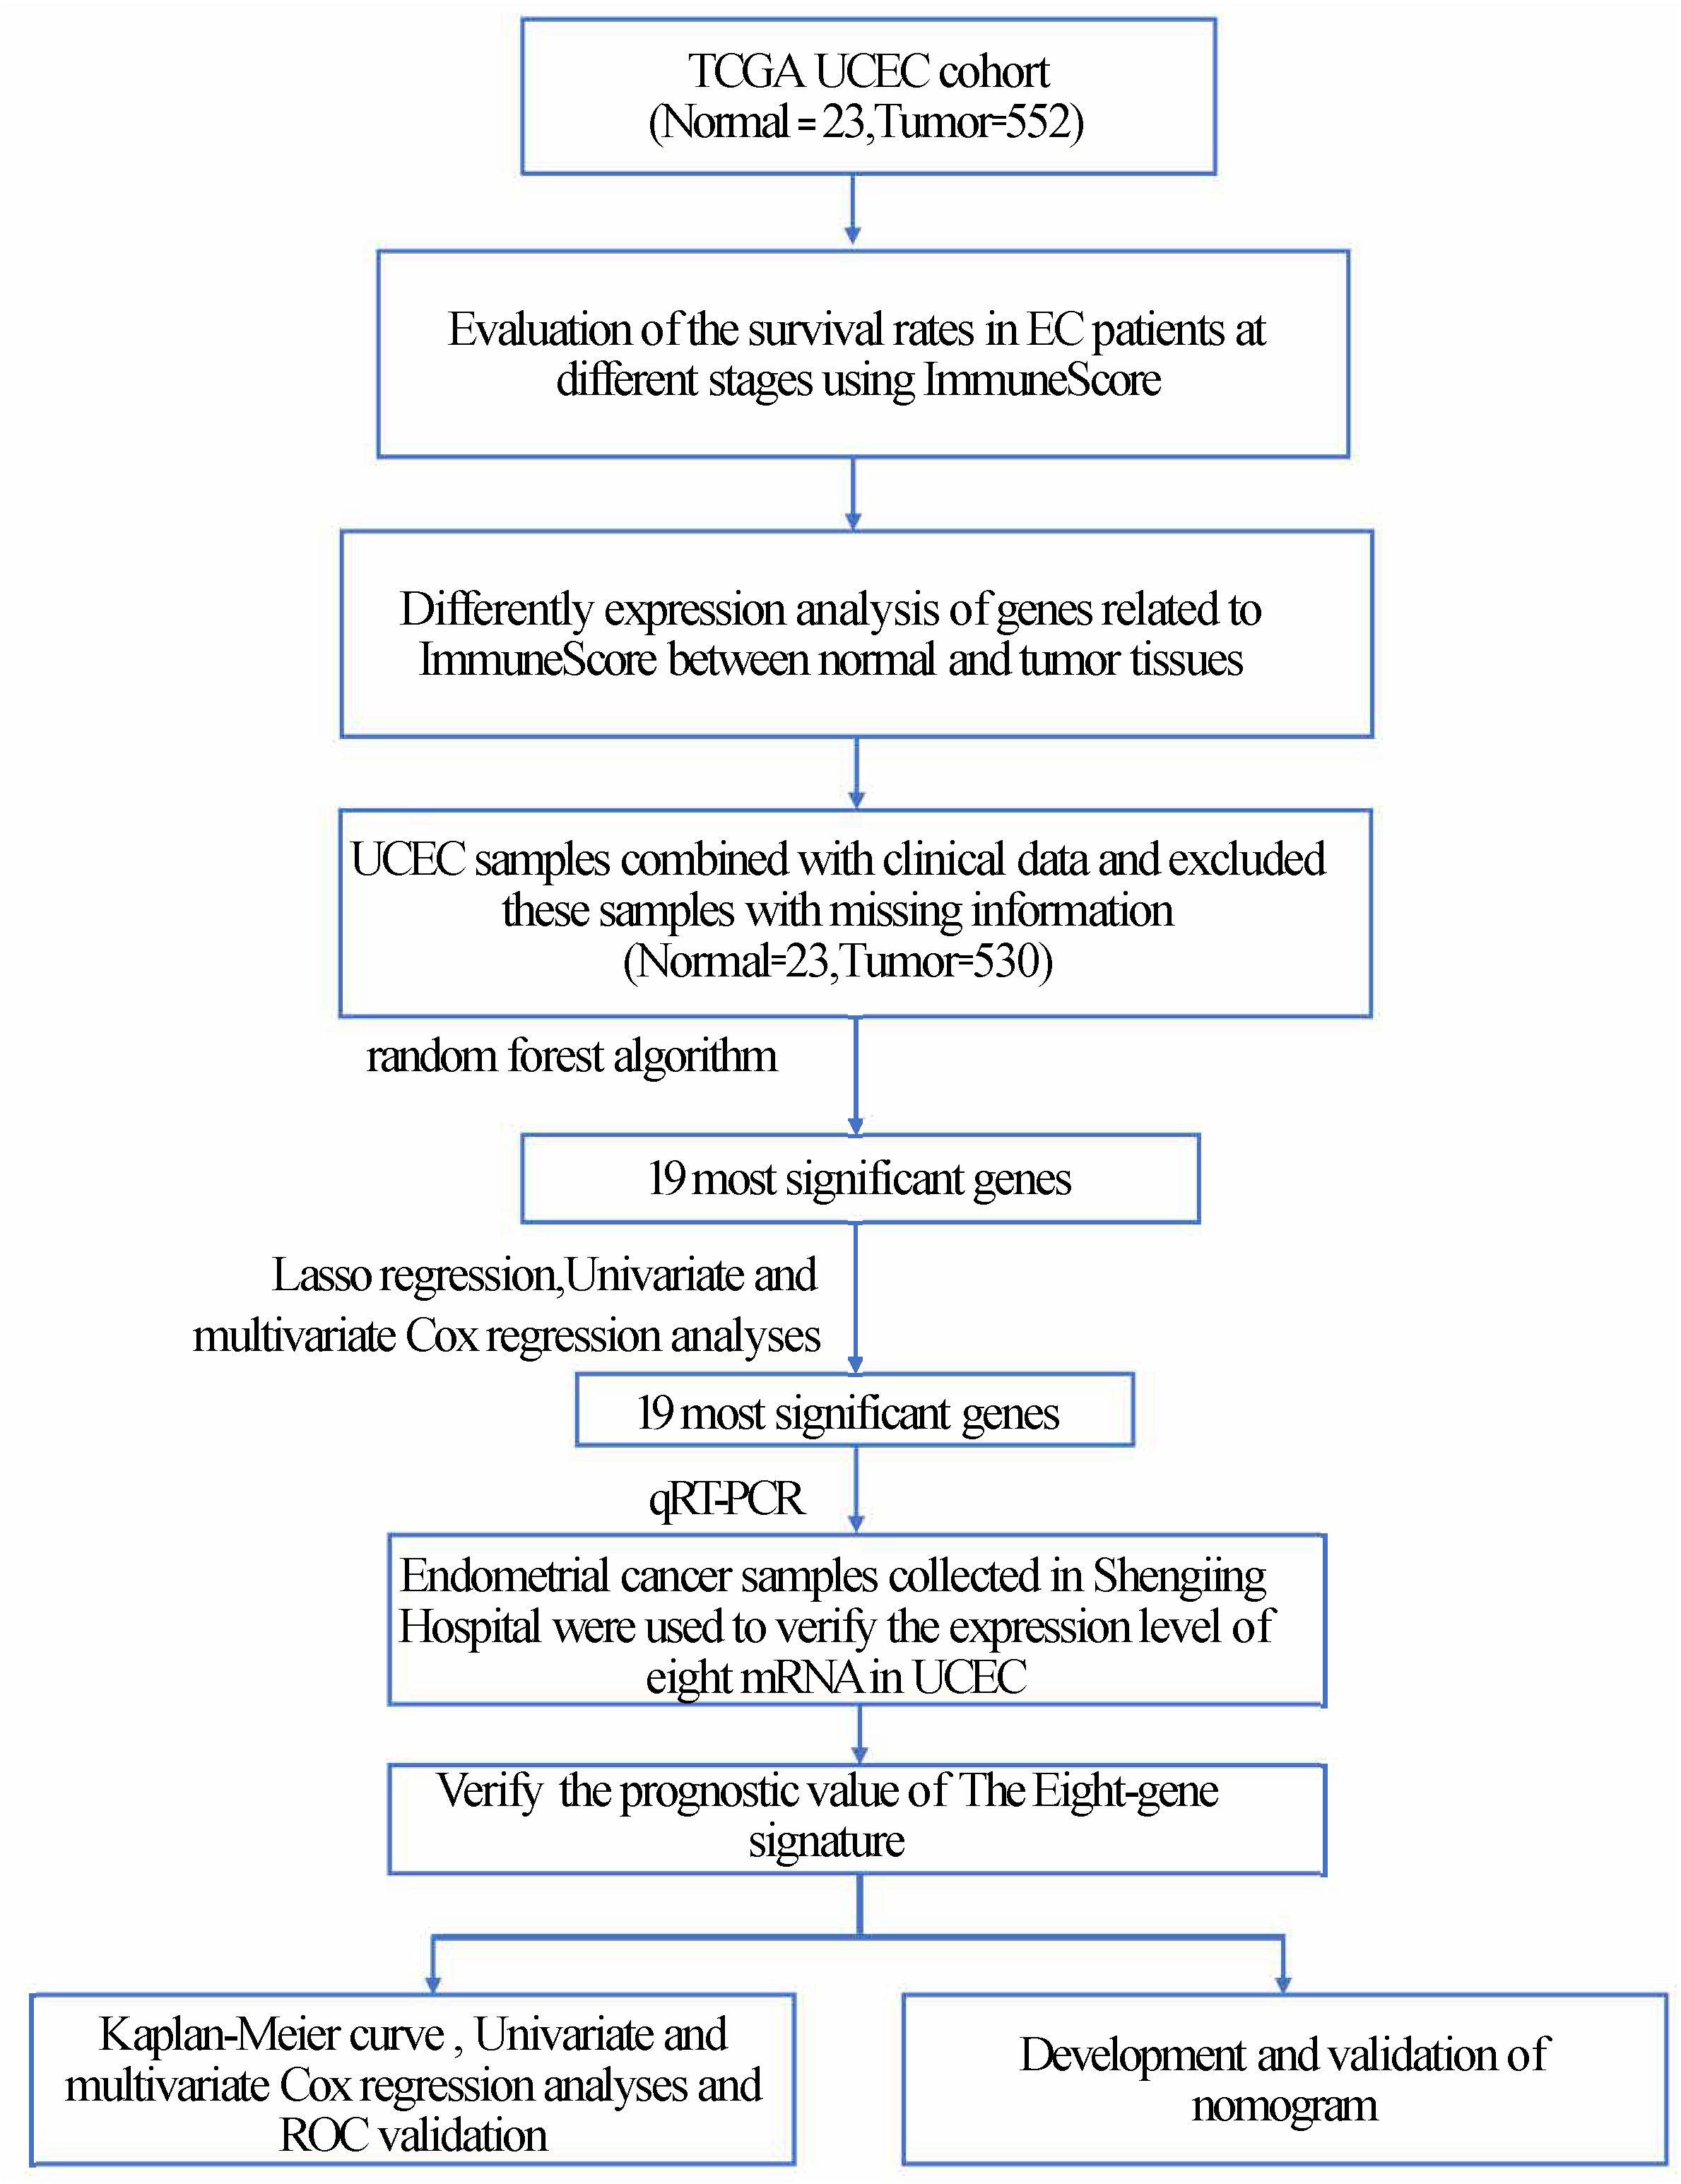
We applied Kaplan–Meier (K–M) survival curves and the log-rank means to evaluate the importance of the hazard parameters. We performed multivariate Cox regression and data lamination analyses to examine whether the risk parameters were individual clinical characteristics, containing age, stage, grade, radiation therapy, neoplasm cancer status, residual tumor, BMI, percentage of tumor invasion, new events, and peritoneal wash, which were used as covariates. Statistical significance was established at P < 0.05. Statistical analysis was performed using GraphPad Prism7 software (GraphPad, Inc., La Jolla, CA, USA) and SPSS software (version 20.0; SPSS, Inc., Chicago, IL, USA). The nomogram was constructed to evaluate prediction accuracy and recognition ability. The ROC curve (area under the curve [AUC]) was further applied to evaluate the discriminative ability of the nomogram (17, 18)(Figure 1).
3. Results
3.1. Evaluation of survival rates in EC patients at different stages using ImmuneScore
We obtained the clinical characteristics of 530 patients with EC, along with the related 24,991 mRNA expression datasets from the TCGA database. Kaplan-Meier survival analysis was performed on ImmuneScore, StromalScore and ESTIMATEScore after they were generated. A higher ImmuneScore or StromalScore indicated a greater proportion of immune or stromal components in the TME. ESTIMATEScore was the sum of ImmuneScore and StromalScore, which represented tumor purity and represented the comprehensive ratio of the two components in TME. As shown in Figure 2A, the proportion of immune components was positively correlated with OS, while StromalScore and ESTIMATEScore were not significantly correlated with OS. These results implied that the immune components of TME were more suitable to indicate the prognosis of EC patients. According to the median ImmuneScore, 530 EC specimens were assigned to high and low-risk groups (Figure 2B).
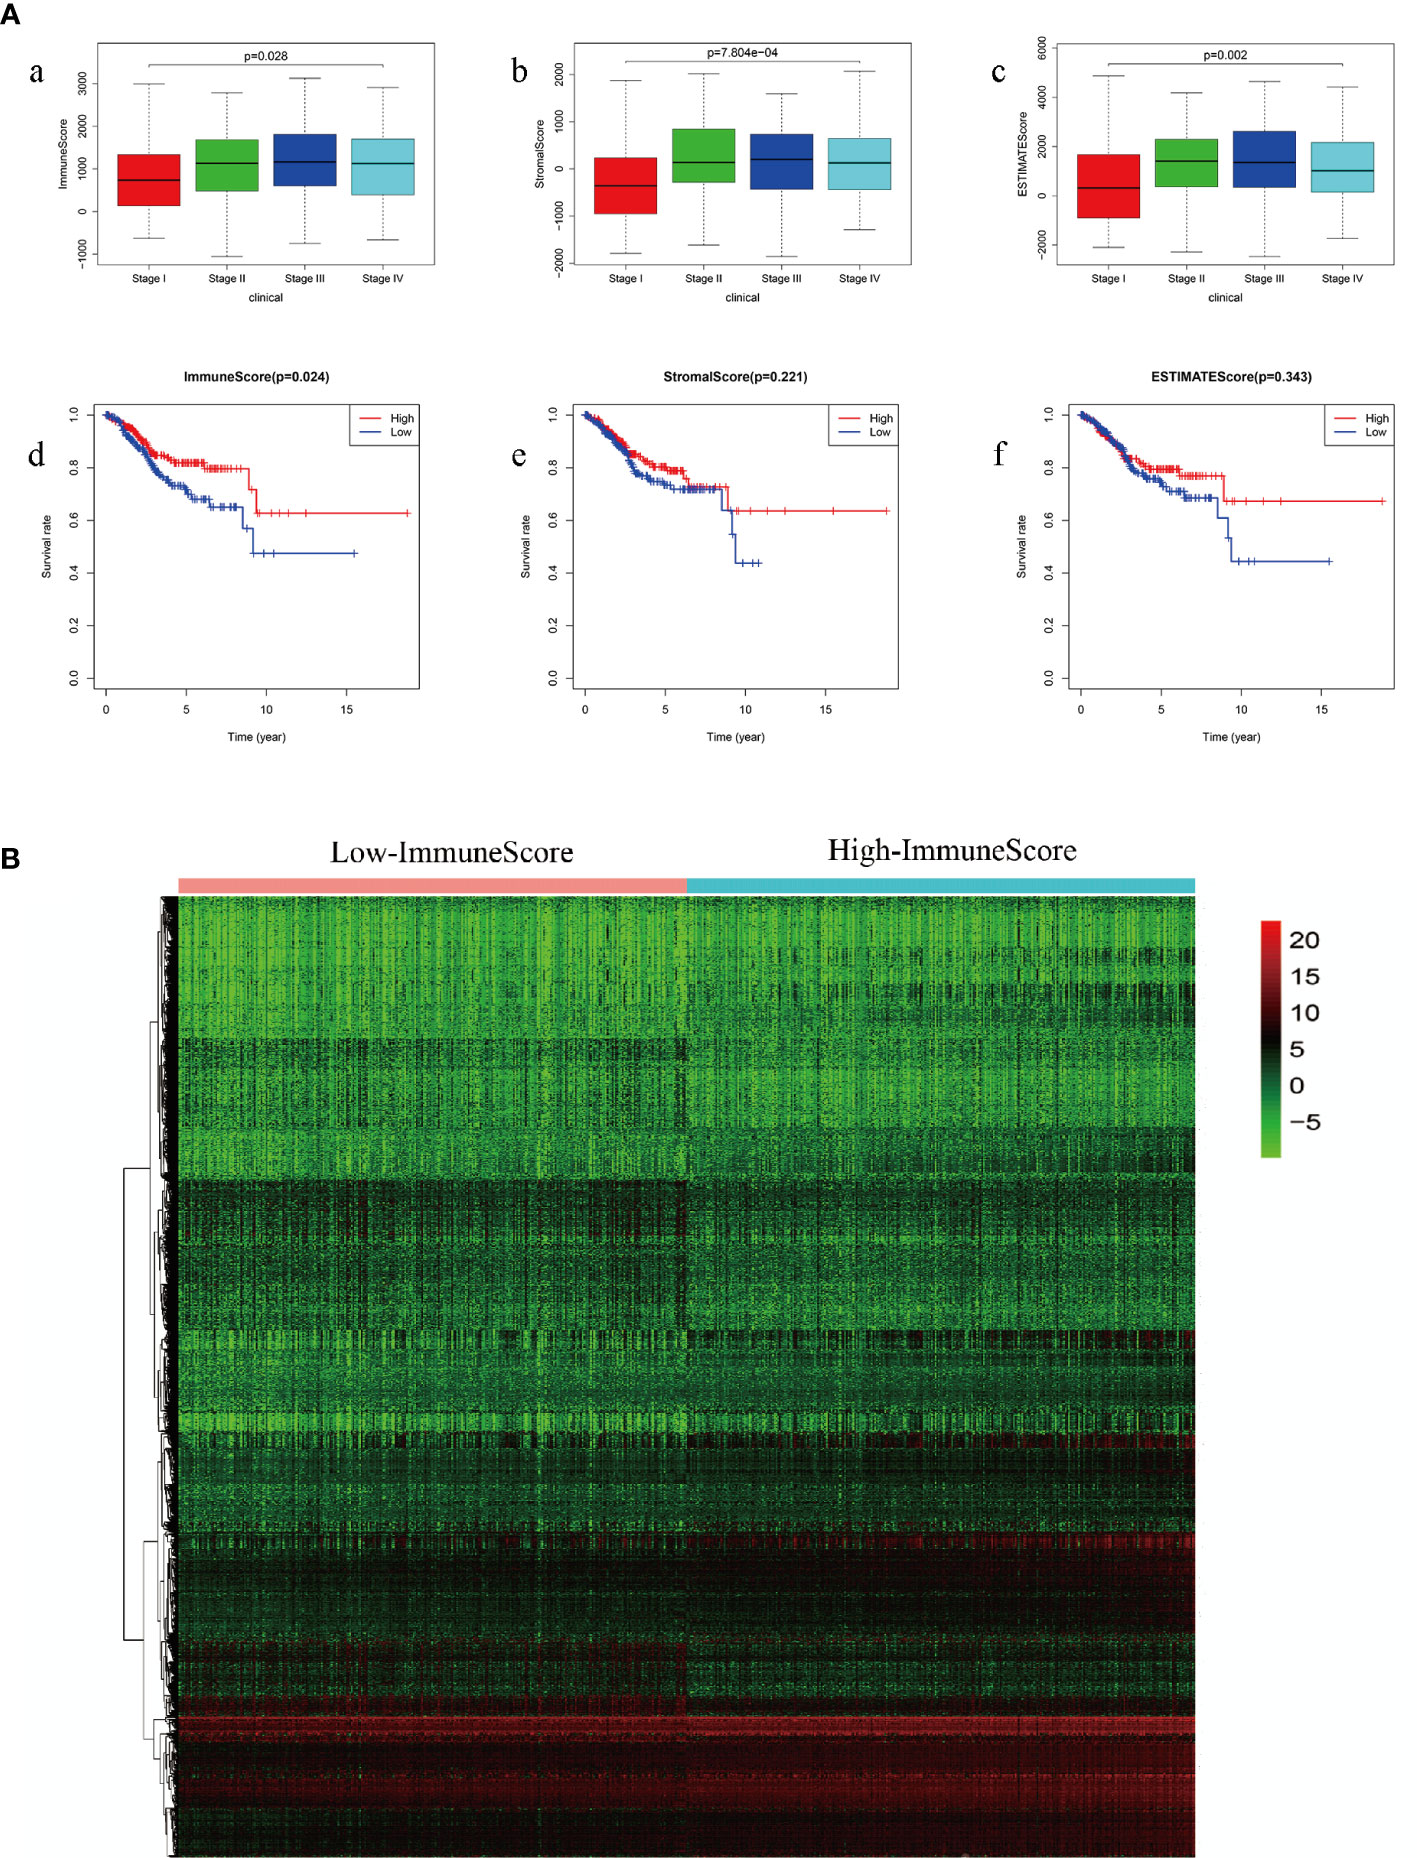
Figure 2 (A) Comparison of survival rates of ImmuneScore, StromalScore and ESTIMATEScore in different stages of endometrial carcinoma (a: ImmuneScore in different stages of endometrial carcinoma; b: StromalScore in different stages of endometrial carcinoma; c: ESTIMATEScore in different stages of endometrial carcinoma; d: comparison of survival rates of ImmuneScore; e: comparison of survival rates of StromalScore; f: comparison of survival rates of ESTIMATEScore) (B) ImmuneScore screens high-group and low-group differential genes.
3.2. Identification of mRNAs associated with survival
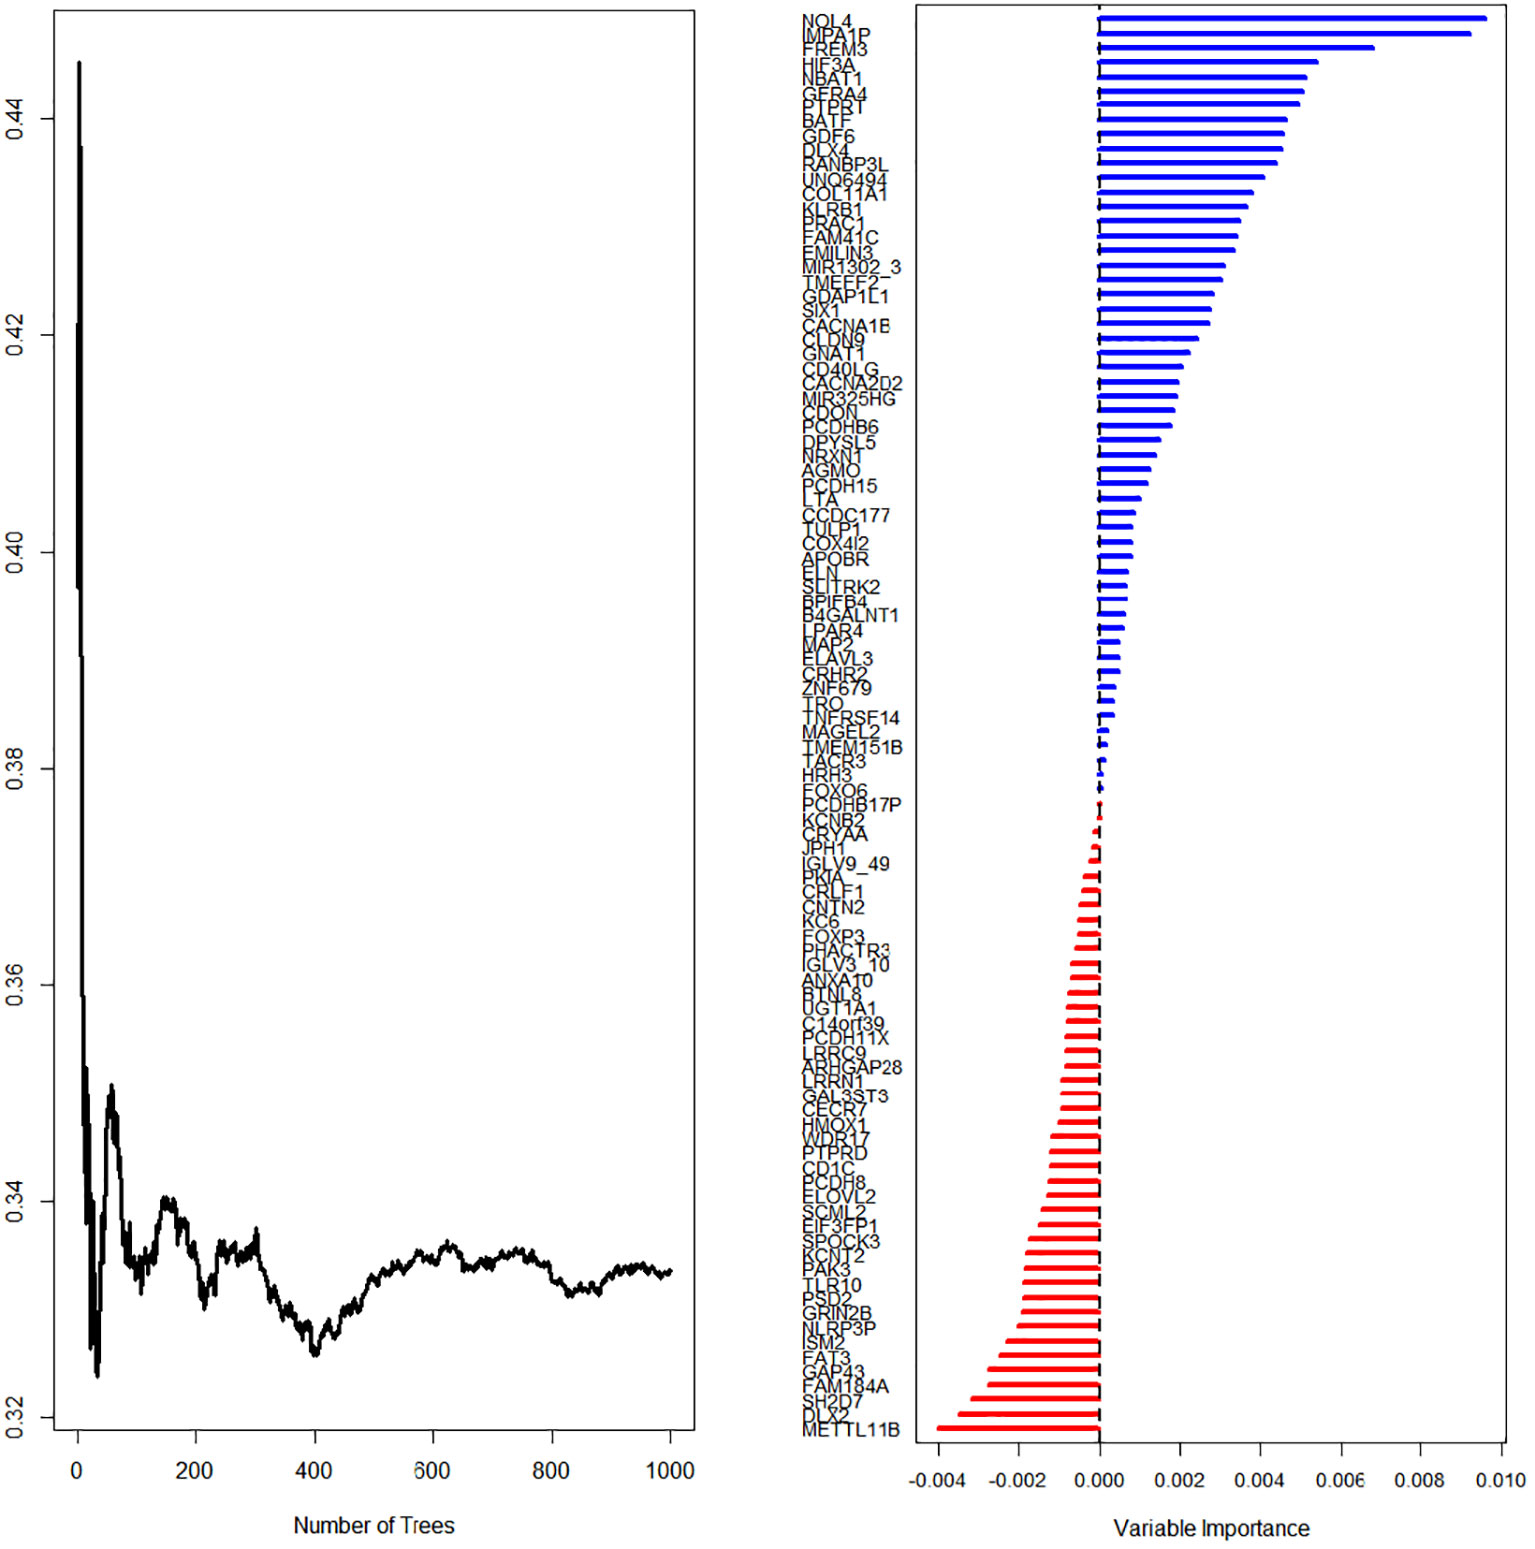
First, we screened out the differentially expressed ImmuneScore-related genes using the random forest algorithm, and obtained 19 best genes (P < 0.05) (Figure 3). Then, The least absolute shrinkage and selection operator (LASSO) regression (iteration equal 1000), univariate and multivariate Cox regression analyses were used to further verify the correlation between the 19 mRNA expression profiles and patient survival rates, and to clarify the best mRNA associations using the stepwise cleaning method. As shown in Table 2, eight mRNAs (NBAT1, GFRA4, PTPRT, DLX4, RANBP3L, UNQ6494, KLRB1, and PRAC1) were verified. After filtering, six mRNAs were classified as risky (NBAT1, GFRA4, PTPRT, DLX4, RANBP3L, and PRAC1) with HR>1 related to poorer survival, and two as protective types (UNQ6494 and KLRB1) with HR<1 related to better survival (Table 2).
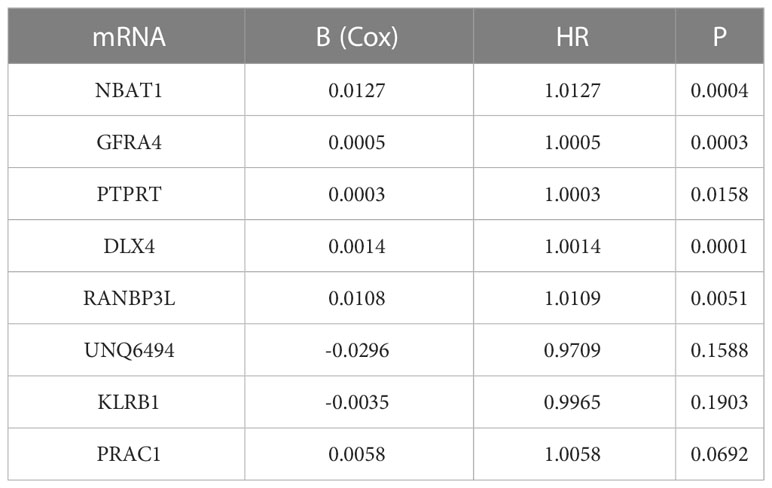
Table 2 Details of 8 prognostic mRNAs significantly related to survival in patients with endometrial cancer.
3.3. Verification of TCGA expression using qRT-PCR
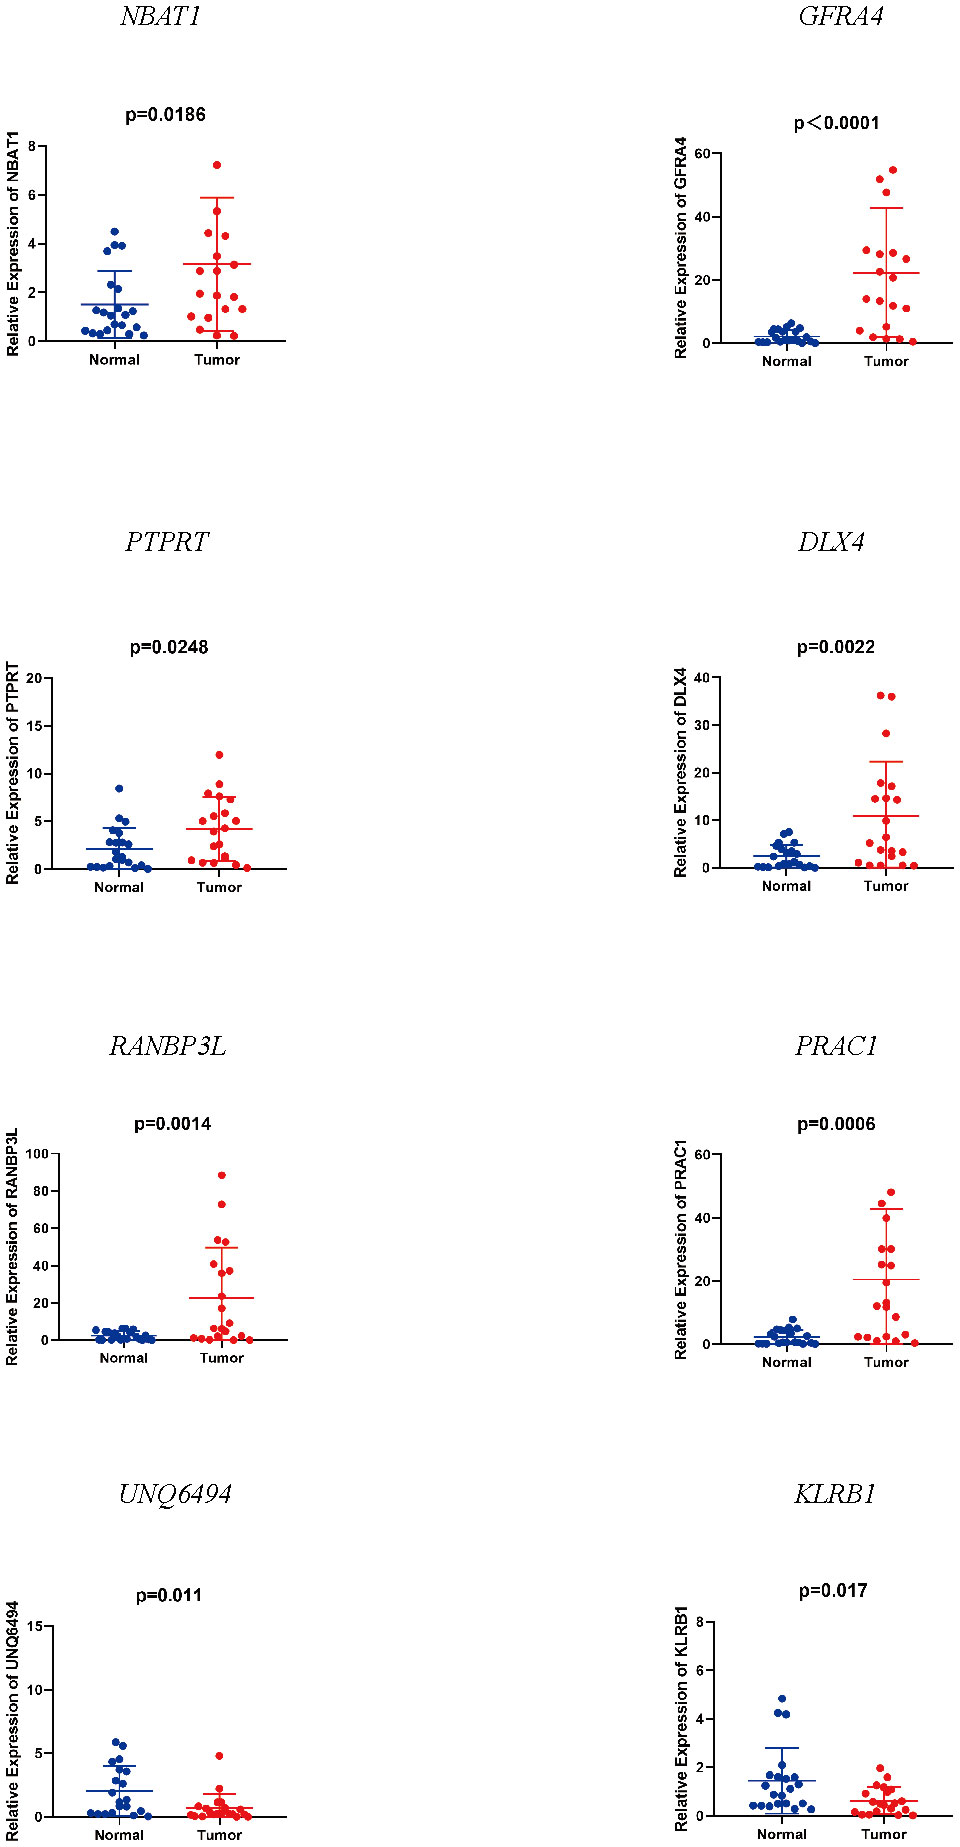
We detected notable changes in the expressions of eight mRNAs from 20 EC tissues and 20 normal endometrial tissues by qRT-PCR. We performed the unpaired t-test to assess the variation in mRNA expression of the two groups. The results showed that NBAT1, GFRA4, PTPRT, DLX4, RANBP3L, and PRAC1 were up-regulated, whereas UNQ6494 and KLRB1 were down-regulated in EC tissues as compared with that in normal endometrial tissue (Figure 4). The changes verified by qRT-PCR in mRNA expression levels in the 20 patients with EC were identical to the predicted changes obtained from bioinformatics analysis, confirming the significance and accuracy of these results.
3.4. Construction of an eight-mRNA signature to forecast patient prognosis
We linearly integrated the expression values of the selected genes and the values of these genes weighted by the coefficients obtained from the multivariate Cox regression analysis. We derived the following formula to evaluate the prognosis: Risk parameters = 0.0127 × expression of NBAT1 + 0.0005 × expression of GFRA4 + 0.0003 × expression of PTPRT + 0.0014 × expression of DLX4 + 0.0108 × expression of RANBP3L + 0.0058 × expression of PRAC1 − 0.0296 × expression of UNQ6494 − 0.0035 × expression of KLRB1. We computed the parameters in all patients and assigned hazard parameters to them. We ranked the patients in ascending order according to the parameters and used the median to divide them into high- and low-risk subgroups (Figure 5A). The life span of each patient is shown in Figure 5B. The mortality rate in patients in the high-risk parameter group was higher, whereas the survival rate in patients in the low-risk parameter group was better. Furthermore, the heat map shows the expression profiles of eight mRNAs (Figure 5C). The expression levels of risky-type mRNAs (NBAT1, GFRA4, PTPRT, DLX4, RANBP3L, and PRAC1) were higher in the high-risk group than in the low-risk group. In comparison, The expression levels of protective-type mRNA (UNQ6494 and KLRB1) were lower in the high-risk group than in the low-risk group.
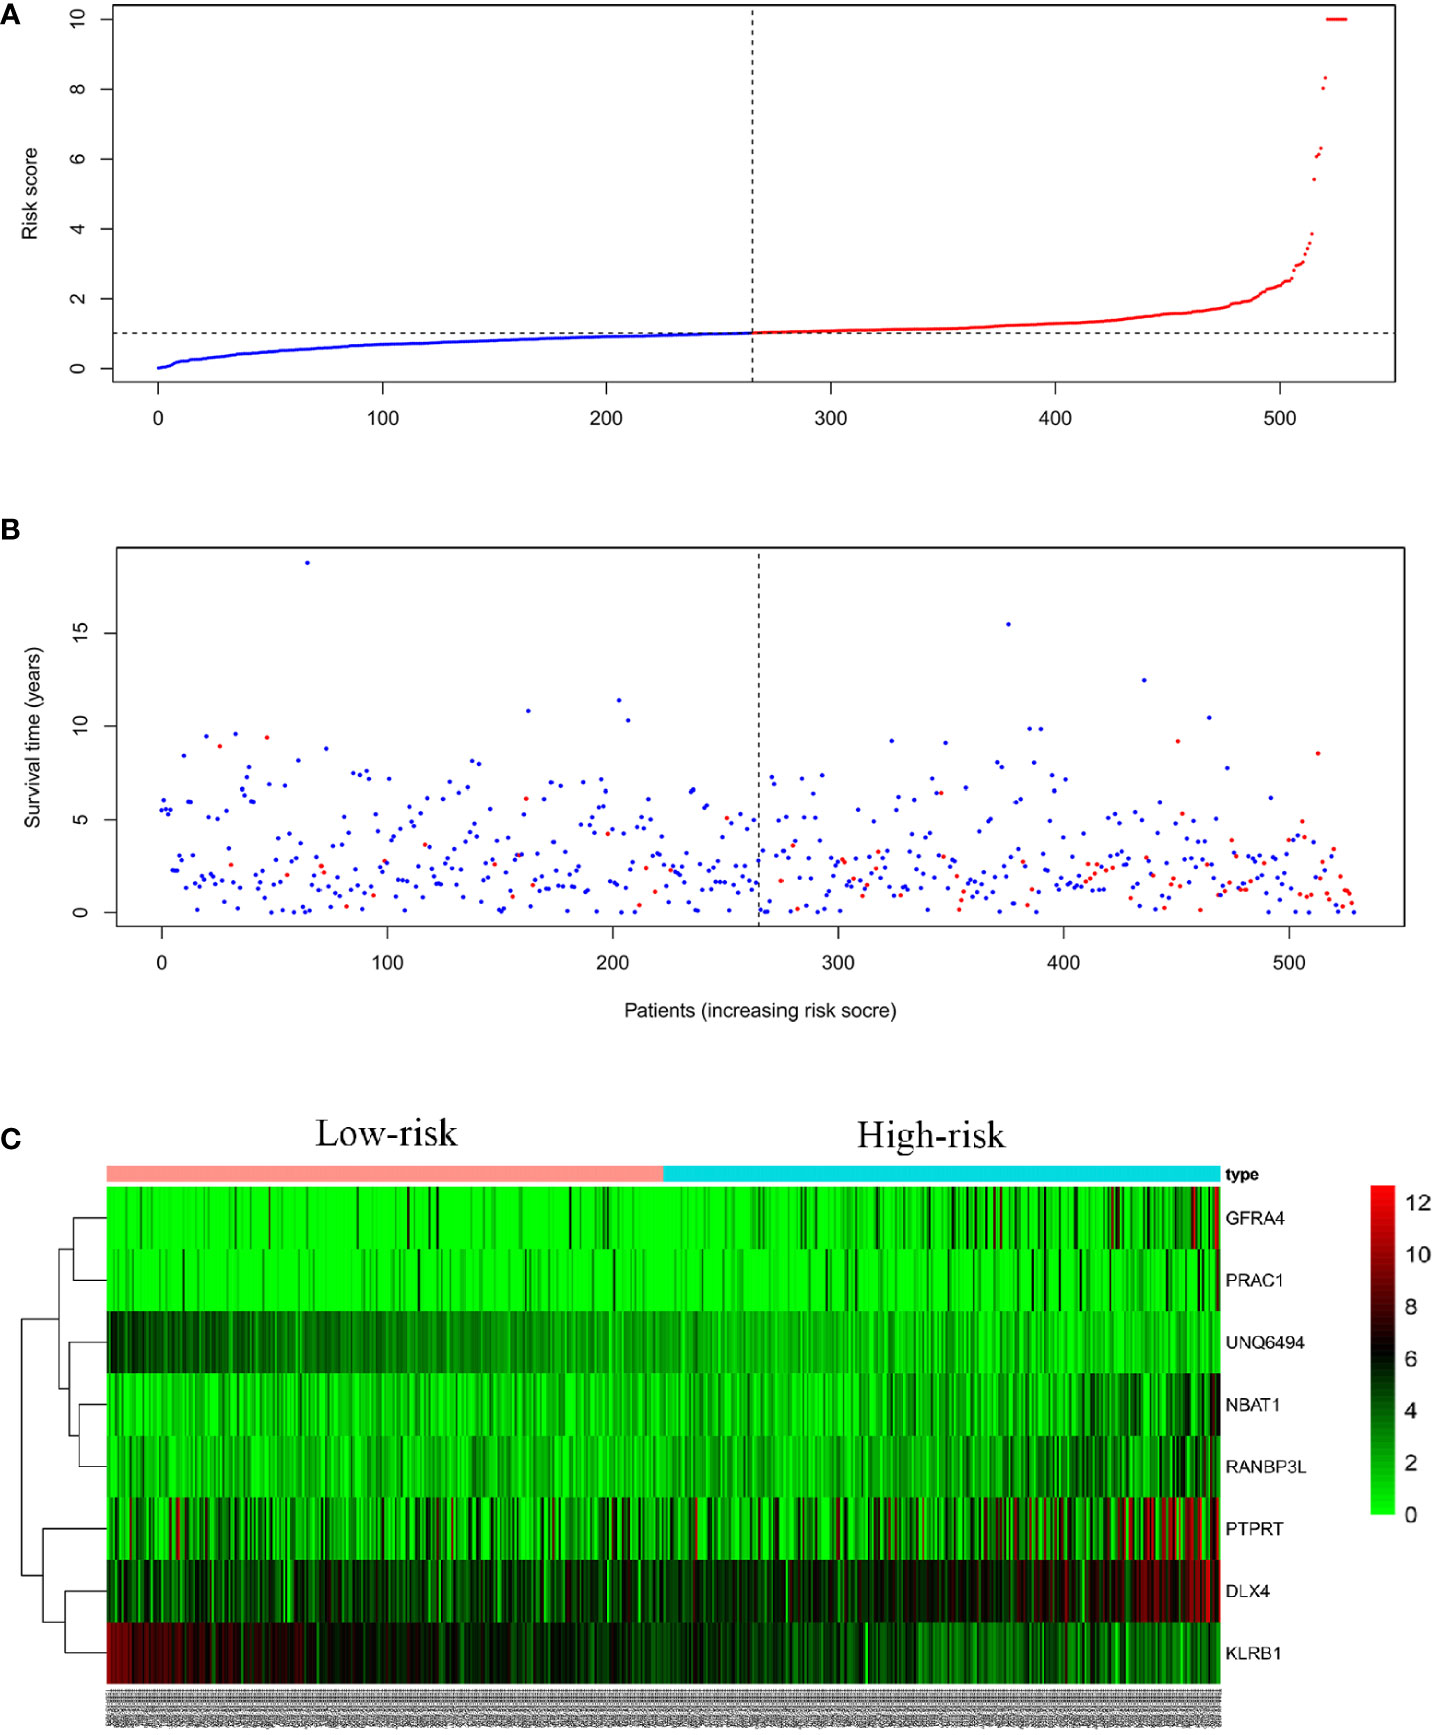
Figure 5 Eight mRNA signatures related to riskScore predict OS in endometrial cancer patients (A) Distribution of mRNA riskScore for each patient (the red line represents high risk, the blue line represents low risk) (B) Survival time (years) of EC patients in ascending order of riskScore (the red dots represent dead patients, the blue dots represent surviving patients) (C) A heatmap of eight genes expression profile.
3.5. Risk parameters obtained from the eight-mRNA signature as single-handed prognostic indicators
We compared the prognostic significance of the risk parameters and clinicopathological parameters using univariate and multivariate analyses (Table 1). Specimens with good clinical data were chosen for the analysis. The median age of the 528 patients with EC was 66 years. The median BMI of the 500 patients with EC was 28. Of the 530 patients, 60 (11.3%) had new events during the follow-up period and 47 (8.9%) were treated with radiation therapy. Of the 440 patients, 75 (17.0%) had residual tumors. Of the 494 patients, 76 (15.4%) had a tumor in neoplasm cancer status. Of the 457 patients, 43 (9.4%) had tumor invasion. Of the 401 patients, 57 (14.2%) had a tumor in peritoneal wash. Of the 530 patients, 216 (40.8%) had grade 1-2 tumors, and the remaining 314 (59.2%) had grade 3-4 tumors. In addition, among these patients, 381 (71.9%) were in stage I-II, and 149 (28.1%) were in stage III–IV. Based on the above data, we used the risk score, age, neoplasm cancer status, stage, grade, residual tumor, new tumor events, and percent tumor invasion as single-handed prognostic symbols, because these factors showed noticeable discrepancies in univariate and multivariate analyses (Table 3). Notably, the risk score showed a significant prognostic value (P < 0.05) (HR = 1.054).
3.6. K–M survival estimation to verify eight-mRNA signatures for prognosis prediction
Survival estimates of K-M and logarithmic tests showed that patients in the high-risk group had a poorer prognosis (Figure 6A). Univariate Cox regression analysis of OS identified some clinicopathological parameters that could predict EC survival, such as age, grade, stage, residual tumor, new event, neoplasm cancer status, BMI, radiation therapy, peritoneal wash, and percentage of tumor invasion. We then used K–M survival assessment to verify the conclusions obtained. These conclusions gave identical results for patients above 66 years old, with G3-4 tumors, stage III–IV disease, neoplasm cancer status, tumor recurrence (new event), tumor invasion, and with poor prognosis of residual tumor (Figure 6B). Concurrently, based on the results of the multivariate model, a nomogram was constructed that combined clinical parameters. Based on established prognostic factors, it could provide a clinically useful quantitative method for predicting the probability of survival at 1, 3, and 5 years in patients with EC (Figure 7A). The analysis of the ROC curve showed the prediction accuracy of the nomogram in the test and validation cohorts (1-, 3-, and 5-year AUC) (Figure 7B). These results proved the accuracy of the analysis.
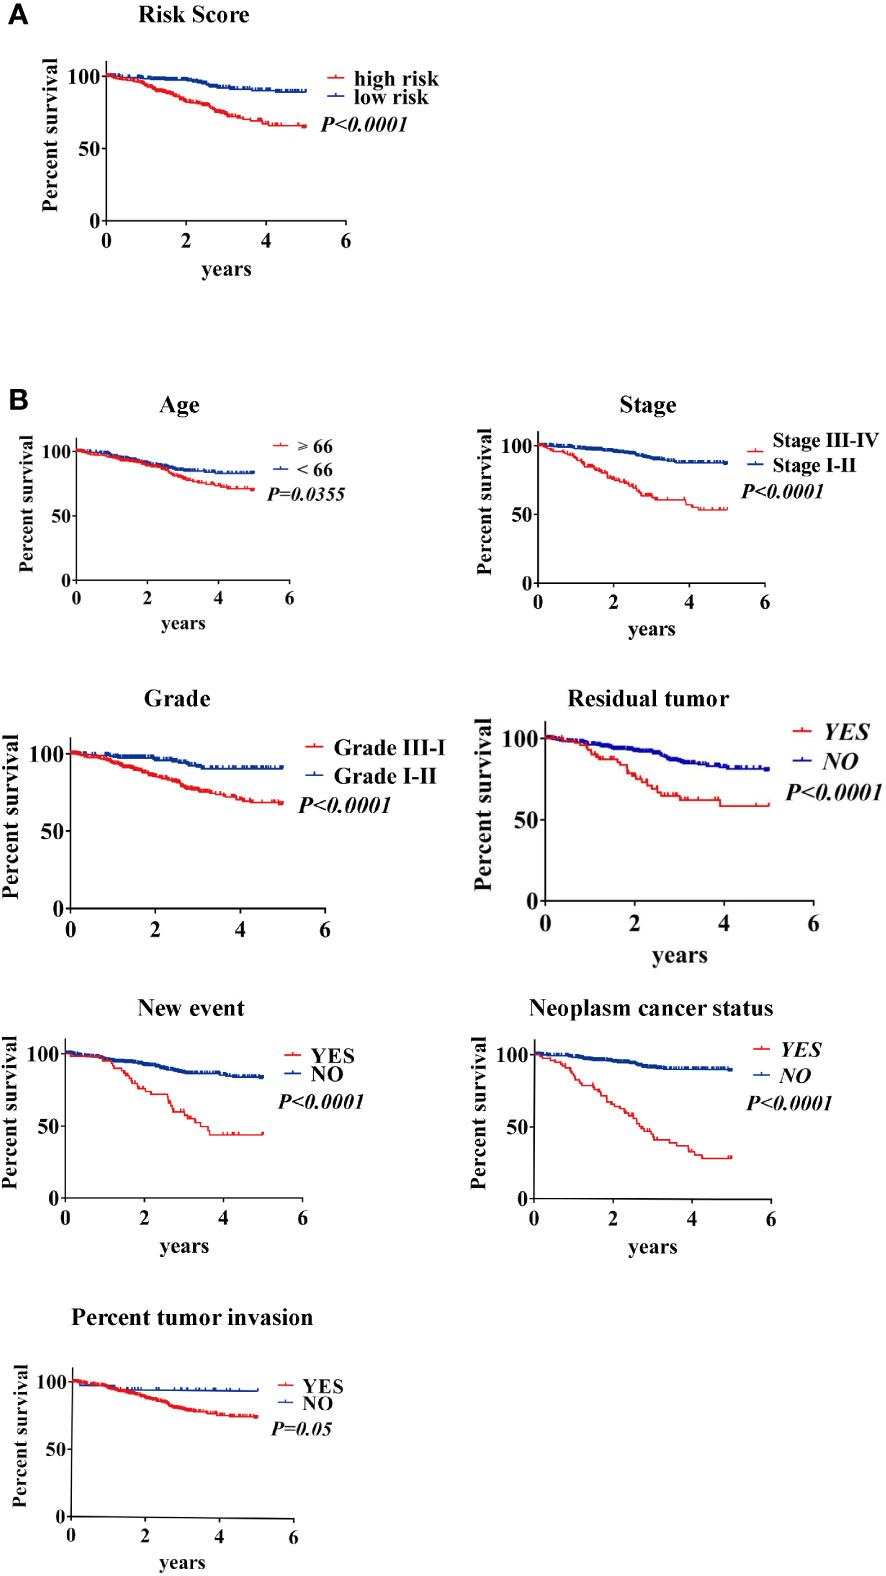
Figure 6 Kaplan–Meier survival analysis of EC patients in the TCGA data set (A) K–M survival curve of high/low-risk EC patients (B) Clinical features, including age, stage, grade, residual tumor, new event, neoplasm cancer status, and percent tumor invasion, predict patient survival.
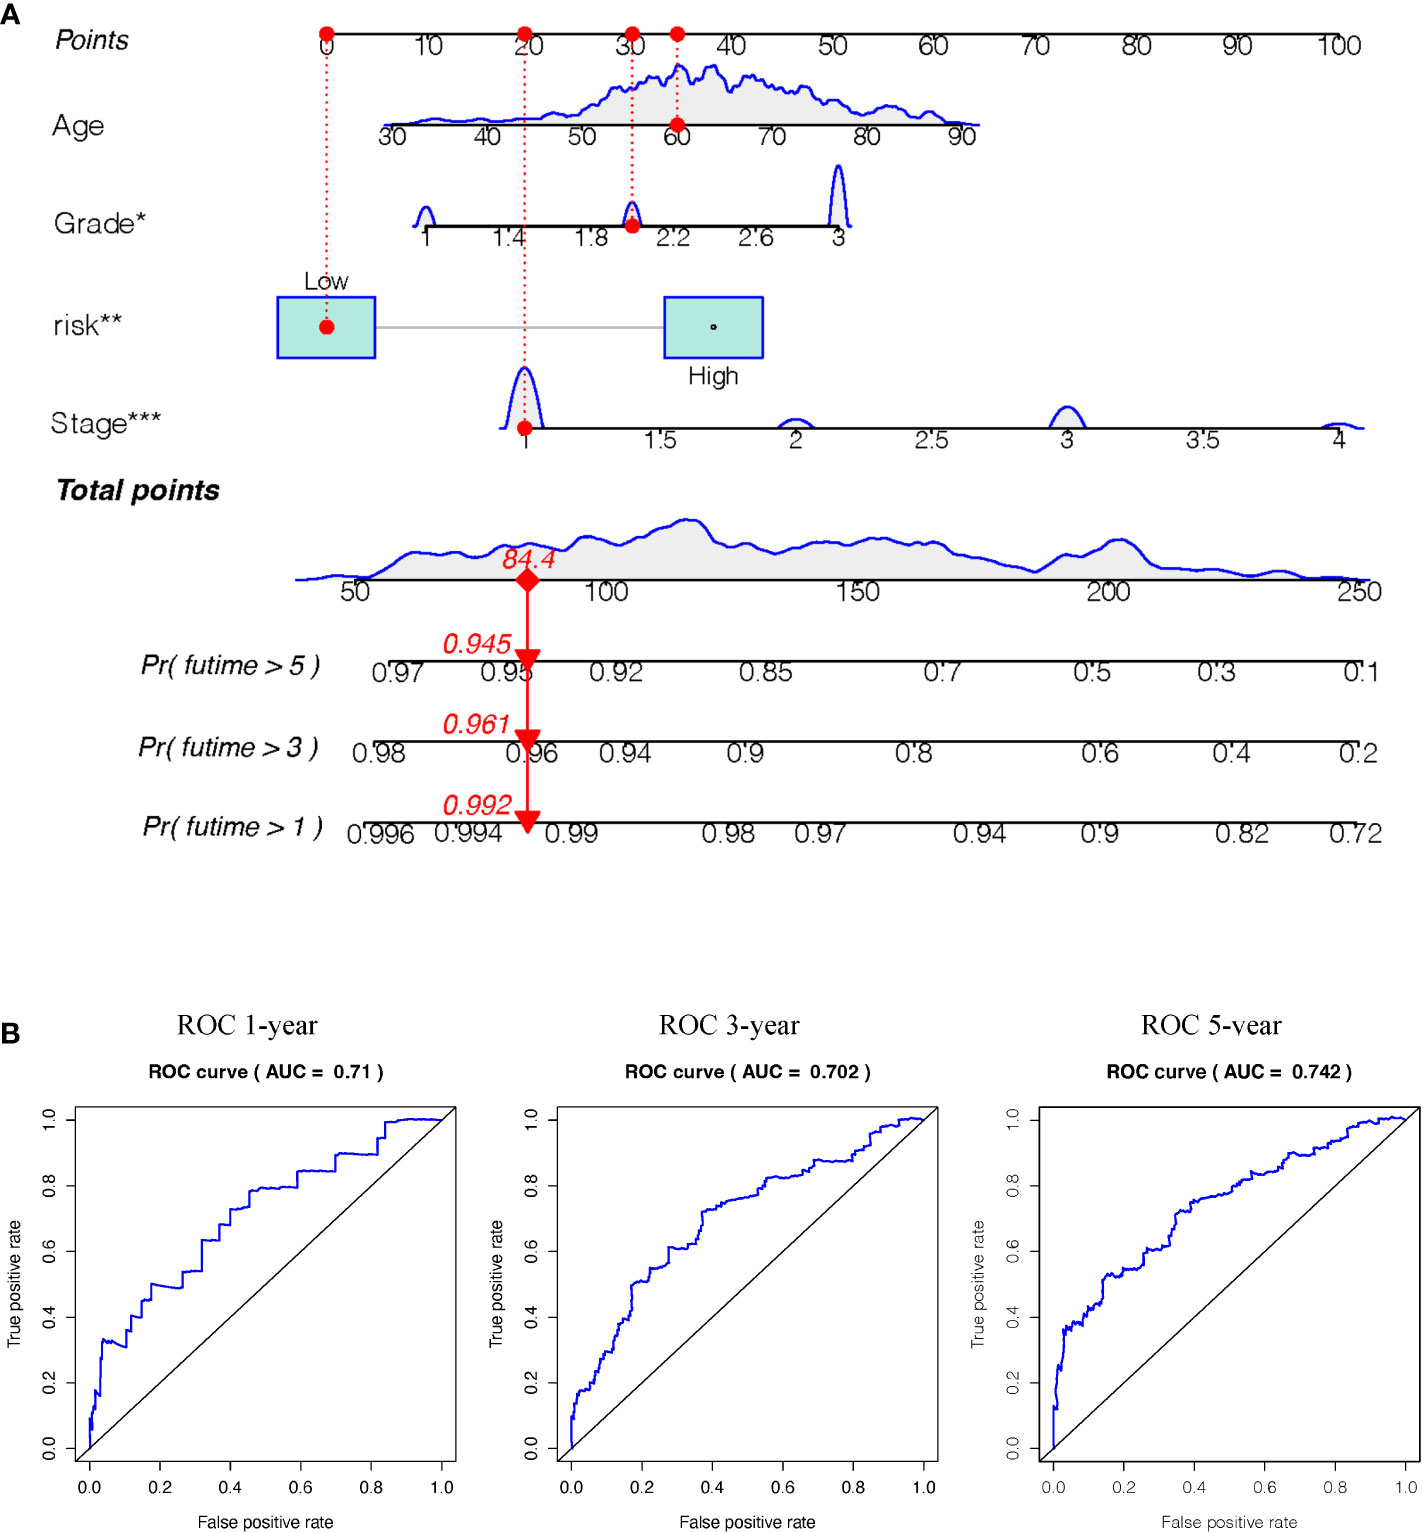
Figure 7 (A) Nomogram (for OS) that integrated the clinicopathologic risk factors. To calculate the probability of status, the points identified on the scale for all the variables are summed up and a vertical line was drawn from the total points scale to the probability scale.(Stage: 1 means FIGO stage1, 2means FIGO stage2, 3 means FIGO stage3, 4 means FIGO stage4. Grade: 1 means well-differentiated, 2 means moderately differentiated, 3 means poorly differentiated) (B) ROC curves showing the predictive accuracy (1-, 3-, 5-year AUC) of the nomogram for OS in testing and validation cohorts. (*P<0.05, **P<0.01, ***P<0.001).
3.7. Cellular functional experimental validation of NBAT1
To further verify the roles of the 8 genes in EC, we selected NBAT1, the most representative gene among the 8 genes, according to COX and HR values. The expression of NBAT1 was knocked down in Ishikawa cells and HEC-1A cells, and the knockdown effect of NBAT1 was verified by PCR in Supplementary Table S4. Knockdown of NBAT1 inhibited the proliferation (Figures 8A, B) and invasion (Figure 8C) of ECs. The accuracy of these results was further confirmed by cellular functional experiments, which verified that the expression of NBAT1 was identical to the predicted changes obtained from the bioinformatics analysis.
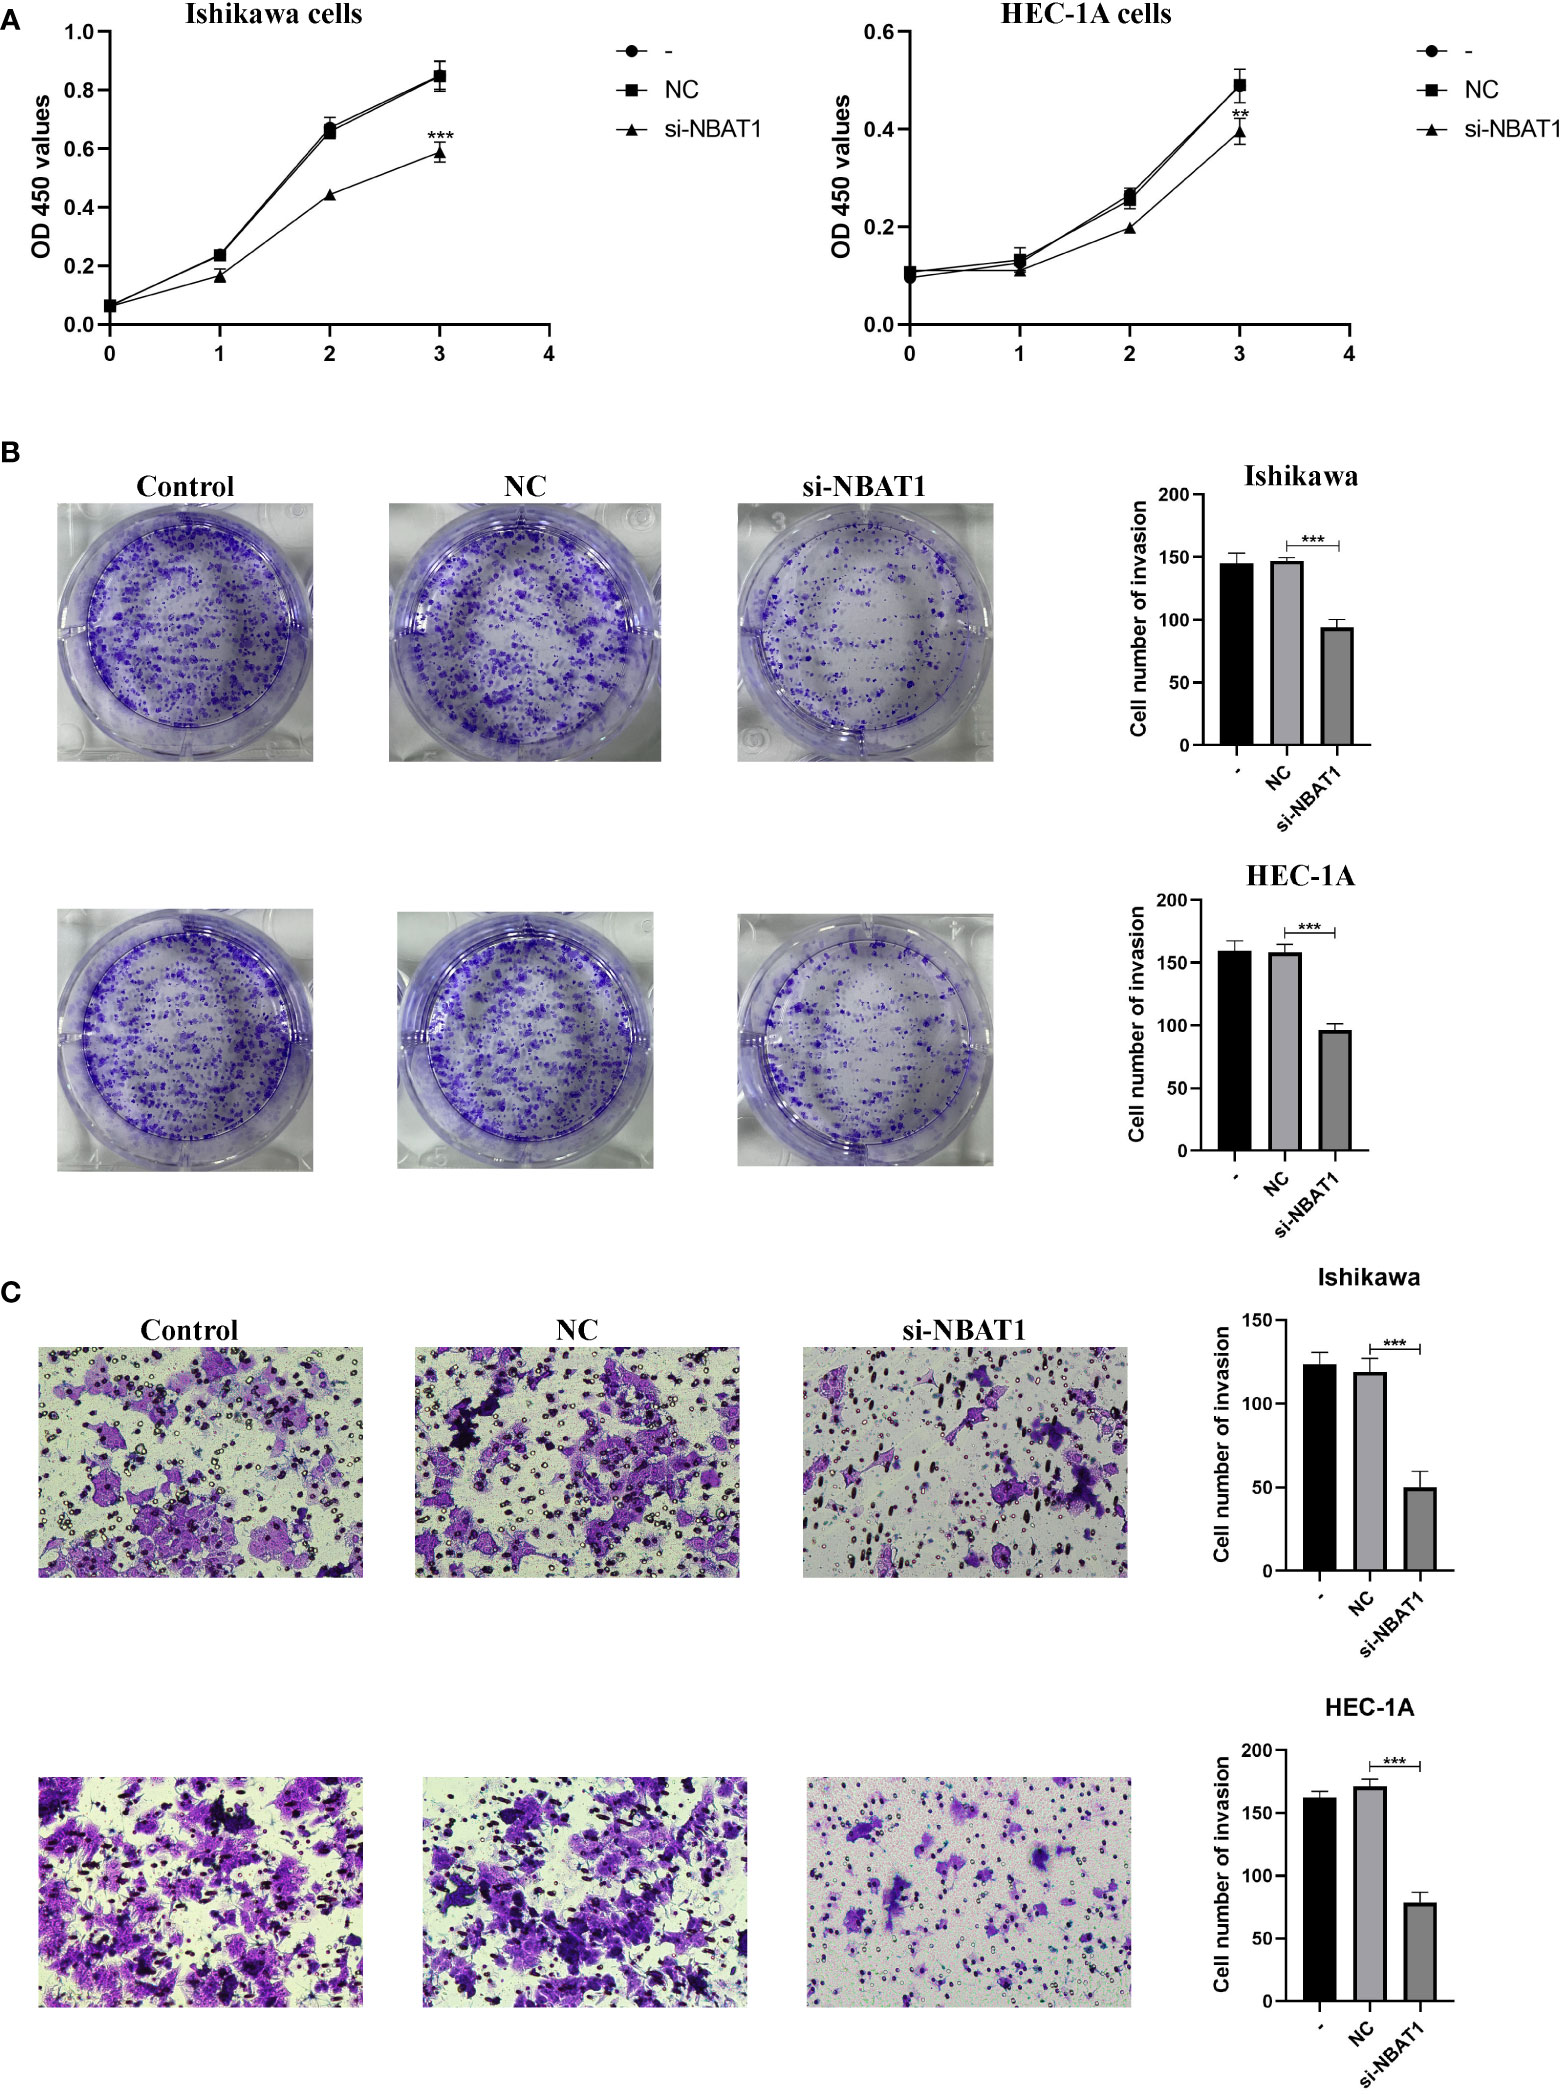
Figure 8 NBAT1 regulates the biological behavior of Ishikawa cell line and HEC-1A cell line. (A, B) CCK-8 and colony formation assays were used to assess the proliferative effect of NBAT1 (C) Effect of NBAT1 on invasion assessed using the Transwell assay. (**P<0.01, ***P<0.001).
4. Discussion
Accurate risk stratification and long-term prognostic prediction are essential for the correct selection of treatment modes for patients with EC. Integrating multiple independent prognostic variables into a single formula can significantly improve the prognostic ability (19). An increasing number of studies have shown that genes can influence tumor progression by regulating the cell cycle, thereby providing candidates for targeted therapy. Therefore, the identification of prognostic EC biomarkers is essential to improve preoperative and postoperative risk assessments and guide treatment decisions. The stratification system for EC is based on a few molecules, mainly clinical and pathological parameters, but this system remains inaccurate. In this study, we constructed and verified ImmuneScore to compare survival rates in patients with EC at different stages to improve their prognosis prediction.
Recently, immune profiling studies have taken a leading position in cancer research. Several studies based on ImmuneScores have been published to describe the immune landscape and provide independent prognostic models for the survival of patients with several types of solid tumors, including gastric and liver cancers (19–21). In addition, previous data have also shown that specific immune cells were closely related to treatment response to therapies (such as chemotherapy and immune-modulating therapies) (22). However, previous studies have established many molecular signatures (including genes, microRNAs, lncRNAs, and epigenetic biomarkers) to predict long-term survival in cancer patients (20, 23, 24). These features have not been widely used in clinical practice due to variability in gene sequencing measurements, inconsistent testing platforms, and the requirement for specialized analysis. In this study, we used ImmuneScore combined with the edgeR algorithm and the LASSO model, as well as the nomogram and ROC curve verification, which might be widely used in clinical practice.
The molecular classification of TCGA is expected to provide additional prognostic information; therefore, it is expected to improve the ESMO-ESGO-ESTRO risk stratification system. Studies conducted in large cohorts of patients, especially those conducted using TCGA (other cohorts), Vancouver, and PORTEC groups (25–29) have verified their prognostic relevance and pointed out that they will benefit from this classification system. In particular, it was reported that 7% of patients diagnosed with cancer with good prognosis (EC Grade 1) but with copy number polymer diagnosis were now classified into the poor prognosis group (27). In contrast, all patients with POLE-hypermutation tumors (6 –13% of all EC tumors) are now considered good prognostic tumors regardless of the status of other prognostic factors (such as histological grade or FIGO stage).
The fast progress of high-throughput gene sequencing technique has laid the basis for large-scale biological data study (30). All the genomic data is screened from a single specimen to distinguish fresh diagnostic, prognostic, or pharmacological biomarkers (31). The combination of biomarkers provides discriminative power higher than molecular tests based on a single marker. Furthermore, as observed in a study by Yang et al., integrating molecular biomarkers with clinicopathological characteristics may be the easiest strategy to develop more sensitive and specific tests (32). In this study, we used ImmuneScore to determine the difference in survival rates in patients with EC at different stages, combined with edgeR to screen out the differential genes, and obtained the best gene combination using the LASSO model.
In recent studies, new prognostic markers of gene expression levels or mutations have been constructed by applying microarray and RNA sequencing data. The Cox proportional hazards regression model was applied to identify and validate these markers (33, 34). In this study, we identified 19 gene combinations using the LASSO model. We chose advanced features to screen for genes associated with sufferer survival forecast, instead of widespread exploration. Univariate and multivariate Cox regression analyses were used to clarify the prognostic significance of these eight-gene combinations in patients with EC. Compared to currently known prognostic evaluation indicators, this selected hazard contour may be a better targeted approach and a more powerful prognostic evaluation to predict positive clinical results.
Tumor immunotherapy is now receiving more and more attention and is recognized as a new and effective method for cancer treatment, and good clinical responses have been observed in some relapsed and refractory cases (35–37). Immune checkpoint inhibitors (ICIs), cancer vaccines, adoptive cell transfer (ACT), and lymphocyte-promoting cytokines are the main immunotherapy approaches, while immunotherapy targeting different EC subtypes (especially POLE and MSI-H) has also gradually attracted attention (38). As endometrial cancer pathogenesis is further elucidated, more and more evidence shows that a large number of immune cells and cytokines can be seen in endometrial cancer tissue, which can stimulate endogenous antitumor immune responses. Compared with other gynecologic malignancies, endometrial cancer is most likely to benefit from immunotherapy (39–41). Certain immune environment signature parameters are often associated with ImmuneScores and can assess prognosis in other cancer types. Therefore, these characteristic parameters can be effective prognostic factors before and after treatment and can be used as predictive immune parameters in planning appropriate interventional treatment (42). The ImmuneScore provides a reliable estimate for predicting the recurrence risk of EC patients.
In this study, bioinformatic methods were applied to discover the characteristics and clinical significance of mRNA hazard factors and to explore a new method to discover potential prognostic markers. We applied the EC dataset in TCGA to screen concerning genes through ImmuneScore, compared the data of different stages using EC tissue specimen data, and classified them using high- and low-risk ImmuneScores. For patients with low-risk parameters, K-M survival estimates showed a beneficial prognosis. We demonstrated the effects of 8 genes on EC prognosis and survival by qRT-PCR experiments and cellular experiments. At the same time, the discovery and calculation of hazard parameters for EC patients has great clinical significance. Due to the lack of data on metastasis and recurrence in EC patients in the TCGA database, one limitation of our study is that we could only apply the OS parameter to evaluate the prognosis in these patients. A second limitation was that all specimens were retrospectively obtained from the TCGA database. Therefore, our results need to be verified in a larger prospective cohort study. Furthermore, in the stratified analysis, the risk parameters in all subgroups could predict the prognosis in EC patients, except for the subgroup aged <66 years. The cause of this discrepancy remains unclear and needs further in-depth research.
Realizing the clinical implementation of biomarkers is another important discussion. Once verified, the biomarker should ideally be transferred to a standardized, economical, simple, and fast analysis platform, and should be prospectively verified in accordance with all regulatory requirements to become an in vitro diagnostic test. However, no relevant genetic markers have been established to predict the prognosis in patients with EC. Using bioinformatics methods, we clarified the genetic characteristics related to ImmuneScore (NBAT1, GFRA4, PTPRT, DLX4, RANBP3L, UNQ6494, KLRB1, and PRAC1), and proved their prognostic value in EC. At the same time, we also made some comparisons with existing literature, such as Jiang et al. (43) and Liu et al. (44). The method we used showed better performance and stability, and ImmuneScore could be used for the prognosis of EC patients, providing reliable estimates, which highlights the good predictive performance of our eight-gene signature.
Recent studies have shown that TME also played a role in tumor occurrence and progression. Discovering latent therapeutic targets that can help shape TME and accelerate the transition of TME from tumor-friendly to tumor-suppressed state has great benefits. Many studies have shown the significance of the immune microenvironment in tumorigenesis. In particular, the rate of immune and stromal compositions in TME is closely related to tumor progression, such as invasion and metastasis (45). These consequences highlight the importance of discovering the interplay between tumor cells and immune cells, which provides new insights for the development of more valid therapy options. The type of immunity may have a significant impact on individualized follow-up and adapted treatment decisions after surgery.
5. Conclusion
We obtained an eight-gene signature risk profile that can predict the prognosis in patients with EC using ImmuneScore, and higher risk parameters were associated with a poor prognosis. This signature can be used as a classification tool in clinical practice. These findings provide the strategy for accurate identification of patients with EC with a poor prognosis.
Data availability statement
The datasets presented in this study can be found in online repositories. The names of the repository/repositories and accession number(s) can be found in the article/Supplementary Material.
Ethics statement
All patients gave informed consent. This study was approved by the Ethics Committee of Shengjing Hospital affiliated with the China Medical University.
Author contributions
JG participated in the design, methodology, data interpretation, and analysis for the work; carried out the statistical analyses; and drafted the manuscript. ZW participated in the methodology, data interpretation, and analysis of the work. BW carried out the statistical analyses. XM designed the study; participated in data interpretation, analysis for the work, and methodology. All authors read and approved the final manuscript.
Funding
This work was supported by the National Natural Science Foundation of China (No. 81872123); Liaoning Revitalization Talents Program (No. XLYC1902003); University innovation team of Liaoning Province; Special Professor of Liaoning Province; “Major Special Construction Plan” for Discipline Construction of China Medical University in 2018 (No. 3110118029); Outstanding Scientific Fund of Shengjing Hospital (No. 201601).
Conflict of interest
The authors declare that the research was conducted in the absence of any commercial or financial relationships that could be construed as a potential conflict of interest.
Publisher’s note
All claims expressed in this article are solely those of the authors and do not necessarily represent those of their affiliated organizations, or those of the publisher, the editors and the reviewers. Any product that may be evaluated in this article, or claim that may be made by its manufacturer, is not guaranteed or endorsed by the publisher.
Supplementary material
The Supplementary Material for this article can be found online at: https://www.frontiersin.org/articles/10.3389/fonc.2023.1097015/full#supplementary-material
Supplementary Figure 1 | (A)Decision Curve Analysis (DCA) of the model (The red line represents the curve of Riskscore) (B) Calibration Curve Analysis(CCA) of the model.
Supplementary Figure 2 | TIMER to assess sample immunity scores.
Supplementary Figure 3 | Relationship between 8 mRNAs and clinicopathologic parameters of endometrial carcinoma.
References
1. Onstad MA, Schmandt RE, Lu KH. Addressing the role of obesity in endometrial cancer risk, prevention, and treatment. J Clin Oncol (2016) 34:4225–30. doi: 10.1200/JCO.2016.69.4638
2. Bray F, Ferlay J, Soerjomataram I, Siegel RL, Torre LA, Jemal A. Global cancer statistics 2018: GLOBOCAN estimates of incidence and mortality worldwide for 36 cancers in 185 countries. CA Cancer J Clin (2018) 68:394–424. doi: 10.3322/caac.21492
3. Trojano G, Olivieri C, Tinelli R, Damiani GR, Pellegrino A, Cicinelli E. Conservative treatment in early stage endometrial cancer: A review. Acta BioMed (2019) 90:405–10. doi: 10.23750/abm.v90i4.7800
4. Rubia EC-de la, Martinez-Garcia E, Dittmar G, Gil-Moreno A, Cabrera S, Colas E. Prognostic biomarkers in endometrial cancer: a systematic review and meta-analysis. J Clin Med (2020) 9:1900. doi: 10.3390/jcm9061900
5. Wood SL, Pernemalm M, Crosbie PA, Whetton AD. The role of the tumor-microenvironment in lung cancer-metastasis and its relationship to potential therapeutic targets. Cancer Treat Rev (2014) 40:558–66. doi: 10.1016/j.ctrv.2013.10.001
6. Quail DF, Joyce JA. Microenvironmental regulation of tumor progression and metastasis. Nat Med (2013) 19:1423–37. doi: 10.1038/nm.3394
7. Bussard KM, Mutkus L, Stumpf K, Gomez-Manzano C, Marini FC. Tumor-associated stromal cells as key contributors to the tumor microenvironment. Breast Cancer Res (2016) 18:84. doi: 10.1186/s13058-016-0740-2
8. Gajewski TF, Schreiber H, Fu YX. Innate and adaptive immune cells in the tumor microenvironment. Nat Immunol (2013) 14:1014–22. doi: 10.1038/ni.2703
9. Chen YL, Ge GJ, Qi C, Wang H, Wang HL, Li LY, et al. A five-gene signature may predict sunitinib sensitivity and serve as prognostic bio- markers for renal cell carcinoma. J Cell Physiol (2018) 233:6649–60. doi: 10.1002/jcp.26441
10. Liu J, Jiang P, Chen X, Shen Y, Cui G, Ma Z, et al. Construction of a nine DNA repair-related gene prognostic classifier to predict prognosis in patients with endometrial carcinoma. BMC Cancer (2021) 21:29. doi: 10.1186/s12885-020-07712-5
11. Li X, Yin F, Fan Y, Cheng Y, Dong Y, Zhou J, et al. Establishment and validation of a prognostic nomogram based on a novel five-DNA methylation signature for survival in endometrial cancer patients. Cancer Med (2020) 10:693–708. doi: 10.1002/cam4.3576
12. Willvonseder B, Stögbauer F, Steiger K, Jesinghaus M, Kuhn PH, Brambs C, et al. The immunologic tumor microenvironment in endometrioid endometrial cancer in the morphomolecular context: mutual correlations and prognostic impact depending on molecular alterations. Cancer Immunol Immunother (2020) 70:1679–89. doi: 10.1007/s00262-020-02813-3
13. Costas L, Palomero L, Benavente Y, Guardiola M, Frias-Gomez J, Pavon MA, et al. Defining a mutational signature for endometrial cancer screening and early detection. Cancer Epidemiol (2019) 61:129–32. doi: 10.1016/j.canep.2019.06.003
14. Cassetta L, Fragkogianni S, Sims AH, Swierczak A, Forrester LM, Zhang H, et al. Human tumor-associated macrophage and monocyte transcriptional landscapes reveal cancer-specific reprogramming, biomarkers, and therapeutic targets. Cancer Cell (2019) 35:588–602. doi: 10.1016/j.ccell.2019.02.009
15. Na KJ, Choi H, Oh HR, Kim YH, Lee SB, Jung YJ, et al. Reciprocal change in glucose metabolism of cancer and immune cells mediated by different glucose transporters predicts immunotherapy response. Theranostics (2020) 10:9579–90. doi: 10.7150/thno.48954
16. The Cancer Genome Atlas. (2019). Available at: https://tcga-data.nci.nih.gov/tcga/ (Accessed 14 Feb).
17. Kamarudin AN, Cox T, Kolamunnage-Dona R. Time-dependent ROC curve analysis in medical research: current methods and applications. BMC Med Res Methodol (2017) 17:53. doi: 10.1186/s12874-017-0332-6
18. Gondo OT, Hamada R, Gondo T. Nomogram as predictive model in clinical practice. Gan To Kagaku Ryoho (2009) 36:901–6.
19. Jiang Y, Zhang Q, Hu Y, Li T, Yu J, Zhao L, et al. Immunoscore signature: a prognostic and predictive tool in gastric cancer. Ann Surg (2018) 267:504–13. doi: 10.1097/SLA.0000000000002116
20. Shimada S, Mogushi K, Akiyama Y, Furuyama T, Watanbe S, Ogura T, et al. Comprehensive molecular and immunological characterization of hepatocellular carcinoma. EBioMedicine (2019) 40:457–70. doi: 10.1016/j.ebiom.2018.12.058
21. Jiang Y, Xie J, Han Z, Liu W, Xi S, Huang L, et al. Immunomarker support vector machine classifier for prediction of gastric cancer survival and adjuvant chemotherapeutic benefit. Clin Cancer Res (2018) 24:5574–84. doi: 10.1158/1078-0432.CCR-18-0848
22. Bense RD, Sotiriou C, Piccart-Gebhart MJ, Haanen JBAG, van Vugt MATM, de Vries GE, et al. Relevance of tumor-infiltrating immune cell composition and functionality for disease outcome in breast cancer. J Natl Cancer Inst (2017) 109:192. doi: 10.1093/jnci/djw192
23. Lin DC, Mayakonda A, Dinh HQ, Huang P, Lin L, Liu X, et al. Genomic and epigenomic heterogeneity of hepatocellular carcinoma. Cancer Res (2017) 77:2255–65. doi: 10.1158/0008-5472.CAN-16-2822
24. Erstad DJ, Fuchs BC, Tanabe KK. Molecular signatures in hepatocellular carcinoma: a step toward rationally designed cancer therapy. Cancer (2018) 124:3084–104. doi: 10.1002/cncr.31257
25. Talhouk A, McConechy MK, Leung S, Li-Chang HH, Kwon JS, Melnyk N, et al. A clinically applicable molecular-based classification for endometrial cancers. Br J Cancer (2015) 113:299–310. doi: 10.1038/bjc.2015.190
26. Talhouk A, McConechy MK, Leung S, Yang W, Lum A, Senz J, et al. Confirmation of ProMisE: A simple, genomics-based clinical classifier for endometrial cancer. Cancer (2017) 123:802–13. doi: 10.1002/cncr.30496
27. Cancer Genome Atlas Research Network, Kandoth C, Schultz N, Cherniack AD, Akbani R, Liu Y, et al. Integrated genomic characterization of endometrial carcinoma. Nature (2013) 497:67–73. doi: 10.1038/nature12113
28. Stelloo E, Nout RA, Osse EM, Jürgenliemk-Schulz IJ, Jobsen JJ, Lutgens LC, et al. Improved risk assessment by integrating molecular and clinicopathological factors in early-stage endometrial cancer-combined analysis of the PORTEC cohorts. Clin Cancer Res (2016) 22:4215–24. doi: 10.1158/1078-0432.CCR-15-2878
29. Kommoss S, McConechy MK, Kommoss F, Leung S, Bunz A, Magrill J, et al. Final validation of the ProMisE molecular classifier for endometrial carcinoma in a large population-based case series. Ann Oncol (2018) 29:1180–8. doi: 10.1093/annonc/mdy058
30. Peng PL, Zhou XY, Yi GD, Chen PF, Wang F, Dong WG. Identification of a novel gene pairs signature in the prognosis of gastric cancer. Cancer Med (2018) 7:344–50. doi: 10.1002/cam4.1303
31. Subramanian J, Simon R. What should physicians look for in evaluating prognostic gene-signatures? Nat Rev Clin Oncol (2010) 7:327–34. doi: 10.1038/nrclinonc.2010.60
32. Yang JY, Werner HMJ, Li J, Westin SN, Lu Y, Halle MK, et al. Integrative protein-based prognostic model for early-stage endometrioid endometrial cancer. Clin Cancer Res (2016) 22:513–23. doi: 10.1158/1078-0432.CCR-15-0104
33. Shen S, Bai J, Wei Y, Wang G, Li Q, Zhang R, et al. A seven-gene prognostic signature for rapid determination of head and neck squamous cell carcinoma survival. Oncol Rep (2017) 38:3403–11. doi: 10.3892/or.2017.6057
34. Zhao Y, Varn FS, Cai G, Xiao F, Amos CI, Cheng C. A P53-deficiency gene signature predicts recurrence risk of patients with early-stage lung adenocarcinoma. Cancer Epidemiol Biomarkers Prev (2018) 27:86–95. doi: 10.1158/1055-9965.EPI-17-0478
35. Wolchok J, Chiarion-Sileni V, Gonzalez R, Rutkowski P, Grob J, Cowey C, et al. Overall survival with combined nivolumab and ipilimumab in advanced melanoma. N Engl J Med (2017) 14:1345–56. doi: 10.1056/NEJMoa1709684
36. Motzer R, Tannir N, McDermott D, Aren Frontera O, Melichar B, Choueiri T, et al. Nivolumab plus ipilimumab versus sunitinib in advanced renal-cell carcinoma. N Engl J Med (2018) 14:1277–90. doi: 10.1056/NEJMoa1712126
37. Maude S, Laetsch T, Buechner J, Rives S, Boyer M, Bittencourt H, et al. Tisagenlecleucel in children and young adults with b-cell lymphoblastic leukemia. N Engl J Med (2018) 5:439–48. doi: 10.1056/NEJMoa1709866
38. Cao W, Ma X, Fischer JV, Sun CG, Kong BH, Zhang Q. Immunotherapy in endometrial cancer: rationale, practice and perspectives. Biomark Res (2021) 9:49. doi: 10.1186/s40364-021-00301-z
39. Di Tucci C, Capone C, Galati G, Lacobelli V, Schiavi MC, Di Donato V, et al. Immunotherapy in endometrial cancer: new scenarios on the horizon. J Gynecol Oncol (2019) 3:e46. doi: 10.3802/jgo.2019.30.e46
40. Nishio H, Iwata T, Aoki D. Current status of cancer immunotherapy for gynecologic malignancies. Jpn J Clin Oncol (2021) 2:167–72. doi: 10.1093/jjco/hyaa214
41. Di Tucci C, Schiavi MC, Faiano P, D'Oria O, Prata G, Sciuga V, et al. Therapeutic vaccines and immune checkpoints inhibition options for gynecological cancers. Crit Rev Oncol Hematol (2018) 128:30–42. doi: 10.1016/j.critrevonc.2018.05.011
42. Bruni D, Angell HK, Galon J. The immune contexture and immunoscore in cancer prognosis and therapeutic efficacy. Nat Rev Cancer (2020) 11:662–80. doi: 10.1038/s41568-020-0285-7
43. Jiang PP, Sun W, Shen NM, Huang XH, Fu SL. Identification of a metabolism-related gene expression prognostic model in endometrial carcinoma patients. BMC Cancer (2020) 20:864. doi: 10.1186/s12885-020-07345-8
44. Liu L, Lin JJ, He HY. Identification of potential crucial genes associated with the pathogenesis and prognosis of endometrial cancer. Front Genet (2019) 10:373. doi: 10.3389/fgene.2019.00373
Keywords: endometrial cancer, the cancer genome atlas, immunescore, prognosis, survival
Citation: Gu J, Wang Z, Wang BO and Ma X (2023) ImmuneScore of eight-gene signature predicts prognosis and survival in patients with endometrial cancer. Front. Oncol. 13:1097015. doi: 10.3389/fonc.2023.1097015
Received: 13 November 2022; Accepted: 16 February 2023;
Published: 03 March 2023.
Edited by:
Tonya J. Webb, University of Maryland, United StatesReviewed by:
Pengming Sun, Fujian Medical University, ChinaZheng Wang, Shanghai Jiao Tong University, China
Copyright © 2023 Gu, Wang, Wang and Ma. This is an open-access article distributed under the terms of the Creative Commons Attribution License (CC BY). The use, distribution or reproduction in other forums is permitted, provided the original author(s) and the copyright owner(s) are credited and that the original publication in this journal is cited, in accordance with accepted academic practice. No use, distribution or reproduction is permitted which does not comply with these terms.
*Correspondence: Xiaoxin Ma, bWF4aWFveGluNjY2QGFsaXl1bi5jb20=
 Jiahui Gu
 Zihao Wang
 B. O. Wang
 Xiaoxin Ma