
94% of researchers rate our articles as excellent or good
Learn more about the work of our research integrity team to safeguard the quality of each article we publish.
Find out more
MINI REVIEW article
Front. Oncol., 17 March 2023
Sec. Cancer Molecular Targets and Therapeutics
Volume 13 - 2023 | https://doi.org/10.3389/fonc.2023.1077461
This article is part of the Research TopicCNS Tumor Metabolism: Targets, Markers, and ChallengesView all 6 articles
 David O. Kamson1,2*Viveka Chinnasamy1Stuart A. Grossman1Chetan Bettegowda3Peter B. Barker4,5Peter W. Stacpoole6Georg Oeltzschner4,5*
The adverse effects of lactic acidosis in the cancer microenvironment have been increasingly recognized. Dichloroacetate (DCA) is an orally bioavailable, blood brain barrier penetrable drug that has been extensively studied in the treatment of mitochondrial neurologic conditions to reduce lactate production. Due to its effect reversing aerobic glycolysis (i.e., Warburg-effect) and thus lactic acidosis, DCA became a drug of interest in cancer as well. Magnetic resonance spectroscopy (MRS) is a well-established, non-invasive technique that allows detection of prominent metabolic changes, such as shifts in lactate or glutamate levels. Thus, MRS is a potential radiographic biomarker to allow spatial and temporal mapping of DCA treatment. In this systematic literature review, we gathered the available evidence on the use of various MRS techniques to track metabolic changes after DCA administration in neurologic and oncologic disorders. We included in vitro, animal, and human studies. Evidence confirms that DCA has substantial effects on lactate and glutamate levels in neurologic and oncologic disease, which are detectable by both experimental and routine clinical MRS approaches. Data from mitochondrial diseases show slower lactate changes in the central nervous system (CNS) that correlate better with clinical function compared to blood. This difference is most striking in focal impairments of lactate metabolism suggesting that MRS might provide data not captured by solely monitoring blood. In summary, our findings corroborate the feasibility of MRS as a pharmacokinetic/pharmacodynamic biomarker of DCA delivery in the CNS, that is ready to be integrated into currently ongoing and future human clinical trials using DCA.
The precision oncology era catalyzed enormous increases in tissue-based predictive biomarkers. Yet, the lagging development of non-invasive biomarkers remains a challenge in cancers where tissue access is limited, such as in the central nervous system (CNS). Advanced imaging may help overcome these issues by providing pharmacokinetic and/or pharmacodynamic information. Additionally, spatial mapping of drug delivery may allow customization of localized therapies to treat regions with inadequate drug accumulation and enhance our understanding of how drug resistance emerges in space and time.
Uncovering the molecular mechanisms of the Warburg effect (aerobic glycolysis) – the commonly observed shift cancer cells undergo towards glycolytic ATP production – reignited research in the early 2000s (1) into the pharmacological metabolic reprogramming of cancer cell metabolism as a potential therapeutic approach. A salient feature of Warburg metabolism in tumors is the increased expression of one or more of four isoforms of pyruvate dehydrogenase kinase (PDK 1-4) that reversibly phosphorylate and thus inhibit the mitochondrial pyruvate dehydrogenase complex (PDC), which catalyzes the rate-limiting oxidation of glycolytically-derived pyruvate to acetyl coenzyme A (Figure 1A). Because cytoplasmic pyruvate and lactate are in equilibrium, inhibition of PDC also results in intracellular accumulation of lactate. Upregulation of PDK and consequent elevation of lactate levels play a major role in the glycolytic reprogramming seen in the cancer microenvironment (2) that is associated with decreased apoptotic function (3), invasive phenotypes (4, 5), decreased antitumor immunity (6) and shorter survival in animal models (7) and patients with various cancers (8, 9).
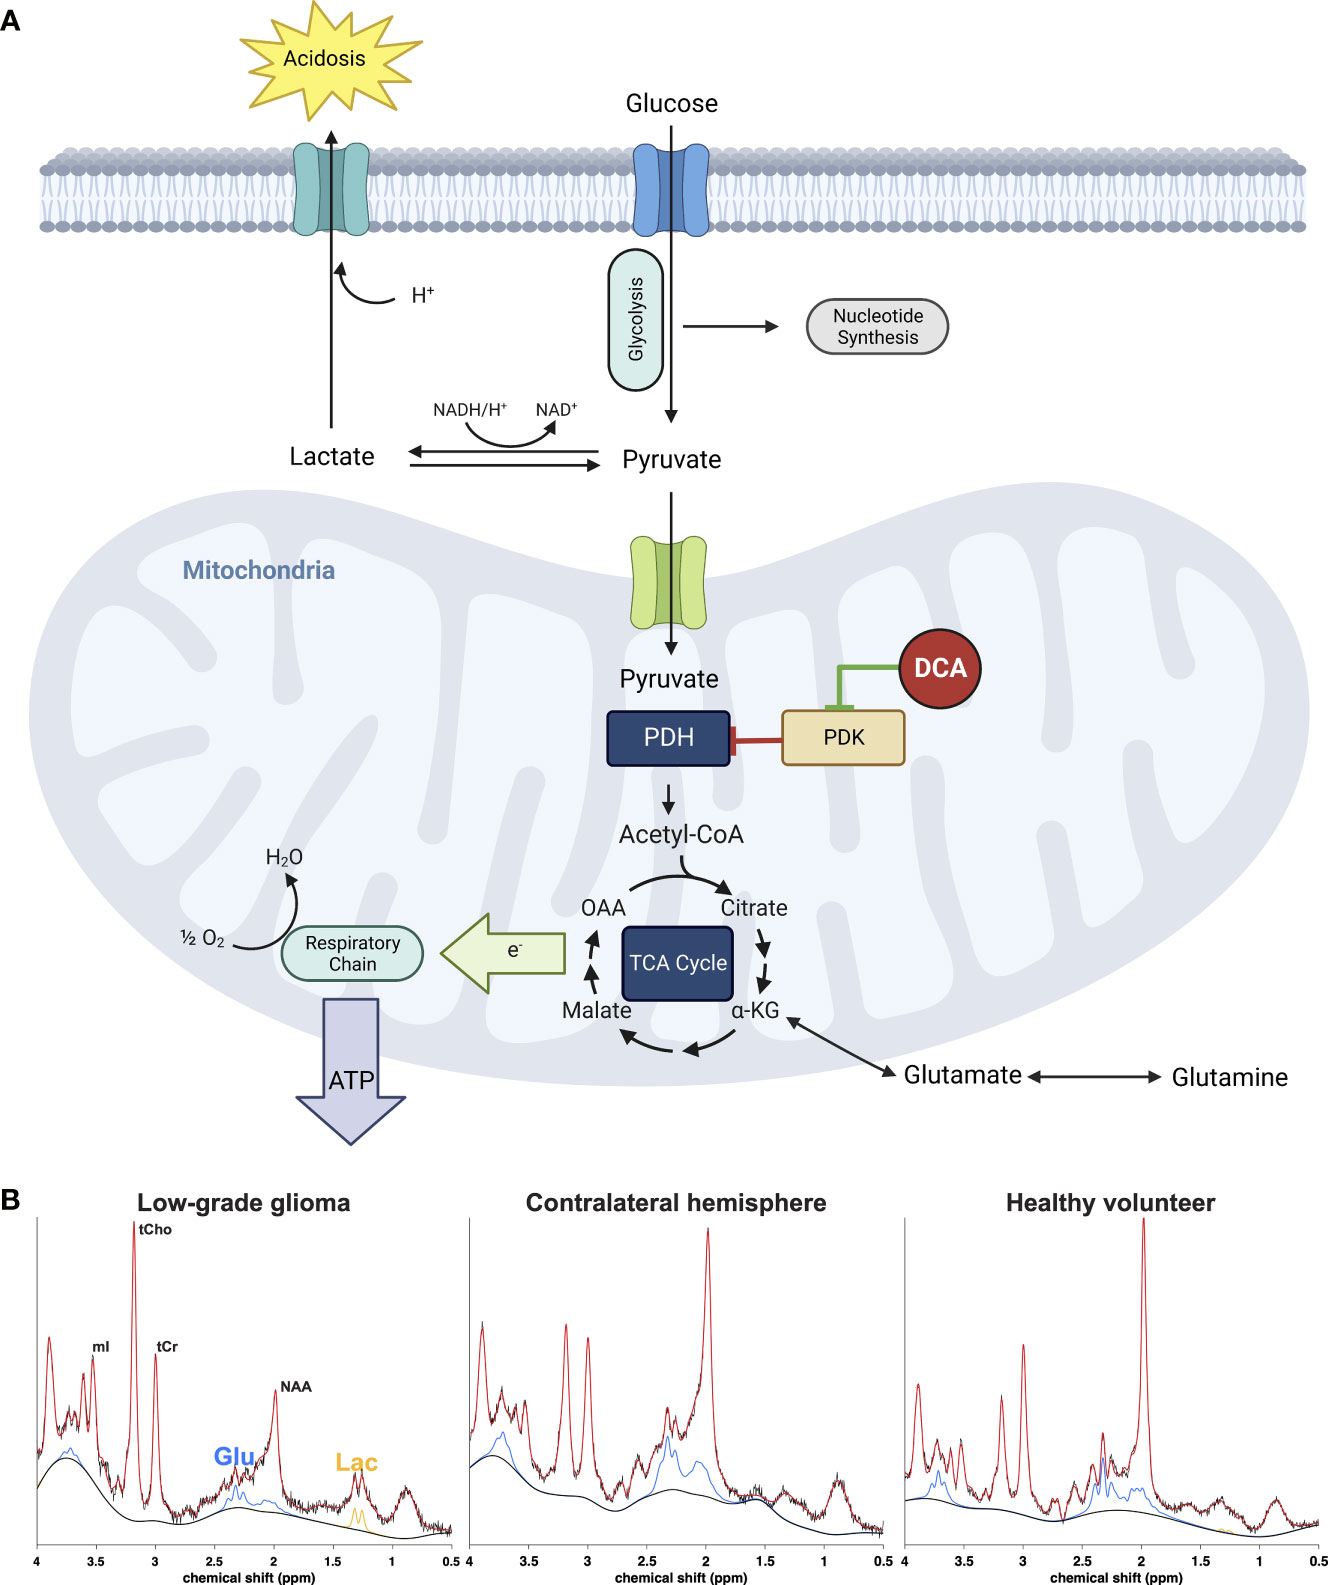
Figure 1 (A) Effect of DCA on metabolic pathways of cancer cells. Inhibition of the pyruvate dehydrogenase (PDH) complex by pyruvate dehydrogenase kinase (PDK) is responsible for the aerobic glycolysis observed in cancer, also known as the Warburg phenomenon. Accumulation of cytosolic pyruvate is converted to lactate which contributes to the acidification of the extracellular environment or utilized for anabolic processes necessary for cancer cell growth and proliferation. DCA inhibits PDK, activating the PDH complex and thus forcing the cancer cell to allow pyruvate to enter the tricarboxylic acid cycle and eventually terminal oxidation to generate ATP and restore the apoptotic machinery of the mitochondrion. The metabolic consequence is a rapid reduction of extra and intracellular lactate as well as increase of glutamate as the cell no longer has to rely on the latter as an alternative carbon source for the TCA cycle. (B) Representative 1H-MRS spectra from a low-grade glioma (left) normal appearing brain from the same patient (middle) and healthy normal volunteer (right). The signals from glutamate (Glu, blue) and lactate (Lac, orange) can be monitored after DCA administration to assess efficacy of drug delivery.
Here, we review evidence from in vitro, animal, and human studies on the use of magnetic resonance spectroscopy (MRS) to monitor the effects of dichloroacetate in neurologic and oncologic disorders. Additionally, we emphasize how MRS may be applied to enhance neurooncologic investigations and treatment paradigms.
Sodium dichloroacetate is a lipophilic small molecule (151Da) with high oral bioavailability that can readily pass the blood-brain barrier (10). Decades of research have established DCA to be a safe, well-tolerated investigational drug that is now in a phase 3 trial in children with congenital PDC deficiency (NCT02616484) and in a phase 2A trial in adults with recurrent glioblastoma (NCT05120284). As a pan-PDK inhibitor, DCA reverses Warburg metabolism and stimulates oxidative phosphorylation (OXPHOS) and apoptosis in cancer cells (Figure 1A) (11). Through its action on the PDC, DCA is also a potent lactate-lowering agent under many physiological and pathological conditions (12). The fall in tissue or circulating lactate concentration has been used as a biomarker of the PDC’s activation by DCA, including in tumors, in which DCA may also increase glutamate levels. Such metabolic changes could be exploited as a non-invasive, predictive monitor of both DCA’s delivery to tissues and its potential therapeutic efficacy. MRS is a well-established, widely available, non-invasive, radiation-free, and relatively low-cost method that allows spatial and longitudinal mapping of lactate, glutamate and other metabolites in tissue and thus could be a highly practicable method to monitor DCA dynamics in the clinic.
MRS applies the nuclear magnetic resonance effect to collect biochemical information from tissue. Many important biochemicals can be distinguished by characteristic peak patterns generated by chemically distinct nuclei in external magnetic fields. The nuclei most frequently targeted with in-vivo MRS are 31P (phosphorus) and 1H (proton), which give access to important metabolites involved in glycolytic energy generation, e.g., lactate, glutamate, and phosphocreatine (Figure 1B).
Exogenous administration of signal-enhancing isotope-labeled substrates (e.g., [13C]) enables the study of temporal dynamics of metabolism in vivo via tracking downstream metabolites based on their varying isotopic compositions (isotopologues) or configurations (isotopomers). The most commonly used substrate is hyperpolarized ([1-13C]pyruvate), that is converted to [13C]lactate or [13C]bicarbonate, where the lactate-bicarbonate ratio is interpreted as a marker for the imbalance between aerobic glycolysis and oxidative phosphorylation in cancer (13, 14). Another, but less commonly used substrate is hyperpolarized [2-13C]pyruvate, whose carbon label is incorporated into acetyl-CoA allowing a more distal view into the TCA cycle, or fatty acid synthesis that is upregulated in gliomas (15).
MRS is inherently quantitative. Signal amplitudes are directly proportional to molecular concentrations, although instrument and operator characteristics introduce (often unknown) scaling factors. Concentration estimates obtained with MRS are therefore reported relative to an internal reference standard, e.g., the total creatine or tissue water signal.
MRS has an in vivo detection threshold on the order of magnitude of 1 mM. In vivo measurements usually require a delicate trade-off between sufficient signal-to-noise, tolerable acquisition times, and spatial specificity. Single-voxel measurements may achieve robust estimation of lactate from an 8-mL cuboid in 5-10 mins; 2D/3D coverage of larger regions (‘spectroscopic imaging’, MRSI) at a spatial resolution of ~1 cm can require up to 20 to 30 minutes. The brain is an optimal organ for MRS because of its less intense lipid nuisance signals, less physiological motion, and the ability to achieve superior magnetic field homogeneity, compared to other body parts.
Proton in vivo MRS can be routinely performed on clinical MRI scanners while heteronuclear (i.e. non-proton) scans and hyper-polarization require additional equipment and expenses.
We conducted a comprehensive literature search of PubMed and Google Scholar, and reference lists of identified studies on April 25, 2022, to identify research papers exploring the metabolic effect of DCA in mitochondrial, neurological, and cancerous conditions. Search criteria included various iterations of “MRS”, “dichloroacetate”, “cancer”, “glioma”, brain”. Specific search parameters are included in the supplement of this manuscript. Two authors (DK, GO) independently screened and selected titles and abstracts to classify MRS studies on the effects of DCA on lactate levels in the brain and blood.
Studies were included based on the following criteria: (a) interventional study design with DCA administration; (b) study of normal brain, mitochondrial disease, ischemia, stroke, TBI, and/or cancer; (c) utilization of MRS; (d) reported metabolite levels in the specimen/blood and/or brain. Duplicates were excluded.
Three reviewers (GO, DK, VC) then independently performed full-text screening and data extraction. Study characteristics for extraction included description of study population, condition examined, study design, number of participants, MRS method used, methodology for DCA administration, blood lactate levels pre-/post-DCA treatment, and brain lactate levels both pre-DCA and post-DCA. Disagreements were resolved through discussion among the reviewers. Studies are summarized in Table 1.

Table 1 Metabolic Effects of DCA in Non-Cancerous and Cancerous Conditions.
DCA is a drug of interest to modulate CNS metabolism and its derangements and thus has been extensively studied in the treatment of mitochondrial and ischemic neurologic conditions. Many preclinical and clinical studies also evaluated the potential role of MRS as a pharmacodynamic biomarker for DCA-induced metabolic changes. Such studies may serve as a blueprint for further development of MRS for DCA treatment monitoring in oncology.
Rat models studied with hyperpolarized pyruvate MRS have been particularly useful to establish the dynamics of DCA-related metabolic changes. In normal rats, whole-body measurements after DCA administration revealed a ~three-fold rise of bicarbonate and 70% increase of glutamate levels (15), and 40-50% rise of glutamate in normal rat brain after 1 hour, continuing further to 86% 2.5 hours after injection (13, 14). Brain lactate concurrently decreased by ~30% one hour after DCA injection but returned to pre-injection levels by 2.5 hours post-injection (13). A similar approach revealed a diffuse rise in bicarbonate and bicarbonate/lactate ratios after traumatic brain injury (TBI) in rats, although the changes appeared global, without significant differences between the injured or non-injured hemispheres in the acute (4 hours) or subacute (2 and 7 days) phases after injury (18).
In a rat model of cerebral ischemia, lactate levels as low as 1.5 mM were detectable with MRS, and lower lactate with higher pH were observed 30 minutes after reperfusion in the DCA-treated versus the DCA-naïve group. Preischemic DCA treatment only minimally lowered lactate during the occlusive phase, but pre- or post-occlusive DCA treatment induced marked lactate reduction that was most prominent in the first hour of reperfusion. Glutamate levels were higher in the DCA-treated group than in DCA-naïve postischemic animals (16). In another MRS study of cerebral ischemia comparing adolescent and adult mice, DCA use was associated with mostly nonsignificant trends towards faster lactate normalization after reperfusion in the adolescent mice (17).
Human DCA/MRS data is dominated by case reports of pediatric mitochondrial conditions treated with DCA. Leigh syndrome is characterized by elevated blood lactate levels and symmetric deep brain lesions secondary to global PDC or respiratory chain defects (32). Three case studies, each of an infant with Leigh syndrome, used MRS qualitatively (21) and quantitatively (24, 25) to supplement data from serum and CSF lactate level monitoring while on DCA. Before initiation of DCA, two of these patients had borderline high (~1 mM), and one markedly elevated serum lactate levels (5.5 mM), and all had elevated CSF lactate (3.0-8.0mM) with clearly detectable MRS lactate signal, including the normal appearing parenchyma. At the first MRS timepoint on DCA therapy (30-100 mg/kg/day), serum lactate levels decreased or plateaued in the broad normal range within a week, whereas CSF lactate levels had a much slower rate of reduction and took substantially longer to plateau. MRS lactate peaks became undetectable when CSF lactate levels reached ≤2.0 mM (as early as 10 weeks) (21, 24, 25). Lactate-to-creatine ratios did not follow CSF lactate levels, but correlated with clinical responses, suggesting that MRS might be a clinically relevant biomarker in DCA use (24, 25). In the case of a 13-year-old with mitochondrial complex I deficiency and lactic acidosis, a dose-dependent reduction of serum lactate and disappearance of MRS lactate signal was noted upon administration of DCA (22).
Unlike the disorders above, ictal appearance of focal stroke-like lesions predominates in MELAS which is caused by mitochondrial DNA alterations (33). Clinical symptoms are due to focal rather than global mitochondrial dysfunction in MELAS and thus more adequate to study the spatial dynamics of lactate homeostasis in lesional diseases such as brain tumors. Consistent with this notion is the case of a 40-year-old woman with MELAS, who presented with lactic acidosis (serum lactate 4.0 mM) and refractory partial seizures, presumably emanating from a left occipital lobe lesion with a lactate-to-creatine ratio of 2.5, as determined by MRS (23). One week of 50 mg/kg/day oral DCA led to rapid clinical improvement, reduction of serum lactate (to ~1.7 mM) and progressive long-term reduction of the MRS lactate-to-creatine ratio (~1.8 at one week, ~0.4 after 3 more weeks of DCA) in the occipital lesion, even when serum lactic acidosis (2.5 mM) re-emerged after DCA discontinuation. The patient subsequently acquired a new neurologic deficit localizable to the other occipital lobe, which showed a newly elevated lactate-to-creatine ratio of 1.3. In a case series of 11 patients with various congenital mitochondrial conditions (e.g., Leigh’s, MELAS, Kearns-Sayre, mitochondrial myopathy), 25 mg/kg/day DCA reduced blood lactate by ~1 mM on average and brain lactate-to-creatine ratios by, on average, 42% in white matter and basal ganglia, although with heterogeneous individual effect size (19).
A prospective placebo-controlled clinical trial studied the administration of various doses of DCA in stroke 1-5 days after presentation to the hospital (20). Nineteen patients had an MRS performed before and 45 minutes after DCA administration. Although a statistically significant lactate reduction was not observed when the whole cohort was considered, the lactate-to-NAA ratio was lowered by 19-25% in patients treated with higher doses of DCA (150-200 mg/kg, n=4). Of note, this study applied DCA in subacute ischemia and was agnostic of reperfusion status. As indicated by animal data (16), the degree of reperfusion significantly affects the lactate-reducing effect of DCA and may have confounded the findings of this human study (20).
In summary, human and animal evidence suggests that normal, non-cancer tissues (including the brain) respond to DCA treatment with a marked increase of glutamate and reduction of lactate. In primary mitochondrial disorders, especially in those with focal lesions, MRS estimates of brain parenchymal lactate levels follow a much slower rate of lactate reduction compared to changes measured in blood and may correlate better with clinical presentation than blood or CSF lactate. Lastly, DCA-associated metabolic changes appear to consistently follow a dose-dependent pattern across models and pathologies.
There are much less data from MRS or other metabolic imaging methods regarding responses to DCA in cancer. An in vitro study of PIK3CA-driven prostate cancer cell lines assessed the impact of DCA treatment on carbon homeostasis using [13C]glucose MRS (30). It found DCA to increase carbon flux via the tricarboxylic acid (TCA) cycle, with concurrent inhibition of glycolytic flux and amino acid biosynthesis. DCA reduced tumor proliferation and viability in the studied cell lines at a relatively high half-maximal inhibitory concentration (IC50) of 75 mM. A combined in vitro and in vivo study of colorectal cancer found increased production of reactive oxygen species, increased autophagy and mTOR inhibition after DCA treatment in cell lines (27). When these were xenografted into rat, hyperpolarized MRSI measures of pyruvate-to-lactate conversion rate decreased by 50%, with concurrent tumoristatic effects at a DCA dose of 200 mg/kg/d (human equivalent dose [HED] ~30 mg/kg/d). Another study showed DCA to reduce vitality metrics and lactate levels in a dose-dependent fashion in breast cancer cell lines, but not in a non-neoplastic breast cell line (26). Here, DCA increased extracellular pH in cell cultures from 7.06 to 7.23, pH and lactate levels under normoxic conditions were strongly correlated (r=-0.98), and only slightly weaker under hypoxia (r=-0.93). DCA had minimal impact on cell-cycle in the cultured cells. DCA-treated mice had a similar rise in extracellular pH with statistically insignificant growth reduction and longer survival compared to DCA-naïve animals (26). In another murine study of glycolytic breast cancer and oxidative cervical cancer xenografts, 2 days of treatment with 200 mg/kg/day (15 mg/kg/d HED) did not impact oxygen and glucose utilization significantly. Moreover, there was no difference in double-stranded DNA breaks between the cell lines, and a pyruvate-to-lactate conversion reduction on MRS was only noted in the oxidative cell line (29).
There are a few preclinical studies that have evaluated the use of hyperpolarized MRS and DCA in U87 and C6 glioma models. In a study of hyperpolarized glucose and glutamine metabolism in glioma cell lines, hyperphosphorylated PDC showed a 4-fold lower activity in the IDH-mutant cell line with concurrent overexpression of PDK mRNA relative to IDH-wildtype (31). In IDH-wildtype cell lines, DCA induced a 41% increase in PDC activity and only marginal increases in glutamate levels. In contrast, DCA reactivated PDC by more than 700% and increased glutamate levels 2.4-5.9-fold in the IDH-mutant group and reduced the colony-forming effect and proliferation.
MRS of hyperpolarized pyruvate revealed reduced bicarbonate in both tumor and normal-appearing brain in an orthotopic C6 glioma animal model (34). Lactate levels normalized to total carbon did not significantly change in normal brain but decreased by 11% in the tumor (34). In the same model, lactate-to-glutamate ratios were about 30-40% higher in gliomas than in normal appearing brain at baseline. DCA administration led to a >50% reduction of these ratios in both glioma and normal brain (13).
Overall, these preclinical data from various cancer models suggest that DCA can increase extracellular pH both in vitro and in vivo and may shift glucose utilization from glycolysis to OXPHOS. However, the impact on tumor cell proliferation and viability varied markedly among cell lines. In gliomas, there appears to be a significant differentiating effect of higher lactate-to-glutamate ratios that respond to DCA with concurrent reductions of lactate and increases in glutamate levels within 1 hour of drug administration. Lastly, the impact of DCA on PDC activity was more than 17-fold higher in IDH-mutant glioma that also translated to higher tumoristatic effects in vitro. However, hyperpolarized MRS data has yet to be substantiated with conventional (non-hyperpolarized) clinical MRS in humans.
The evidence reviewed here shows a consistent and apparently dose-dependent effect of DCA on serum and tissue lactate and glutamate levels. Data derived from various neoplasms indicate that tumor sensitivity to these effects may strongly depend on tumor type and metabolic environment, including oxygenation status, but are substantial in gliomas. Experience from human primary mitochondrial diseases suggests that brain lactate levels estimated by MRS correlate with clinical responses to DCA therapy better than serum or even CSF lactate, especially in conditions where symptomatology is driven by focal lesions similarly to brain tumors. Therefore, it is unlikely that serum and/or CSF lactate measurements could serve as surrogate biomarkers of DCA pharmacodynamics in brain cancer, or possibly cancer located in other tissues. Although lactate MRS detection thresholds were not clearly evaluated in the above reports, MRS lactate signals were detectable in all animal or human studies when tissue or CSF lactate exceeded >2 mM, which is well below lactate concentrations measured in human gliomas (>5 mM) or even peritumoral brain (≥2 mM) (35). Another important finding is the marked increase in glutamate concentrations upon DCA exposure in both normal and tumor-bearing brain in animal models. The inverse correlation between lactate and glutamate may be explained by the role of the glutamate as an alternative carbon source for the TCA cycle when pyruvate carbon is depleted by lactate production in tumor tissue (36). These data suggest that, by stimulating pyruvate oxidation, DCA may inhibit glutamine oxidation by decreasing the availability of pyruvate for transamination, which, in turn, results in glutamate accumulation and a consequent inhibition of glutaminase activity, although this postulate remains to be tested definitively. Regardless, the temporal overlap 1 hour after DCA administration between lactate reduction and glutamate increase could be harnessed to assess adequate distribution of DCA in normal brain and the solid portion of gliomas. The utility of this approach was demonstrated in a human dose-finding trial of a dual mTOR/PIK3CA inhibitor, in which the glucose uptake-reducing effect measured on PET was used to inform dose selection (37). The present data could serve as an excellent framework to design prospective, tissue-validated studies of the role of MRS as a predictive biomarker in DCA therapy in cancers and neurologic conditions, such as stroke.
The evidence suggests that DCA is a well-tolerated, orally bioavailable, brain-penetrable compound with remarkable effects on brain lactate and glutamate levels. Rapid DCA-induced reduction of lactate levels has been shown repeatedly in cancer and appears promising as lactic acidosis is associated with worse survival and treatment resistance in malignancies such as glioblastoma (38). The data also corroborate that lactate and glutamate changes are well within the detection range of MR spectroscopy. Consequently, monitoring these metabolites via MRS appears to be a feasible approach to confirm adequate DCA delivery and kinetics in the brain that is ready to be integrated into currently ongoing and future human clinical trials using DCA.
DK, concept, writing, literature review, editing figure and table VC, literature review, table and figure generation, formatting, GO, concept, writing, literature review, editing figure and table PS, literature interpretation, writing, editing, SG: concept, literature interpretation, editing PB: concept, literature interpretation, editing CB: concept, literature interpretation, editing. All authors contributed to the article and approved the submitted version.
GO was funded by R00AG062230 and DOK was funded by PHPA-1896.
CB is a consultant for Depuy-Synthes, Galectin Therapeutics, Haystack Oncology, Privo Technologies and Bionaut Labs. He is a co-founder of OrisDx and Belay Diagnostics. PS is Chief Scientific Officer for Praesidio Pharma and scientific advisor for Saol Therapeutics, from which he receives funding for research but no personal financial or other benefits from either party.
The remaining authors declare that the research was conducted in the absence of any commercial or financial relationships that could be construed as a potential conflict of interest.
All claims expressed in this article are solely those of the authors and do not necessarily represent those of their affiliated organizations, or those of the publisher, the editors and the reviewers. Any product that may be evaluated in this article, or claim that may be made by its manufacturer, is not guaranteed or endorsed by the publisher.
The Supplementary Material for this article can be found online at: https://www.frontiersin.org/articles/10.3389/fonc.2023.1077461/full#supplementary-material
DCA, Dichloroacetate; HED, Human Equivalent Dose; MELAS, Mitochondrial Encephalopathy, Lactic Acidosis, and Stroke-like episodes; MRS, Magnetic Resonance Spectroscopy; MRSI, Magnetic Resonance Spectroscopic Imaging; NAA, N-acetylaspartate.
1. Semenza GL. Oxygen sensing, homeostasis, and disease. N Engl J Med (2011) 365(6):537–47. doi: 10.1056/NEJMra1011165
2. Kumar A, Kant S, Singh SM. Antitumor and chemosensitizing action of dichloroacetate implicates modulation of tumor microenvironment: A role of reorganized glucose metabolism, cell survival regulation and macrophage differentiation. Toxicol Appl Pharmacol (2013) 273(1):196–208. doi: 10.1016/j.taap.2013.09.005
3. Bonnet S, Archer SL, Allalunis-Turner J, Haromy A, Beaulieu C, Thompson R, et al. A mitochondria-k+ channel axis is suppressed in cancer and its normalization promotes apoptosis and inhibits cancer growth. Cancer Cell (2007) 11(1):37–51. doi: 10.1016/j.ccr.2006.10.020
4. Walenta S, Salameh A, Lyng H, Evensen JF, Mitze M, Rofstad EK, et al. Correlation of high lactate levels in head and neck tumors with incidence of metastasis. Am J Pathol (1997) 150(2):409–15.
5. Larrieu CM, Storevik S, Guyon J, Pagano Zottola AC, Bouchez CL, Derieppe MA, et al. Refining the role of pyruvate dehydrogenase kinases in glioblastoma development. Cancers (2022) 14(15):3769. doi: 10.3390/cancers14153769
6. Husain Z, Huang Y, Pankaj S. Tumor-derived lactate modifies antitumor immune response: Effect on myeloid-derived suppressor cells and NK cells. J Immunol (2013) 191(3):1486–95. doi: 10.4049/jimmunol.1202702
7. Torrini C, Nguyen TTT, Shu C, Mela A, Humala N, Mahajan A, et al. Lactate is an epigenetic metabolite that drives survival in model systems of glioblastoma. Mol Cell (2022) 82(16):3061–76.e6. doi: 10.1016/j.molcel.2022.06.030
8. Walenta S, Wetterling M, Lehrke M, Schwickert G, Sundfør K, Rofstad EK, et al. High lactate levels predict likelihood of metastases, tumor recurrence, and restricted patient survival in human cervical Cancers. Cancer Res (2000) 60(4):916–21.
9. Brizel DM, Schroeder T, Scher RL, Walenta S, Clough RW, Dewhirst MW, et al. Elevated tumor lactate concentrations predict for an increased risk of metastases in head-and-neck cancer. Int J Radiat Oncol (2001) 51(2):349–53. doi: 10.1016/S0360-3016(01)01630-3
10. Stacpoole PW. The pharmacology of dichloroacetate. Metabolism (1989) 38(11):1124–44. doi: 10.1016/0026-0495(89)90051-6
11. Kankotia S, Stacpoole PW. Dichloroacetate and cancer: New home for an orphan drug? Biochim Biophys Acta BBA - Rev Cancer (2014) 1864(2):617–29. doi: 10.1016/j.bbcan.2014.08.005
12. Stacpoole PW. Lactic acidosis and other mitochondrial disorders. Metabolism (1997) 46(3):306–21. doi: 10.1016/S0026-0495(97)90259-6
13. Park JM, Josan S, Jang T, Merchant M, Watkins R, Hurd RE, et al. Volumetric spiral chemical shift imaging of hyperpolarized [2-13c]pyruvate in a rat c6 glioma model. Magn Reson Med (2016) 75(3):973–84. doi: 10.1002/mrm.25766
14. Park JM, Josan S, Grafendorfer T, Yen YF, Hurd RE, Spielman DM, et al. Measuring mitochondrial metabolism in rat brain in vivo using MR spectroscopy of hyperpolarized [2-13C]pyruvate. NMR Biomed (2013) 26(10):1197–203. doi: 10.1002/nbm.2935
15. Hu S, Yoshihara HAI, Bok R, Zhou J, Zhu M, Kurhanewicz J, et al. Use of hyperpolarized [1-13C]pyruvate and [2-13C]pyruvate to probe the effects of the anticancer agent dichloroacetate on mitochondrial metabolism in vivo in the normal rat. Magn Reson Imaging (2012) 30(10):1367–72. doi: 10.1016/j.mri.2012.05.012
16. Chang LH, Shimizu H, Abiko H, Swanson RA, Faden AI, James TL, et al. Effect of dichloroacetate on recovery of brain lactate, phosphorus energy metabolites, and glutamate during reperfusion after complete cerebral ischemia in rats. J Cereb Blood Flow Metab (1992) 12(6):1030–8. doi: 10.1038/jcbfm.1992.140
17. Corbett R, Laptook A, Gee J, Garcia D, Silmon S, Tollefsbol G. Age-related differences in the effect of dichloroacetate on postischemic lactate and acid clearance measured In vivo using magnetic resonance spectroscopy and microdialysis. J Neurochem (1998) 71(3):1205–14. doi: 10.1046/j.1471-4159.1998.71031205.x
18. DeVience SJ, Lu X, Proctor JL, Rangghran P, Medina JA, Melhem ER, et al. Enhancing metabolic imaging of energy metabolism in traumatic brain injury using hyperpolarized [1-13C]Pyruvate and dichloroacetate. Metabolites (2021) 11(6):335. doi: 10.3390/metabo11060335
19. Stefano ND, Matthews PM, Ford B, Genge A, Karpati G, Arnold DL. Short-term dichloroacetate treatment improves indices of cerebral metabolism in patients with mitochondrial disorders. Neurology (1995) 45(6):1193–8. doi: 10.1212/WNL.45.6.1193
20. Graham GD, Barker PB, Brooks WM, Morris DC, Ahmed W, Bryniarski E, et al. MR spectroscopy study of dichloroacetate treatment after ischemic stroke. Neurology (2000) 55(9):1376–9. doi: 10.1212/WNL.55.9.1376
21. Katsumi Y, Morimoto M, Nishimura A, Naito E, Sugimoto T. Treatment for Leigh syndrome by monitoring dichloroacetate concentration. Pediatr Int (2009) 51(2):293–5. doi: 10.1111/j.1442-200X.2009.02815.x
22. Kurlemann G, Paetzke I, Möller H, Masur H, Schuierer G, Weglage J, et al. Therapy of complex I deficiency: Peripheral neuropathy during dichloroacetate therapy. Eur J Pediatr (1995) 154(11):928–32. doi: 10.1007/BF01957508
23. Pavlakis SG, Kingsley PB, Kaplan GP, Stacpoole PW, O’Shea M, Lustbader D. Magnetic resonance spectroscopy: Use in monitoring MELAS treatment. Arch Neurol (1998) 55(6):849–52. doi: 10.1001/archneur.55.6.849
24. Takahashi S, Oki J, Miyamoto A, Okuno A. Proton magnetic resonance spectroscopy to study the metabolic changes in the brain of a patient with Leigh syndrome. Brain Dev (1999) 21(3):200–4. doi: 10.1016/S0387-7604(98)00095-3
25. Takanashi J, Sugita K, Tanabe Y, Maemoto T, Niimi H. Dichloroacetate treatment in Leigh syndrome caused by mitochondrial DNA mutation. J Neurol Sci (1997) 145(1):83–6. doi: 10.1016/S0022-510X(96)00248-1
26. Anemone A, Consolino L, Conti L, Reineri F, Cavallo F, Aime S, et al. In vivo evaluation of tumour acidosis for assessing the early metabolic response and onset of resistance to dichloroacetate by using magnetic resonance pH imaging. Int J Oncol (2017) 51(2):498–506. doi: 10.3892/ijo.2017.4029
27. Lin G, Hill DK, Andrejeva G, Boult JKR, Troy H, Fong ACLFWT, et al. Dichloroacetate induces autophagy in colorectal cancer cells and tumours. Br J Cancer (2014) 111(2):375–85. doi: 10.1038/bjc.2014.281
28. Kailavasan M, Rehman I, Reynolds S, Bucur A, Tozer G, Paley M. NMR-based evaluation of the metabolic profile and response to dichloroacetate of human prostate cancer cells. NMR Biomed (2014) 27(5):610–6. doi: 10.1002/nbm.3101
29. Neveu MA, Preter GD, Joudiou N, Bol A, Brender JR, Saito K, et al. Multi-modality imaging to assess metabolic response to dichloroacetate treatment in tumor models. Oncotarget (2016) 7(49):81741–9. doi: 10.18632/oncotarget.13176
30. Feuerecker B, Biechl P, Veltkamp C, Saur D, Eisenreich W. Metabolic response of pancreatic carcinoma cells under treatment with dichloroacetate. Metabolites (2021) 11(6):350. doi: 10.3390/metabo11060350
31. Izquierdo-Garcia JL, Viswanath P, Eriksson P, Cai L, Radoul M, Chaumeil MM, et al. IDH1 mutation induces reprogramming of pyruvate metabolism. Cancer Res (2015) 75(15):2999–3009. doi: 10.1158/0008-5472.CAN-15-0840
32. Bonfante E, Koenig MK, Adejumo RB, Perinjelil V, Riascos RF. The neuroimaging of Leigh syndrome: case series and review of the literature. Pediatr Radiol (2016) 46(4):443–51. doi: 10.1007/s00247-015-3523-5
33. Ciafaloni E, Ricci E, Shanske S, Moraes CT, Silvestri G, Hirano M, et al. MELAS: Clinical features, biochemistry, and molecular genetics. Ann Neurol (1992) 31(4):391–8. doi: 10.1002/ana.410310408
34. Park JM, Recht LD, Josan S, Merchant M, Jang T, Yen YF, et al. Metabolic response of glioma to dichloroacetate measured in vivo by hyperpolarized 13C magnetic resonance spectroscopic imaging. Neuro-Oncol (2013) 15(4):433–41. doi: 10.1093/neuonc/nos319
35. Roslin M, Henriksson R, Bergström P, Ungerstedt U, Tommy Bergenheim A. Baseline levels of glucose metabolites, glutamate and glycerol in malignant glioma assessed by stereotactic microdialysis. J Neurooncol (2003) 61(2):151–60. doi: 10.1023/A:1022106910017
36. Ward PS, Thompson CB. Metabolic reprogramming: A cancer hallmark even warburg did not anticipate - ScienceDirect. Cancer Cell (2012) 21(3):297–308. doi: 10.1016/j.ccr.2012.02.014
37. Wen PY, Cloughesy TF, Olivero AG, Morrissey KM, Wilson TR, Lu X, et al. First-in-Human phase I study to evaluate the brain-penetrant PI3K/mTOR inhibitor GDC-0084 in patients with progressive or recurrent high-grade glioma. Clin Cancer Res (2020) 26(8):1820–8. doi: 10.1158/1078-0432.CCR-19-2808
Keywords: dichloroacetate, magnetic resonance spectroscopy, Warburg effect, lactate, glutamate, cancer, glioblastoma, glioma
Citation: Kamson DO, Chinnasamy V, Grossman SA, Bettegowda C, Barker PB, Stacpoole PW and Oeltzschner G (2023) In-vivo magnetic resonance spectroscopy of lactate as a non-invasive biomarker of dichloroacetate activity in cancer and non-cancer central nervous system disorders. Front. Oncol. 13:1077461. doi: 10.3389/fonc.2023.1077461
Received: 25 October 2022; Accepted: 22 February 2023;
Published: 17 March 2023.
Edited by:
Mioara Larion, National Institutes of Health (NIH), United StatesReviewed by:
Kumar Pichumani, Houston Methodist Research Institute, United StatesCopyright © 2023 Kamson, Chinnasamy, Grossman, Bettegowda, Barker, Stacpoole and Oeltzschner. This is an open-access article distributed under the terms of the Creative Commons Attribution License (CC BY). The use, distribution or reproduction in other forums is permitted, provided the original author(s) and the copyright owner(s) are credited and that the original publication in this journal is cited, in accordance with accepted academic practice. No use, distribution or reproduction is permitted which does not comply with these terms.
*Correspondence: David O. Kamson, DKamson1@jhu.edu; Georg Oeltzschner, GOeltzs1@jhmi.edu
Disclaimer: All claims expressed in this article are solely those of the authors and do not necessarily represent those of their affiliated organizations, or those of the publisher, the editors and the reviewers. Any product that may be evaluated in this article or claim that may be made by its manufacturer is not guaranteed or endorsed by the publisher.
Research integrity at Frontiers
Learn more about the work of our research integrity team to safeguard the quality of each article we publish.