 Young Wha Koh
 Jae-Ho Han1
 Seokjin Haam
95% of researchers rate our articles as excellent or good
Learn more about the work of our research integrity team to safeguard the quality of each article we publish.
Find out more
ORIGINAL RESEARCH article
Front. Oncol. , 21 November 2022
Sec. Thoracic Oncology
Volume 12 - 2022 | https://doi.org/10.3389/fonc.2022.996634
This article is part of the Research Topic Optimizing Outcomes and Addressing Adversities of Immunotherapy in Lung Cancer View all 17 articles
Background: YTH domain-containing family protein 1 (YTHDF1) or YTHDF2 play crucial roles in cancer immunotherapy. We examine the expression of YTHDF1, YTHDF2, CD8, CD4, and FOXP3 to identify their prognostic or predictive role for PD-1/PD-L1 inhibitor in non-small cell lung cancer (NSCLC).
Methods: Immunohistochemical expression of YTHDF1, YTHDF2, CD8, CD4, and FOXP3 was investigated in 266 patients not receiving PD-1/PD-L1 inhibitors and in 59 patients receiving PD-1/PD-L1 inhibitors. Immunohistochemical results were verified using mRNA dataset obtained from The Cancer Genome Atlas (TCGA) database.
Results: Immunohistochemical expression of YTHDF1 or YTHDF2 was negatively associated with CD8- and CD4-positive T cells; however, the same expression was positively associated with FOXP3-positive T cells. YTHDF1 or YTHDF2 mRNA expression was also negatively associated with CD8- and CD4-positive T cells. Gene set enrichment analysis revealed that low YTHDF1 was related to immune hot tumor gene sets. Expression of YTHDF1 or YTHDF2 was negatively associated with expression of most immune checkpoints. YTHDF1 and YTHDF2 were predictive markers of response to PD-1/PD-L1 inhibitors. YTHDF1 or YTHDF2 expression was associated with better prognosis. YTHDF1 has an immune hot profile in both cell types, whereas YTHDF2 is only seen in adenocarcinoma.
Conclusion: Low YTHDF1 or YTHDF2 reflects an immune hot tumor signature and may serve as a predictor or prognostic marker.
Anti-programmed cell death protein 1/programmed death-ligand 1 (PD-1/PD-L1) drugs have been approved for treatment of patients with advanced non-small cell lung cancer (NSCLC) (1–3). The expression of PD-L1 by tumor cells has been focused on as the best marker of sensitivity to PD-1/PD-L1 inhibitors (4). However, durable response to anti-PD-1/PD-L1 inhibitor have also been reported in PD-L1-negative patients (5). Various predictors, including tumor mutational burden (6), tumor-infiltrating lymphocytes (7), and immune-related gene signatures (8), are also candidate biomarkers; however, these biomarkers have not been validated. Furthermore, in the clinic, the evaluation of tumor mutational burden or immune-related gene signatures is difficult because it requires expensive techniques, including next-generation sequencing or nanostring technology.
N6-methyl adenosine (m6A), is responsible for post-transcriptional modification of mRNA in most eukaryotes (9). The m6A pathway components play important roles in oncogene-mediated cell transformation (10), cell proliferation and tumorigenicity (11, 12), and tumor progression (13). The YTH domain-containing family protein 1 (YTHDF1), a component of the m6A pathway, affects mRNA translation efficiency (14). Recently, Han et al. reported an important effect of YTHDF1 in the antitumor immunity (15). In melanoma and colon cancer models, YTHDF1 knockout mice showed favorable outcomes and increased CD8 positive T cells and NK cells (15). Furthermore, in a melanoma cancer model, the frequency of tumor regression to anti-PD-L1-treatment was increased in YTHDF1 knockout mice than in wild-type mice (15). YTHDF2 induces NSCLC growth by enhancing mRNA translation of 6-phosphogluconate dehydrogenase (16). YTHDF2 also promotes tumor proliferation by increasing CDKN1B mRNA degradation in intrahepatic cholangiocarcinoma (17). YTHDF2 expression was negatively associated with PD-L1 in esophageal cancer (18). Tsuchiya et al. revealed that YTHDF1 or YTHDF2 expression showed better clinical outcomes in NSCLC (19). Previous findings suggest that YTHDF1 or YTHDF2 may be a therapeutic target for cancer immunotherapy or a predictive biomarker predicting the response to anti-PD-1/PD-L1. However, there are no studies on the predictive role of YTHDF1 or YTHDF2 in NSCLC patients receiving PD-1/PD-L1 inhibitor. Although the role of YTHDF1 or YTHDF2 in the tumor immune microenvironment may differ depending on cell type, no such study has been performed.
Our study investigated the prognostic significance of YTHDF1 or YTHDF2 expression in a cohort of 266 patients who did not receive PD-1/PD-L1 inhibitor. We further investigated whether expression of YTHDF1 or YTHDF2 affected the response in a group of 59 patients treated with PD-1/PD-L1 inhibitor. Correlation analyses of YTHDF1, YTHDF2, and tumor infiltrating lymphocytes (CD4- and CD8-positive T cells and FOP3-positive T regulatory cells (Treg)) were performed on immunohistochemical and gene expression data. We also performed gene set enrichment analysis (GSEA) using The Cancer Genome Atlas (TCGA) to identify overexpressed gene classes based on YTHDF1 or YTHDF2 expression. In order to identify the tumor immune microenvironment associated with the expression of YTHDF1 or YTHDF2, the association between such expression and immune checkpoints other than PD-1/PD-L1 was investigated. All experiments were performed in two cell types (adenocarcinoma and squamous cell carcinoma).
Our study included a cohort of 266 patients not receiving PD-1/PD-L1 inhibitors and a group of 59 patients receiving PD-1/PD-L1 inhibitors. PD-1/PD-L1 inhibitor blockade was used in all patients from 2016 to 2022 and their drug responses were evaluated. The ethical approval was approved by the Institutional Review Board of Ajou University School of Medicine (AJIRB-BMR-KSP-19-416 and 2019-11-11). Complete response, partial response, or stable disease was defined as the responder group, and disease progression was defined as the non-responder group (20). Patient characteristics are summarized (Table 1). In the group not receiving PD-1/PD-L1 inhibitor treatment, 64% had adenocarcinoma and 29% had advanced stage. In the group treated with PD-1/PD-L1 inhibitor, 61% had adenocarcinoma and all were advanced stage. All patients receiving PD-1/PD-L1 inhibitor were previously refractory to chemotherapy, radiation therapy, or targeted agents. Twenty-five patients (42.4%) were responders
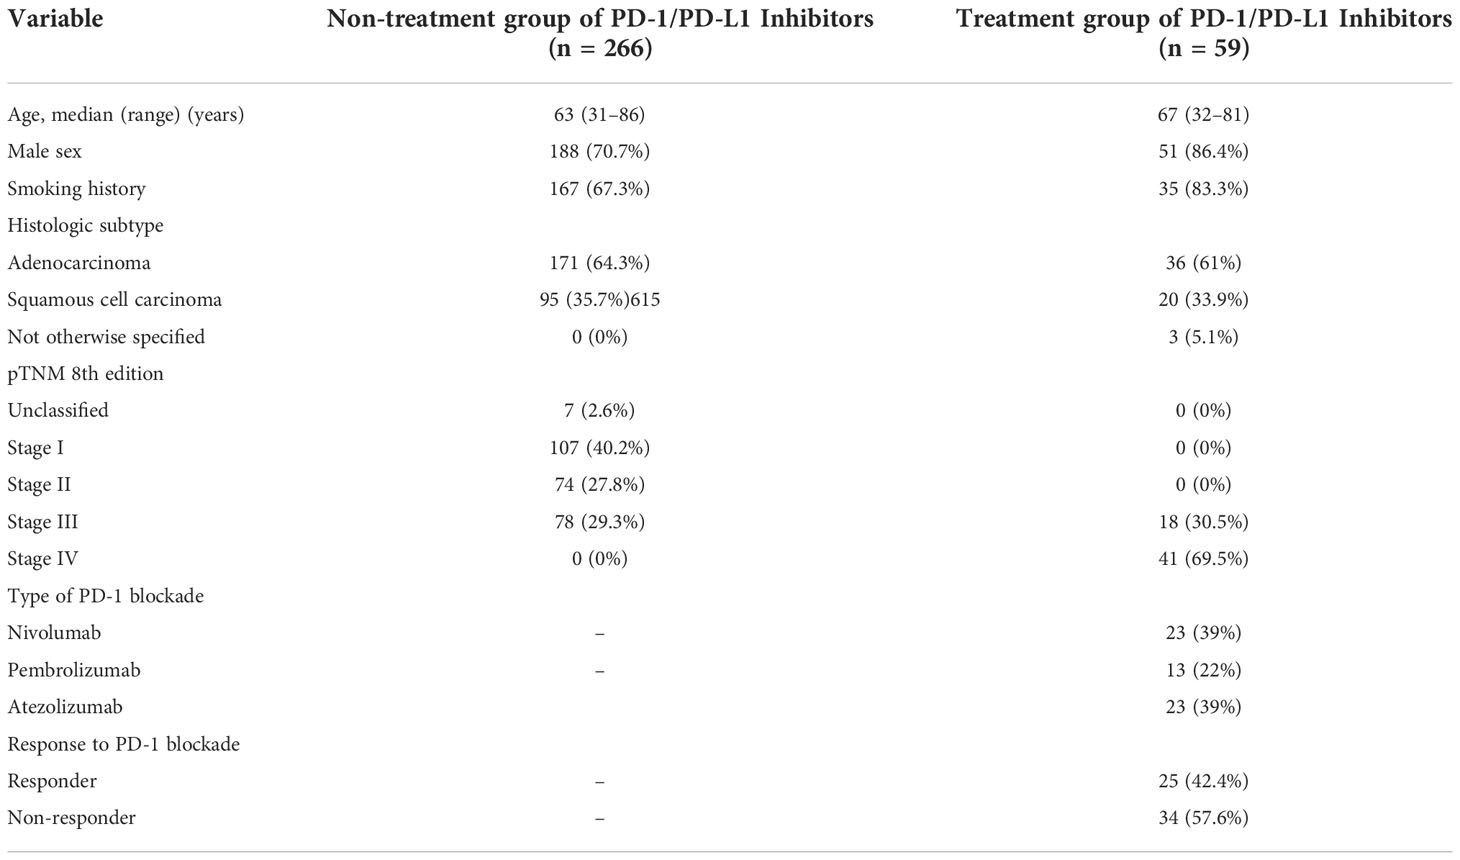
Table 1 Demographic and clinical characteristics of patients.
Antibodies YTHDF1 (polyclonal, Proteintech), YTHDF2 (polyclonal, Proteintech), CD8 (clone C8/144B, DAKO), CD4 (clone SP35, Cell Marque), and FOXP3 (clone 236A/E7, Abcam) were used. The intensity of YTHDF1 or YTHDF2 staining was defined in four categories: 0, 1, 2, 3. The percentages of cytoplasmic or membranous expression were also evaluated. H-scores were applied to examine the YTHDF1 or YTHDF2 stains (21). For interpretation of CD4, CD8, or FOXP3 cells, membrane-positive CD4 or CD8 cells or nuclear-positive FOXP3 cells were measured at three locations at 400x magnification in the tumor area and averaged.
mRNA data of 1018 NSCLCs (517 lung adenocarcinoma and 501 squamous cell carcinoma) obtained from TCGA cBioportal were used. (http://cbioportal.org) (22).
GSEA is a method to analyze underlying biological processes using mRNA expression. We performed GSEA using GSEA version 4.0.3 (23). We analyzed data based on the median value of YTHDF1 or YTHDF2 expression. The Hallmark gene set was used as the gene set database. If p < 0.05 and false discovery rate (FDR) < 0.25, it was defined as statistically significant. Web-based Kaplan Meier plotter tool was used for survival analyses (24). Survival analysis was performed using mRNA data from 719 adenocarcinomas and 524 squamous cell carcinomas.
Correlation between quantitative variables was determined using Spearman’s method. Logistic regression analysis was performed to identify predictive biomarker for anti-PD-1/PD-L1. The cutoffs of YTHDF1 and YTHDF2 were determined using receiver operating curve (ROC) analysis. Kaplan–Meier estimator was used for survival analysis. A cox proportional hazard model was used for survival multivariate analysis. IBM SPSS Statistics for Windows (Version 25.0. Armonk, NY, USA) was used, and a p-value less than 0.05 was defined as statistically significant.
The correlation analysis of YTHDF1, YTHDF2 and tumor infiltrating lymphocytes in the non-treatment group is summarized in Figure 1 In the adenocarcinoma group not receiving PD-1/PD-L1 inhibitor, the immunohistochemical expression of YTHDF1 was significantly negatively associated with CD4 and CD8 and positively correlated with FOXP3 expression. The immunohistochemical expression of YTHDF2 was also significantly negatively associated with CD4 and positively correlated with FOXP3 expression. In the squamous cell carcinoma group not receiving PD-1/PD-L1 inhibitor, the immunohistochemical expression of YTHDF1 was significantly negatively associated with CD4 and CD8 expression. The immunohistochemical expression of YTHDF2 was also significantly negatively associated with CD8 expression.
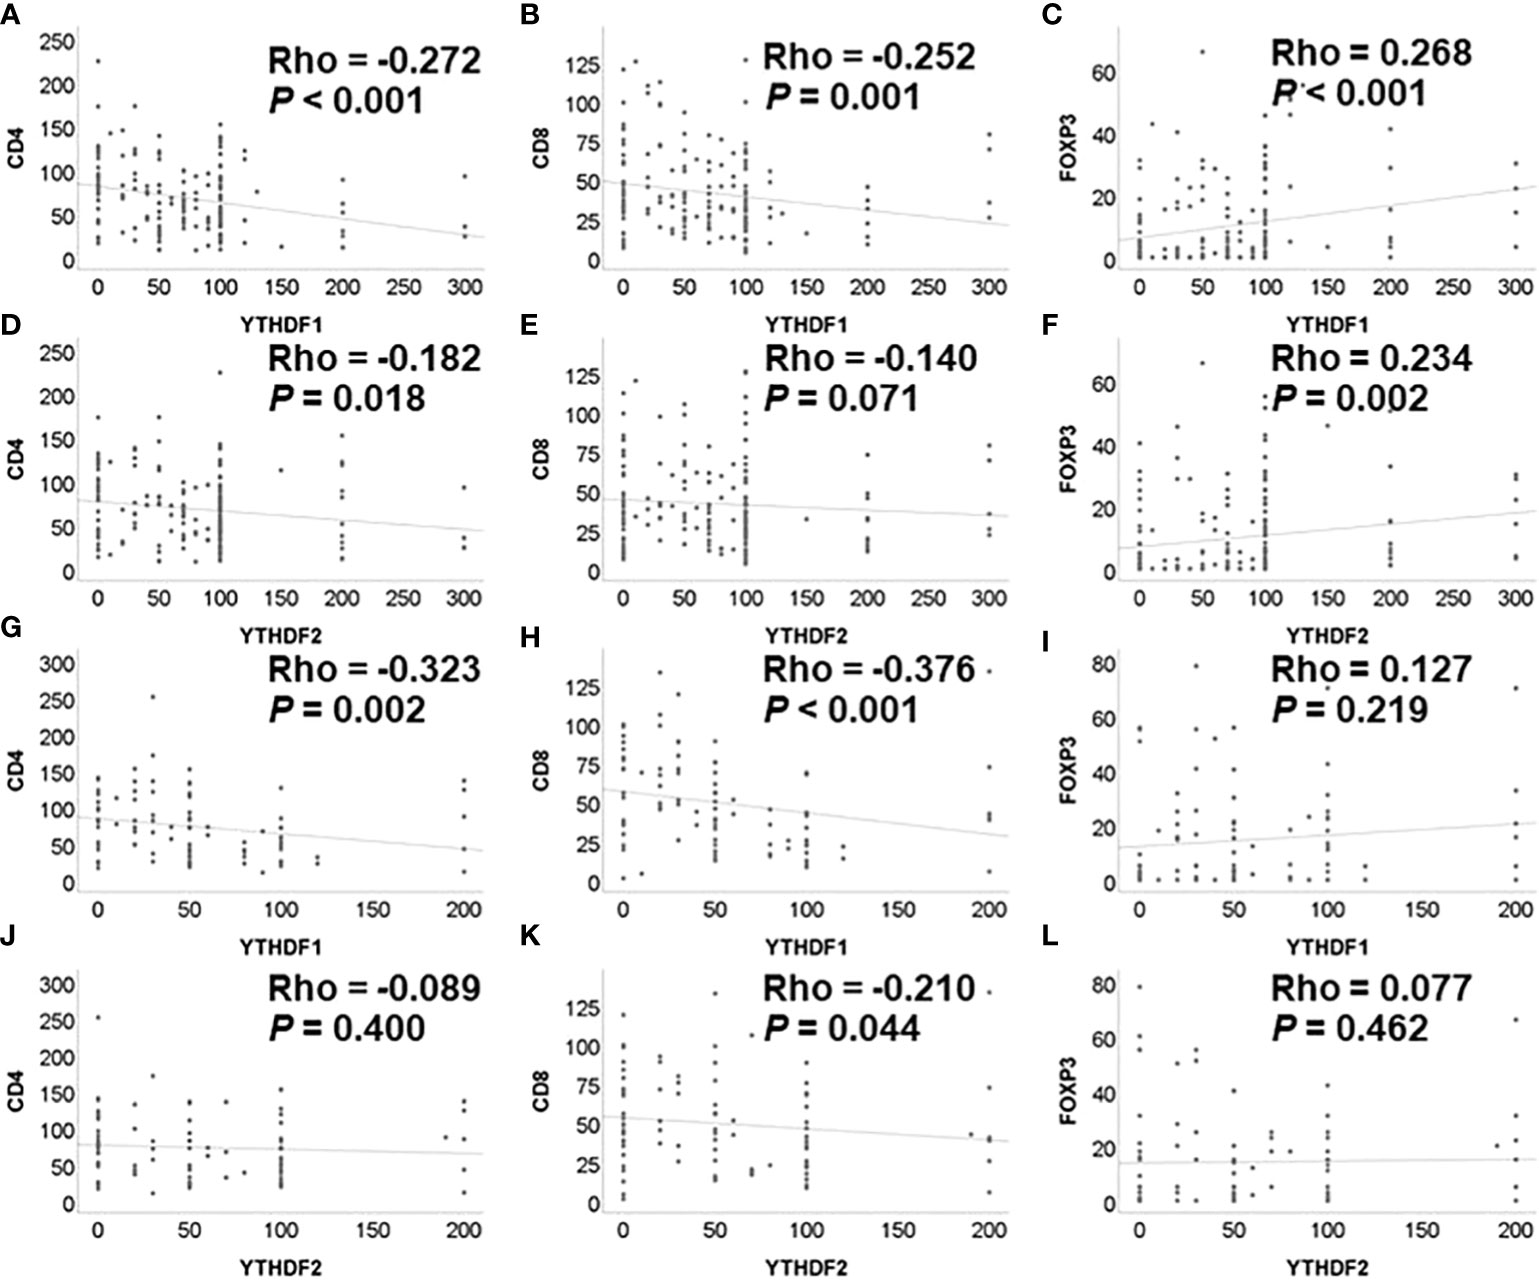
Figure 1 Correlation among YTHDF1, YTHDF2, CD4, CD8, and FOXP3 analyzed by immunohistochemistry in PD-1 inhibitor non-treatment groups. (A) YTHDF1 and CD4 in adenocarcinoma. (B) YTHDF1 and CD8 in adenocarcinoma. (C) YTHDF1 and FOXP3 in adenocarcinoma. (D) YTHDF2 and CD4 in adenocarcinoma. (E) YTHDF2 and CD8 in adenocarcinoma. (F) YTHDF2 and FOXP3 in adenocarcinoma. (G) YTHDF1 and CD4 in squamous cell carcinoma. (H) YTHDF1 and CD8 in squamous cell carcinoma. (I) YTHDF1 and FOXP3 in squamous cell carcinoma. (J) YTHDF2 and CD4 in squamous cell carcinoma. (K) YTHDF2 and CD8 in squamous cell carcinoma. (L) YTHDF2 and FOXP3 in squamous cell carcinoma.
In the adenocarcinoma group receiving PD-1/PD-L1 inhibitor treatment, the immunohistochemical expression of YTHDF1 was significantly negatively associated with CD4 expression (Supplementary Figure 1).
Correlation analyses among YTHDF1, YTHDF2, and tumor infiltrating lymphocytes were performed using the mRNA expression data of TCGA. The YTHDF1 or YTHDF2 mRNA expression was significantly negatively associated with CD4, CD8, and FOXP3 mRNA expression in adenocarcinoma (Figure 2). The YTHDF1 mRNA expression was also significantly negatively associated with CD4, CD8, and FOXP3 mRNA expression in squamous cell carcinoma (Figure 2). The YTHDF2 mRNA expression was not associated with CD4, CD8, and FOXP3 mRNA expression in squamous cell carcinoma (Figure 2). The YTHDF2 mRNA expression was not associated with CD4, CD8, and FOXP3 mRNA expression in squamous cell carcinoma (Figure 2). Representative figures of immunohistochemistry in adenocarcinoma show that high YTHDF1 or YTHDF2 cases are associated with low CD4, CD8 and high FOXP3 expression in both PD-1 inhibitor treatment and non-treatment groups (Figure 3). However, low YTHDF1 or YTHDF2 cases are associated with high CD4, CD8 and low FOXP3 expression in both PD-1 inhibitor treatment and non-treatment groups (Figure 3).
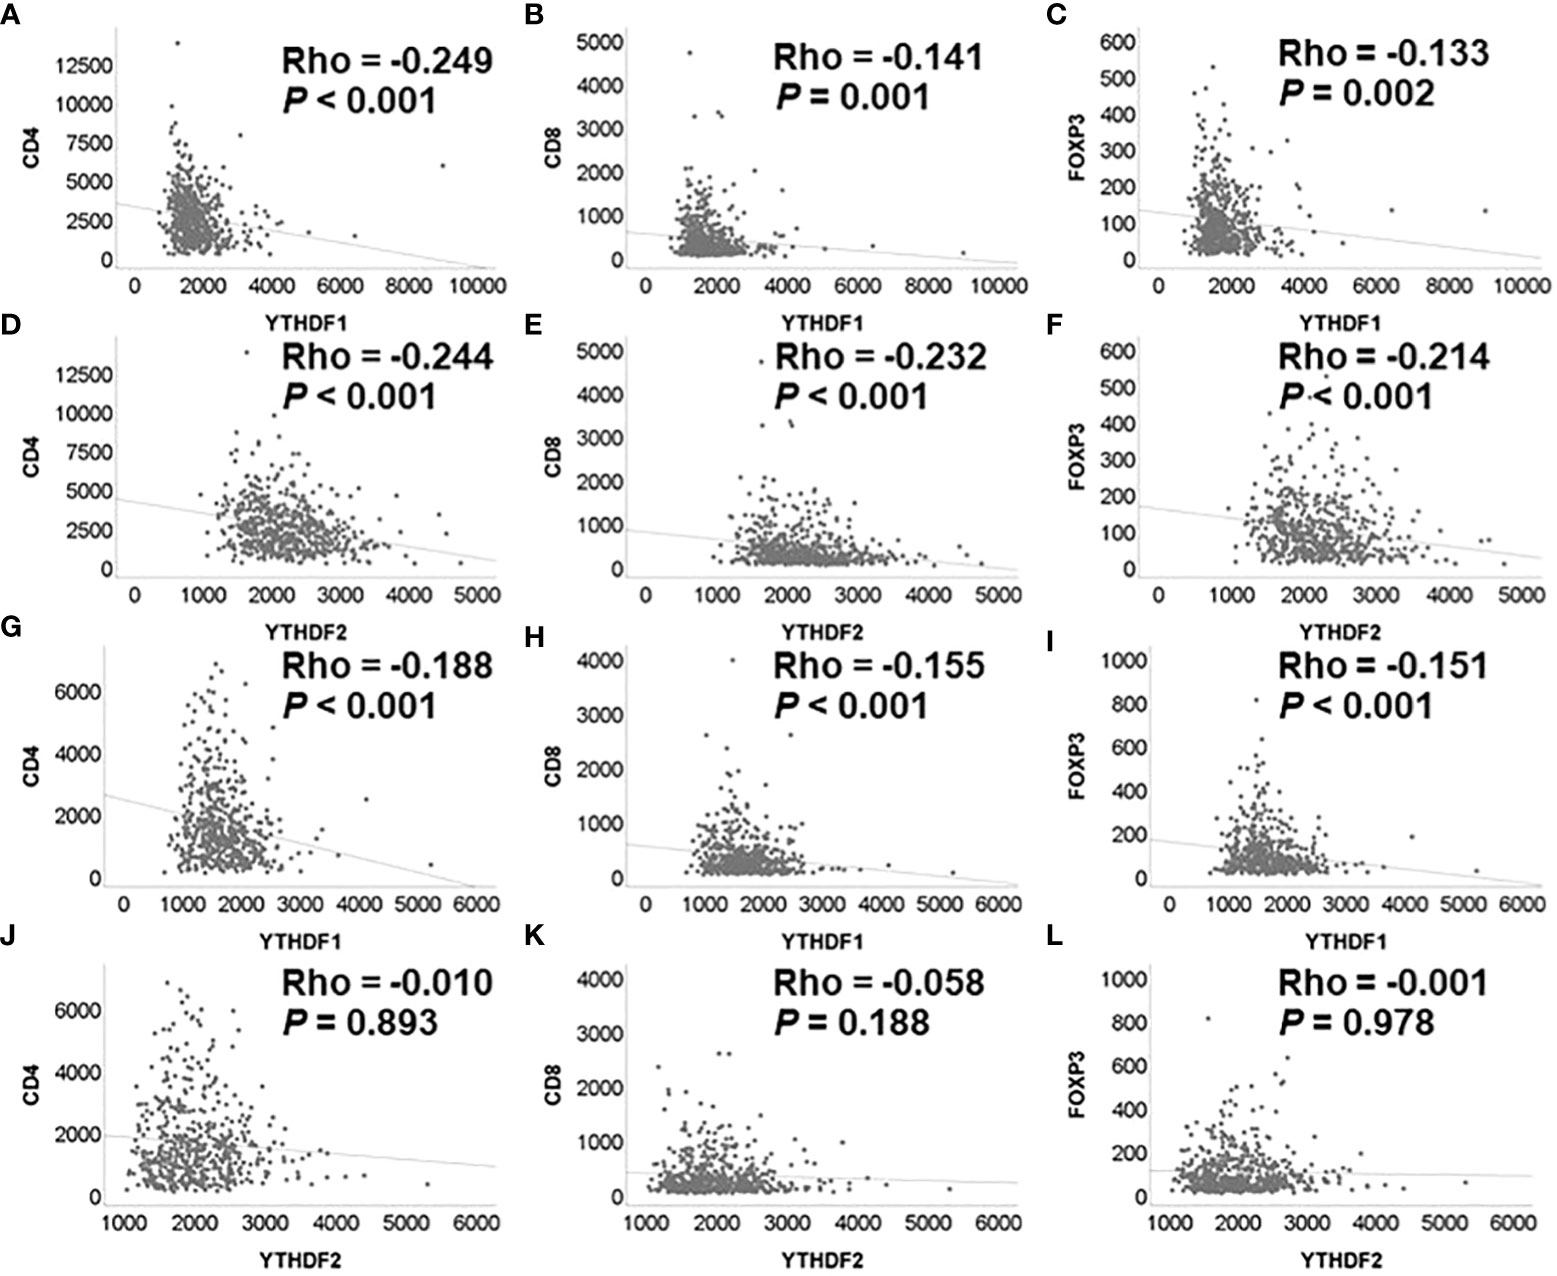
Figure 2 Correlation among YTHDF1, YTHDF2, CD4, CD8, and FOXP3 analyzed by mRNA expression in PD-1 inhibitor non-treatment groups. (A) YTHDF1 and CD4 in adenocarcinoma. (B) YTHDF1 and CD8 in adenocarcinoma. (C) YTHDF1 and FOXP3 in adenocarcinoma. (D) YTHDF2 and CD4 in adenocarcinoma. (E) YTHDF2 and CD8 in adenocarcinoma. (F) YTHDF2 and FOXP3 in adenocarcinoma. (G) YTHDF1 and CD4 in squamous cell carcinoma. (H) YTHDF1 and CD8 in squamous cell carcinoma. (I) YTHDF1 and FOXP3 in squamous cell carcinoma. (J) YTHDF2 and CD4 in squamous cell carcinoma. (K) YTHDF2 and CD8 in squamous cell carcinoma. (L) YTHDF2 and FOXP3 in squamous cell carcinoma.
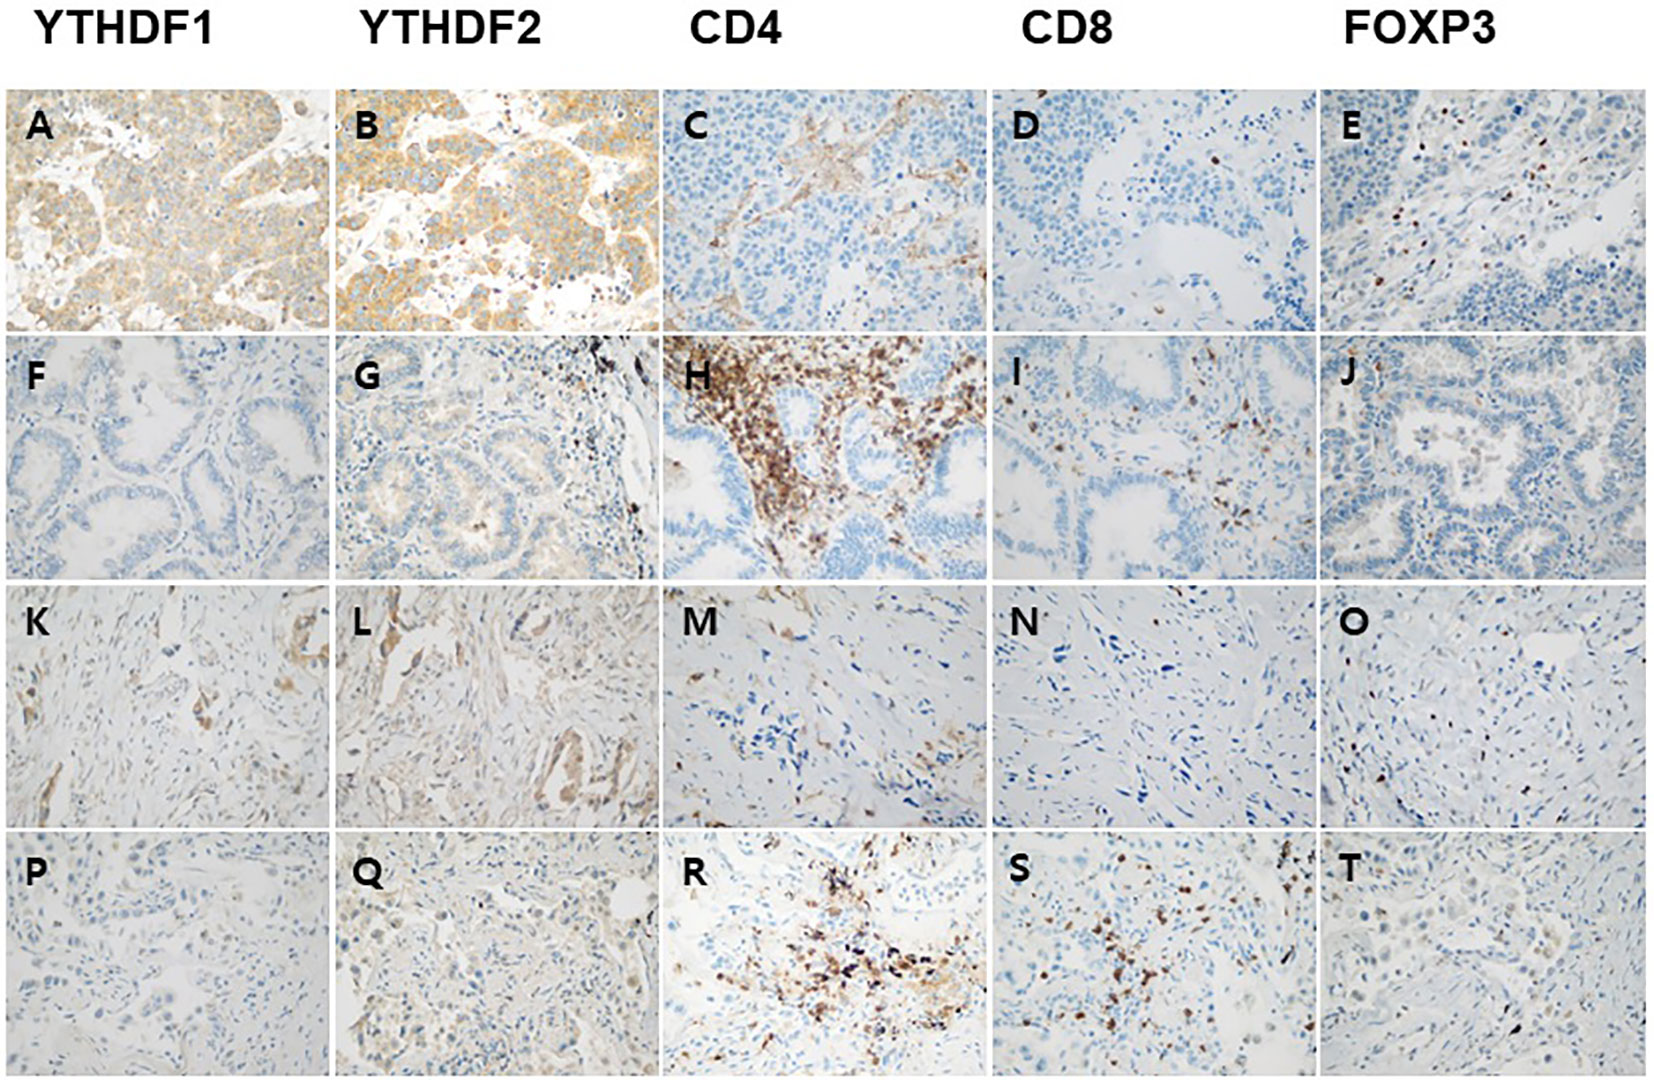
Figure 3 Representative immunohistochemical images of YTHDF1, YTHDF2, CD4, CD8, and FOXP3 expression in adenocarcinoma. High YTHDF1 (A) or YTHDF2 (B) case is associated with low CD4 (C), CD8 (D) and high FOXP3 (E) expression in PD-1 inhibitor non-treatment group. Low YTHDF1 (F) or YTHDF2 (G) case is associated with high CD4 (H), CD8 (I) and low FOXP3 (J) expression in PD-1 inhibitor non-treatment group. High YTHDF1 (K) or YTHDF2 (L) case is associated with low CD4 (M), CD8 (N) and high FOXP3 (O) expression in PD-1 inhibitor treatment group. Low YTHDF1 (P) or YTHDF2 (Q) case is associated with high CD4 (R), CD8 (S) and low FOXP3 (T) expression in PD-1 inhibitor treatment group.
In the adenocarcinoma group not receiving PD-1/PD-L1 inhibitor, the cutoff values of YTHDF1 and YTHDF2 were 60 and 75, respectively. In the squamous cell carcinoma group not receiving PD-1/PD-L1 inhibitor, the cutoff values of YTHDF1 and YTHDF2 were 45 and 40, respectively. Because the sample size of the PD-1/PD-L1 inhibitor-treated group was small, all cell types were combined for survival analysis. In the group receiving PD-1/PD-L1 inhibitor treatment, the cutoff values of YTHDF1 and YTHDF2 were 30 and 20, respectively.
In the adenocarcinoma group not receiving PD-1/PD-L1 inhibitor treatment, the immunohistochemical expression of YTHDF1 or YTHDF2 was correlated with better overall survival (p = 0.023, Figure 4A and p = 0.023, Figure 4C, respectively). In the squamous cell carcinoma group not receiving PD-1/PD-L1 inhibitor treatment, the immunohistochemical expression of YTHDF1 or YTHDF2 showed a trend toward better overall survival but was not statistically significant (p = 0.062, Figure 4B and p = 0.097, Figure 4D, respectively). In multivariate analysis, YTHDF1 or YTHDF2 immunohistochemical expression was an independent favorable prognostic marker for overall survival in adenocarcinoma patients (hazard ratio (HR) = 0.418, p = 0.001 and HR = 0.449, p = 0.001, respectively; Table 2). In Kaplan Meier plotter analysis, the group with high YTHDF1 mRNA expression showed better overall survival than the group with low YTHDF1 mRNA expression from adenocarcinoma or squamous cell carcinoma (p < 0.01, Figure 4E and p = 0.037, Figure 4F, respectively). The group with high YTHDF2 mRNA expression was also correlated with better overall survival in adenocarcinoma (p < 0.01, Figure 4G), although there was no difference in survival rate according to the level of YTHDF2 mRNA in squamous cell carcinoma (p = 0.89, Figure 4H).
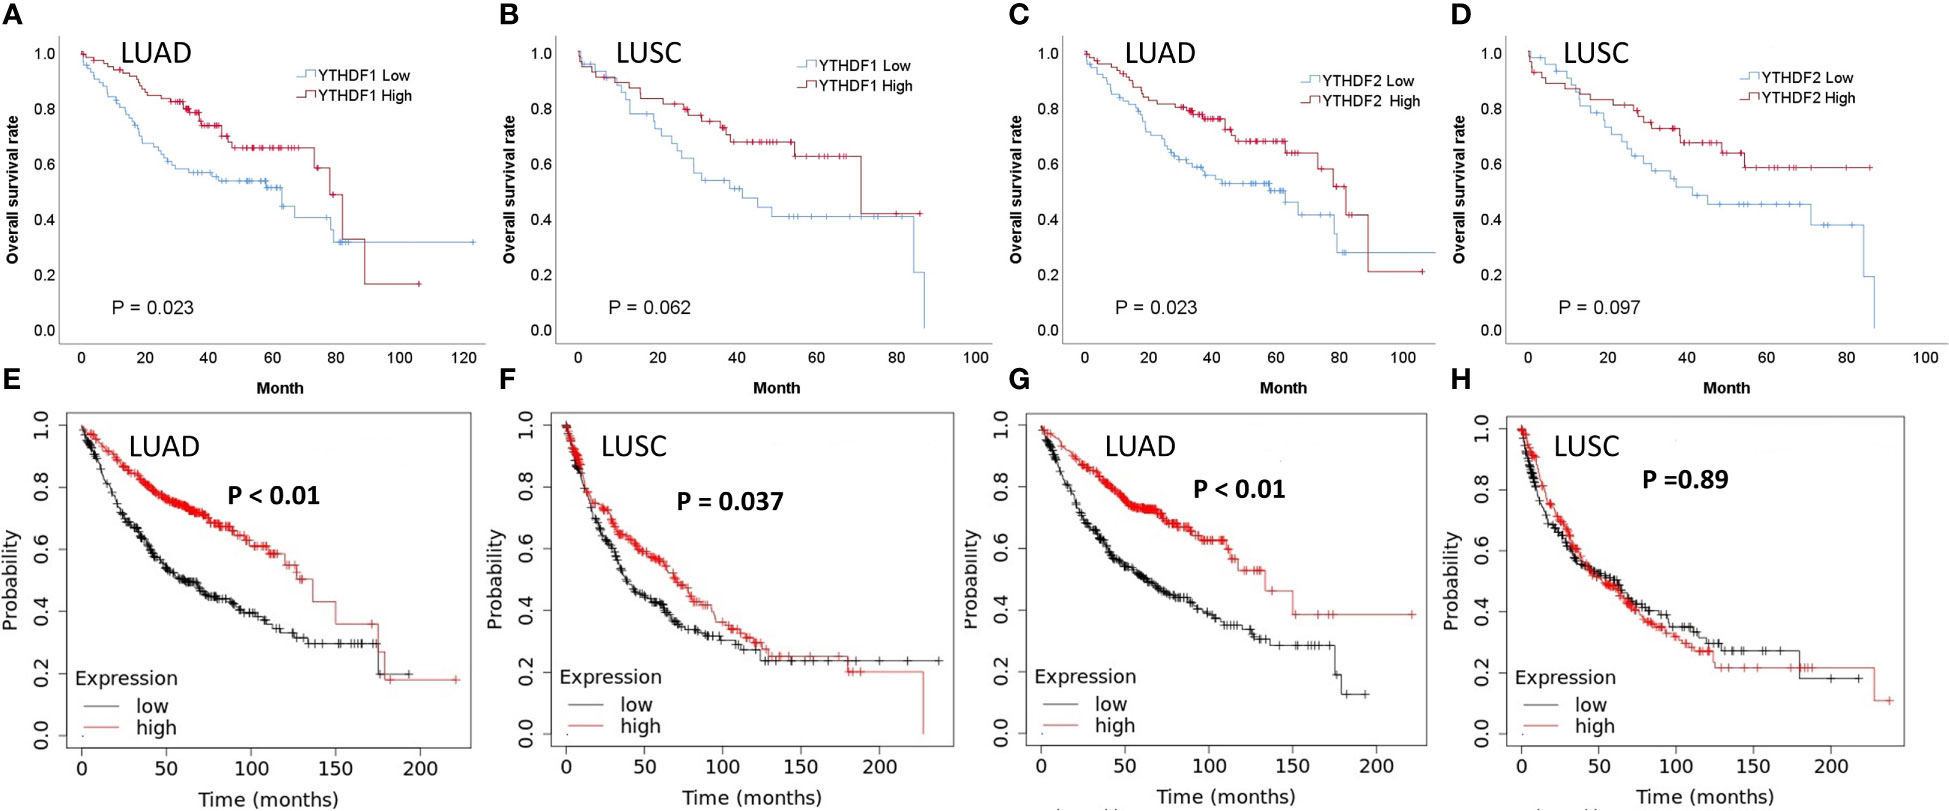
Figure 4 Survival analyses according to YTHDF1 and YTHDF2 expression in patients not receiving PD-1/PD-L1 inhibitors. (A) Overall survival (OS) and immunohistochemical expression of YTHDF1 in lung adenocarcinoma (LUAD). (B) OS and immunohistochemical expression of YTHDF1 in lung squamous cell carcinoma (LUSC). (C) OS and immunohistochemical expression of YTHDF2 in LUAD. (D) OS and immunohistochemical expression of YTHDF2 in LUSC. (E) OS and mRNA expression of YTHDF1 in LUAD. (F) OS and mRNA expression of YTHDF1 in LUSC. (G) OS and mRNA expression of YTHDF2 in LUAD. (H) OS and mRNA expression of YTHDF2 in LUSC.
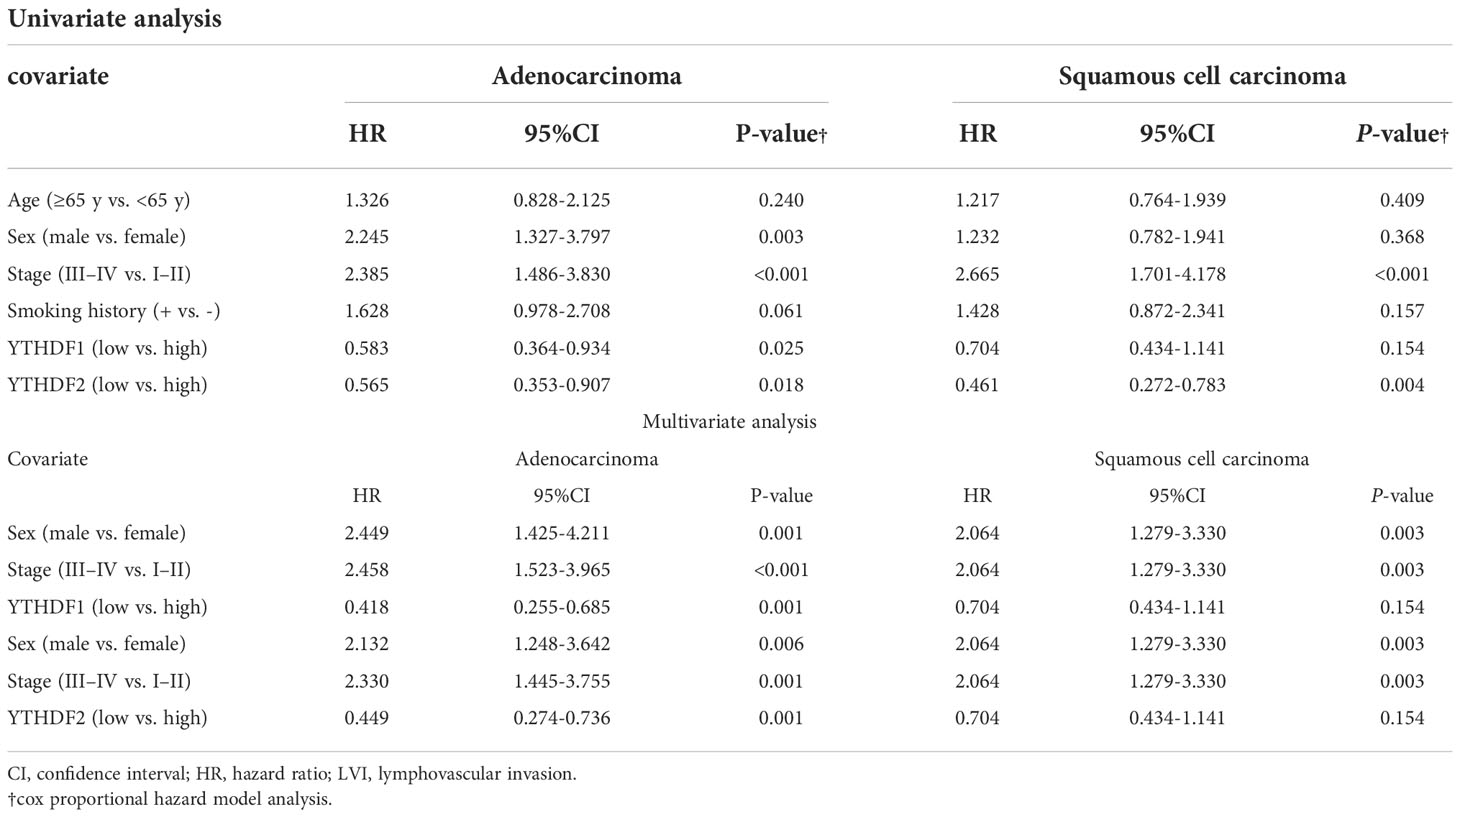
Table 2 Univariate and multivariate analyses of overall survival in immunohistochemical data of non-treatment group of PD1/PDL1 Inhibitors.
We evaluated the predictive roles of YTHDF1, YTHDF2, and clinicopathologic variables on the response to PD-1/PD-L1 blockade. In univariate analysis, the group with low YTHDF1 expression was statistically more likely to respond to the PD-1/PD-L1 inhibitor than the group with high YTHDF1 expression (p = 0.003, Table 3). In multivariate analysis, the expression of YTHDF1 was an independent predictor for PD-1/PD-L1 blockade (p = 0.024, odd ratio (OR) = 0.189). Low expression of YTHDF2 was also statistically more likely to respond to PD-1/PD-L1 inhibitors in univariate analysis (p = 0.013, Table 3). In multivariate analysis, the expression of YTHDF2 was an independent predictor for PD-1/PD-L1 blockade (p = 0.031, OR = 0.196). We then performed survival analyses in the groups receiving PD-1/PD-L1 inhibitor treatment. The group with low YTHDF1 immunohistochemical expression had better progression-free survival and overall survival than the group with high YTHDF1 expression; however, there were not statistically significant (p = 0.154, Supplementary Figure 2A and p = 0.494, Supplementary Figure 2B, respectively). The immunohistochemical expression of YTHDF2 was also not correlated with progression-free survival or overall survival rate (p = 0.9, Supplementary Figure 2C and p = 0.967, Supplementary Figure 2D, respectively). We provided the immunhistochemical data of the PD-1 inhibitor treatment group and non-treatment group in the form of Supplementary material Datasheet 1 (treatment group) and Supplementary material Datasheet 2 (non-treatment group).
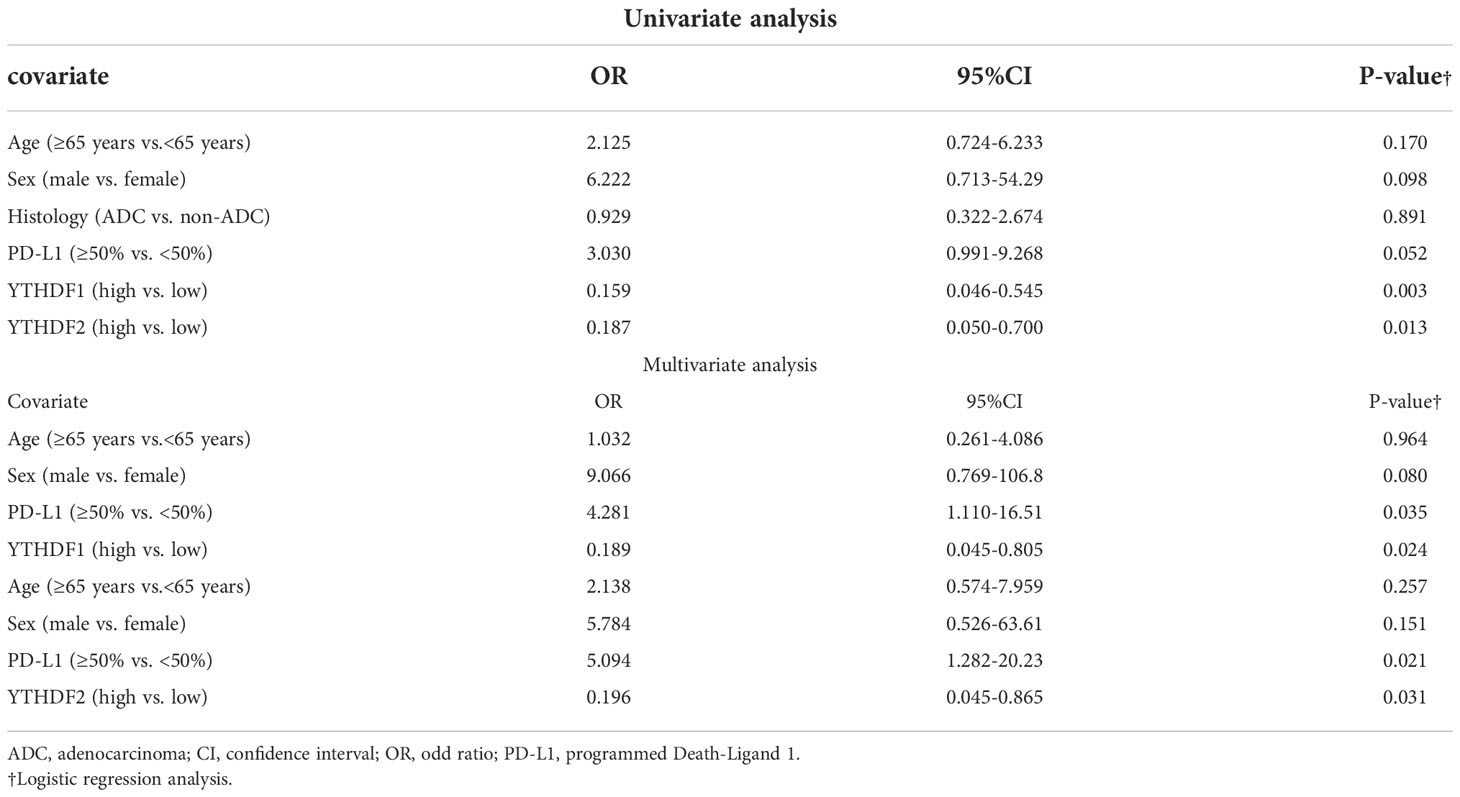
Table 3 Univariate and multivariate logistic regression analysis for predicting clinical response to PD-1/PD-L1 blockade.
GSEA was performed using mRNA data obtained from TCGA. In lung adenocarcinoma, the low YTHDF1 group was mainly enriched in immunity-related signaling pathways (allograft rejection, IL6-JAK-STAT3 signaling, inflammatory response, and IL2-STAT5 signaling) (Table 4). In lung squamous cell carcinoma, the low YTHDF1 group was also mainly enriched in immunity-related signaling pathways (allograft rejection, IL2-STAT5 signaling, inflammatory response, IL6-JAK-STAT3 signaling, and TNFA signaling via NFKB and interferon gamma response). In lung adenocarcinoma, the low YTHDF2 group was mainly enriched in immunity-related signaling pathways (inflammatory response, IL6-JAK-STAT3 signaling, allograft rejection, and IL2-STAT5 signaling). In lung squamous cell carcinoma, there was no immune-related gene set related to YTHDF2.
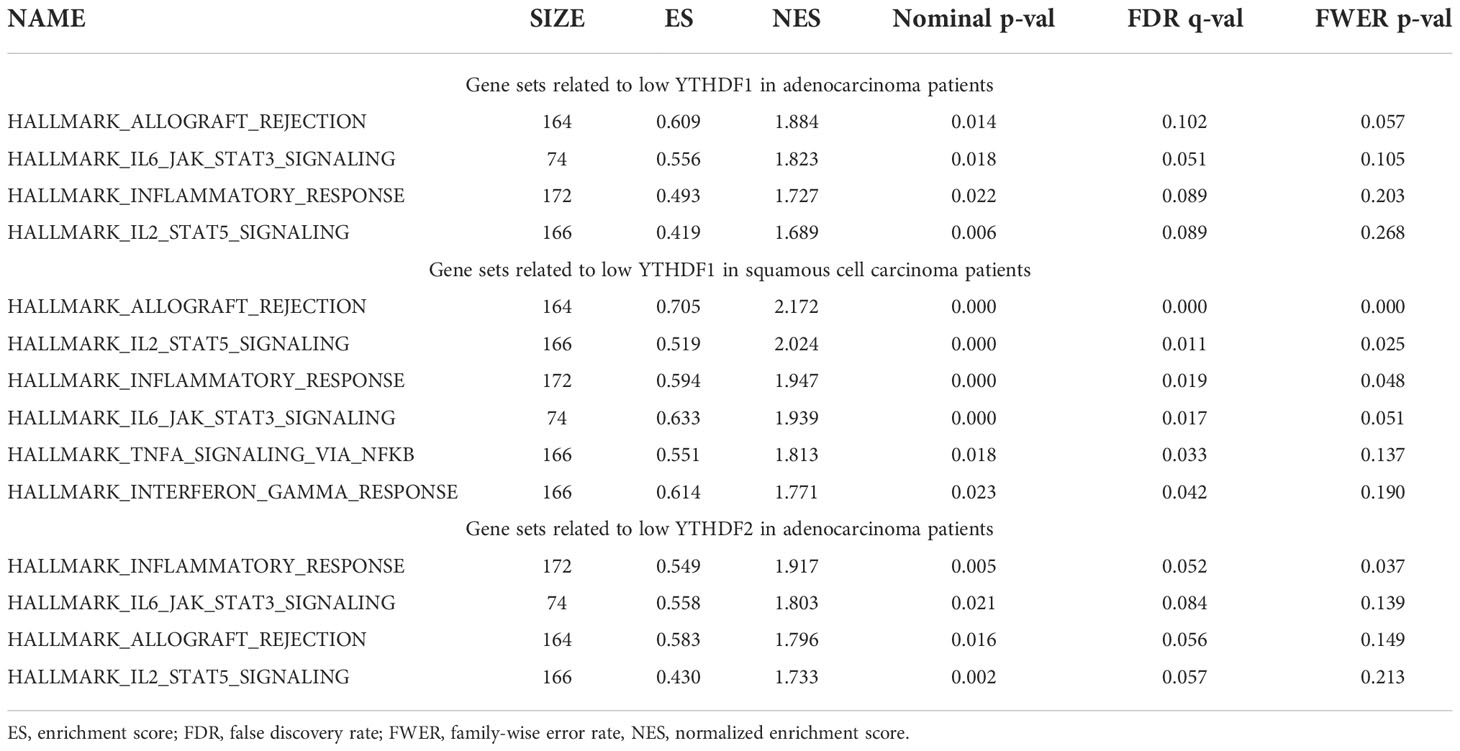
Table 4 Immune-related gene sets in GSEA.
We then performed correlation analysis between YTHDF1, YTHDF2, and immune checkpoints using mRNA expression data. In lung adenocarcinoma, YTHDF1 is significantly negatively correlated with PD-L1, PD-1, PD-L2, CTLA-4, TIGIT, VISTA, and TIM3 (Table 5). In lung squamous cell carcinoma, YTHDF1 is significantly negatively correlated with PD-L1, PD-1, PD-L2, CTLA-4, TIGIT, VISTA, and TIM3. YTHDF2 is significantly negatively correlated with PD-L1, PD-1, PD-L2, CTLA-4, TIGIT, LAG3, VISTA, and TIM3 in lung adenocarcinoma. In lung squamous cell carcinoma, YTHDF2 is significantly negatively associated with PD-L1 and PD-L2.
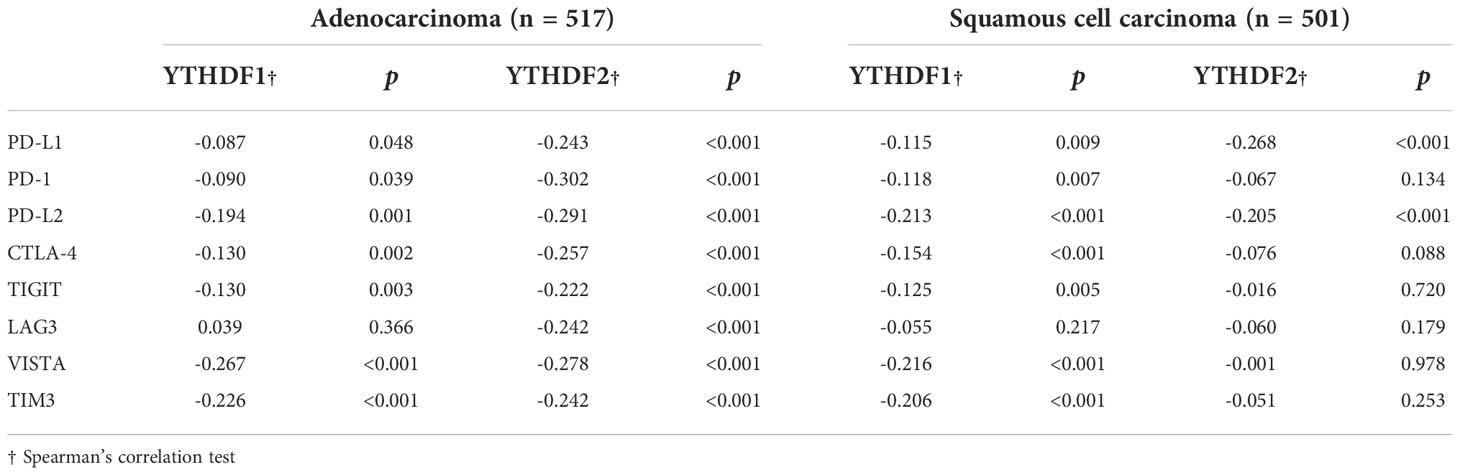
Table 5 Correlations between YTHDF1, YTHDF2 and immune checkpoints in mRNA expression data.
Protein expression of YTHDF1 or YTHDF2 was negatively correlated with CD8- and CD4-positive T cells, but positively correlated with Treg cells. The mRNA data also showed that the level of YTHDF1 was negatively correlated with CD8 and CD4 expression. In GSEA, low YTHDF1 mRNA expression was confirmed to be closely related to the immune-related pathway. The expression of YTHDF1 showed a negative correlation with most immune checkpoints. High YTHDF1 expression was associated with better prognosis. However, groups with low YTHDF1 or YTHDF2 expression were more likely to respond to PD-1/PD-L1 inhibitors than groups with high YTHDF1 expression. These results indicate that the low YTHDF1 and YTHDF2 groups are immune-inflamed tumors, also named “hot tumors.” Hot tumors are generally known to respond better to immunotherapy (25, 26). As expected, the low YTHDF1 and low YTHDF2 groups responded better to PD-1/PD-L1 inhibitor treatment. The expression of YTHDF1 or YTHDF2 in NSCLC can be a good predictive biomarker for PD-1/PD-L1 inhibitor.
m6A methylation plays important roles in regulating mRNA splicing, export, localization, translation, and stability (9). Only a few previous studies have reported on the relationship between YTHDF1 and cancer. Zhao et al. reported that YTHDF1 expression was associated with poor clinical outcomes in patients with hepatocellular carcinoma (27). Nishizawa et al. reported that the c-Myc oncogene promoted YTHDF1 expression and the knockdown of YTHDF1 resulted in the suppression of cell proliferation and sensitization to anticancer drugs in colorectal cancer (28). YTHDF2 is also a reader protein and plays an important role in regulating mRNA stability (29). High expression of YTHDF2 in ovarian cancer induces tumor progression (30). YTHDF2 is known to inhibit hepatocellular carcinoma cell proliferation and growth by inhibiting EGFR mRNA stability (31).
Han et al. reported that knockout of YTHDF1 resulted in higher levels of CD8+ T-cells and NK cells in melanoma and colon cancer mouse models (15). The knockout of YTHDF1 induced an increase in PD-L1 expression (15). In a melanoma cancer mouse model, tumor regression was found more frequently in anti-PD-L1-treated YTHDF1 knockout mice than in anti-PD-L1-treated wild-type mice (15). Our study also revealed that low expression of YTHDF1 was correlated with CD8 and CD4 protein or mRNA expression. Previous studies have shown that high CD4+ or CD8+ cells are associated with better responses to PD-1/PD-L1 blocking therapy. Before PD-1/PD-L1 blockade treatment, high level of peripheral blood CD4+ cells was associated with long-term survival (32). The transcriptome signature of PD-1 high CD8+ T cells showed a better prognosis in multiple cancers that underwent immune checkpoint inhibitor therapy (33). In our study, the expression of YTHDF1 was positively correlated with FOXP3. Treg cells are immunosuppressive and downregulate the induction and proliferation of effector T cells (34). Treg cells also play an important role in PD-1/PD-L1 therapy. Because Treg cells proliferate after PD-1/PD-L1 blockade, hyperprogression occurs during PD-1/PD-L1 blockade (35). Non-responders to PD-1/PD-L1 blocking therapy usually show an increase in PD-1 in Treg (36). The response was better when the ratio of tumor-infiltrating PD-1+CD8+T cells was higher than that of PD-1+Treg cells (36). The CD8 and CD4 high and FOXP3 low profile seen in the low YTHDF1 group indicates immune hot tumors and is a key factor in the response to PD-1/PD-L1 inhibitor.
In our study, YTHDF1 showed no difference in immune profile and prognosis according to cell type, although YTHDF2 showed a significant difference. In adenocarcinoma, YTHDF2 was negatively correlated with CD4 and CD8 and positively correlated with FOXP3 in protein and mRNA analysis. In squamous cell carcinoma, YTHDF2 showed a negative correlation with CD8 in protein analysis, but there were no correlations among YTHDF2, CD3, CD8, and FOXP3 in mRNA analysis. In GSEA of squamous cell carcinoma, there were no immune-related gene sets associated with YTHDF2. However, four immune-associated gene sets related to YTHDF2 were found in adenocarcinoma. In adenocarcinoma, all eight immune checkpoints showed a negative relationship with YTHDF2, but only two immune checkpoints were negatively correlated in squamous cell carcinoma. In Kaplan Meier plotter analysis, high YTHDF2 is associated with a better prognosis in adenocarcinoma, but YTHDF2 is not associated with prognosis in squamous cell carcinoma. Because YTHDF2 expression does not affect the immune profile of squamous cell carcinoma, there is no difference in survival rate.
In GSEA, the low YTHDF1 group was correlated with several immune-related pathways including IL2-STAT5 signaling, IL6-JAK-STAT3 signaling, and TNFA signaling via NFKB and interferon gamma response. The low YTHDF2 group was also associated with IL2-STAT5 and IL6-JAK-STAT3 signaling pathways. The association between immune-related pathways and PD-1/PD-L1 inhibitors has been reported several times in the past. IL2-STAT5 immune signatures are known to predict reactivity to PD-1/PD-L1 inhibitors (37). The IL-6/JAK1 pathway induces PD-L1 Y112 phosphorylation, leading to cancer immune evasion (38). TNF-α promotes PD-L1 expression in human prostate and colon cancer cells (39). The IFN-γ-related mRNA profile is a biomarker for PD-1 inhibitors that are currently attracting attention (40, 41).
High YTHDF1 or YTHDF2 expression was associated with better prognosis in immunohistochemistry and mRNA data sets. High YTHDF1 or YTHDF2 expression groups showed low immune checkpoint expression. Because immune checkpoints expressed on tumor cells protect tumor cells from attack by local immunity, the higher is the expression of immune checkpoints, the worse is the prognosis (42, 43). When treating with PD-1/PD-L1 inhibitor, the higher is the expression of immune checkpoints, the better is the expected response to treatment. In our low YTHDF1 or YTHDF2 expression group, immune checkpoint expression is high, indicating a good response to the PD-1/PD-L1 inhibitor. Similar to YTHDF1 and YTHDF2, PD-L1 expression is a poor prognostic factor in NSCLC (44, 45); however, the higher is the expression of PD-L1, the higher is the response rate to PD-1/PD-L1 inhibitor (4).
Our study had some limitations. First, ours was a retrospective observational study with a relatively small sample size. Second, we used an immunohistochemical method. However, immunohistochemistry has limitations regarding standardization, reliability, and reproducibility (46). Third, YTHDF1 or YTHDF2 expression was a predictive marker of response to PD-1/PD-L1 inhibitor but had no correlation with prognosis. Because the number of patients receiving PD-1/PD-L1 inhibitor was small (59 patients), our results need to be verified in a larger study. Forth, we performed immunohistochemical studies and mRNA studies on samples from different groups. Therefore, because protein or mRNA expression in the same sample is not compared, there is a limit to the analysis of protein and mRNA expression. Fifth, our study only confirmed the relationship between YTHDF1, YTHDF2, CD4, CD8, and FOXP3, however did not reveal which pathway YTHDF1, YTHDF2 affects on the tumor immune profile. Thereafter, experiments such as in vivo mouse models need to confirm our results and additional studies also determine how the YTHDF1 and YTHDF2 pathways affect immune profiles.
Low YTHDF1 or YTHDF2 expression shows an immune hot profile of high CD8, high CD4, and low FOXP3. GSEA confirmed that low YTHDF1 or YTHDF2 tumor expression reflects the gene set of immune hot tumors. Low YTHDF1 or YTHDF2 showed higher expression of immune checkpoints than high YTHDF1 or YTHDF2. YTHDF1 or YTHDF2 was a predictive marker of response to PD-1/PD-L1 inhibitors. The expression of YTHDF1 or YTHDF2 was associated with prognosis. YTHDF1 has an immune hot profile in both lung adenocarcinoma and squamous cell carcinoma, whereas YTHDF2 is only seen in adenocarcinoma.
The original contributions presented in the study are included in the article/Supplementary Material. Further inquiries can be directed to the corresponding author.
The studies involving human participants were reviewed and approved by the Institutional Review Board of Ajou University School of Medicine (AJIRB-BMR-KSP-19-416 and 2019-11-11). The ethics committee waived the requirement of written informed consent for participation.
Conception/design: YK. Provision of study material or patients: YK, J-HH, SH and HWL. Data analysis and interpretation: YK, J-HH, SH and HL. Manuscript writing: YK, J-HH, SH and HL. Final approval of manuscript: YK, J-HH, SH and HL. All authors contributed to the article and approved the submitted version.
This research was supported by the Basic Science Research Program through the National Research Foundation of Korea (NRF) funded by the Ministry of Science, ICT (NRF-2020R1A2C1100568 for YK).
The authors declare that the research was conducted in the absence of any commercial or financial relationships that could be construed as a potential conflict of interest.
All claims expressed in this article are solely those of the authors and do not necessarily represent those of their affiliated organizations, or those of the publisher, the editors and the reviewers. Any product that may be evaluated in this article, or claim that may be made by its manufacturer, is not guaranteed or endorsed by the publisher.
The Supplementary Material for this article can be found online at: https://www.frontiersin.org/articles/10.3389/fonc.2022.996634/full#supplementary-material
Supplementary Figure 1 | Correlation among YTHDF1, YTHDF2, CD4, CD8, and FOXP3 analyzed by immunohistochemistry in PD-1 inhibitor treatment groups. (A) YTHDF1 and CD4 in adenocarcinoma. (B) YTHDF1 and CD8 in adenocarcinoma. (C) YTHDF1 and FOXP3 in adenocarcinoma. (D) YTHDF2 and CD4 in adenocarcinoma. (E) YTHDF2 and CD8 in adenocarcinoma. (F) YTHDF2 and FOXP3 in adenocarcinoma. (G) YTHDF1 and CD4 in squamous cell carcinoma. (H) YTHDF1 and CD8 in squamous cell carcinoma. (I) YTHDF1 and FOXP3 in squamous cell carcinoma. (J) YTHDF2 and CD4 in squamous cell carcinoma. (K) YTHDF2 and CD8 in squamous cell carcinoma. (L) YTHDF2 and FOXP3 in squamous cell carcinoma.
Supplementary Figure 2 | Survival analyses according to YTHDF1 and YTHDF2 expression in patients receiving PD-1/PD-L1 inhibitors. (A) Progression-free survival and expression of YTHDF1. (B) Overall survival and expression of YTHDF1. (C) Progression-free survival and expression of YTHDF2. (D) Overall survival and expression of YTHDF2.
1. Garon EB, Rizvi NA, Hui R, Leighl N, Balmanoukian AS, Eder JP, et al. Pembrolizumab for the treatment of non-small-cell lung cancer. N Engl J Med (2015) 372(21):2018–28. doi: 10.1056/NEJMoa1501824
2. Gettinger S, Rizvi NA, Chow LQ, Borghaei H, Brahmer J, Ready N, et al. Nivolumab monotherapy for first-line treatment of advanced non-Small-Cell lung cancer. J Clin Oncol (2016) 34(25):2980–7. doi: 10.1200/jco.2016.66.9929
3. Herbst RS, Baas P, Kim DW, Felip E, Perez-Gracia JL, Han JY, et al. Pembrolizumab versus docetaxel for previously treated, PD-L1-positive, advanced non-small-cell lung cancer (KEYNOTE-010): a randomised controlled trial. Lancet (2016) 387(10027):1540–50. doi: 10.1016/s0140-6736(15)01281-7
4. Reck M, Rodriguez-Abreu D, Robinson AG, Hui R, Csoszi T, Fulop A, et al. Pembrolizumab versus chemotherapy for PD-L1-Positive non-Small-Cell lung cancer. N Engl J Med (2016) 375(19):1823–33. doi: 10.1056/NEJMoa1606774
5. Dempke WCM, Fenchel K, Dale SP. Programmed cell death ligand-1 (PD-L1) as a biomarker for non-small cell lung cancer (NSCLC) treatment-are we barking up the wrong tree? Transl Lung Cancer Res (2018) 7(Suppl 3):S275–s9. doi: 10.21037/tlcr.2018.04.18
6. Goodman AM, Kato S, Bazhenova L, Patel SP, Frampton GM, Miller V, et al. Tumor mutational burden as an independent predictor of response to immunotherapy in diverse cancers. Mol Cancer Ther (2017) 16(11):2598–608. doi: 10.1158/1535-7163.mct-17-0386
7. Tumeh PC, Harview CL, Yearley JH, Shintaku IP, Taylor EJ, Robert L, et al. PD-1 blockade induces responses by inhibiting adaptive immune resistance. Nature (2014) 515(7528):568–71. doi: 10.1038/nature13954
8. Prat A, Navarro A, Pare L, Reguart N, Galvan P, Pascual T, et al. Immune-related gene expression profiling after PD-1 blockade in non-small cell lung carcinoma, head and neck squamous cell carcinoma, and melanoma. Cancer Res (2017) 77(13):3540–50. doi: 10.1158/0008-5472.can-16-3556
9. Maity A, Das B. N6-methyladenosine modification in mRNA: machinery, function and implications for health and diseases. FEBS J (2016) 283(9):1607–30. doi: 10.1111/febs.13614
10. Li Z, Weng H, Su R, Weng X, Zuo Z, Li C, et al. FTO plays an oncogenic role in acute myeloid leukemia as a N(6)-methyladenosine RNA demethylase. Cancer Cell (2017) 31(1):127–41. doi: 10.1016/j.ccell.2016.11.017
11. Liu J, Eckert MA, Harada BT, Liu SM, Lu Z, Yu K, et al. m(6)A mRNA methylation regulates AKT activity to promote the proliferation and tumorigenicity of endometrial cancer. Nat Cell Biol (2018) 20(9):1074–83. doi: 10.1038/s41556-018-0174-4
12. Chen XY, Zhang J, Zhu JS. The role of m(6)A RNA methylation in human cancer. Mol Cancer (2019) 18(1):103. doi: 10.1186/s12943-019-1033-z
13. Shi Y, Fan S, Wu M, Zuo Z, Li X, Jiang L, et al. YTHDF1 links hypoxia adaptation and non-small cell lung cancer progression. Nat Commun (2019) 10(1):4892. doi: 10.1038/s41467-019-12801-6
14. Wang X, Zhao BS, Roundtree IA, Lu Z, Han D, Ma H, et al. N(6)-methyladenosine modulates messenger RNA translation efficiency. Cell (2015) 161(6):1388–99. doi: 10.1016/j.cell.2015.05.014
15. Han D, Liu J, Chen C, Dong L, Liu Y, Chang R, et al. Anti-tumour immunity controlled through mRNA m(6)A methylation and YTHDF1 in dendritic cells. Nature (2019) 566(7743):270–4. doi: 10.1038/s41586-019-0916-x
16. Sheng H, Li Z, Su S, Sun W, Zhang X, Li L, et al. YTH domain family 2 promotes lung cancer cell growth by facilitating 6-phosphogluconate dehydrogenase mRNA translation. Carcinogenesis (2020) 41(5):541–50. doi: 10.1093/carcin/bgz152
17. Huang CS, Zhu YQ, Xu QC, Chen S, Huang Y, Zhao G, et al. YTHDF2 promotes intrahepatic cholangiocarcinoma progression and desensitises cisplatin treatment by increasing CDKN1B mRNA degradation. Clin Transl Med (2022) 12(6):e848. doi: 10.1002/ctm2.848
18. Guo W, Tan F, Huai Q, Wang Z, Shao F, Zhang G, et al. Comprehensive analysis of PD-L1 expression, immune infiltrates, and m6A RNA methylation regulators in esophageal squamous cell carcinoma. Front Immunol (2021) 12:669750. doi: 10.3389/fimmu.2021.669750
19. Tsuchiya K, Yoshimura K, Inoue Y, Iwashita Y, Yamada H, Kawase A, et al. YTHDF1 and YTHDF2 are associated with better patient survival and an inflamed tumor-immune microenvironment in non-small-cell lung cancer. Oncoimmunology (2021) 10(1):1962656. doi: 10.1080/2162402x.2021.1962656
20. Eisenhauer EA, Therasse P, Bogaerts J, Schwartz LH, Sargent D, Ford R, et al. New response evaluation criteria in solid tumours: revised RECIST guideline (version 1.1). Eur J Cancer (2009) 45(2):228–47. doi: 10.1016/j.ejca.2008.10.026
21. McCarty KS Jr., Szabo E, Flowers JL, Cox EB, Leight GS, Miller L, et al. Use of a monoclonal anti-estrogen receptor antibody in the immunohistochemical evaluation of human tumors. Cancer Res (1986) 46(8 Suppl):4244s–8s.
22. Cerami E, Gao J, Dogrusoz U, Gross BE, Sumer SO, Aksoy BA, et al. The cBio cancer genomics portal: an open platform for exploring multidimensional cancer genomics data. Cancer Discovery (2012) 2(5):401–4. doi: 10.1158/2159-8290.Cd-12-0095
23. Subramanian A, Tamayo P, Mootha VK, Mukherjee S, Ebert BL, Gillette MA, et al. Gene set enrichment analysis: a knowledge-based approach for interpreting genome-wide expression profiles. Proc Natl Acad Sci U.S.A. (2005) 102(43):15545–50. doi: 10.1073/pnas.0506580102
24. Győrffy B, Surowiak P, Budczies J, Lánczky A. Online survival analysis software to assess the prognostic value of biomarkers using transcriptomic data in non-small-cell lung cancer. PloS One (2013) 8(12):e82241. doi: 10.1371/journal.pone.0082241
25. Bruni D, Angell HK, Galon J. The immune contexture and immunoscore in cancer prognosis and therapeutic efficacy. Nat Rev Cancer (2020) 20(11):662–80. doi: 10.1038/s41568-020-0285-7
26. Sharma P, Hu-Lieskovan S, Wargo JA, Ribas A. Primary, adaptive, and acquired resistance to cancer immunotherapy. Cell (2017) 168(4):707–23. doi: 10.1016/j.cell.2017.01.017
27. Zhao X, Chen Y, Mao Q, Jiang X, Jiang W, Chen J, et al. Overexpression of YTHDF1 is associated with poor prognosis in patients with hepatocellular carcinoma. Cancer biomark (2018) 21(4):859–68. doi: 10.3233/cbm-170791
28. Nishizawa Y, Konno M, Asai A, Koseki J, Kawamoto K, Miyoshi N, et al. Oncogene c-myc promotes epitranscriptome m(6)A reader YTHDF1 expression in colorectal cancer. Oncotarget (2018) 9(7):7476–86. doi: 10.18632/oncotarget.23554
29. Fu Y, Luo GZ, Chen K, Deng X, Yu M, Han D, et al. N6-methyldeoxyadenosine marks active transcription start sites in chlamydomonas. Cell (2015) 161(4):879–92. doi: 10.1016/j.cell.2015.04.010
30. Li J, Wu L, Pei M, Zhang Y. YTHDF2, a protein repressed by miR-145, regulates proliferation, apoptosis, and migration in ovarian cancer cells. J Ovarian Res (2020) 13(1):111. doi: 10.1186/s13048-020-00717-5
31. Zhong L, Liao D, Zhang M, Zeng C, Li X, Zhang R, et al. YTHDF2 suppresses cell proliferation and growth via destabilizing the EGFR mRNA in hepatocellular carcinoma. Cancer Lett (2019) 442:252–61. doi: 10.1016/j.canlet.2018.11.006
32. Kagamu H, Kitano S, Yamaguchi O, Yoshimura K, Horimoto K, Kitazawa M, et al. CD4(+) T-cell immunity in the peripheral blood correlates with response to anti-PD-1 therapy. Cancer Immunol Res (2020) 8(3):334–44. doi: 10.1158/2326-6066.Cir-19-0574
33. Yang Z, Deng Y, Cheng J, Wei S, Luo H, Liu L. Tumor-infiltrating PD-1(hi)CD8(+)-T-Cell signature as an effective biomarker for immune checkpoint inhibitor therapy response across multiple cancers. Front Oncol (2021) 11:695006. doi: 10.3389/fonc.2021.695006
34. Bettelli E, Carrier Y, Gao W, Korn T, Strom TB, Oukka M, et al. Reciprocal developmental pathways for the generation of pathogenic effector TH17 and regulatory T cells. Nature (2006) 441(7090):235–8. doi: 10.1038/nature04753
35. Kamada T, Togashi Y, Tay C, Ha D, Sasaki A, Nakamura Y, et al. PD-1(+) regulatory T cells amplified by PD-1 blockade promote hyperprogression of cancer. Proc Natl Acad Sci U.S.A. (2019) 116(20):9999–10008. doi: 10.1073/pnas.1822001116
36. Kumagai S, Togashi Y, Kamada T, Sugiyama E, Nishinakamura H, Takeuchi Y, et al. The PD-1 expression balance between effector and regulatory T cells predicts the clinical efficacy of PD-1 blockade therapies. Nat Immunol (2020) 21(11):1346–58. doi: 10.1038/s41590-020-0769-3
37. Abbas H, Alfayez M, Garcia-Manero G, Ravandi F, Kadia TM, Dinardo CD, et al. IL2-STAT5 immune signatures to predict responses to PD-1 inhibition and azacitidine treatment in acute myeloid leukemia (AML): A subset analysis of a phase 2 study. J Clin Oncol (2019) 37(15_suppl):7041–. doi: 10.1200/JCO.2019.37.15_suppl.7041
38. Chan L-C, Li C-W, Xia W, Hsu J-M, Lee H-H, Cha J-H, et al. IL-6/JAK1 pathway drives PD-L1 Y112 phosphorylation to promote cancer immune evasion. J Clin Invest (2019) 129(8):3324–38. doi: 10.1172/JCI126022
39. Wang X, Yang L, Huang F, Zhang Q, Liu S, Ma L, et al. Inflammatory cytokines IL-17 and TNF-α up-regulate PD-L1 expression in human prostate and colon cancer cells. Immunol Lett (2017) 184:7–14. doi: 10.1016/j.imlet.2017.02.006
40. Ayers M, Lunceford J, Nebozhyn M, Murphy E, Loboda A, Kaufman DR, et al. IFN-γ–related mRNA profile predicts clinical response to PD-1 blockade. J Clin Invest (2017) 127(8):2930–40. doi: 10.1172/JCI91190
41. Cui C, Xu C, Yang W, Chi Z, Sheng X, Si L, et al. Ratio of the interferon-γ signature to the immunosuppression signature predicts anti-PD-1 therapy response in melanoma. NPJ Genom Med (2021) 6(1):7. doi: 10.1038/s41525-021-00169-w
42. Sounni NE, Noel A. Targeting the tumor microenvironment for cancer therapy. Clin Chem (2013) 59(1):85–93. doi: 10.1373/clinchem.2012.185363
43. Huber V, Camisaschi C, Berzi A, Ferro S, Lugini L, Triulzi T, et al. Cancer acidity: An ultimate frontier of tumor immune escape and a novel target of immunomodulation. Semin Cancer Biol (2017) 43:74–89. doi: 10.1016/j.semcancer.2017.03.001
44. Yu W, Hua Y, Qiu H, Hao J, Zou K, Li Z, et al. PD-L1 promotes tumor growth and progression by activating WIP and β-catenin signaling pathways and predicts poor prognosis in lung cancer. Cell Death Dis (2020) 11(7):506. doi: 10.1038/s41419-020-2701-z
45. Wang Y, Kim TH, Fouladdel S, Zhang Z, Soni P, Qin A, et al. PD-L1 expression in circulating tumor cells increases during radio(chemo)therapy and indicates poor prognosis in non-small cell lung cancer. Sci Rep (2019) 9(1):566. doi: 10.1038/s41598-018-36096-7
Keywords: non-small cell lung cancer, YTHDF1, YTHDF2, CD8, CD4, FOXP3
Citation: Koh YW, Han J-H, Haam S and Lee HW (2022) Prognostic and predictive value of YTHDF1 and YTHDF2 and their correlation with tumor-infiltrating immune cells in non-small cell carcinoma. Front. Oncol. 12:996634. doi: 10.3389/fonc.2022.996634
Received: 18 July 2022; Accepted: 07 November 2022;
Published: 21 November 2022.
Edited by:
Jun Zhang, University of Kansas Medical Center, United StatesReviewed by:
Rafal Peksa, Medical University of Gdansk, PolandCopyright © 2022 Koh, Han, Haam and Lee. This is an open-access article distributed under the terms of the Creative Commons Attribution License (CC BY). The use, distribution or reproduction in other forums is permitted, provided the original author(s) and the copyright owner(s) are credited and that the original publication in this journal is cited, in accordance with accepted academic practice. No use, distribution or reproduction is permitted which does not comply with these terms.
*Correspondence: Young Wha Koh, eW91bmd3aGE5NTU2QGdtYWlsLmNvbQ==
Disclaimer: All claims expressed in this article are solely those of the authors and do not necessarily represent those of their affiliated organizations, or those of the publisher, the editors and the reviewers. Any product that may be evaluated in this article or claim that may be made by its manufacturer is not guaranteed or endorsed by the publisher.
Research integrity at Frontiers
Learn more about the work of our research integrity team to safeguard the quality of each article we publish.