 Li-ting Wang
- 1The First Clinical College of Guangxi Medical University, Nanning, China
- 2Department of Pathology, The People’s Hospital of Guangxi Zhuang Autonomous Region, Nanning, China
- 3Department of Cell Biology and Genetics, Key Laboratory of Longevity and Agingrelated Diseases of Chinese Ministry of Education, School of Pre-Clinical Medicine, Guangxi Medical University, Nanning, China
Objective: This study aimed to investigate the role of ficolin-2 (FCN2) in the development and course of hepatocellular carcinoma (HCC) and to contribute to the evolution of innovative HCC therapeutics.
Methods: Oncomine, GEPIA (Gene Expression Profiling Interactive Analysis), TISIDB (Tumor Immune System Interactions and Drug Bank database), UALCAN (University of Alabama at Birmingham Cancer data analysis portal), UCSC (University of California, Santa Cruz), R package, the Kaplan–Meier technique, Cox regression analysis, LinkedOmics, Pearson’s correlation, and a nomogram were used to investigate the prognostic value of FCN2 in HCC. Co-expressed genes were screened. A protein–protein interaction network was created using the STRING database. Finally, immunohistochemistry was performed to establish the expression of FCN2 in HCC tissues. A pan-cancer study centered on HCC-related molecular analysis was also conducted to look for a link between FCN2 and immune infiltration, immune modulators, and chemokine receptors.
Results: In HCC tissues, the expression of FCN2 was observed to be lower than that in normal tissues. This was connected to the HCC marker alpha-fetoprotein, showing that FCN2 is involved in the development and progression of cancer. FCN2 may act through Staphylococcus aureus infection, lectins, and other pathways. Furthermore, at the immune level, the expression of FCN2 in HCC was associated with some immune cell infiltration, immunomodulators, and chemokine receptors.
Conclusion: FCN2 may be an immune checkpoint inhibitor for HCC, creating a breakthrough in the treatment of HCC.
Introduction
Liver cancer is a deadly tumor with a high fatality rate that is getting worse year after year (1). Serological tests for alpha-fetoprotein (AFP), alkaline phosphatase (ALP), alanine transferase (ALT), total bilirubin (T-BIL), total protein (TP), albumin (ALB), and hepatitis B surface antigen (HBsAg) are crucial for the diagnosis of liver cancer. However, the serum AFP test is the most sensitive method (2). The aberrant expression of AFP in liver cancer is a crucial determinant in clinical diagnosis and liver cancer prediction (3). In the clinical application of hepatocellular carcinoma (HCC), traditional diagnostic methods such as serum AFP have limited specificity and sensitivity (4), and current data show that there is no single biomarker for the diagnosis of HCC, especially in the inchoate stage of development (5). Therefore, specific biomarkers are expected to improve the prognosis of patients by improving the diagnosis of HCC, especially the early diagnosis of tumors (5).
One of these biomarkers is synthesized and discharged by hepatocytes within the human body. Ficolin-2 (FCN2) is an innate immune pattern recognition molecule that motivates the complement cascade and opsonizes miscellaneous pathogens (6). Transforming growth factor beta (TGF-β) helps FCN2 participate in the metastasis of HCC and in epithelial-to-mesenchymal transition (EMT). Low FCN2 levels have been associated with the aggressive metastatic features of HCC and therefore could be used as a predictive indicator for the disease-free survival (DFS) of HCC patients (7). Based on this assumption, we believe that FCN2 could be used as a biomarker in the early stages of liver cancer, but more research into the subject is required.
Previous studies have mostly focused on the aberrant expression of FCN2 in liver cancer (8). In this study, we not only provided a more comprehensive bioinformatics analysis but also obtained support from clinical experimental results. We started by screening genes using a network database, then performed prognostic analysis on the screened genes, and finally obtained the FCN2 gene required. Subsequently, a series of analyses were carried out on FCN2, such as pan-cancer analysis, differential expression analysis, clinicopathological analysis, and immune infiltration analysis. Finally, immunohistochemical samples obtained from the clinic were analyzed. Combining these methods, we have concluded that FCN2 could be an immune checkpoint inhibitor for liver cancer, which we hope will provide a breakthrough point in the cure of liver cancer.
Methods
Oncomine
The expression of FCN2 messenger RNA (mRNA) in liver cancer was investigated using the Oncomine 4.5 database (esophageal carcinoma, ESCA). Oncomine.org is the world’s largest oncogene chip database and is a data mining platform in general. A number of ESCA studies involving Cuichard liver cell carcinoma, Roessler liver cancer, and The Cancer Genome Atlas (TCGA) liver cancer research were dissected and data obtained. The expression of FCN2 in HCC and in normal tissues was then investigated. A related inquiry was carried out based on the comparison of the transcription results. The common values and multiples of p-values were as below: p < 0.01; multiple of difference, 1.5; gene arrangement, 10%; data type, mRNA.
GEPIA
The recently established interactive web server Gene Expression Profiling Interactive Analysis (GEPIA) (9, 10), which examines tumor and natural swatch sequencing expression data, was used to analyze the expression of FCN2 in liver cancer and normal liver tissues. GEPIA was also utilized to obtain the mRNA expression data of FCN2 in the liver cancer tissues in this study. A network analysis was then implemented. Gene expression profiles were obtained from 369 liver cancers and 50 normal cases.
Genome browser database at the University of California, Santa Cruz
The UCSC (University of California, Santa Cruz) database (https://genome.edu/) is one of the most widely used in biology. We used this database to download a single standardized global cancer dataset, and then retrieved and screened the gene expression data of FCN2 in each sample. To determine the expression differences between normal and tumor samples, R software (version 3.6.4) was used for analysis according to previous studies. The significance of the differences was determined using the unpaired Wilcoxon rank-sum and signed-rank tests. The gene expression data of FCN2 in each sample, as well as the gene sequences retrieved, were examined using the embryonic stem cell-specific (ECSC) dataset.
TISIDB
TISIDB (Tumor Immune System Interactions and Drug Bank database; http://cis.hku.hk/TISIDB/) is a tumor and immunity-related database that collects a variety of data. It can carry out a large number of special screenings of genes and report genes related to T-cell-mediated killing or immunotherapy. It also includes data from TCGA on the links between genes and their immunological functions in 30 different tumor types. The TISIDB database was used to look for a link between FCN2 expression and the liver cancer stage.
UALCAN data analysis
UALCAN (University of Alabama at Birmingham Cancer data analysis portal) (11, 12) draws on the TCGA database and employs the capacities of cancer data mining and online examination to analyze and handle data effectively. Besides identifying relevant genetic biomarkers, it also includes expression profile and survival analyses and can directly query related data in other databases using relevant links. In summary, this website can be used to efficiently mine and analyze TCGA data with simple operations. UALCAN was utilized to analyze the expression of FCN2 in normal and liver cancer tissues in this study.
Cancer Cell Line Encyclopedia
The Cancer Cell Line Encyclopedia (CCLE; https://sites.broadinstitute.org/ccle/) is a database of cancer cell lines maintained by the Broad Institute that includes relevant data on previous cell lines. By searching for cell lines, annotations, and genes on this website, the expression level of the specified gene in each tumor cell line can be determined.
cBioPortal
The cBioPortal (http://www.cbioportal.org) currently contains 225 cancer studies. Changes in the levels of FCN2 in the HCC samples from TCGA were analyzed using cBioPortal. The search parameters included mutations and mRNA expression. The OncoPrint tab displays the genetic mutation profile of each sample. Furthermore, the network shows the biological interaction network of FCN2 from the common pathway database using color coding and screening options grounded on the periodicity of each gene’s genome change, including neighboring genes that change more frequently. Kaplan–Meier plots were drawn to show that FCN2 gene mutations are associated with the overall survival (OS) of patients with HCC. A logarithmic rank test was performed to explain the survival curve.
Human Protein Atlas
Proteomics, transcriptomics, and systems biology data are used to map tissues, cells, and organs in the Human Protein Atlas (HPA) database (https://www.proteinatlas.org). This database can be used to assess the protein expression in tumor and normal tissues, as well as the OS of patients with tumors. We used the HPA database to obtain the immunochemistry data for related genes.
Search Tool for the Retrieval of Interacting Genes/Proteins
The Search Tool for the Retrieval of Interacting Genes/Proteins (STRING) database (https://www.string-db.org/) is an online database that investigates protein interactions that have already occurred. This website can assist in identifying key regulatory genes. This website’s supremacy stems from the fact that it contains the most species and interaction data. We created a protein–protein interaction (PPI) network for FCN2 using the STRING database. From the PPI network diagram, we found 10 fCN2-related genes. Furthermore, analyses using Gene Ontology (GO) and Kyoto Encyclopedia of Genes and Genomes (KEGG) pathways were conducted for FCN2 and the 10 genes discovered.
Immunohistochemistry
The expression of FCN2 was examined using immunohistochemistry. Samples were collected from 30 patients with liver cancer at the Guangxi Zhuang Autonomous Region’s People’s Hospital. The samples were paraffin-fixed, cut into serial sections, and incubated with rabbit ficolin-2/ficolin-B polyclonal antibody (bs-13162R; Bioss, Woburn, MA, USA) at 4°C overnight. The sections were then dyed with hematoxylin and eosin (HE). Every procedure was executed as per the instructions in the SP kit. The number of positively stained cells during immunohistochemical labeling was determined using the antigen content, distribution density, tag method, and susceptibility. The distribution density of the positive results increased with the increase of antibody content, and the color development was brighter. Blue was the negative marker, light yellow indicated a slightly positive mark, brownish yellow was the moderately positive marker, and dark brown was the highly positive marker. In general, the more strongly positive regions should be photographed.
We took several representative images using the OlymbusX21 microscope. ImageJ was then used to execute a general morphometric analysis of each image. The photic density and positive area data for normal and cancer tissues were procured by measuring the chosen dyeing region using the ImageJ parameter. The higher the optical density and the more positive the expression, the higher the average level. Finally, statistical methods were used to determine whether there was a difference in the FCN2 expression between the normal and cancer groups.
Kaplan–Meier plotter
The Kaplan–Meier plotter (13) is capable of assessing the correlation between the expression of all genes (mRNA, miRNA, and protein) and survival in more than 30,000 samples from 21 tumor types, including breast, ovarian, lung, and gastric cancer. Sources for the databases include the Gene Expression Omnibus (GEO), the European Genome–Phenome Archive (EGA), and TCGA. The primary purpose of the tool is the meta-analysis-based discovery and validation of survival biomarkers.
Statistical analysis
The Wilcoxon rank-sum test was used because normality monitoring made it clear that the specimen failed (p < 0.05). According to the Wilcoxon rank-sum test, the tumor was lower than normal, with a median difference of −0.084 between the two groups (−0.11 to 0.054). The diversity (p < 0.001) was statistically significant. Statistical analysis was executed with the R program (primarily ggplot2), with the following levels of significance: ns, p < 0.05, *p < 0.05, **p < 0.01, and ***p < 0.001.
Result
Screening datasets yielded differentially expressed genes
In this study, we wanted to determine whether there were any differences in the gene expression between liver cancer and robust liver tissues. The GSE45267, GSE87630, and GSE54236 datasets from the National Center for Biotechnology Information (NCBI) were chosen as being related to liver cancer. Differentially expressed genes (DEGs) were filtered out using bioinformatics and R analysis, and the RobustRankAggreg (RRA) algorithm was employed to determine 20 genes with unique downregulated expressions. In this study, the 20 downregulated genes were selected for further analysis (Figure 1). It was discovered that liver cancer tissues had lower levels of ANGPTL6, CFP, CLEC1B, CLEC4G, CLEC4M, COLEC10, CRHBP, CXCL12, DNASE1L3, FCN2, FCN3, GSTZ1, LCAT, NAT2, OIT3, RSPO3, VIPR1, STAB2, ECM1, and GPR128 expression compared to normal liver cells.
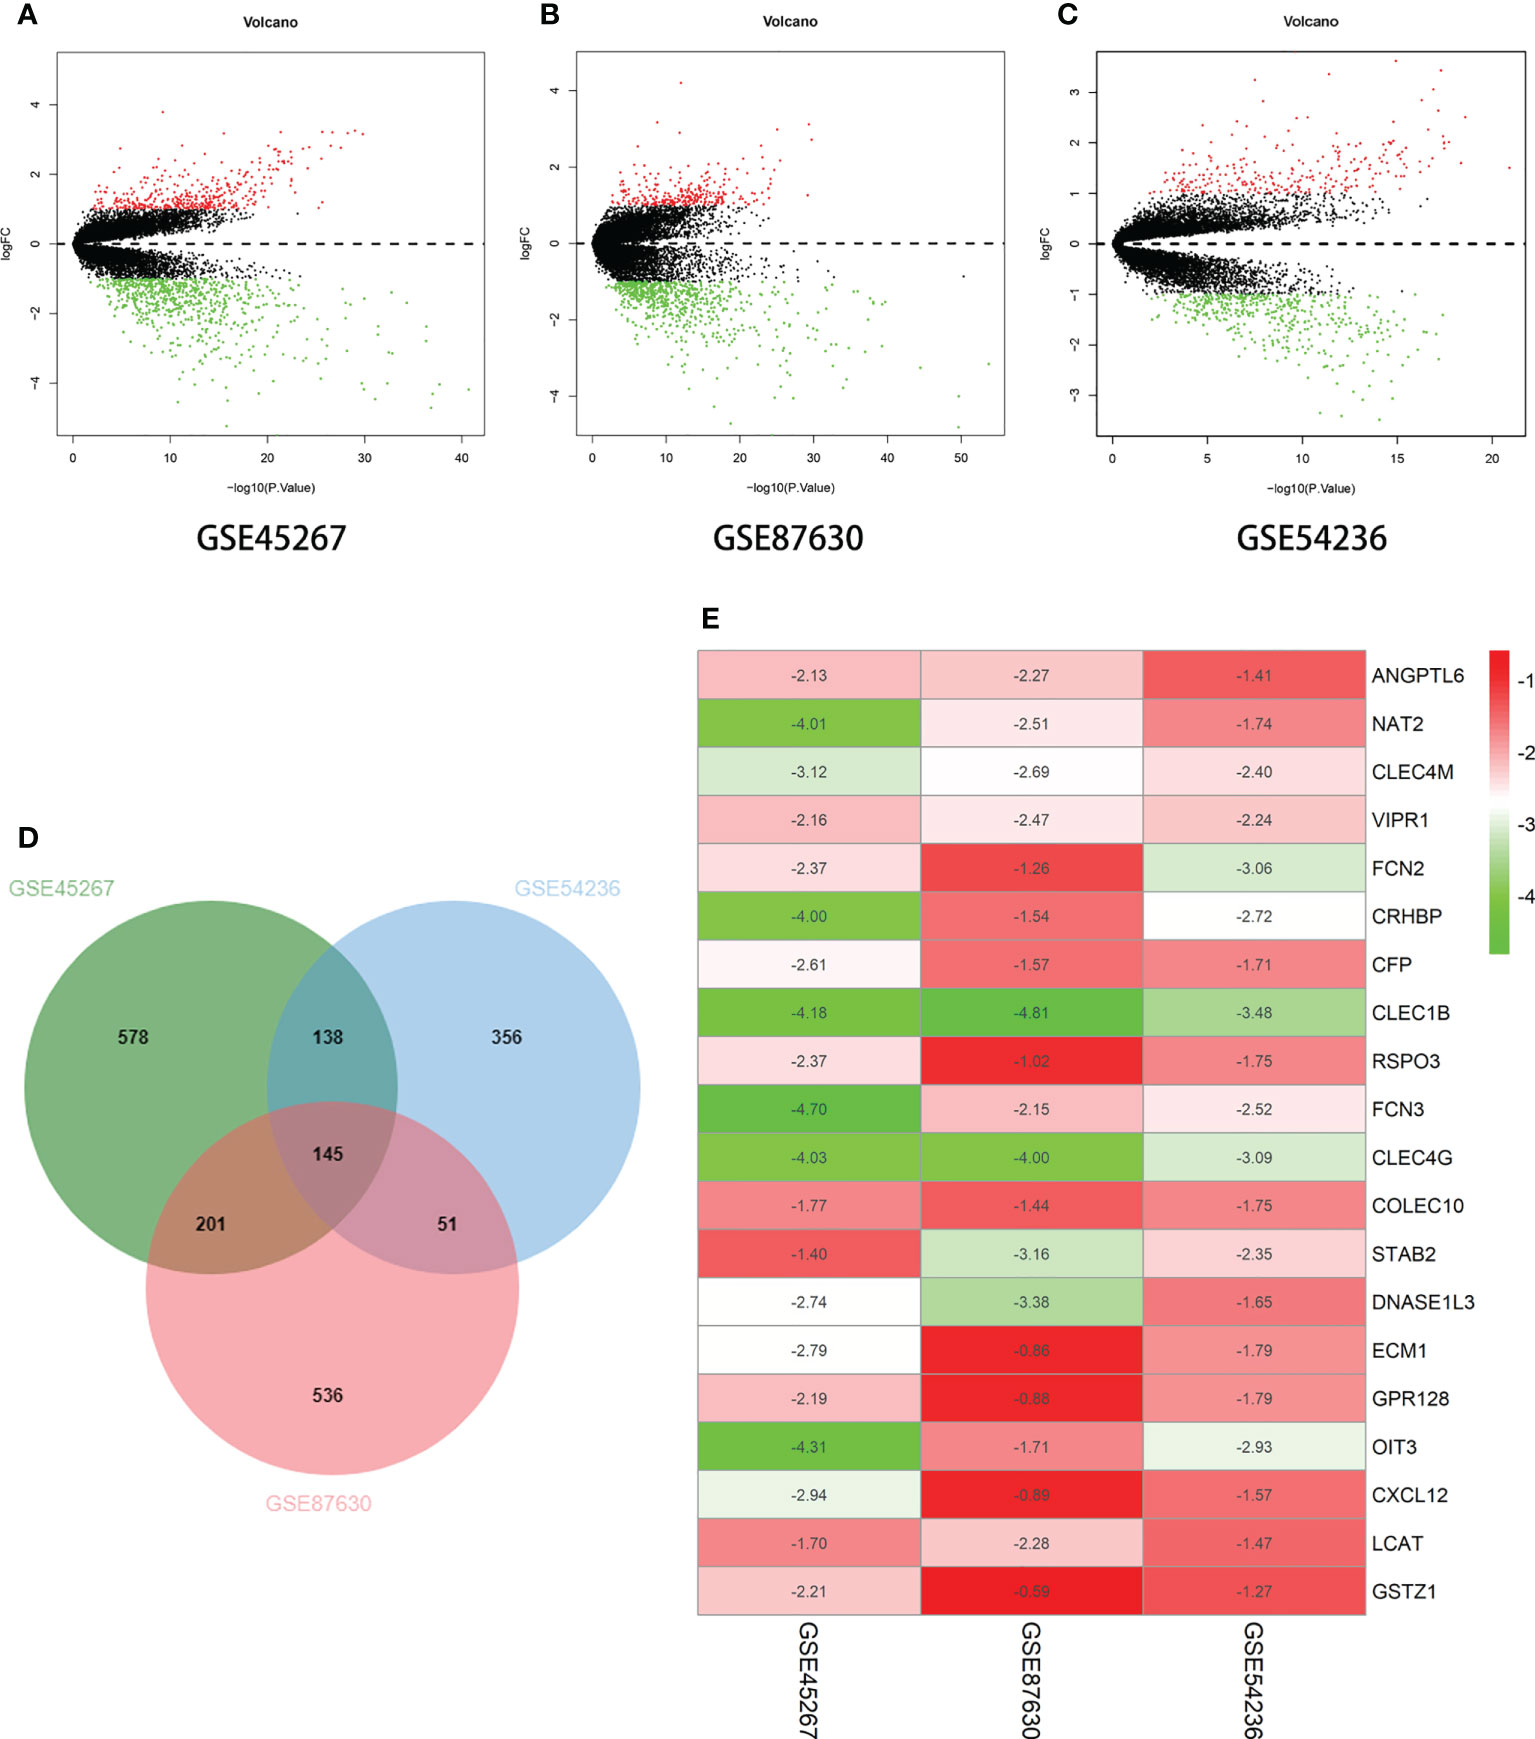
Figure 1 Differential expression of multiple genes in the three datasets. (A) GSE45267 dataset. (B) GSE87630 dataset. (C) GSE54236 dataset. (D) Identification of the significantly differentially expressed genes (DEGs) in hepatocellular carcinoma (HCC) in the GSE45267, GSE87630, and GSE54236 datasets established the intersection of the DEGs. (E) The 20 genes with significant downregulation obtained using the RobustRankAggreg (RRA) algorithm. Taking |logFc| > 1 as the boundary value, p < 0.05.
Expression levels of screened genes in liver cancer and normal liver tissues
The 17 extracted genes (ANGPTL6, CFP, CLEC1B, CLEC4G, CLEC4M, COLEC10, CRHBP, CXCL12, DNASE1L3, FCN2, FCN3, GSTZ1, LCAT, NAT2, OIT3, RSPO3, and VIPR1) were validated using the GEPIA2 (Gene Expression Profiling Interactive Analysis) database. STAB2 was not found, and the levels of GPR128 and ECM1 were not significant. In contrast to their expression in normal liver tissues, the retrieved genes were only slightly expressed in HCC tissue samples (Figure 2). This indicates that both the GEO and the TCGA database have confirmed that these genes are indeed significantly underexpressed in liver cancer.
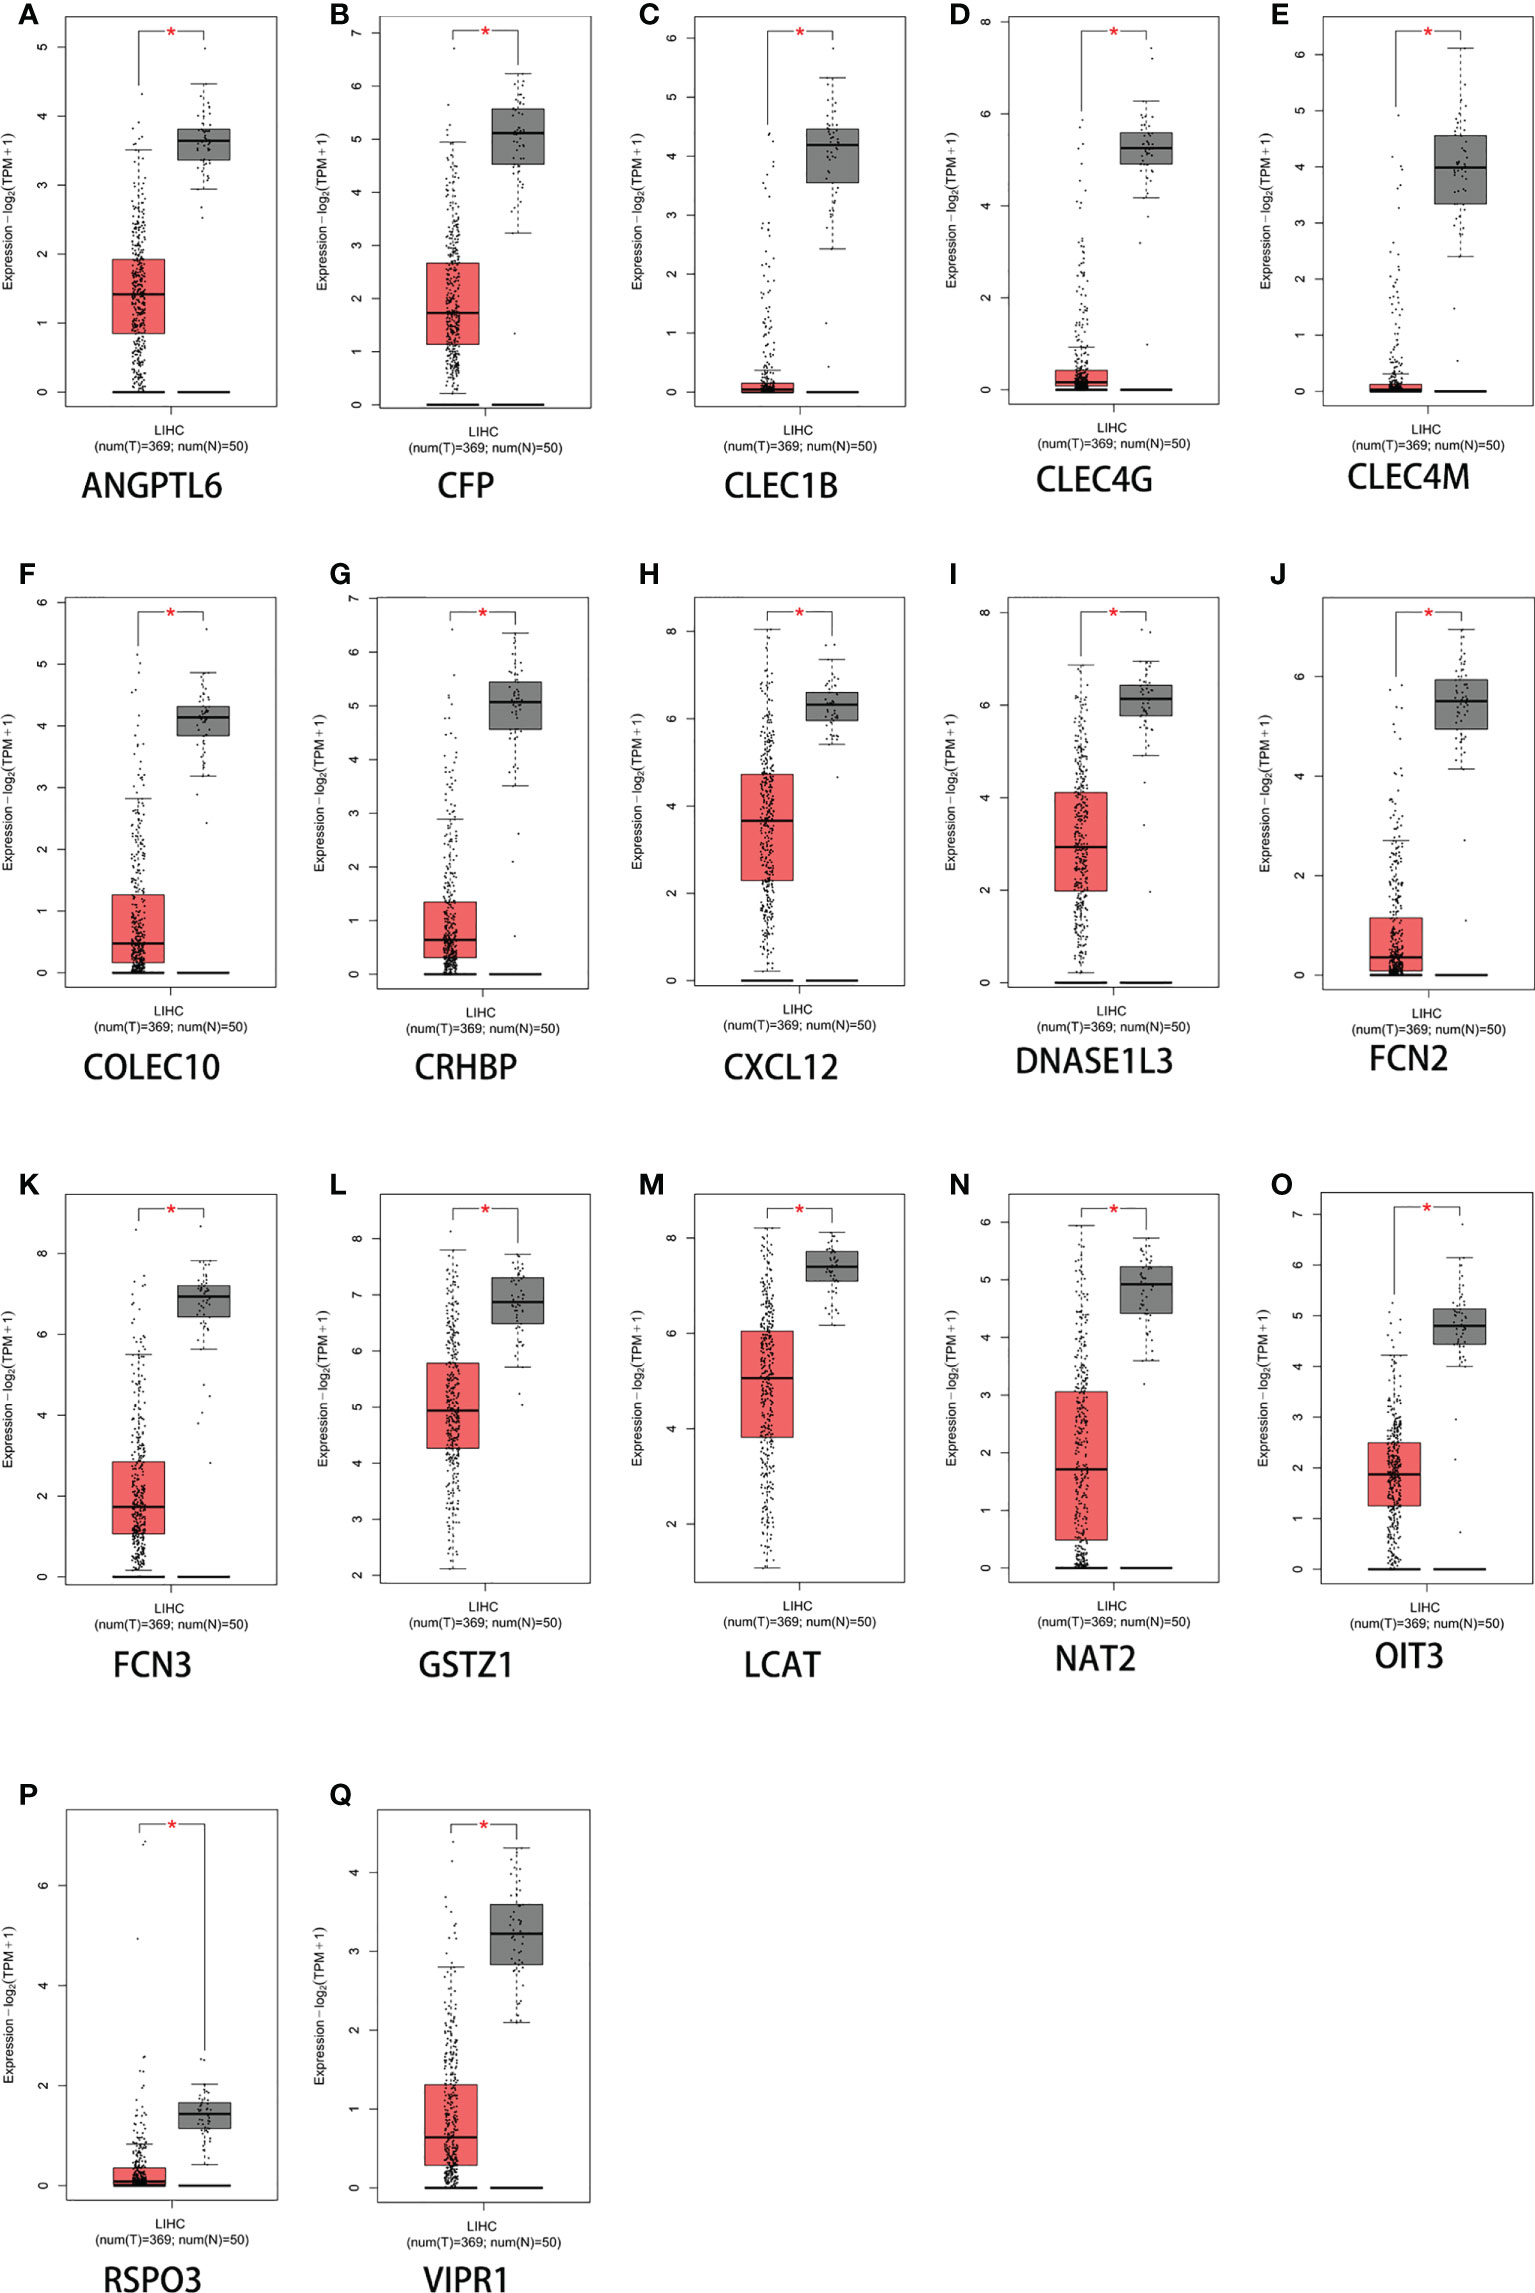
Figure 2 Expression levels of 17 genes based on GEPIA2 (Gene Expression Profiling Interactive Analysis web server). (A) ANGPTL6. (B) CFP. (C) CLEC1B. (D) CLEC4G. (E) CLEC4M. (F) COLEC10. (G) CRHBP. (H) CXCL12. (I) DNASE1L3. (J) FCN2. (K) FCN3. (L) GSTZ1. (M) LCAT. (N) NAT2. (O) OIT3. (P) RSPO3. (Q) VIPR1. *p < 0.05. The y-axis represents the relative log2 expression value (TPM + 1).
Assessment of the prognostic value of the screened genes in liver cancer and determination of the target gene FCN2
The Kaplan–Meier plotter database was used to determine and evaluate the prognostic value of 20 genes (p < 0.05). To ensure the simplicity of the experiment, genes that showed no statistical significance were eliminated. Finally, the genes ANGPTL6, CFP, CLEC1B, CLEC4G, CLEC4M, COLEC10, CRHBP, CXCL12, DNASE1L3, FCN2, FCN3, GSTZ1, LCAT, NAT2, OIT3, RSPO3, and VIPR1 were obtained (Figures 3A–Q). The PPI network of DEGs was affected and was analyzed using the STRING database (Figure 3R). Using the cell type Minimal Common Oncology Data Elements (mCODE), we identified the most important nodes and retrieved six central nodes (Figure 3S). Among them, FCN2 was a central node.
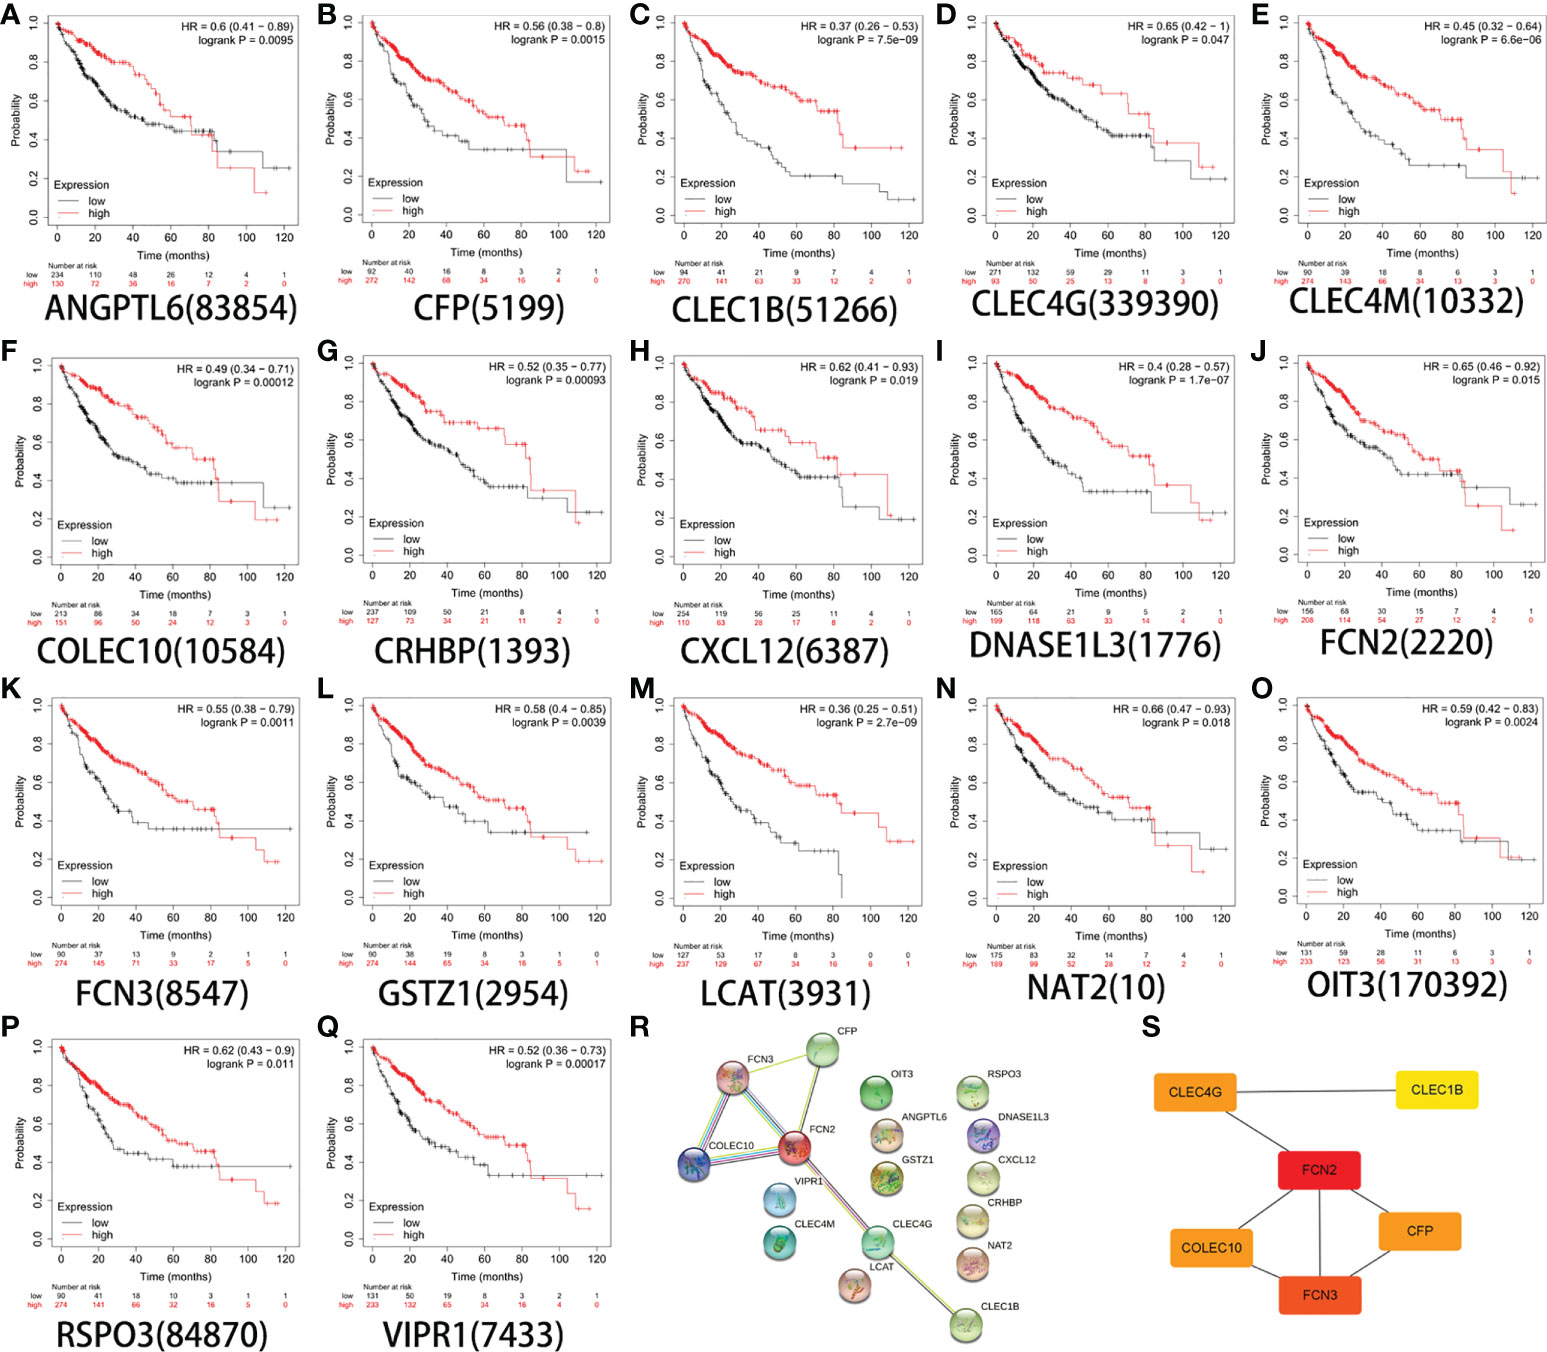
Figure 3 Survival analysis of 17 genes. (A) ANGPTL6. (B) CFP. (C) CLEC1B. (D) CLEC4G. (E) CLEC4M. (F) COLEC10. (G) CRHBP. (H) CXCL12. (I) DNASE1L3. (J) FCN2. (K) FCN3. (L) GSTZ1. (M) LCAT. (N) NAT2. (O) OIT3. (P) RSPO3. (Q) VIPR1. (R) Constructed protein–protein interaction (PPI) network of the important differentially expressed genes (DEGs) using STRING. (S) Use of the Cytoscape plug-in MCODE to select the most important module from the PPI network.
Expression of FCN2 in pan-cancer
The expression of FCN2 mRNA in various tumor tissues was investigated. The Oncomine database was used to examine the expression of FCN2 mRNA in various cancers and normal clinical samples (Figure 4A). A total of 639 datasets with a total of 78,661 samples were selected. The results showed that, in contrast to normal tissues, the mRNA expression of FCN2 is downregulated in leukemia and liver cancer, demonstrating that the transcription of FCN2 is tumor-specific.
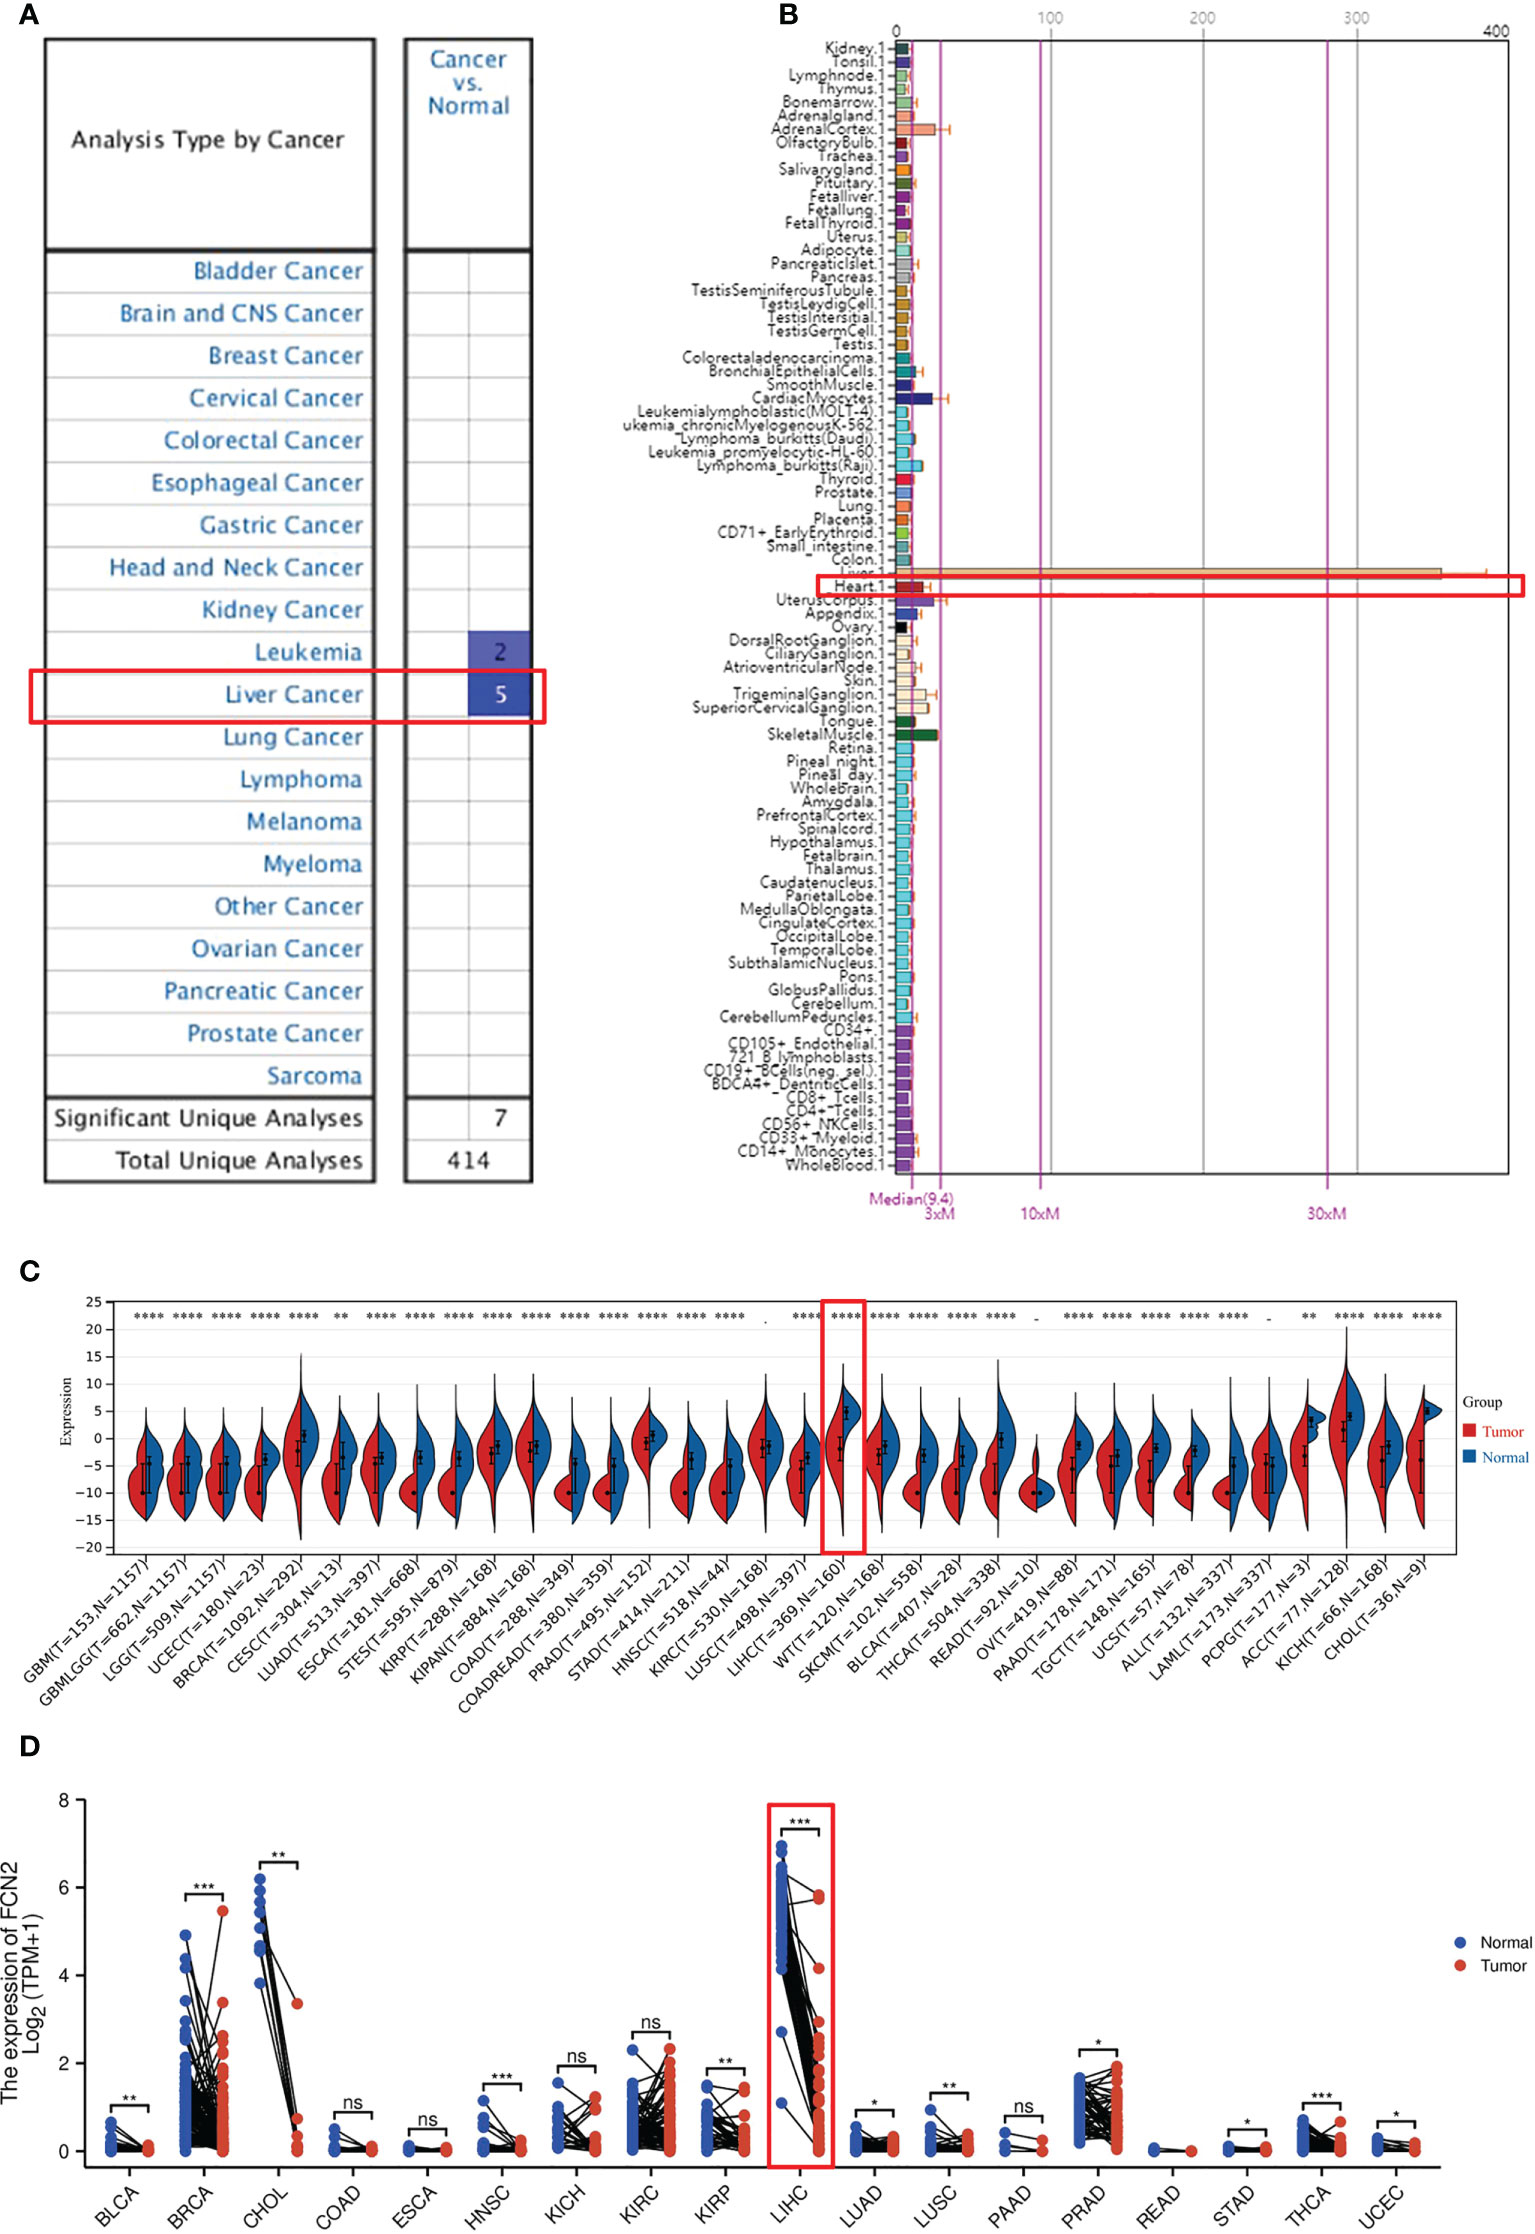
Figure 4 Pan-tissue expression of FCN2. (A) Pan-cancer expression of FCN2 in the Oncomine database. (B) Expression of FCN2 in normal tissues in the BioGPS database. (C) Pan-cancer expression of FCN2 in the UCSC (University of California, Santa Cruz) database. (D) Log2 transformation of the pan-cancer expression value of FCN2 in the UCSC database. *p < 0.05, **p < 0.01, ***p < 0.001, ****p < 0.0001, ns: not statistically significant.
The expression data of FCN2 in pan-cancer can be procured from the BioGPS database (Figure 4B). The expression data of the FCN2 gene in each sample (Figure 4C) were derived from a unified and standardized dataset from the UCSC. We also screened the following tissue sources: protopathic solid tumors, protopathic tumors, normal tissue, protopathic blood-derived cancer—bone marrow, and protopathic blood-derived cancer—peripheral blood samples. We then utilized R software to calculate the expression differences between normal and tumor tissues in each tumor (version 3.6.4). It was discovered that the expression levels in 31 malignancies were significantly downregulated, including glioblastoma (GBM), breast cancer (BRCA), cervical squamous cell carcinoma and endocervical adenocarcinoma (CESC), lung adenocarcinoma (LUAD), kidney renal papillary cell carcinoma (KIRP), colon adenocarcinoma (COAD), prostate adenocarcinoma (PRAD), liver hepatocellular carcinoma (LIHC), tenosynovial giant cell tumors (TGCT), and adenoid cystic carcinoma (ACC), utilizing unopposed Wilcoxon rank-sum and signed-rank monitoring. A log2(x + 0.001) transformation was also applied for each expression value (Figure 4D), and the statistical significance was determined using paired Wilcoxon signed-rank test.
Transcription levels of FCN2 in liver cancer and normal tissues
An Oncomine database search of the expression of FCN2 in diverse liver cancer studies produced three studies showing a lower expression of FCN2 in LIHC tissues compared to normal liver tissues (p = 1E−4, multiple of difference: 2) (Figures 5A–C).
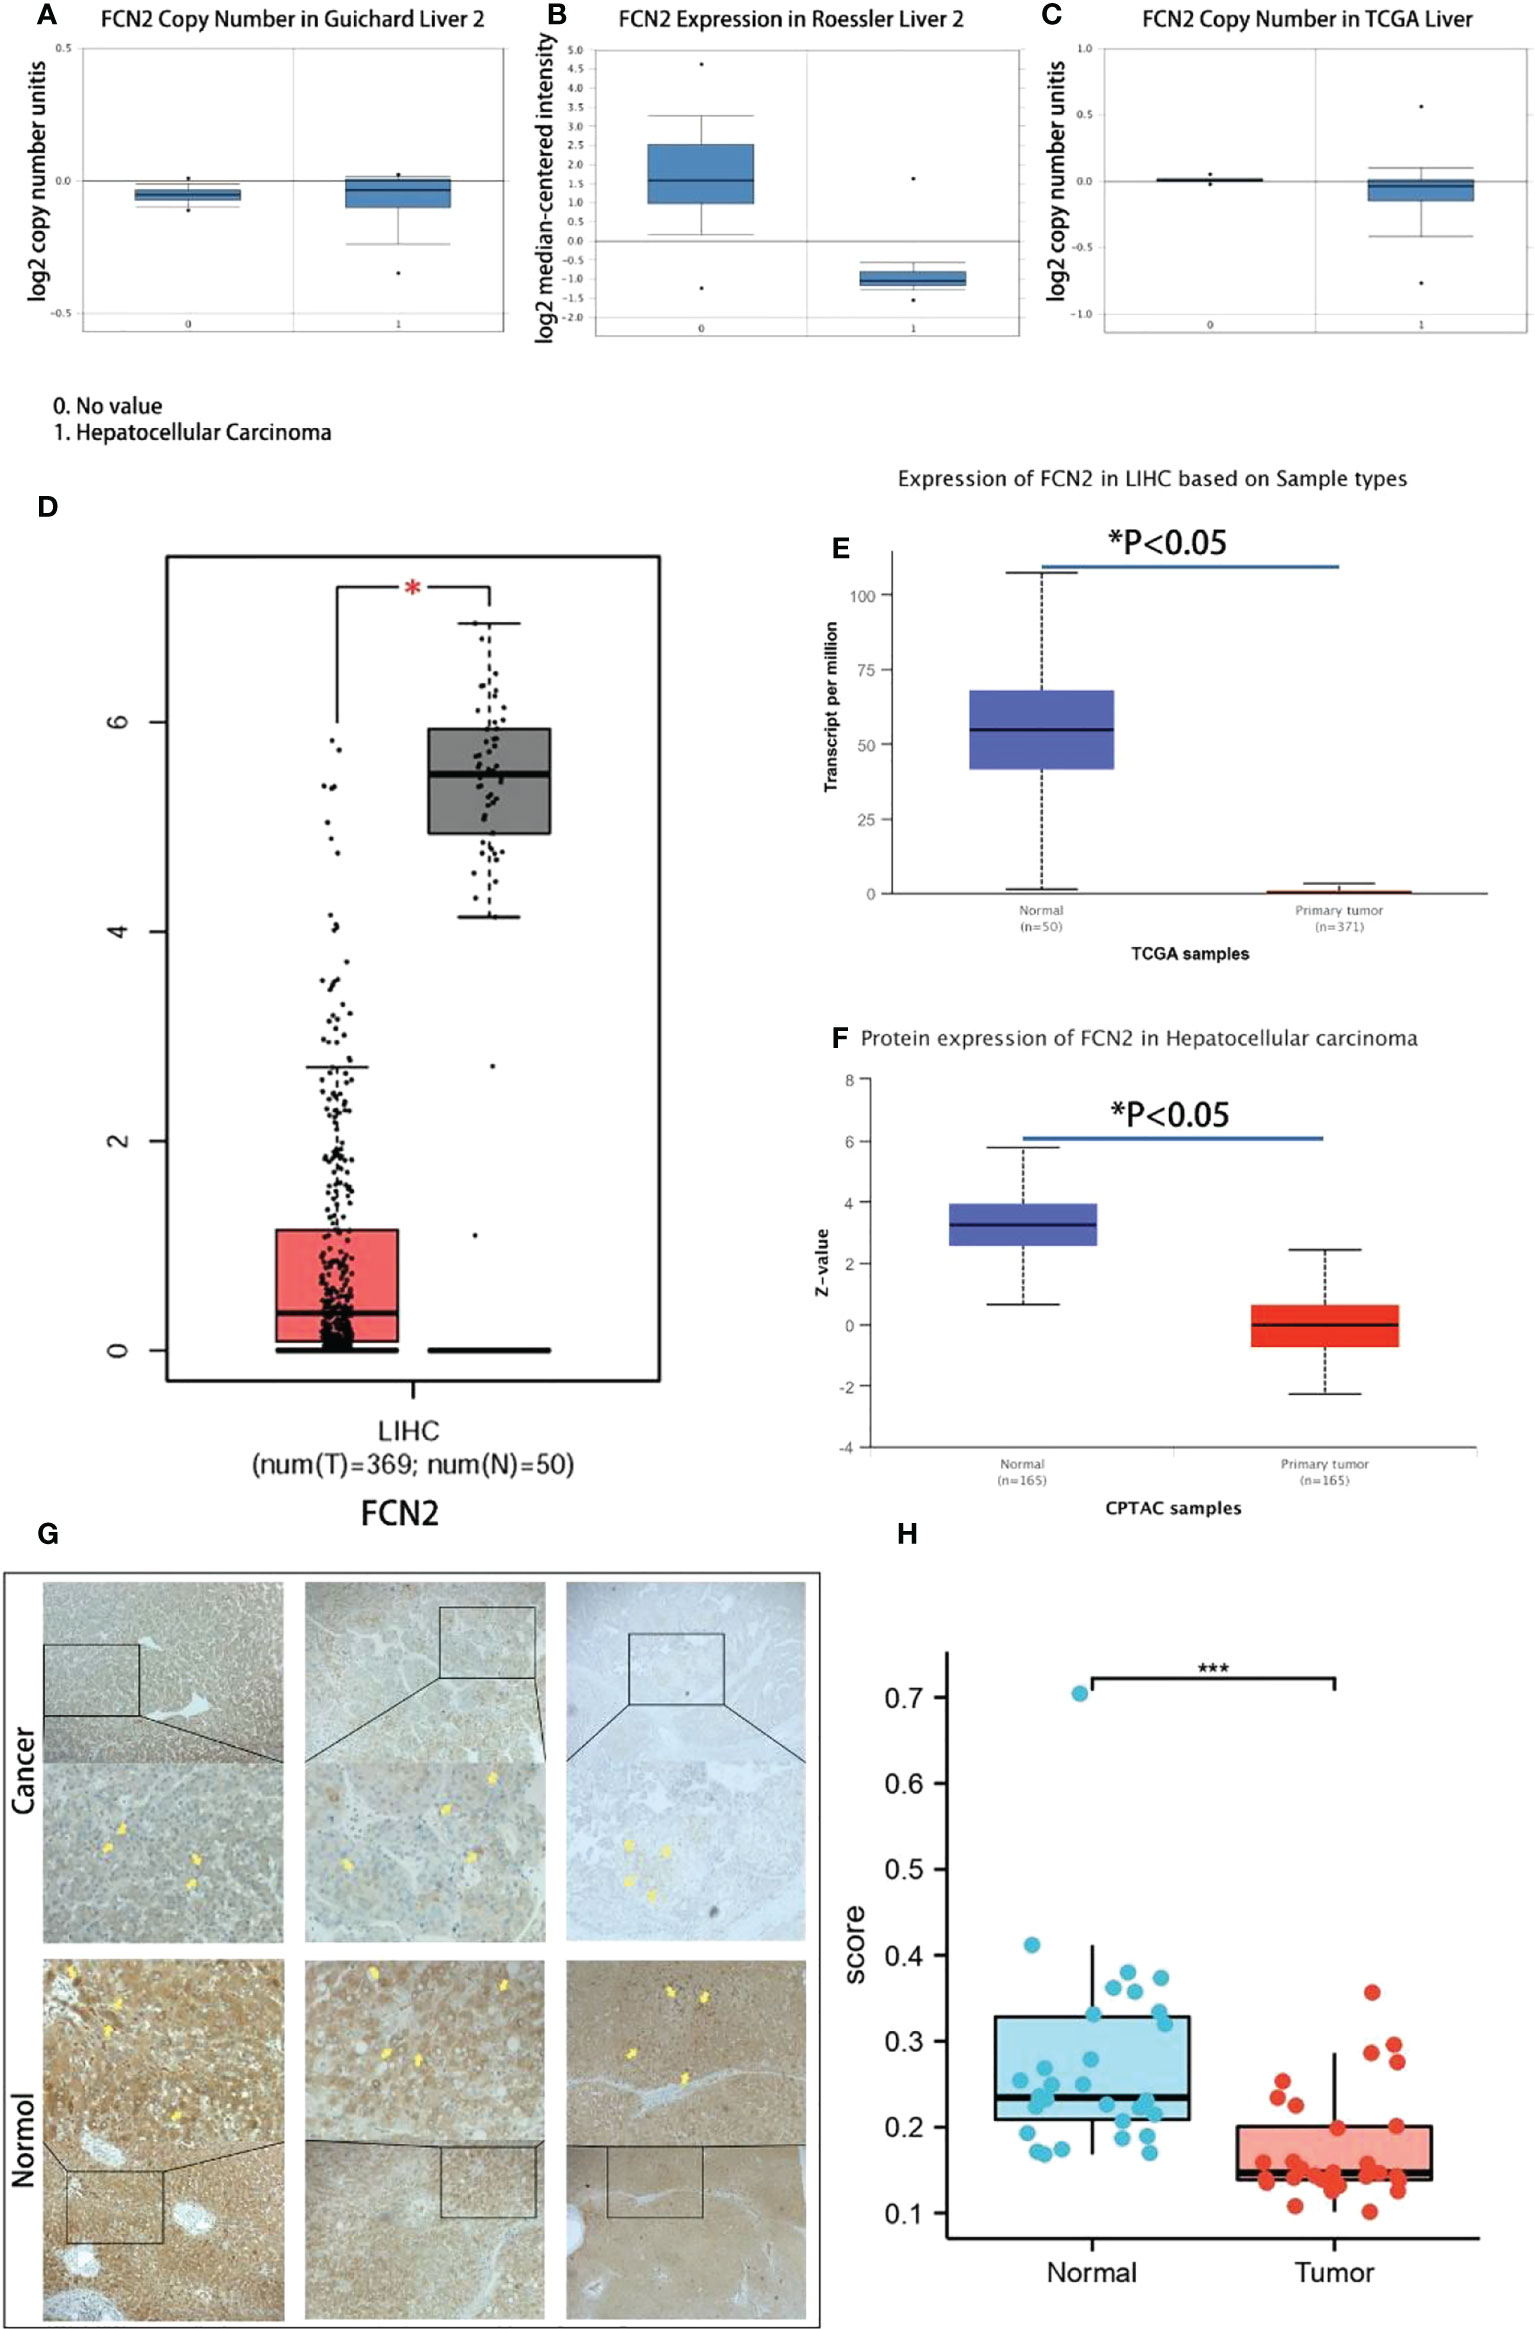
Figure 5 Transcription levels of FCN2 in liver cancer and normal tissues. (A–C) Expression differences of the FCN2 gene between liver cancer tissues and normal tissues in the Oncomine database. (D) FCN2 mRNA expression in liver cancer tissue and normal tissue based on the GEPIA2 database (TCGA tumors vs. TCGA normal). (E, F) FCN2 protein expression in hepatocellular carcinoma in the UALCAN database. (G) Part of the results of the immunohistochemistry experiments. (H) Average optical density of liver cancer tissues and adjacent tissues from 30 liver cancer patients. TCGA, The Cancer Genome Atlas. *p < 0.05, ***p < 0.001.
The transcription and translation results of FCN2 mRNA in 369 liver cancer and 50 normal liver tissues were acquired using the GEPIA2 database. The findings revealed that the mRNA and protein expressions of FCN2 were lower in liver cancer tissues than those in normal liver tissues in all cases (p < 0.05) (Figure 5D). To confirm these results in depth, we used the UALCAN online analysis tool to further analyze the FCN2 gene, the result of which was similar in that the expression level of FCN2 in HCC cells was markedly lessened compared to that in normal cells (Figures 5E, F).
Liver cancer samples from 30 patients were taken from the People’s Hospital of Guangxi Zhuang Autonomous Region and immunohistochemistry staining was performed. Each staining procedure followed a rigorous set of guidelines. Five fields of view were randomly chosen from each sample after staining, and the average optical density value was determined using ImageJ. SPSS 19.0 was used for statistical analysis (IBM Inc., Armonk, NY, USA).
The areas of positive staining were brown, and the microscopy results revealed that normal liver tissues had bigger areas of positive staining than did liver cancer tissues (Figure 5G). Normal liver tissues had an average positive area of 1,783,320.5318 m2 and an average optical density of 0.25662176264, while tumor tissues had an average positive area of 1,357,014.3320 m2 and an average optical density of 0.16741577631. The normal and tumor groups had significance values of 0.200 and 0.086, respectively, suggesting that the positive staining area followed a normal distribution. Analysis of the t-test results revealed a significance of 0.036 (0.05), suggesting that the two sets of data are quite dissimilar and that the positive staining zone of the cancer group is smaller than that of the normal group (Figure 5H). The expression of FCN2 mRNA in liver tumor cell lines was shown to be at a low level using RNA sequencing (RNAseq) (Attachment 1). Affymetrix analysis exhibited the expression of FCN2 mRNA in all tumor cell lines to be above 3.2. These studies have confirmed the significantly low expression of FCN2 in liver cancer tissues from different databases, as well as mRNA, protein, and clinical specimens.
Association of FCN2 expression and clinicopathological variables
As shown in (Attachment 2), the TCGA dataset yielded 1,374 clinical and gene expression data on primary cancers. The sample included data from 253 men and 121 women, with a median age of 61 years. The protein expression of FCN2 was found to be strongly associated with height (p = 0.024) and the AFP level (p = 0.004) in the correlation analysis.Other clinicopathological features showed no association with FCN2 expression. The downregulation of FCN2 in HCC was linked to height (p = 0.018) and the AFP level (p = 0.003) in the univariate analysis (Attachment 3).
To further verify the association between FCN2 and liver cancer, we analyzed the expression of the FCN2 gene in several markers using the R tool. The expression levels of FCN2 varied between the low- and high-AFP groups (p < 0.001) (Figures 6A–K). This indicates that FCN2 has certain clinical importance, whether from the high and low FCN2 expression groups (median) or the expression analysis of normal liver tissue and different liver cancer subgroups, and could be a complementary gene for AFP detection in liver cancer.
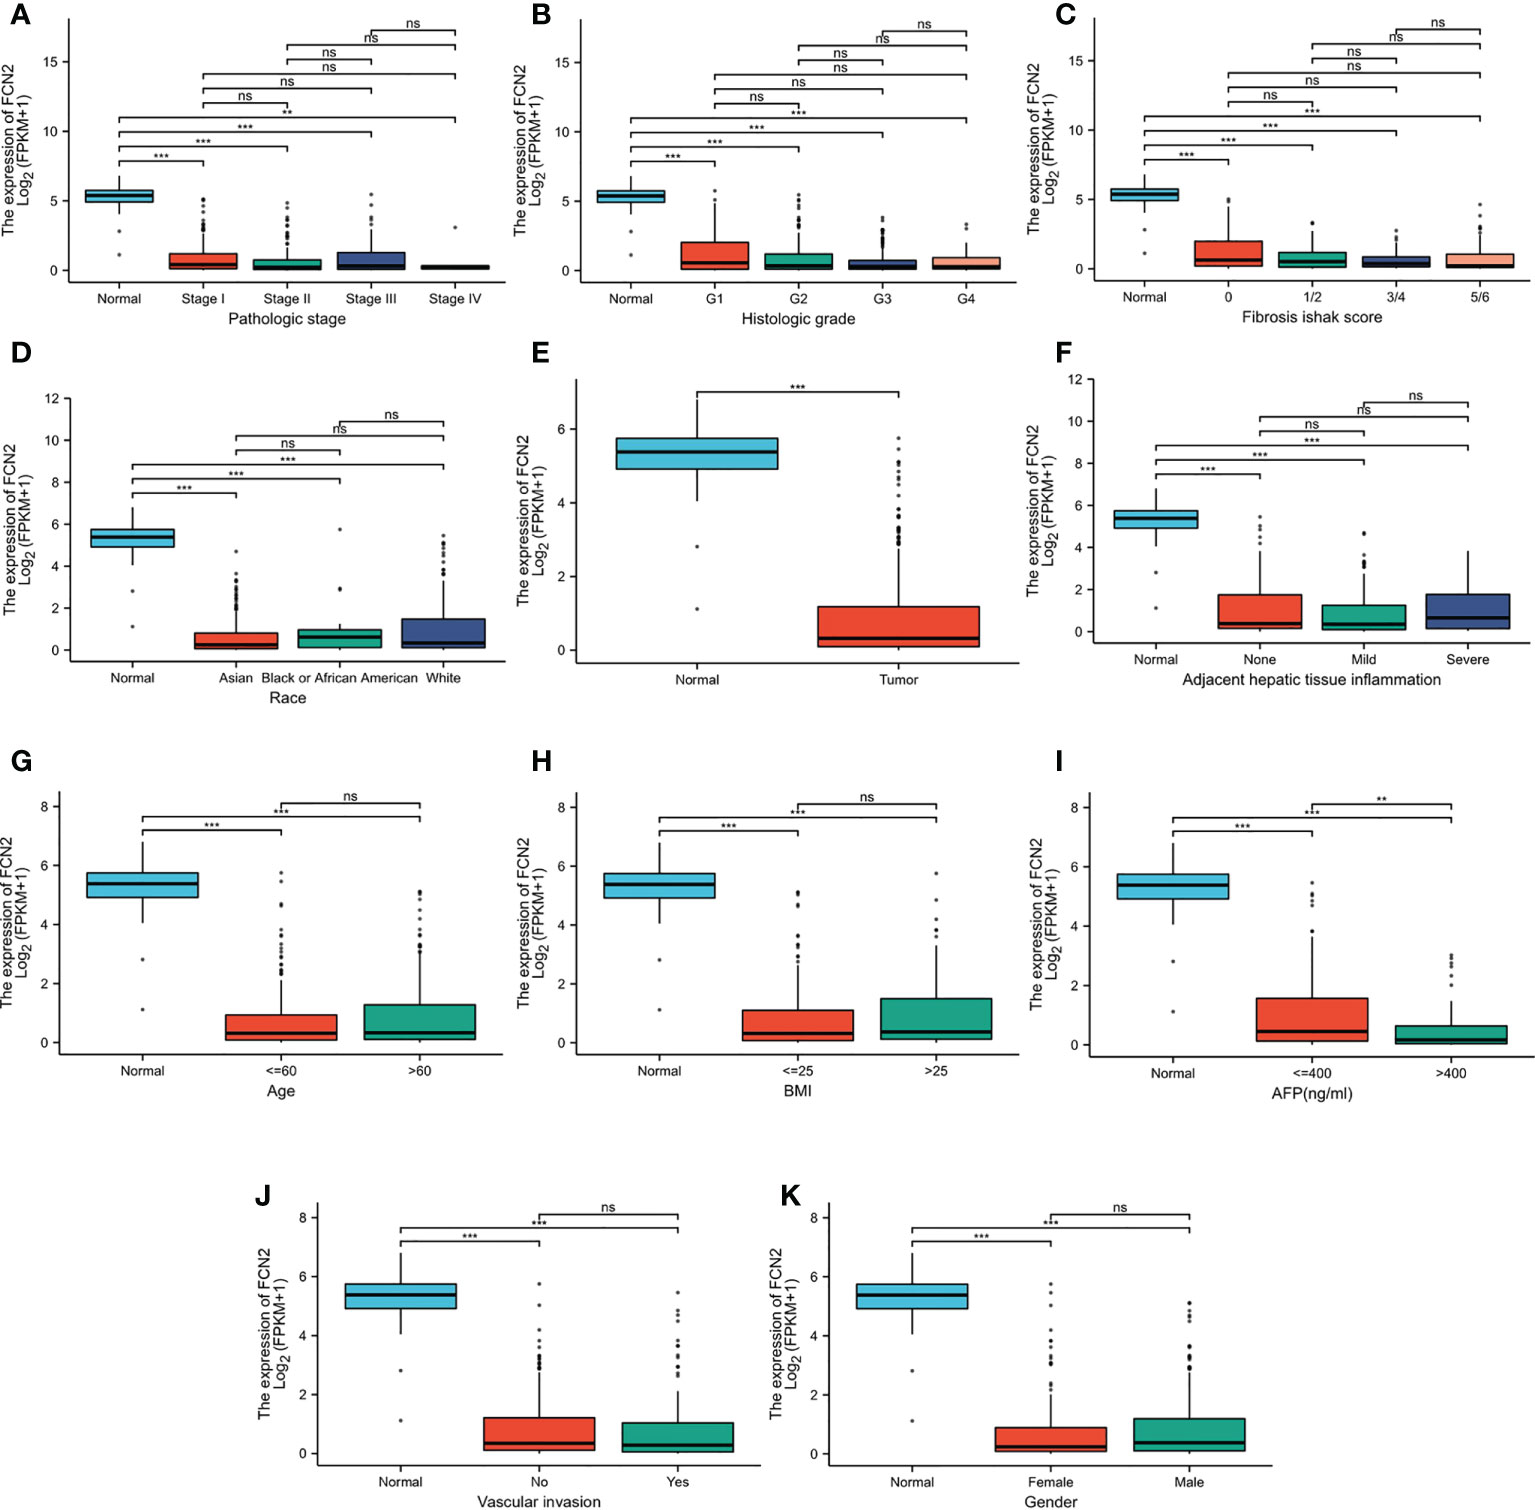
Figure 6 Different expression levels of FCN2 in liver hepatocellular carcinoma (LIHC) based on The Cancer Genome Atlas (TCGA) analyzed using R. (A) Pathologic stages. (B) Histological grade. (C) Fibrosis Ishak scale scores. (D) Race. (E) Normal tissue and liver cancer. (F) Adjacent hepatic tissue inflammation. (G) Age (H). BMI. (I) Alpha-fetoprotein (AFP). (J) Vascular invasion. (K) Gender. *p < 0.05, **p < 0.01, ***p < 0.001. ns: not statistically significant.
Clinical value of FCN2 in prognosis
The survival rates of the high and low FCN2 expression level groups were compared to establish the predictive value of the expression of FCN2 in HCC. According to the Kaplan–Meier survival analysis, the OS of patients with HCC with a low FCN2 expression was poor [HR = 2.26 (1.58–3.24), p = 0.015], as was the DFS, compared to patients with a high FCN2 expression [HR = 0.69 (0.5–0.97), p = 0.03] (Figures 7A–D).
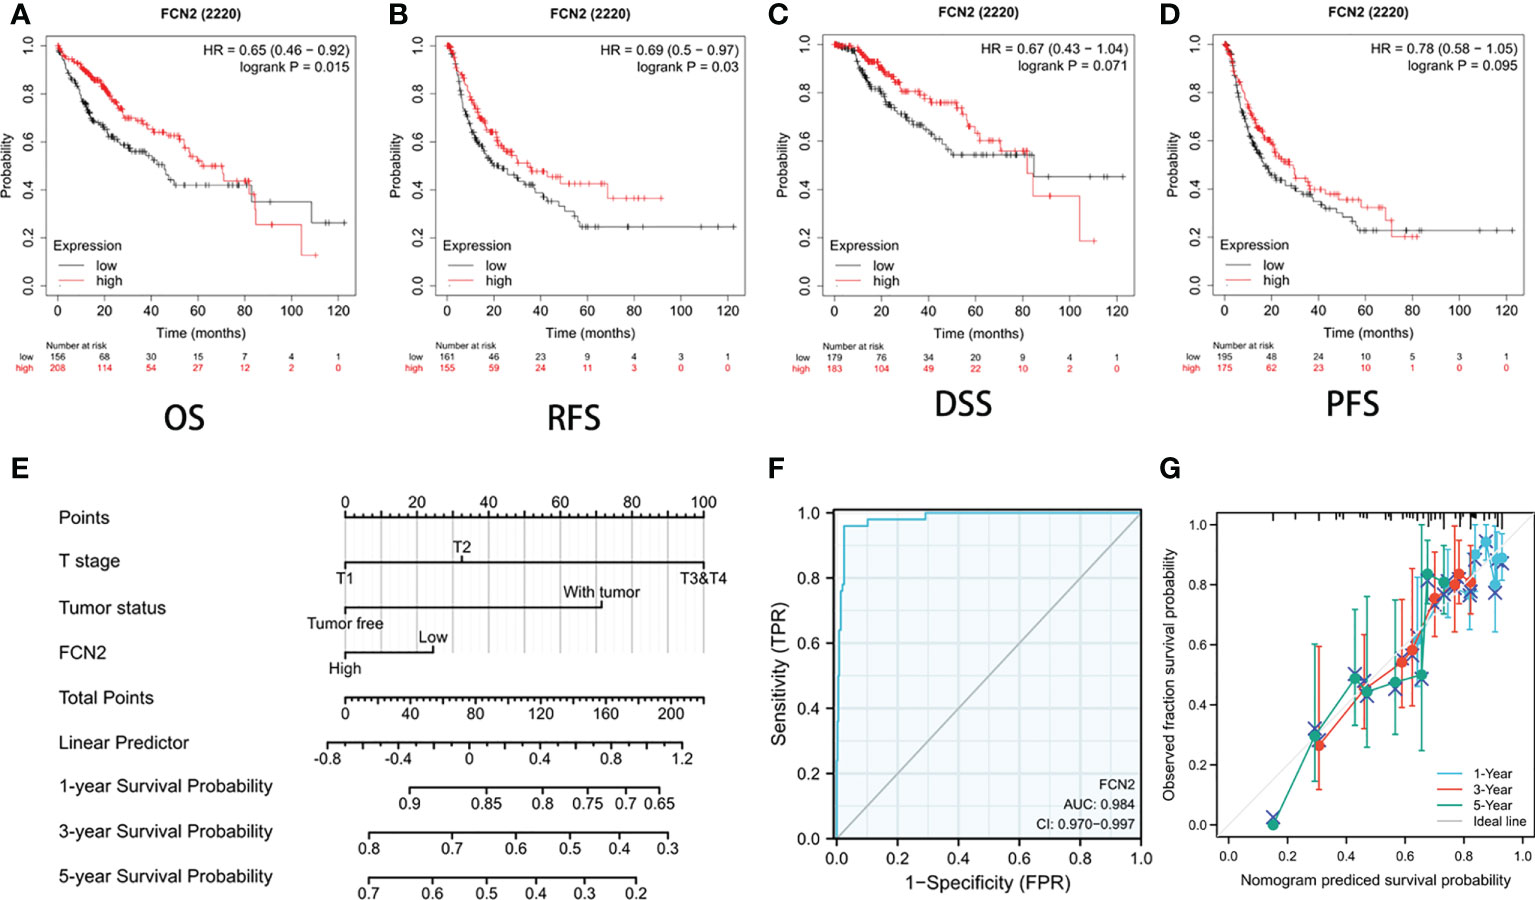
Figure 7 Prognostic value of FCN2 in liver cancer. (A–D) Overall survival (OS) (A), relapse-free survival (RFS) (B), disease-specific survival (DSS) (C), and patient-free survival/progression-free survival (PFS) (D). (E) Nomogram predicting the 1-, 3-, and 5-year OS probability. (F) C-index of the prognostic model nomogram for predicting the 1-, 3-, and 5-year OS probability in hepatocellular carcinoma (HCC) patients. (G) Prediction of the 1-, 3-, and 5-year OS probability using nomogram calibration plots.
The nomogram included data on the tumor status, T stage, and FCN2 expression and was based on a Cox proportional hazards regression model (Figure 7E). The C-index of the prognostic model (Figure 7F) was 0.984 (95% CI = 0.970–0.997). We built a calibration plot to examine the similarity between the OS predicted by the prognostic model and the actual OS. The findings revealed that the nomogram’s prediction results were accurate (Figure 7G). These results imply that FCN2 could be a useful prognostic indicator for HCC.
Protein–protein interaction network analysis and enrichment analysis
STRING was used to complete an online analysis of the FCN2 protein, producing a network diagram of the PPI between 10 genes and the FCN2 gene (Figures 8A, B). The GO and KEGG pathway enrichment analyses for FCN2 and the other 10 genes (Figures 8C–G) showed that FCN2 is primarily involved in body immune processes, such as detecting and eliminating the molecular function of attaching to cellular constituents such as collagen trimer, mannose, complement, and opsonin and apoptotic cells, complement activation, and the lectin pathway. Signal pathway findings suggested that the FCN2 gene participates in S. aureus infection, the coagulation cascade, and the lectin pathway of complement activation.
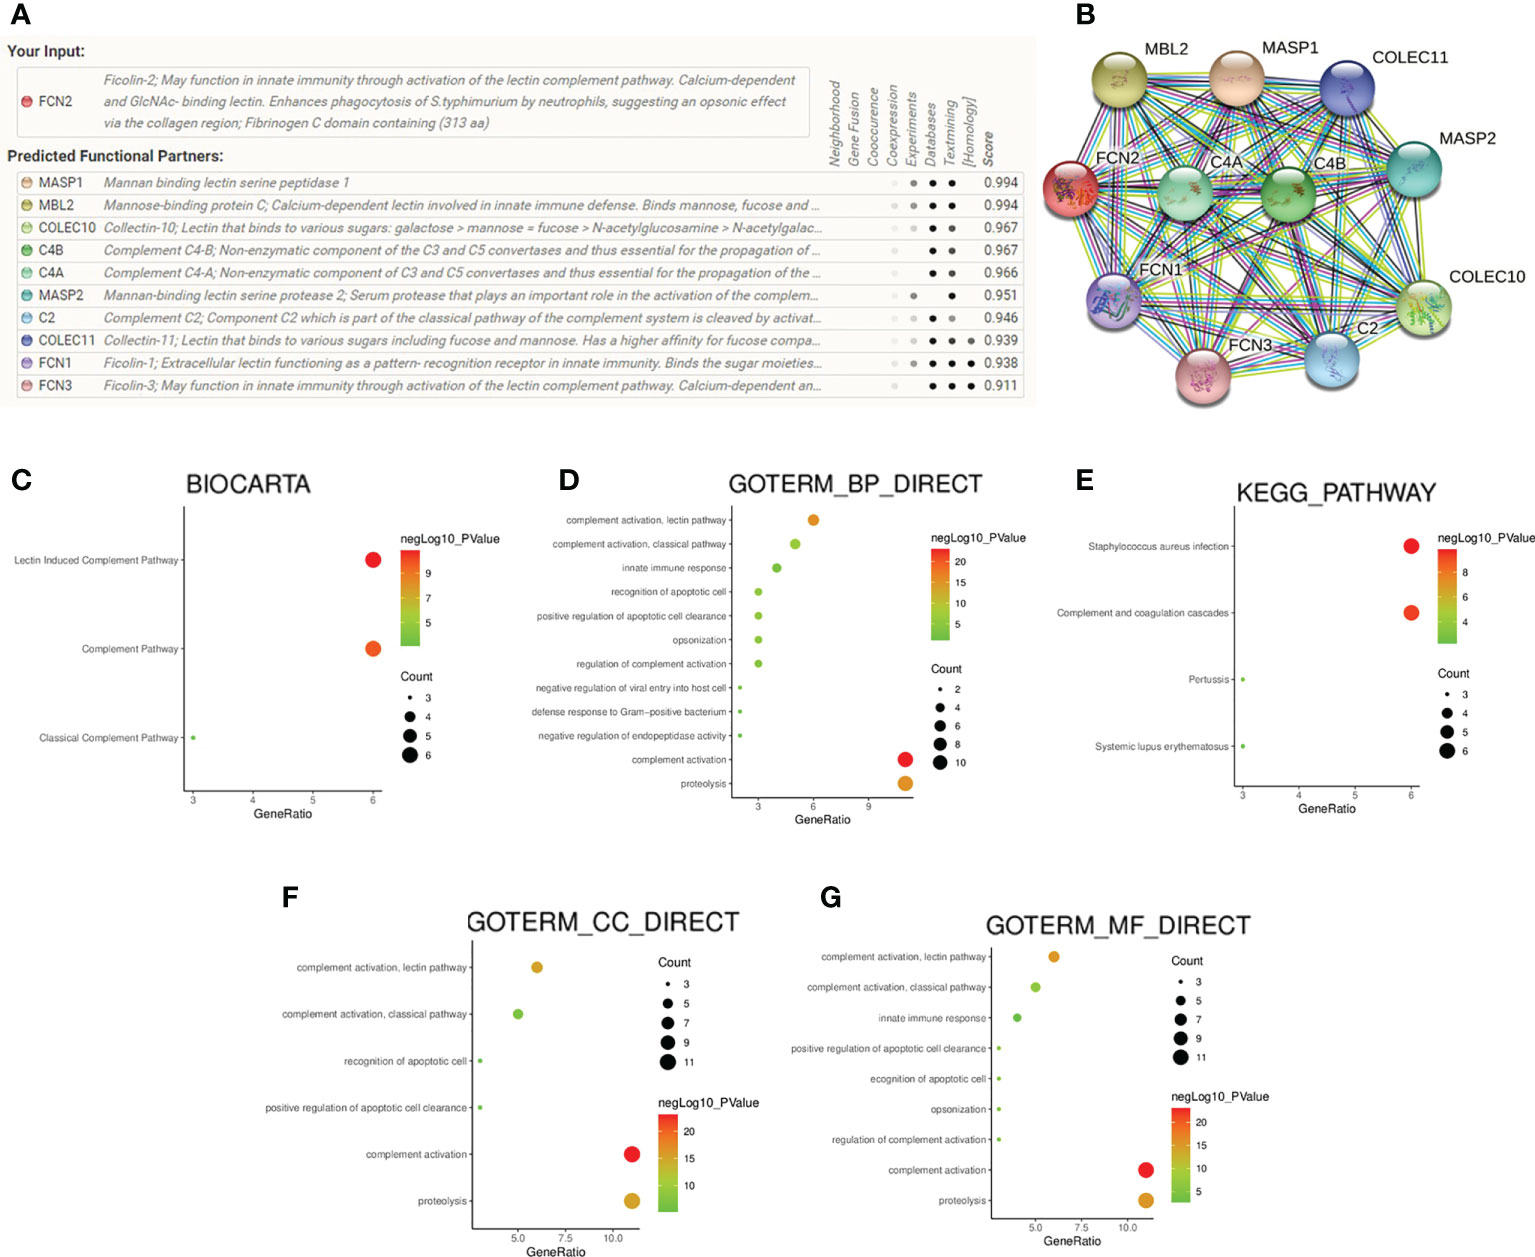
Figure 8 Protein–protein interaction network analysis and enrichment analysis. (A, B) Gene network diagram of interaction with FCN2 created using the STRING database. (C–G) Diagrams of the analyses of the Kyoto Encyclopedia of Genes and Genomes (KEGG) and Gene Ontology (GO) pathways.
Relationship between FCN2 expression and hepatocellular carcinoma immune cell immersion
To explore whether there is a link between FCN2 expression and tumor immune response, we conducted a single-sample gene set enrichment analysis (ssGSEA) to evaluate the immune cell infiltration in HCC tissues with various FCN2 expression levels. According to the findings, the infiltration levels of T follicular helper (TFH) and T helper 2 (Th2) cells were considerably lower in patients with HCC who had low FCN2 expression than those in patients who had high FCN2 expression. Neutrophil infiltration was higher in patients with HCC who had low FCN2 expression than in those who had high FCN2 expression. The infiltration levels of T cells, activated dendritic cells (aDCs), B cells, dendritic cells (DCs), interstitial dendritic cells (iDCs), macrophages, mast cells, CD56dim natural killer (NK) cells, plasmacytoid dendritic (pDC) cells, T helper cells, effector memory T (Tem) cells, Th1 cells, Th17 cells, and regulatory T cells (Tregs) in patients with high and low FCN2 expressions were not substantially different (Figure 9A). We then examined the relationship between FCN2 expression levels and immune cell infiltration in HCC and discovered that the expression of FCN2 was positively linked to the number of neutrophils invading the tumor (r = 0.228, p < 0.001), eosinophils (r = 0.199, p < 0.001), NK cells (r = 0.165, p < 0.001), central memory T (Tcm) cells (r = 0.163, p < 0.001), and DCs (r = 0.161, p < 0.001) (Figures 9B–F, respectively). The number of Th2 cells entering the body showed a negative correlation (r = −0.180, p < 0.001) (Figure 9G).
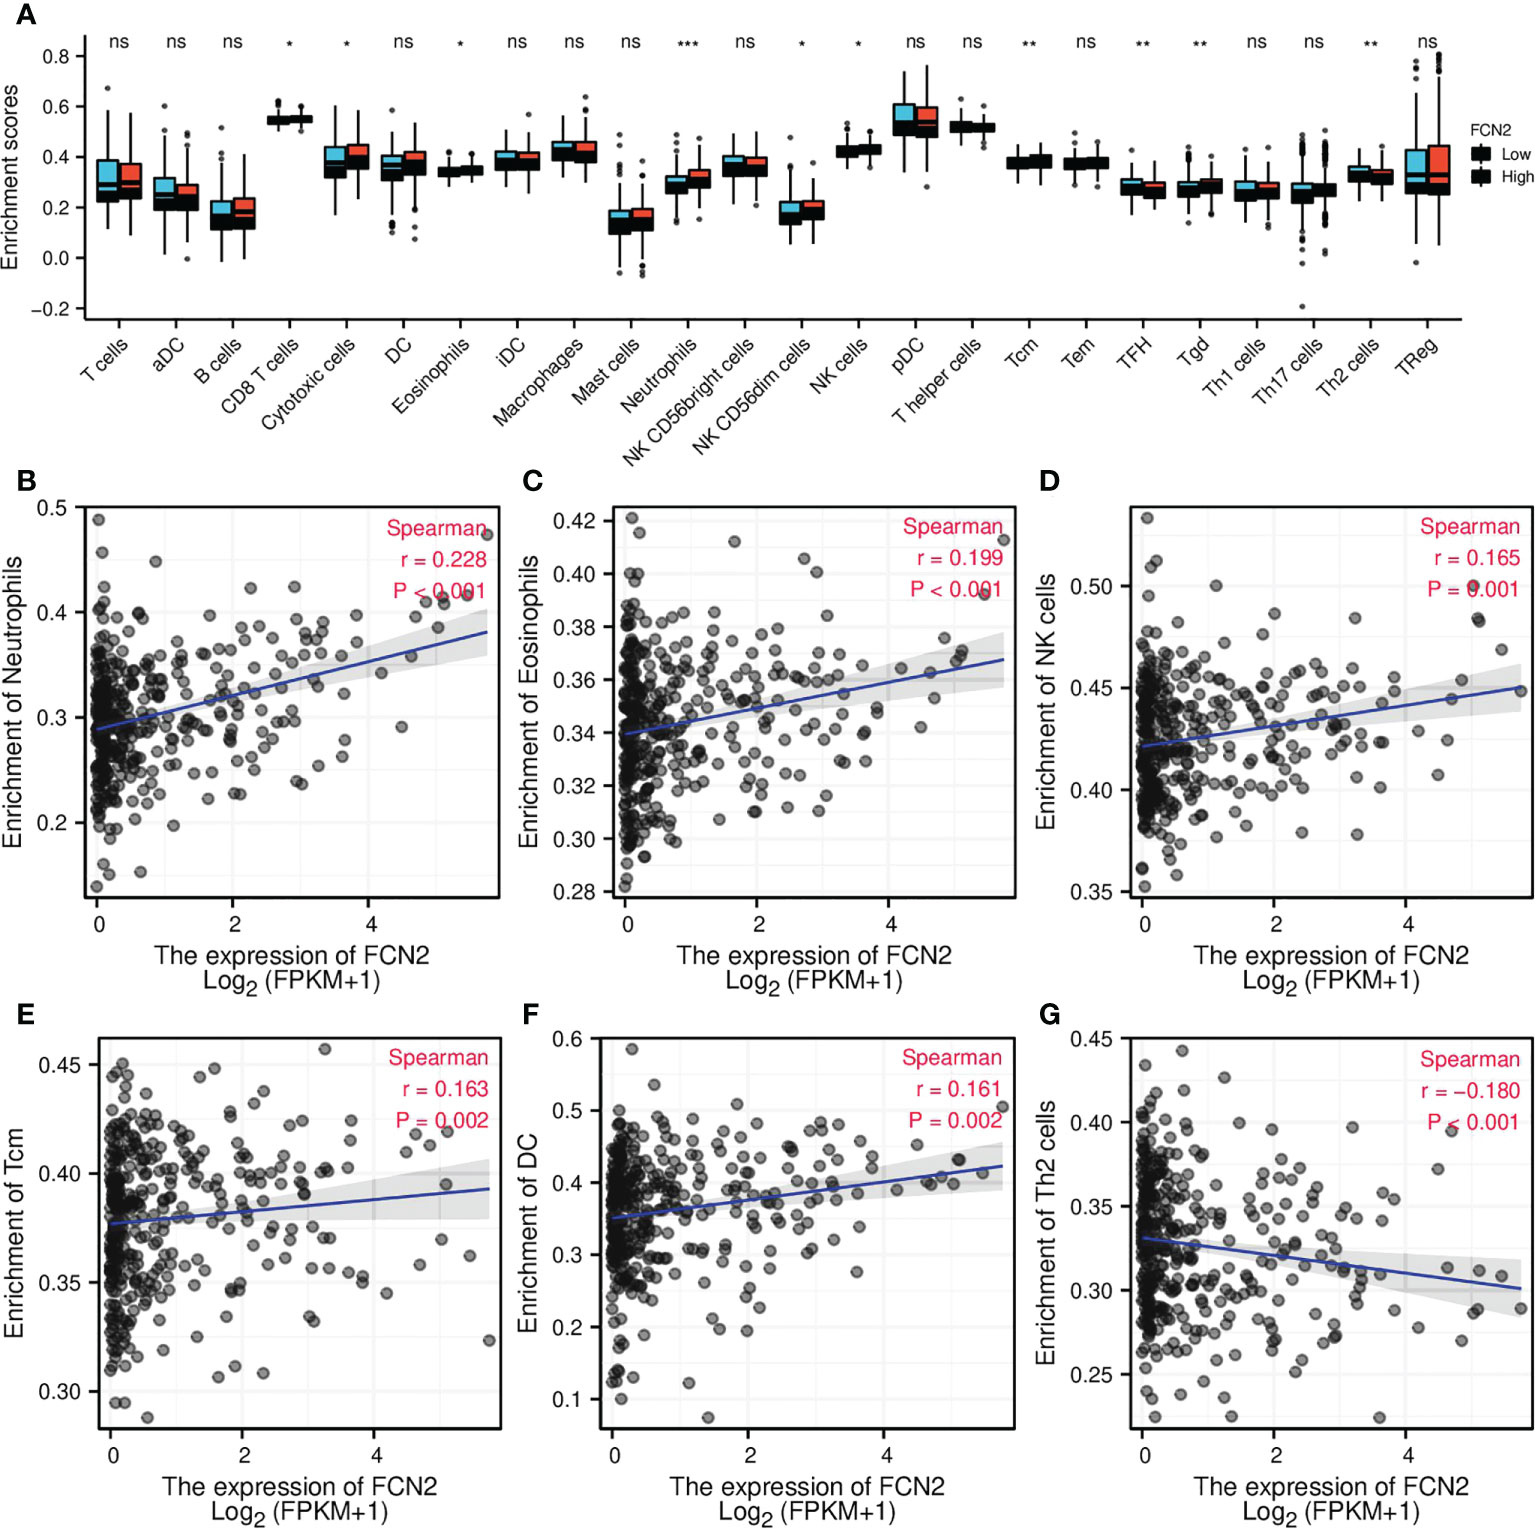
Figure 9 Correlation of FCN2 expression with immune characteristics. (A) Differential distribution of the immune cells in patients with high and low FCN2 expressions. (B–G) Correlation between the expression level of FCN2 and immune infiltration in hepatocellular carcinoma: (B) Neutrophils, (C) Eosinophils, (D) NK cells, (E) Tcm, (F) DC, (G) Th2 cells. *p < 0.05, **p < 0.01, ***p < 0.001. ns, no significance.
We used the GEPIA database to investigate the relationship between FCN2 expression and immune cell biomarkers in HCC in order to learn more about the role of FCN2 in tumor immunity. As seen in Table 1, the expression of FCN2 was negatively correlated with the M1 macrophage biomarker (IRF5), neutrophil biomarker (ITGAM), and DC biomarker (ITGAX) in liver cancer. The B-cell biomarker (CD79A), CD8+ T-cell biomarker (CD8A), CD4+ T-cell biomarker (CD4), M1 macrophage biomarker (PTGS2), M2 macrophage biomarkers (CD163, VSIG4, and MS4A4A), neutrophil biomarker (CEACAM8), and DC biomarker (CD1C) were positively correlated with FCN2 expression. The above findings contribute to a better understanding of the link between FCN2 and immune cell infiltration.
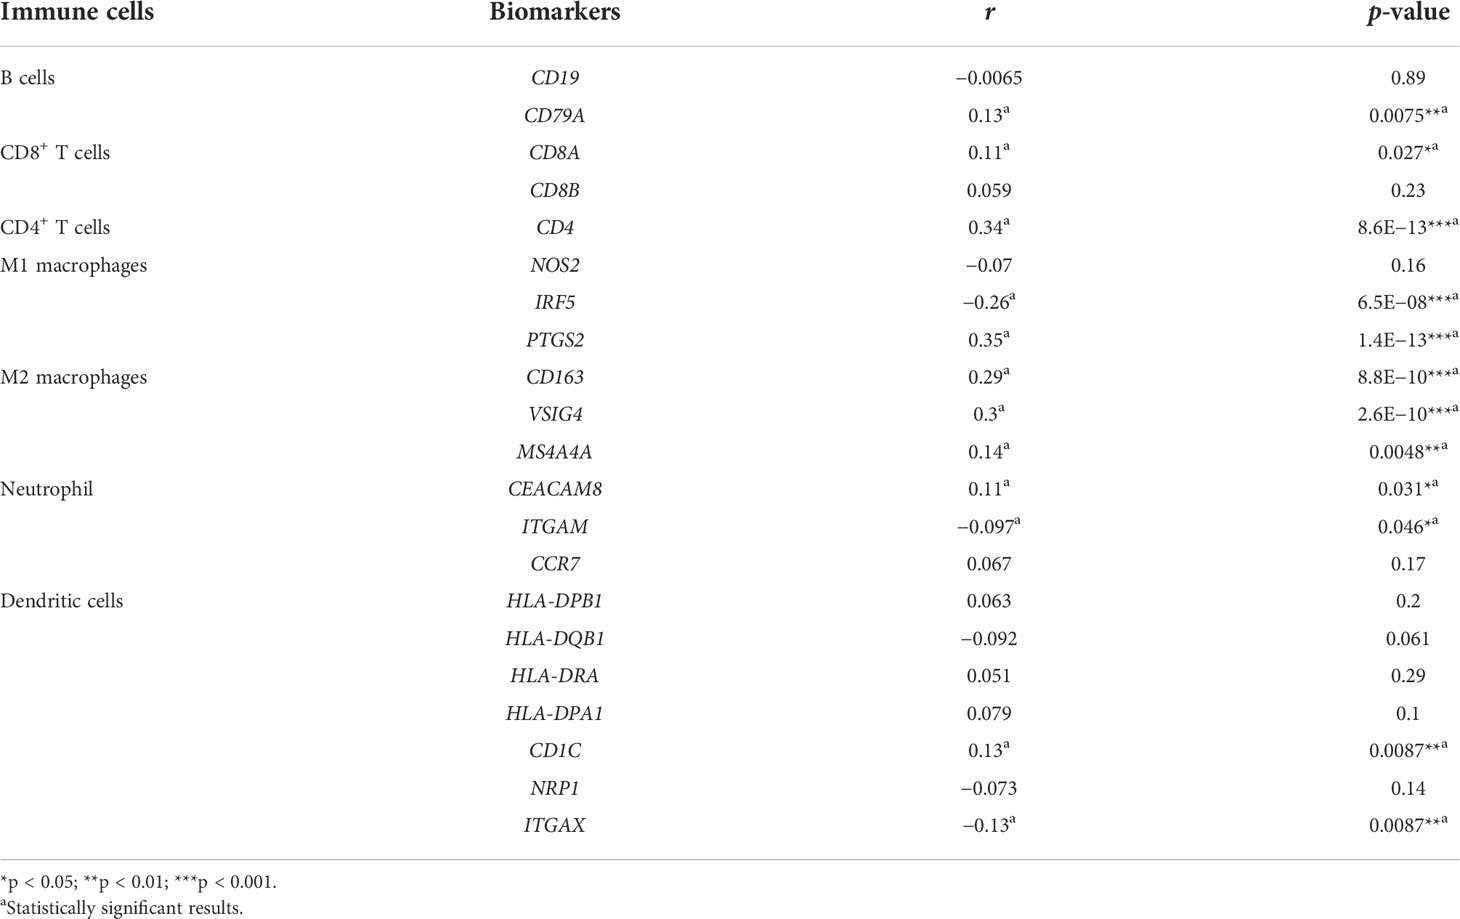
Table 1 Correlation analysis between FCN2 and the biomarkers of immune cells in hepatocellular carcinoma (HCC) determined using the GEPIA database (Spearman’s correlation coefficient).
Immunomodulators, chemokines, and receptors associated with FCN2
To confirm the role of FCN2 in regulating LIHC immunity, we analyzed the correlation between FCN2 and the tumor microenvironment (TME) immunological signatures.
FCN2 was found to be favorably linked to the majority of immunomodulators, chemokines, and other factors, as well as the chemokine receptors in LIHC and diffuse large B-cell lymphoma (DLBCL), and negatively correlated with most of the immunomodulators, chemokines, and chemokine receptors in THYM and TGCT. FCN2 was positively correlated with most major histocompatibility complexes (MHCs) in LIHC, mesothelioma (MESO), and acute myeloid leukemia (LAML) and negatively correlated with most MHCs in TGCT (Figure 10A).
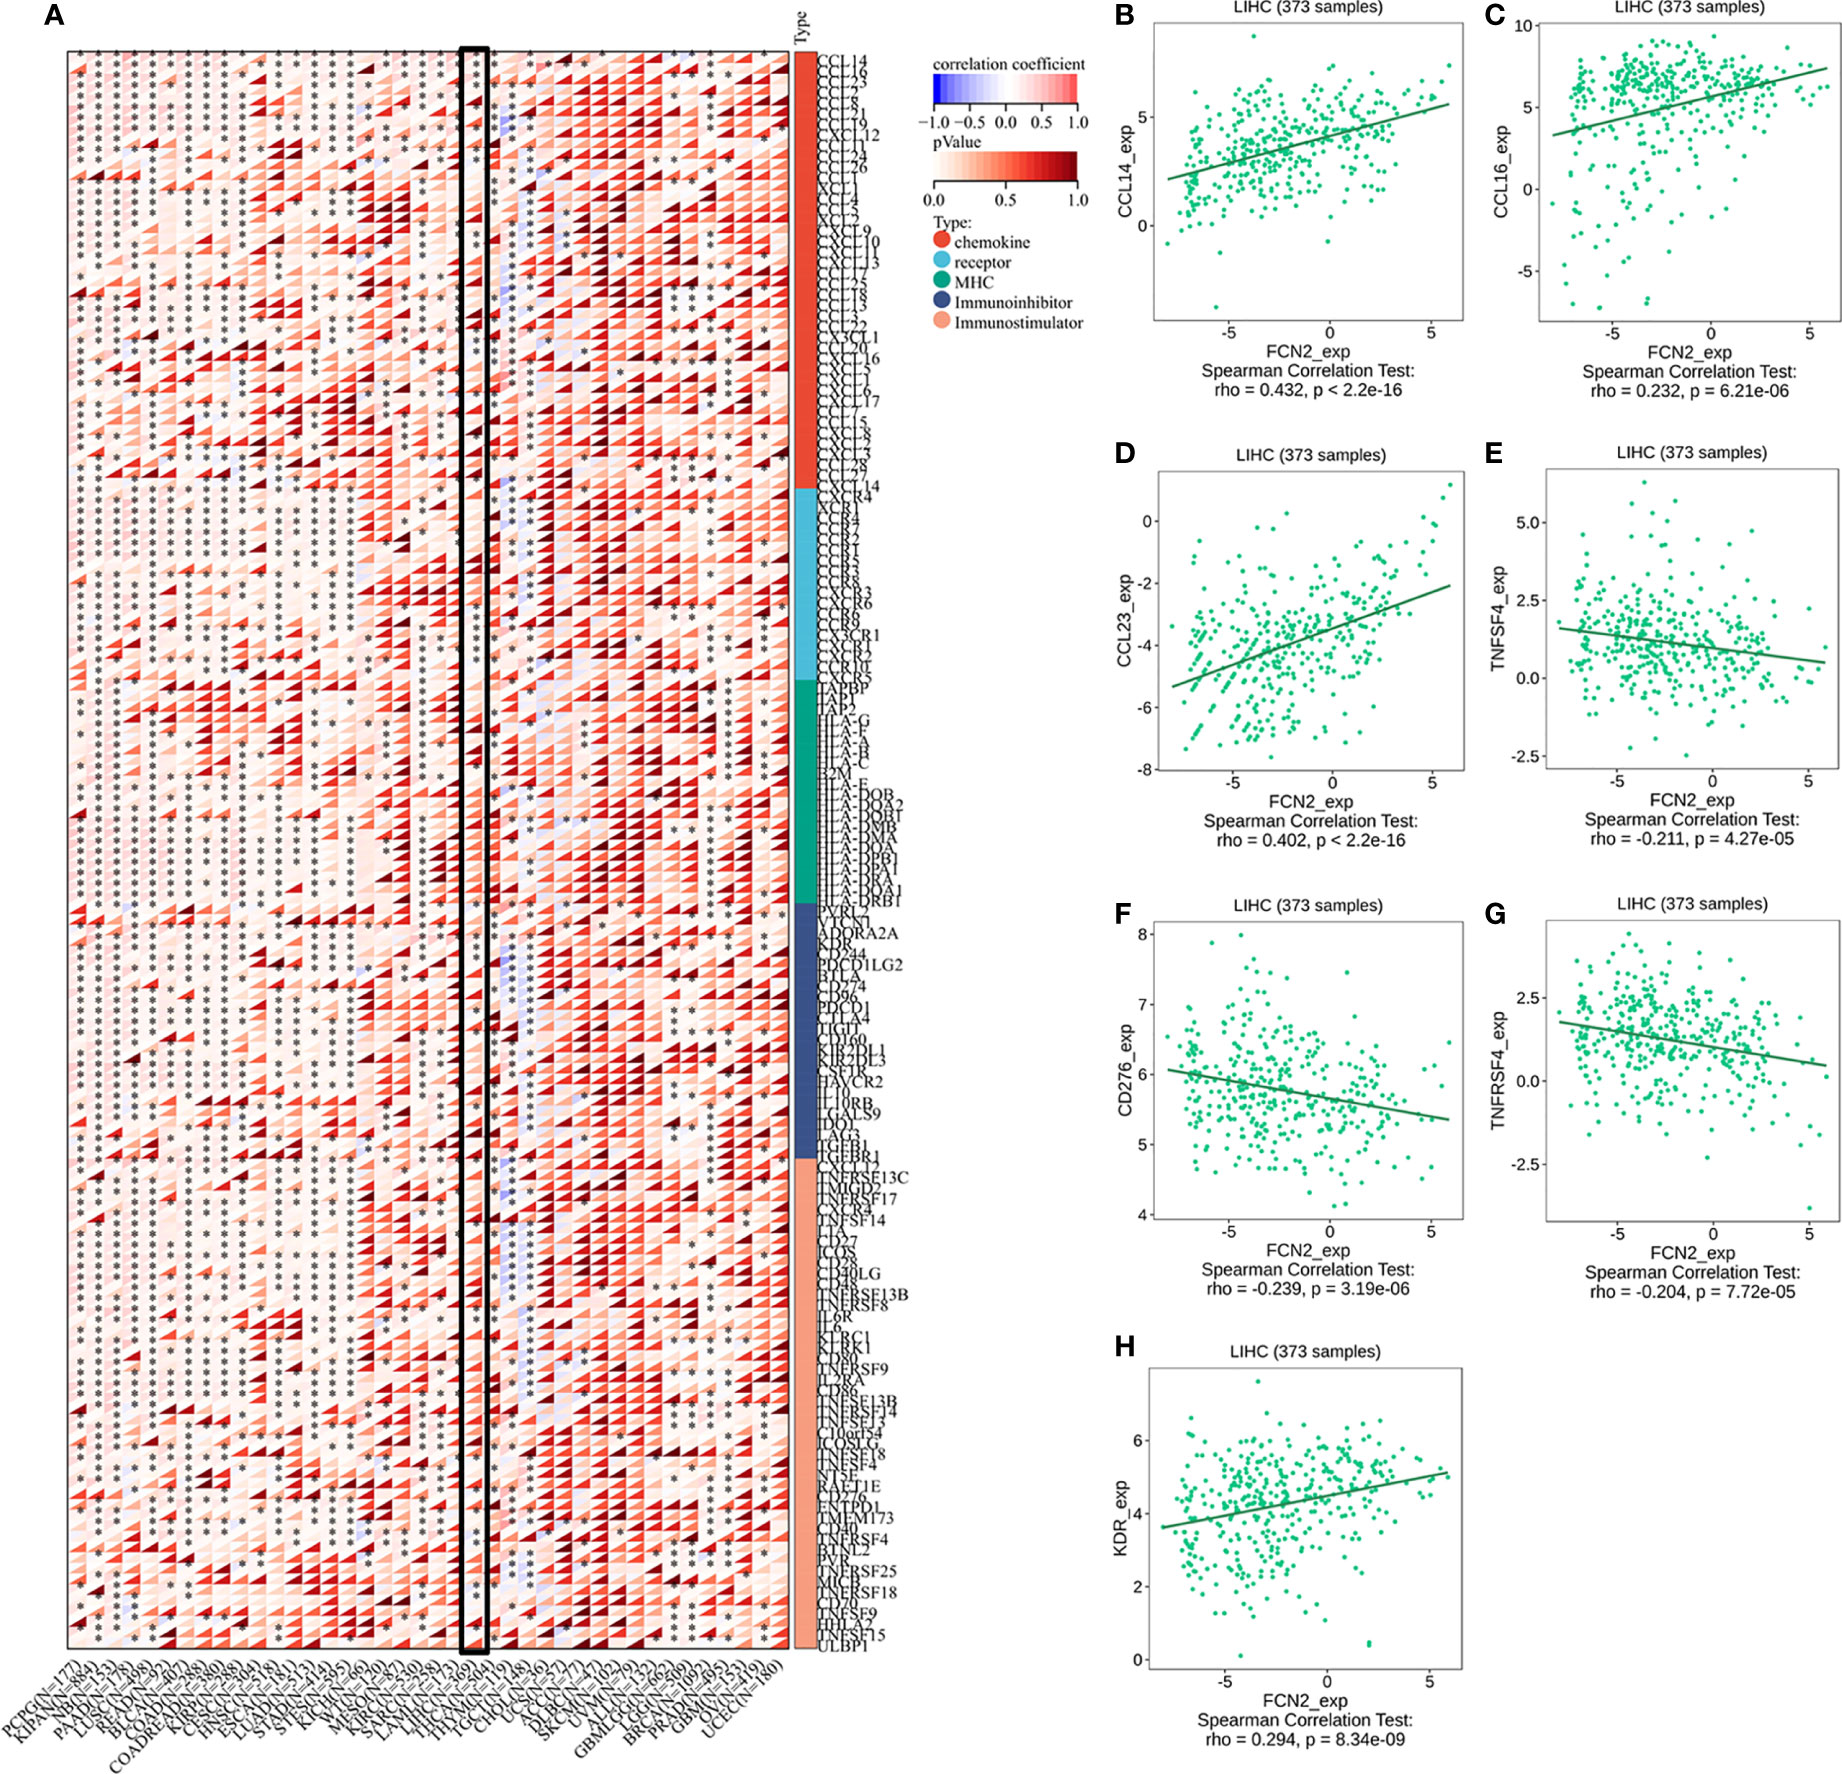
Figure 10 Immunomodulators, chemokines, and receptors associated with FCN2. (A) Distribution of the FCN2 immunological scores in tumor and normal tissues.The ordinate reflects the distribution of the immunological scores in distinct groups, whereas the abscissa indicates the immune cell types. The Wilcoxon test was used to compare statistical differences between the two groups, and the Kruskal–Wallis test was used to determine the significance of the differences between three groups. (a) Heatmap of the immune cell scores. Different hues represent the varied expression distributions in different samples. Asterisks indicate significance levels at *p < 0.05, **p < 0.01, and ***p < 0.001. (b) Percentages of tumor-infiltrating immune cells in each sample. Different colors depict the different types of immunological cells. The abscissa denotes the sample, whereas the ordinate denotes the percentage of immune cells in a single sample. (H) Immunomodulators, chemokines, and receptors associated with FCN2 in liver hepatocellular carcinoma (LIHC). (B) CCL14. (C) CCL16. (D) CCL23. (E) TNFSF4. (F) CD276. (G) TNFRSF4. (H) KDR. ****p < 0.0001.
Analysis using the TISIDB database showed that three chemokines, CCL14 (ρ = 0.432, p < 2.2E−16), CCL16 (ρ = 0.232, p = 6.21E−06), and CCL23 (ρ = 0.402, p = 2.2E−16), were positively correlated with the expression of FCN2. The immunosuppressant kinase insert domain receptor (KDR) (ρ = 0.294, p = 8.34E−09) was also positively linked to the expression of FCN2. However, FCN2 expression was found to be inversely correlated with the expression of four chemokine receptors, namely, CD276 (ρ = −0.239, p = 3.19E−06), TNFRS4 (ρ = −0.204, p = 7.72E−05), CD276 (ρ = −0.239, p = 3.19E−06), and TNFSF4 (ρ = 0.211, p = 4.27E−05) (Figures 10B–H).
The HPA database confirmed that the expression levels of the immune-related markers CCL14, CCL23, KDR, CD276, TNFSF4, and TNFRSF4 in liver cancer are closely linked to FCN2. Apart from the lack of significant differences in the levels of positive rates, the immunohistochemistry results of the remaining molecules revealed that the positive rates in normal liver tissues were greater than the high specificity in liver cancer tissues, meaning that the expressions of these genes were lower in liver cancer tissues than those in normal liver tissues. The evidence shown in Figure 11 backs this up. These findings show that the expression of FCN2 is TME-specific, implying that FCN2 could be a potential immunotherapy target in the treatment of liver cancer.
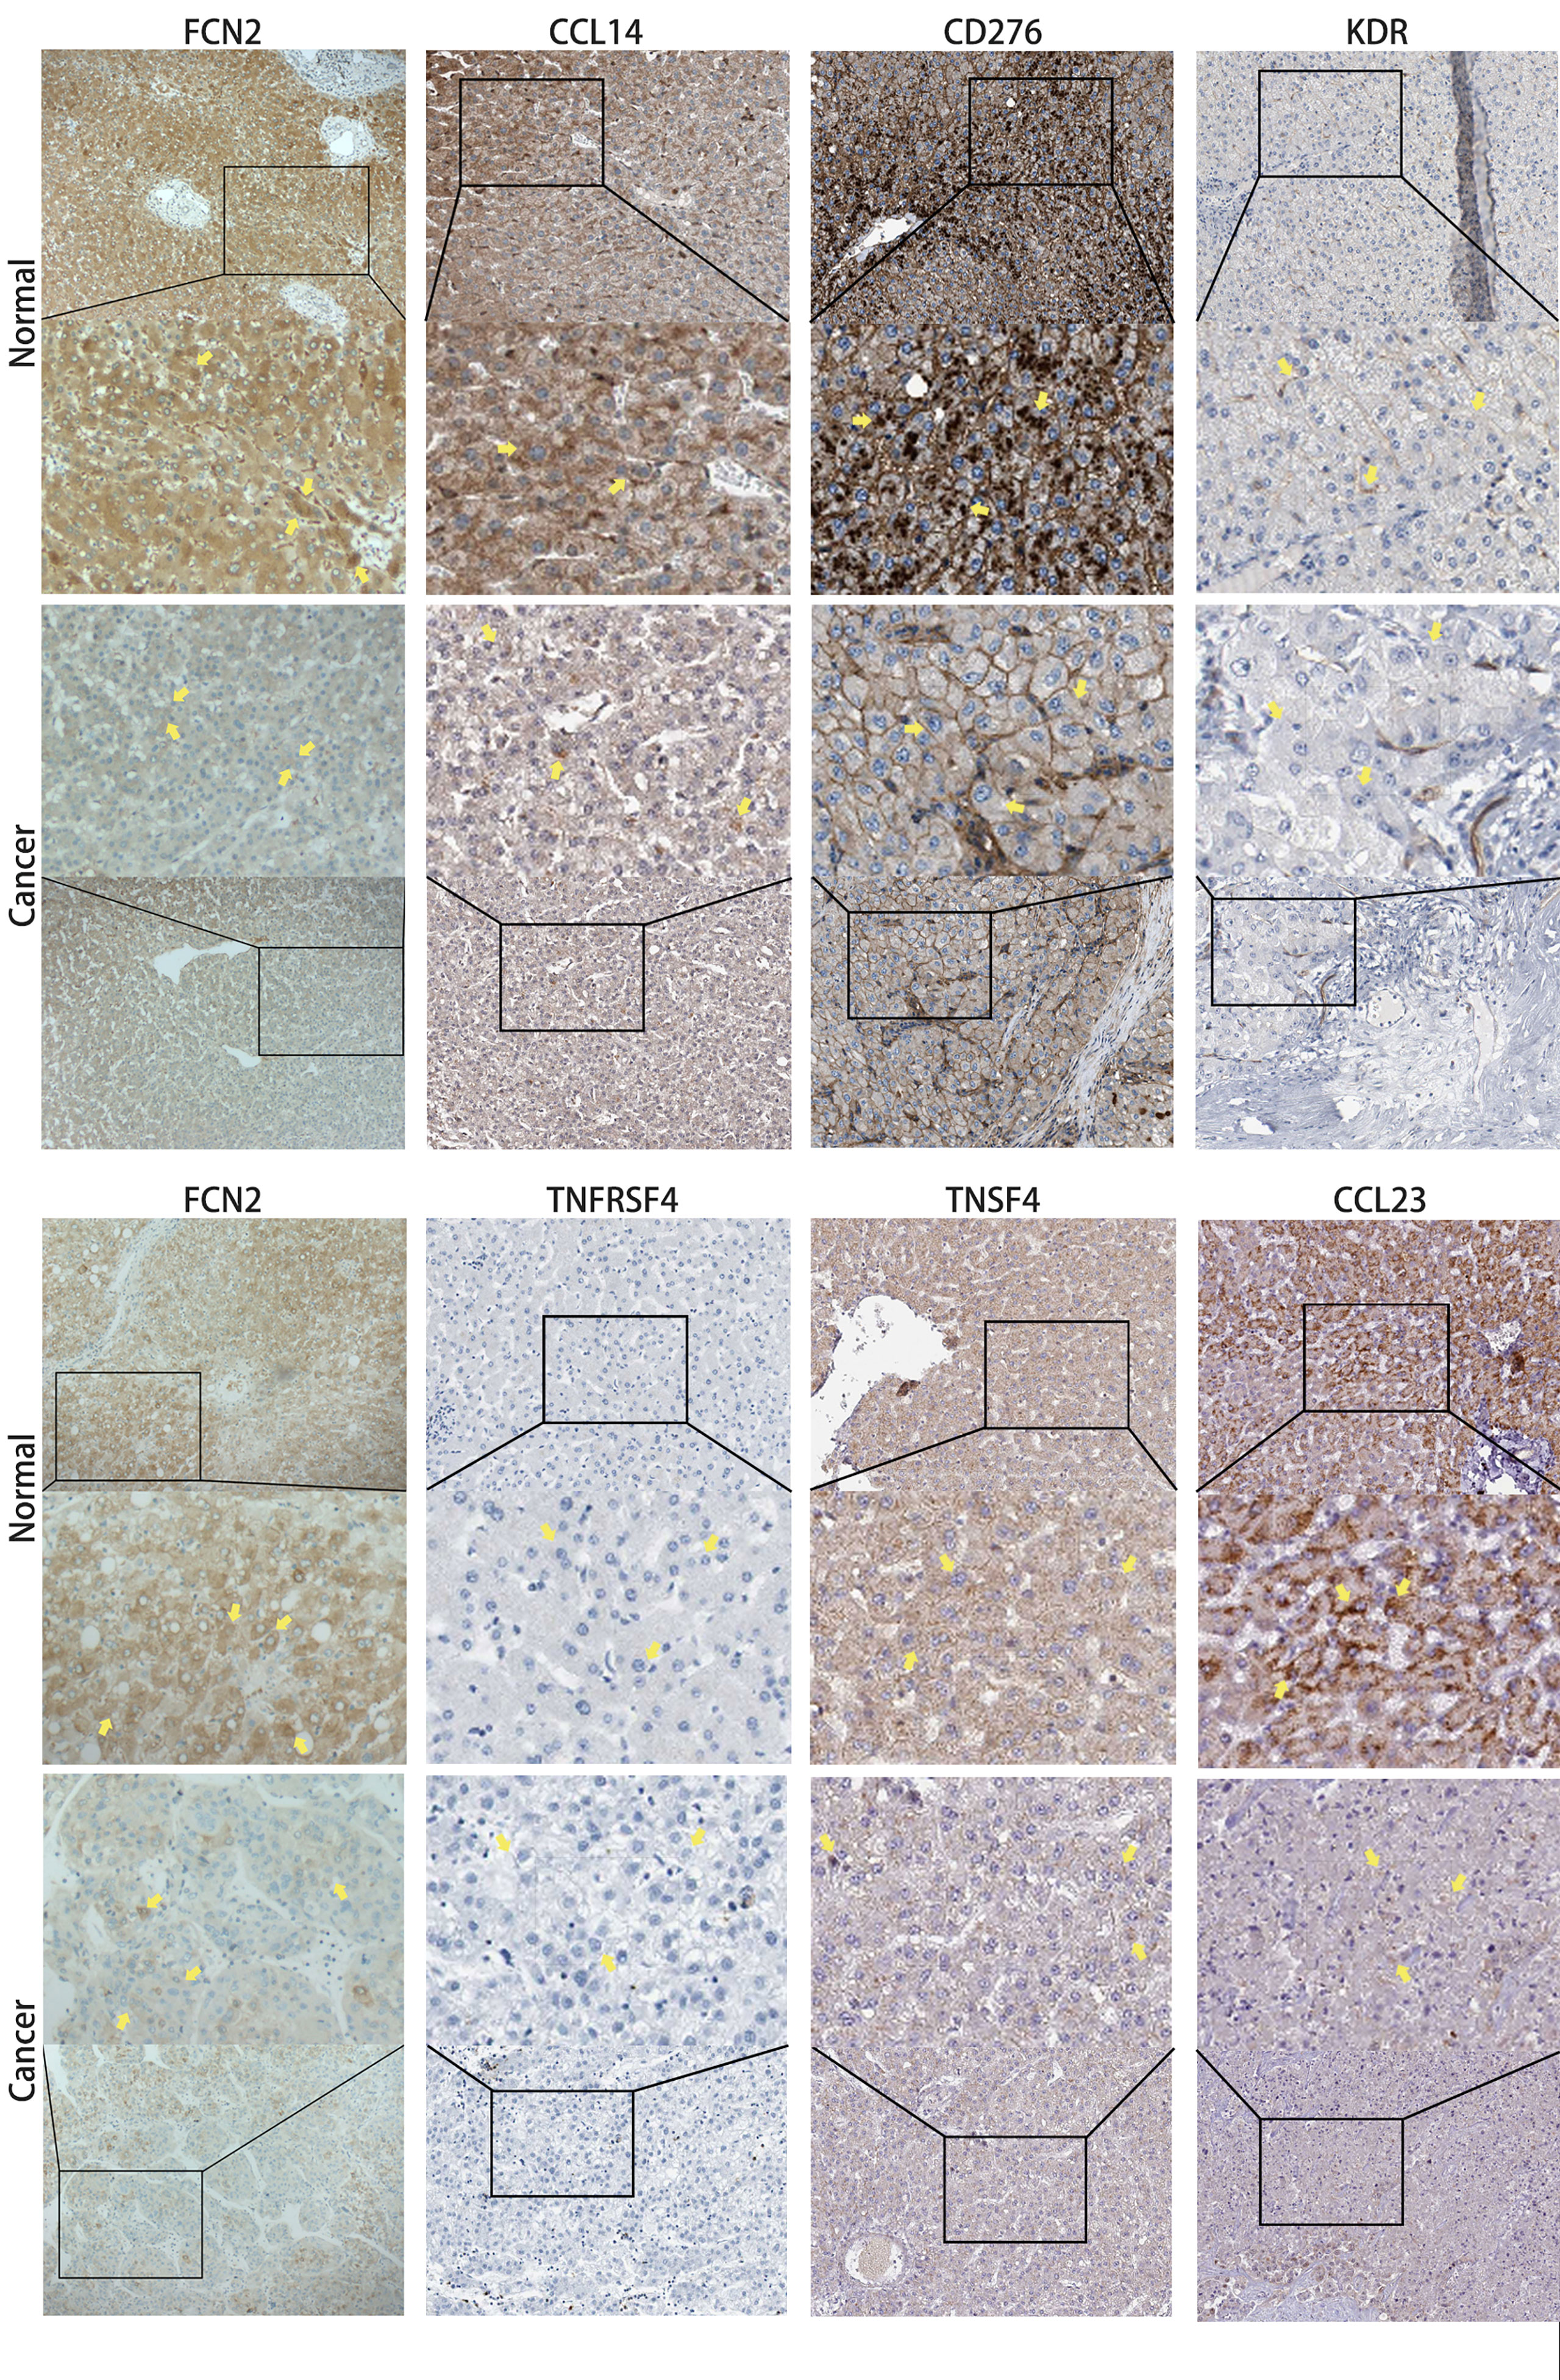
Figure 11 Immunohistochemical comparison of FCN2 and the molecules with strong correlations [based on the Human Protein Atlas (HPA)].
Discussion
It has been demonstrated that gene therapy can be used to treat cancer, specifically liver cancer. It examines differences in the gene expression levels in liver cancer, determines which genes are expressed differently, and then intervenes in their expression. The mRNA expression levels of FCN2 in liver cancer tissues were lower than those in normal liver tissues, showing that FCN2 may play the role of a tumor marker in the occurrence and progression of liver cancer. The FCN2 gene is a polymorphic gene with functional polymorphisms that control its expression and function. It may have a pathophysiological role in innate immunity (14).
Using the Oncomine database, we determined that the expression of FCN2 in LIHC tissue was inferior to that in normal liver tissue. The expression of FCN2 mRNA in liver cancer tissues was similarly shown to be lower than that in normal liver tissues. We further analyzed the Clinical Proteomic Tumor Analysis Consortium (CPTAC) database and discovered that the FCN2 protein expression in liver cancer tissues was inferior to that in normal liver tissues. The FCN2 gene was analyzed using the UALCAN online analysis tool, which gave the same results as above. According to studies, the serum levels of FCN2 in patients with tumors are substantially lower than those in healthy individuals. Thus, FCN2 has an antitumor effect (15). This finding further supports our assumption. We used the Oncomine database to examine the expression of FCN2 mRNA in malignant tumors and normal clinical tissues in order to determine whether FCN2 has a specific expression in liver cancer. Downregulation of the gene expression of FCN2 was found in leukemia and liver cancer. RNAseq (transcriptome gene sequencing technology) and Affymetrix were used for further verification, and the results showed that tumor type was the main factor affecting the transcription level of FCN2.
The results obtained by TCGA and the other online databases, together with the high-throughput RNAseq results of the bioinformatics analysis verified by experiments, showed that the expression of FCN2 in HCC tissues is lower than that in normal liver tissues. This study found that FCN2 appears to play a role in the development and progression of liver cancer. Furthermore, receiver operating characteristic (ROC) analysis revealed that FCN2 has an area under the curve (AUC) of 0.840 for the diagnosis of HCC, implying that it could be a potential diagnostic biomarker. The relationship between FCN2 expression and the clinicopathological features was further studied based on this concept. According to the univariate analysis, the low protein expression of FCN2 is substantially linked to height (p = 0.024) and the AFP level (p = 0.004). To determine the link between the FCN2 gene and liver cancer, we used the R package to analyze the FCN2 gene expression in multiple indicators. The expression of FCN2 was shown to differ among the AFP groups.
Previous studies have supported the hypothesis that genetic mutations can influence the development of liver cancer (16). To explore whether FCN2 has a similar mechanism, the cBioPortal database was utilized to examine FCN2 mutations in liver cancer based on the sequencing data from patients in the TCGA database. The most common FCN2 mutation in HCC is amplification. However, the Kaplan–Meier plot showed that the FCN2 gene mutation had no effect on the prognosis of HCC.
In the analysis of the PPI network diagram of 10 genes and the FCN2 gene using the STRING database, GO, and KEGG signal pathways, we discovered that the FCN2 gene may play a key role in S. aureus infection, complement coagulation cascade, and lectin complement pathway.
Numerous studies have found that different types of immune cells infiltrate tumors in large numbers and that their distribution, tissue location, and cell type are all linked to tumor development and survival (17). We found that the expression levels of FCN2 are abnormally low in HCC. Based on our findings, FCN2 may play a role in modulating the tumor immune response. We started by examining the FCN2 expression in pan-cancer. We found that it was positively correlated with most immune cells in LAML, skin cutaneous melanoma (SKCM), bladder urothelial carcinoma (BLCA), LUAD, pancreatic adenocarcinoma (PAAD), pheochromocytoma and paraganglioma (PCPG), KIRP, and lung squamous cell carcinoma (LUSC) and was also positively correlated with activated CD4+ T cells in LIHC. Eosinophils and CD56bright NK cells were found to be negatively and favorably linked, respectively, to activated DCs. We then looked at the relationship between FCN2 expression and immune infiltration in HCC and found that the expression of FCN2 was positively linked to the number of neutrophils, eosinophils, NK cells, Tcm, and DCs infiltrating the tumor. The expression level of FCN2 had a negative correlation with Th2 cell infiltration. Neutrophils are frequently dominant and are linked to immunological escape from tumors (18). Consequently, these findings imply that FCN2 may suppress the HCC tumor immune response by favorably regulating neutrophils (19, 20), eosinophils (21), NK cells (22–24), Tcm (25), and DCs (26–28) and negatively regulating Th2 (29–31) in tumors.
Blood arteries, immune cells, fibroblasts, bone marrow-derived inflammatory cells, various signaling molecules, and the extracellular matrix (ECM) were all present in the close vicinity of tumor cells. The TME facilitates complex interactions between tumor cells and stromal cells (32). One of the immunological characteristics of the TME is the expression of immunomodulatory chemicals and inhibitory immune checkpoints. The FCN2-related pan-cancer analyses were designed to describe the immune effects of FCN2 and are critical in identifying cancer types that may benefit from FCN2-related immunotherapy. In LIHC and DLBCL, FCN2 was shown to be positively correlated with the majority of immunomodulators, chemokines, and chemokine receptors, but was negatively correlated with the majority of these same molecules in THYN and TGCT. FCN2 was positively correlated with most MHCs in LIHC, MESO, and LAML and negatively correlated with most MHCs in TGCT. In addition, we found that three chemokines—CCL14, CCL16, and CCL23—and the immunosuppressant KDR were positively correlated with the expression of FCN2, while three immunostimulants—CD276, TNFRSF4, and TNFSF4—were negatively correlated with its expression. Immunohistochemical analysis revealed that the positive rates of CCL14 (33, 34), CCL23 (35, 36), CD276 (37, 38), and TNFSF4 (39) were significantly different in normal liver and liver cancer tissues.
Chemokines have been found to impact the biological activity of inflammatory cells, implying that the TME can operate as inflammatory cell regulators (40). The capacity of cancer tissues to spread metastatically could be linked to the metastatic potential of liver cancer (41). Chemokines and their receptors are considered to have a role in HCC development, invasion, and metastasis (42). CCL14, for example, may prevent the Wnt/catenin pathway from engaging, reducing HCC cell growth, and increasing apoptosis (34). CCL23 has been found to be underexpressed in hepatoma cells, and this could lead to CCL23 deletion and reduced CCL23 inhibition via the ESR1/CCL23/CCR1/AKT regulatory axis in liver cancer progression (35).
Studies on the clinical application of FCN2 in the treatment of liver cancer discovered two kinds of ficolin in mice, namely, Fcna and Fcnb. The lectin pathway is activated by both mouse Fcna and human FCN2, which are produced in the liver and present in the blood (43). The Fcnb levels are very low, whereas those of Fcna and the structure in host plasma are identical to those seen in mantle cell lymphoma (monoclonal B-cell lymphocytosis, MBL) (15, 44, 45). This shows that the mouse Fcna can be used instead of the human FCN2 for experimental analysis to obtain more relevant indicators of FCN2.
Finally, we obtained some clinical samples for immunohistochemical dissection for the evaluation and validation of the accuracy of our results. FCN2 expression was shown to be lower in liver cancer tissues than in healthy liver tissues, which is consistent with our other findings.
Therefore, we propose exploring gene therapy targeting FCN2. Gene therapy may be widely used clinically in the future (46). Molecular tools can also be used to target gene therapy in the liver (47). Based on this, this paper discusses the influence of the FCN2 gene on liver cancer and expects to expand the research in the future, more fully analyze the association between this gene and liver cancer, and apply gene therapy to better treat liver cancer.
Conclusions
Our experimental evidence and the meaningful correlation with AFP support the finding that FCN2 is underexpressed in HCC and that it has prognostic value in this cancer type (4, 7). FCN2 may be implicated in S. aureus infection, complement coagulation, and the lectin complement pathway in terms of function. At the immune level, FCN2 may suppress the tumor immune response of HCC by upregulating the entry of neutrophils, eosinophils, NK cells, Tcm, and DCs and downregulating the entry of Th2 into tumors. FCN2 also interacts with CCL14, CCL23, KDR, CD276, TNFSF4, and TNFRSF4. Because these immune-related associations are so significant, FCN2 may be developed as an immune checkpoint inhibitor for liver cancer. However, there is still potential for improvement in our research because the precise involvement of the FCN2 gene in the onset and progression of liver cancer, as well as its mechanism of impact, remains unclear, and many hypotheses must be confirmed by clinical data. It is hoped that by analyzing the mechanism and characteristics of FCN2 in the development of HCC, this study can provide useful information for the future of liver cancer.
Data availability statement
Publicly available datasets were analyzed in this study. These data can be found here: National Center for Biotechnology Information (NCBI) Gene Expression Omnibus (GEO), https://www.ncbi.nlm.nih.gov/geo/, GSE45267, GSE87630, and GSE54236.
Ethics statement
Written informed consent was obtained from the individual(s), and minor(s)’ legal guardian/next of kin, for the publication of any potentially identifiable images or data included in this article.
Author contributions
XL contributed to the experimental idea and guidance. L-tW designed the experiments. Z-yC and X-lW collected the data. S-lJ and Q-lZ participated in the data analysis and interpretation. L-tW, Z-yC, X-lW, S-lJ, and Q-lZ drafted the manuscript. LL did an immunohistochemical test. L-tW revised the manuscript. All authors contributed to the article and approved the submitted version.
Funding
The Natural Science Foundation of Guangxi Province (grant no. 2017GXNSFAA198063) and the Guangxi Medical University’s Basic Medical Science and Technology Innovation Training Fund Project (grant no. GXMUBMSTCF-G15) sponsored this research.
Acknowledgments
The authors express their gratitude to the members for their contributions to this effort.
Conflict of interest
The authors declare that the research was conducted in the absence of any commercial or financial relationships that could be construed as a potential conflict of interest.
Publisher’s note
All claims expressed in this article are solely those of the authors and do not necessarily represent those of their affiliated organizations, or those of the publisher, the editors and the reviewers. Any product that may be evaluated in this article, or claim that may be made by its manufacturer, is not guaranteed or endorsed by the publisher.
Supplementary material
The Supplementary Material for this article can be found online at: https://www.frontiersin.org/articles/10.3389/fonc.2022.987481/full#supplementary-material
Attachment 1 | FCN2mRNA expression in different cells. (A),FCN2 mRNA expression in different cell lines was analyzed based on RNAseq (transcriptome gene sequencing technology). (B),Analysis of FCN2 mRNA expression in different cell lines based on Affy.
Abbreviations
BP, biological processes; CC, cell components; DAVID, the Database for Annotation, Visualization and Integrated Discovery; DEGs, differentially expressed genes; GEO, Gene Expression Omnibus; GEPIA, Gene Expression Profiling Interactive Analysis; GO, Gene Ontology; GTEX, Genotype-Tissue Expression; HCC, hepatocellular carcinoma; KEGG, Kyoto Encyclopedia of Genes and Genomes; LASSO, least absolute shrinkage and selection operator; MF, molecular functions; TCGA, The Cancer Genome Atlas.
References
1. Omata M, Cheng AL, Kokudo N, Kudo M, Lee JM, Jia J, et al. Asia-Pacific clinical practice guidelines on the management of hepatocellular carcinoma: a 2017 update. Hepatol Int (2017) 11(4):317–70. doi: 10.1007/s12072-017-9799-9
2. Yang Y. Cancer immunotherapy: harnessing the immune system to battle cancer. J Clin Invest (2015) 125(9):3335–7. doi: 10.1172/JCI83871
3. Jin J, Zhang XY, Shi JL, Xue XF, Lu LL, Lu JH, et al. Application of AFP whole blood one-step rapid detection kit in screening for HCC in qidong. Am J Cancer Res (2017) 7(6):1384–8.
4. Wang S, Song Z, Tan B, Zhang J, Zhang J, Liu S. Identification and validation of hub genes associated with hepatocellular carcinoma via integrated bioinformatics analysis. Front Oncol (2021) 11:614531. doi: 10.3389/fonc.2021.614531
5. Yue C, Liang C, Ge H, Yan L, Xu Y, Li G, et al. SUCO as a promising diagnostic biomarker of hepatocellular carcinoma: Integrated analysis and experimental validation. Med Sci Monit (2019) 25:6292–303. doi: 10.12659/MSM.915262
6. Xu DD, Wang C, Jiang F, Wei LL, Shi LY, Yu XM, et al. Association of the FCN2 gene single nucleotide polymorphisms with susceptibility to pulmonary tuberculosis. PloS One (2015) 10(9):e0138356. doi: 10.1371/journal.pone.0138356
7. Yang G, Liang Y, Zheng T, Song R, Wang J, Shi H, et al. FCN2 inhibits epithelial-mesenchymal transition-induced metastasis of hepatocellular carcinoma via TGF-β/Smad signaling. Cancer Lett (2016) 378(2):80–6. doi: 10.1016/j.canlet.2016.05.007
8. De Smedt J, van Os EA, Talon I, Ghosh S, Toprakhisar B, Furtado Madeiro Da Costa R, et al. PU.1 drives specification of pluripotent stem cell-derived endothelial cells to LSEC-like cells. Cell Death Dis (2021) 12(1):84. doi: 10.1038/s41419-020-03356-2
9. Tang Z, Li C, Kang B, Gao G, Li C, Zhang Z. GEPIA: a web server for cancer and normal gene expression profiling and interactive analyses. Nucleic Acids Res (2017) 45(W1):W98–102. doi: 10.1093/nar/gkx247
10. Tang Z, Kang B, Li C, Chen T, Zhang Z. GEPIA2: an enhanced web server for large-scale expression profiling and interactive analysis. Nucleic Acids Res (2019) 47(W1):W556–60. doi: 10.1093/nar/gkz430
11. Chandrashekar DS, Karthikeyan SK, Korla PK, Patel H, Shovon AR, Athar M, et al. UALCAN: An update to the integrated cancer data analysis platform. Neoplasia (2022) 25:18–27. doi: 10.1016/j.neo.2022.01.001
12. Chandrashekar DS, Bashel B, Balasubramanya SAH, Creighton CJ, Rodriguez IP, Chakravarthi BVSK, et al. UALCAN: A portal for facilitating tumor subgroup gene expression and survival analyses. Neoplasia (2017) 19(8):649–58. doi: 10.1016/j.neo.2017.05.002
13. Lánczky A, Győrffy B. Web-based survival analysis tool tailored for medical research (KMplot): Development and implementation. J Med Internet Res (2021) 23(7):e27633. doi: 10.2196/27633
14. Hummelshoj T, Munthe-Fog L, Madsen HO, Fujita T, Matsushita M, Garred P. Polymorphisms in the FCN2 gene determine serum variation and function of ficolin-2. Hum Mol Genet (2005) 14(12):1651–8. doi: 10.1093/hmg/ddi173
15. Yang YF, Zhou YD, Hu JC, Luo FL, Xie Y, Shen YY, et al. Ficolin-A/2, acting as a new regulator of macrophage polarization, mediates the inflammatory response in experimental mouse colitis. Immunology (2017) 151(4):433–50. doi: 10.1111/imm.12741
16. Ding Q, Shen Y, Li D, Yang J, Yu J, Yin Z, et al. Ficolin-2 triggers antitumor effect by activating macrophages and CD8+ T cells. Clin Immunol (2017) 183:145–57. doi: 10.1016/j.clim.2017.08.012
17. Wang Y, Fang Y, Zhao F, Gu J, Lv X, Xu R, et al. Identification of GGT5 as a novel prognostic biomarker for gastric cancer and its correlation with immune cell infiltration. Front Genet (2022) 13:810292. doi: 10.3389/fgene.2022.810292
18. Guo Y, Yang J, Ren K, Tian X, Gao H, Tian X, et al. The heterogeneity of immune cell infiltration landscape and its immunotherapeutic implications in hepatocellular carcinoma. Front Immunol (2022) 13:861525. doi: 10.3389/fimmu.2022.861525
19. Wong L, Bozhilov K, Hernandez B, Kwee S, Chan O, Ellis L, et al. Underlying liver disease and advanced stage liver cancer are associated with elevated neutrophil-lymphocyte ratio. Clin Mol Hepatol (2019) 25(3):305–16. doi: 10.3350/cmh.2019.0004
20. Min GT, Li YM, Yao N, Wang J, Wang HP, Chen W. The pretreatment neutrophil-lymphocyte ratio may predict prognosis of patients with liver cancer: A systematic review and meta-analysis. Clin Transpl (2018) 32(1):10. doi: 10.1111/ctr.13151
21. Varricchi G, Galdiero MR, Loffredo S, Lucarini V, Marone G, Mattei F, et al. Eosinophils: The unsung heroes in cancer? Oncoimmunology (2017) 7(2):e1393134. doi: 10.1080/2162402X.2017.1393134
22. Sajid M, Liu L, Sun C. The dynamic role of NK cells in liver cancers: Role in HCC and HBV associated HCC and its therapeutic implications. Front Immunol (2022) 13:887186. doi: 10.1186/s12876-021-01833-2
23. Lee. HA, Goh HG, Lee YS, Jung YK, Kim JH, Yim HJ, et al. Natural killer cell activity is a risk factor for the recurrence risk after curative treatment of hepatocellular carcinoma. BMC Gastroenterol (2021) 21(1):258. doi: 10.1186/s12876-021-01833-2
24. Sha WH, Zeng XH, Min L. The correlation between NK cell and liver function in patients with primary hepatocellular carcinoma. Gut Liver (2014) 8(3):298–305. doi: 10.5009/gnl.2014.8.3.298
25. Lu Y, Yang A, Quan C, Pan Y, Zhang H, Li Y, et al. A single-cell atlas of the multicellular ecosystem of primary and metastatic hepatocellular carcinoma. Nat Commun (2022) 13(1):4594. doi: 10.1038/s41467-022-32283-3
26. Yang T, Zhang W, Wang L, Xiao C, Wang L, Gong Y, et al. Co-Culture of dendritic cells and cytokine-induced killer cells effectively suppresses liver cancer stem cell growth by inhibiting pathways in the immune system. BMC Cancer (2018) 18(1):984. doi: 10.26355/eurrev_201802_14312
27. He W, Huang Z, Zhou S, Huang L, Wang B, Zhu L, et al. The effect of DC+CIK combined therapy on rat liver cancer model and its modulatory effect on immune functions. Eur Rev Med Pharmacol Sci (2018) 22(3):778–85.
28. Pei M, Li H, Zhu Y, Lu J, Zhang C. In vitro evidence of oncofetal antigen and TLR-9 agonist co-delivery by alginate nanovaccines for liver cancer immunotherapy. Biomater Sci (2022) 10(11):2865–76. doi: 10.24875/CIRU.21000361
29. Li C, Li S, Zhang J, Sun F. The increased ratio of Treg/Th2 in promoting metastasis of hepatocellular carcinoma. El aumento de la proporción de Treg/Th2 en la promoción de la metástasis del carcinoma hepatocelular. Cir Cir (2022) 90(2):187–92. doi: 10.24875/CIRU.21000361
30. Ji L, Gu J, Chen L, Miao D. Changes of Th1/Th2 cytokines in patients with primary hepatocellular carcinoma after ultrasound-guided ablation. Int J Clin Exp Pathol (2017) 10(8):8715–20. doi: 10.1038/s41598-018-21937-2
31. Foerster F, Hess M, Gerhold-Ay A, Marquardt JU, Becker D, Galle PR, et al. The immune contexture of hepatocellular carcinoma predicts clinical outcome. Sci Rep (2018) 8(1):5351. doi: 10.1038/s41598-018-21937-2
32. Muppala S. Significance of the tumor microenvironment in liver cancer progression. Crit Rev Oncog (2020) 25(1):1–9. doi: 10.1615/CritRevOncog.2020034987
33. Gu Y, Li X, Bi Y, Zheng Y, Wang J, Li X, et al. CCL14 is a prognostic biomarker and correlates with immune infiltrates in hepatocellular carcinoma. Aging (Albany NY) (2020) 12(1):784–807. doi: 10.1038/s41419-019-1966-6
34. Zhu M, Xu W, Wei C, Huang J, Xu J, Zhang Y, et al. CCL14 serves as a novel prognostic factor and tumor suppressor of HCC by modulating cell cycle and promoting apoptosis. Cell Death Dis (2019) 10(11):796. doi: 10.1038/s41419-019-1966-6
35. Meng J, Wang L, Hou J, Yang X, Lin K, Nan H, et al. CCL23 suppresses liver cancer progression through the CCR1/AKT/ESR1 feedback loop. Cancer Sci (2021) 112(8):3099–110. doi: 10.1111/cas.14995
36. Lu J, Yang Y, Yu P, Tao H, Lu X, Wang L, et al. Bioinformatics analysis and significance of expression of CC chemokine ligand 23 (CCL23) in hepatocellular carcinoma. Xi Bao Yu Fen Zi Mian Yi Xue Za Zhi (2019) 35(10):903–9.
37. Zhao L, Xie C, Liu D, Li T, Zhang Y, Wan C. Early detection of hepatocellular carcinoma in patients with hepatocirrhosis by soluble B7-H3. J Gastrointest Surg (2017) 21(5):807–12. doi: 10.1007/s11605-017-3386-1
38. Kang FB, Wang L, Li D, Zhang YG, Sun DX. Hepatocellular carcinomas promote tumor-associated macrophage M2-polarization via increased B7-H3 expression. Oncol Rep (2015) 33(1):274–82. doi: 10.3892/or.2014.3587
39. Du P, Wang Z, Geng J, Wang Y. Expression and clinical significance of OX40 and OX40L mRNA in hepatocellular carcinoma. Bull Exp Biol Med (2021) 170(4):485–8. doi: 10.1007/s10517-021-05093-8
40. Marra F, Tacke F. Roles for chemokines in liver disease. Gastroenterology (2014) 147(3):577–94.e1. doi: 10.1053/j.gastro.2014.06.043
41. Svegliati-Baroni G, De Minicis S. HIV Protein gp120 and chemokines receptor for liver fibrosis. Gut (2010) 59(4):428–9. doi: 10.1136/gut.2009.195024
42. Apolinario A, Majano PL, Alvarez-Pérez E, Saez A, Lozano C, Vargas J, et al. Increased expression of T cell chemokines and their receptors in chronic hepatitis c: relationship with the histological activity of liver disease. Am J Gastroenterol (2002) 97(11):2861–70. doi: 10.1111/j.1572-0241.2002.07054.x
43. Luo L, Chen L, Ke K, Zhao B, Wang L, Zhang C, et al. High expression levels of CLEC4M indicate poor prognosis in patients with hepatocellular carcinoma. Oncol Lett (2020) 19(3):1711–20. doi: 10.3892/ol.2020.11294
44. Fujimori Y, Harumiya S, Fukumoto Y, Miura Y, Yagasaki K, Tachikawa H, et al. Molecular cloning and characterization of mouse ficolin-a. Biochem Biophys Res Commun (1998) 244(3):796–800. doi: 10.1006/bbrc.1998.8344
45. Ohashi T, Erickson HP. Oligomeric structure and tissue distribution of ficolins from mouse, pig and human. Arch Biochem Biophys (1998) 360(2):223–32. doi: 10.1006/abbi.1998.0957
46. Giamas G. Cancer gene therapy: vision and strategy for the new decade. Cancer Gene Ther (2020) 27(3-4):115. doi: 10.1038/s41417-020-0169-8
Keywords: ficolin-2 lectin, liver cancer, bioinformatics, immunohistochemical test, immune-related
Citation: Wang L-t, Zeng Q-l, Jiang S-l, Chen Z-y, Wang X-l, Li L and Li X (2022) Ficolin-2: A potential immune-related therapeutic target with low expression in liver cancer. Front. Oncol. 12:987481. doi: 10.3389/fonc.2022.987481
Received: 06 July 2022; Accepted: 04 October 2022;
Published: 08 November 2022.
Edited by:
Fan Feng, The 302th Hospital of PLA, ChinaCopyright © 2022 Wang, Zeng, Jiang, Chen, Wang, Li and Li. This is an open-access article distributed under the terms of the Creative Commons Attribution License (CC BY). The use, distribution or reproduction in other forums is permitted, provided the original author(s) and the copyright owner(s) are credited and that the original publication in this journal is cited, in accordance with accepted academic practice. No use, distribution or reproduction is permitted which does not comply with these terms.
*Correspondence: Ling Li, liling_medi@163.com; Xiaolong Li, xlongli@outlook.com
†These authors have contributed equally to this work