
95% of researchers rate our articles as excellent or good
Learn more about the work of our research integrity team to safeguard the quality of each article we publish.
Find out more
ORIGINAL RESEARCH article
Front. Oncol. , 18 August 2022
Sec. Genitourinary Oncology
Volume 12 - 2022 | https://doi.org/10.3389/fonc.2022.985940
This article is part of the Research Topic The Application of Artificial Intelligence In Diagnosis, Treatment and Prognosis In Urologic Oncology View all 11 articles
 Xiaobin Deng1,2
 Tianyu Li1,2,3Linjian Mo1,2,3
 Fubo Wang1,2,3
 Jin Ji4Xing He4Bashir Hussein Mohamud1,2Swadhin Pradhan1,2Jiwen Cheng1,2,3*
Objective: The aim of this study was to develop a predictive model to improve the accuracy of prostate cancer (PCa) detection in patients with prostate specific antigen (PSA) levels ≤20 ng/mL at the initial puncture biopsy.
Methods: A total of 146 patients (46 with Pca, 31.5%) with PSA ≤20 ng/mL who had undergone transrectal ultrasound-guided 12+X prostate puncture biopsy with clear pathological results at the First Affiliated Hospital of Guangxi Medical University (November 2015 to December 2021) were retrospectively evaluated. The validation group was 116 patients drawn from Changhai Hospital(52 with Pca, 44.8%). Age, body mass index (BMI), serum PSA, PSA-derived indices, several peripheral blood biomarkers, and ultrasound findings were considered as predictive factors and were analyzed by logistic regression. Significant predictors (P < 0.05) were included in five machine learning algorithm models. The performance of the models was evaluated by receiver operating characteristic curves. Decision curve analysis (DCA) was performed to estimate the clinical utility of the models. Ten-fold cross-validation was applied in the training process.
Results: Prostate-specific antigen density, alanine transaminase-to-aspartate transaminase ratio, BMI, and urine red blood cell levels were identified as independent predictors for the differential diagnosis of PCa according to multivariate logistic regression analysis. The RandomForest model exhibited the best predictive performance and had the highest net benefit when compared with the other algorithms, with an area under the curve of 0.871. In addition, DCA had the highest net benefit across the whole range of cut-off points examined.
Conclusion: The RandomForest-based model generated showed good prediction ability for the risk of PCa. Thus, this model could help urologists in the treatment decision-making process.
Prostate cancer (PCa) remains the most common malignancy in men. According to the latest cancer statistics published in 2022, PCa accounts for 27% of newly diagnosed malignancies in males, and is also the second leading cause of death among men with cancer (1). Serum total prostate-specific antigen (tPSA) is a specific tumor biomarker of PCa in the clinical setting. It has high tissue specificity, but is also associated with missed diagnoses and misdiagnoses (2, 3). A variety of benign diseases of the prostate, including benign prostatic hyperplasia and prostatitis, can lead to elevated serum tPSA levels (4, 5). In particular, tPSA levels in the range of 4 to 20 ng/mL are associated with a PCa incidence of less than 25%. In addition, patients with serum tPSA levels ≤4 ng/mL still carry the risk of PCa, and the detection rate in these patients may reach up to 20% (6, 7). Prostate puncture biopsy is currently the standard modality for diagnosing PCa, but as an invasive procedure, it carries a risk of infection. Moreover, the PCa detection rates on initial prostate puncture biopsies range from 23% to 42%. These limitations have greatly restricted its clinical use (8–11).
Given the limitations of the currently used diagnostic methods, a large number of studies are currently devoted to identifying new predictors of PCa. For example, PSA-derived indices, such as free-to-total PSA (F/T) values and prostate-specific antigen density (PSAD), have been found to exhibit greater diagnostic accuracy than PSA alone (12–14). In addition, several inflammatory and neurotrophic markers, including neutrophil-to-lymphocyte ratio, platelet-to-lymphocyte ratio, monocyte-to-lymphocyte ratio (15, 16), gamma-glutamyl transpeptidase-to-lymphocyte count ratio (17, 18), red cell distribution width-to-platelet ratio (19, 20), and alanine transaminase-to-aspartate transaminase ratio (21, 22), have previously been shown to have predictive value not only as inflammatory markers but also as indicators for the diagnosis and prognosis of malignancies. To date, studies focusing on the role of these composite indicators in the differential diagnosis of PCa are limited.
Machine learning (ML), as an important branch of artificial intelligence, can continuously optimize the performance of predictive or diagnostic models by learning and analyzing data, and can handle non-linear relationships better than traditional statistical scores. As a result, ML-based models have great potential for the diagnosis and prognosis of diseases (23–25). Therefore, our goal was to develop a new decision-support ML model based on real-world data for diagnosing PCa in patients with PSA levels ≤20 ng/mL.
This study was approved by the institutional review board of the First Affiliated Hospital of Guangxi Medical University. Written informed consent was obtained from all patients for the storage of their information for the purpose of research. All the research procedures were conducted in accordance with the Declaration of Helsinki.
Data from patients with PCa or benign prostatic hyperplasia who underwent systematic prostate puncture biopsy at our hospital between November 2015 and December 2021 were collected and retrospectively analyzed. We included adult patients with tPSA levels ≤20 ng/ml who underwent transrectal ultrasound (TRUS)-guided prostate puncture biopsy for at least systemic 12 cores with clear pathological results. The exclusion criteria were (1) a history of prostate cancer, prostate surgery, or 5-alpha-reductase inhibitor/drug for the treatment of endocrine dyscrasia in prostate cancer; (2) a diagnosis of prostatitis; (3) digital rectal examination (DRE), transrectal ultrasonography, or cystoscopy within two weeks before PSA detection (as these examinations may affect serum PSA levels); and (4) missing hematological data prior to puncture biopsy. Serum PSA concentrations (tPSA and fPSA) were measured before DRE and TRUS by enzyme-linked immunoassay. Prostate volume (PV) was calculated using the following formula:
PV = 0.52 × anterior/posterior diameter (cm) × left/right diameter (cm) × upper/lower diameter (cm)
TRUS was performed by experienced ultrasonologists.
Continuous variables were converted into categorical variables. The optimum cutoff values obtained from ROC curve analysis were determined by maximizing the Youden index. Logistic regression analysis was applied to calculate the odds ratio (OR) with 95% confidence interval (CI). P < 0.05 was considered to indicate statistical significance. We used five different ML algorithms to analyze our data: logistic regression (LR), XGBoost (XGB), RandomForest (RF), multilayer perceptron (MLP), and k-nearest neighbor (kNN). After training, the model with the highest average AUC was chosen as the best algorithm. Furthermore, the ML-based model was tuned to avoid overfitting, and the accuracy of the algorithm was tested using the ten-fold cross-validation method. All variables were tested for Spearman correlations, and the results are presented as a heat map.
A total of 146 eligible patients were included in this study. The optimal cut-off value of tPSA was 8.47 ng/mL, and the optimal cut-off value of BMI was 23.6 kg/m2. The detailed clinical characteristics of all the patients are presented in Table 1. Among the evaluated clinical characteristics, PSA, F/T, BMI, alanine transaminase-to-aspartate transaminase ratio (LSR), red cell volume distribution width (RDW), alkaline phosphatase (ALP), and urine RBC level were correlated with the risk of PCa. Based on the correlation heat map (Figure 1), eight highly correlated features were chosen as predictors. Weight is inextricably linked to BMI and, to a lesser degree, height. Therefore, we used BMI instead of height or weight, since it is a better indicator of obesity. The external validation cohort was screened based on inclusion and exclusion criteria consistent with the training cohort. Most of the externally validated variables did not differ statistically from the training cohort.
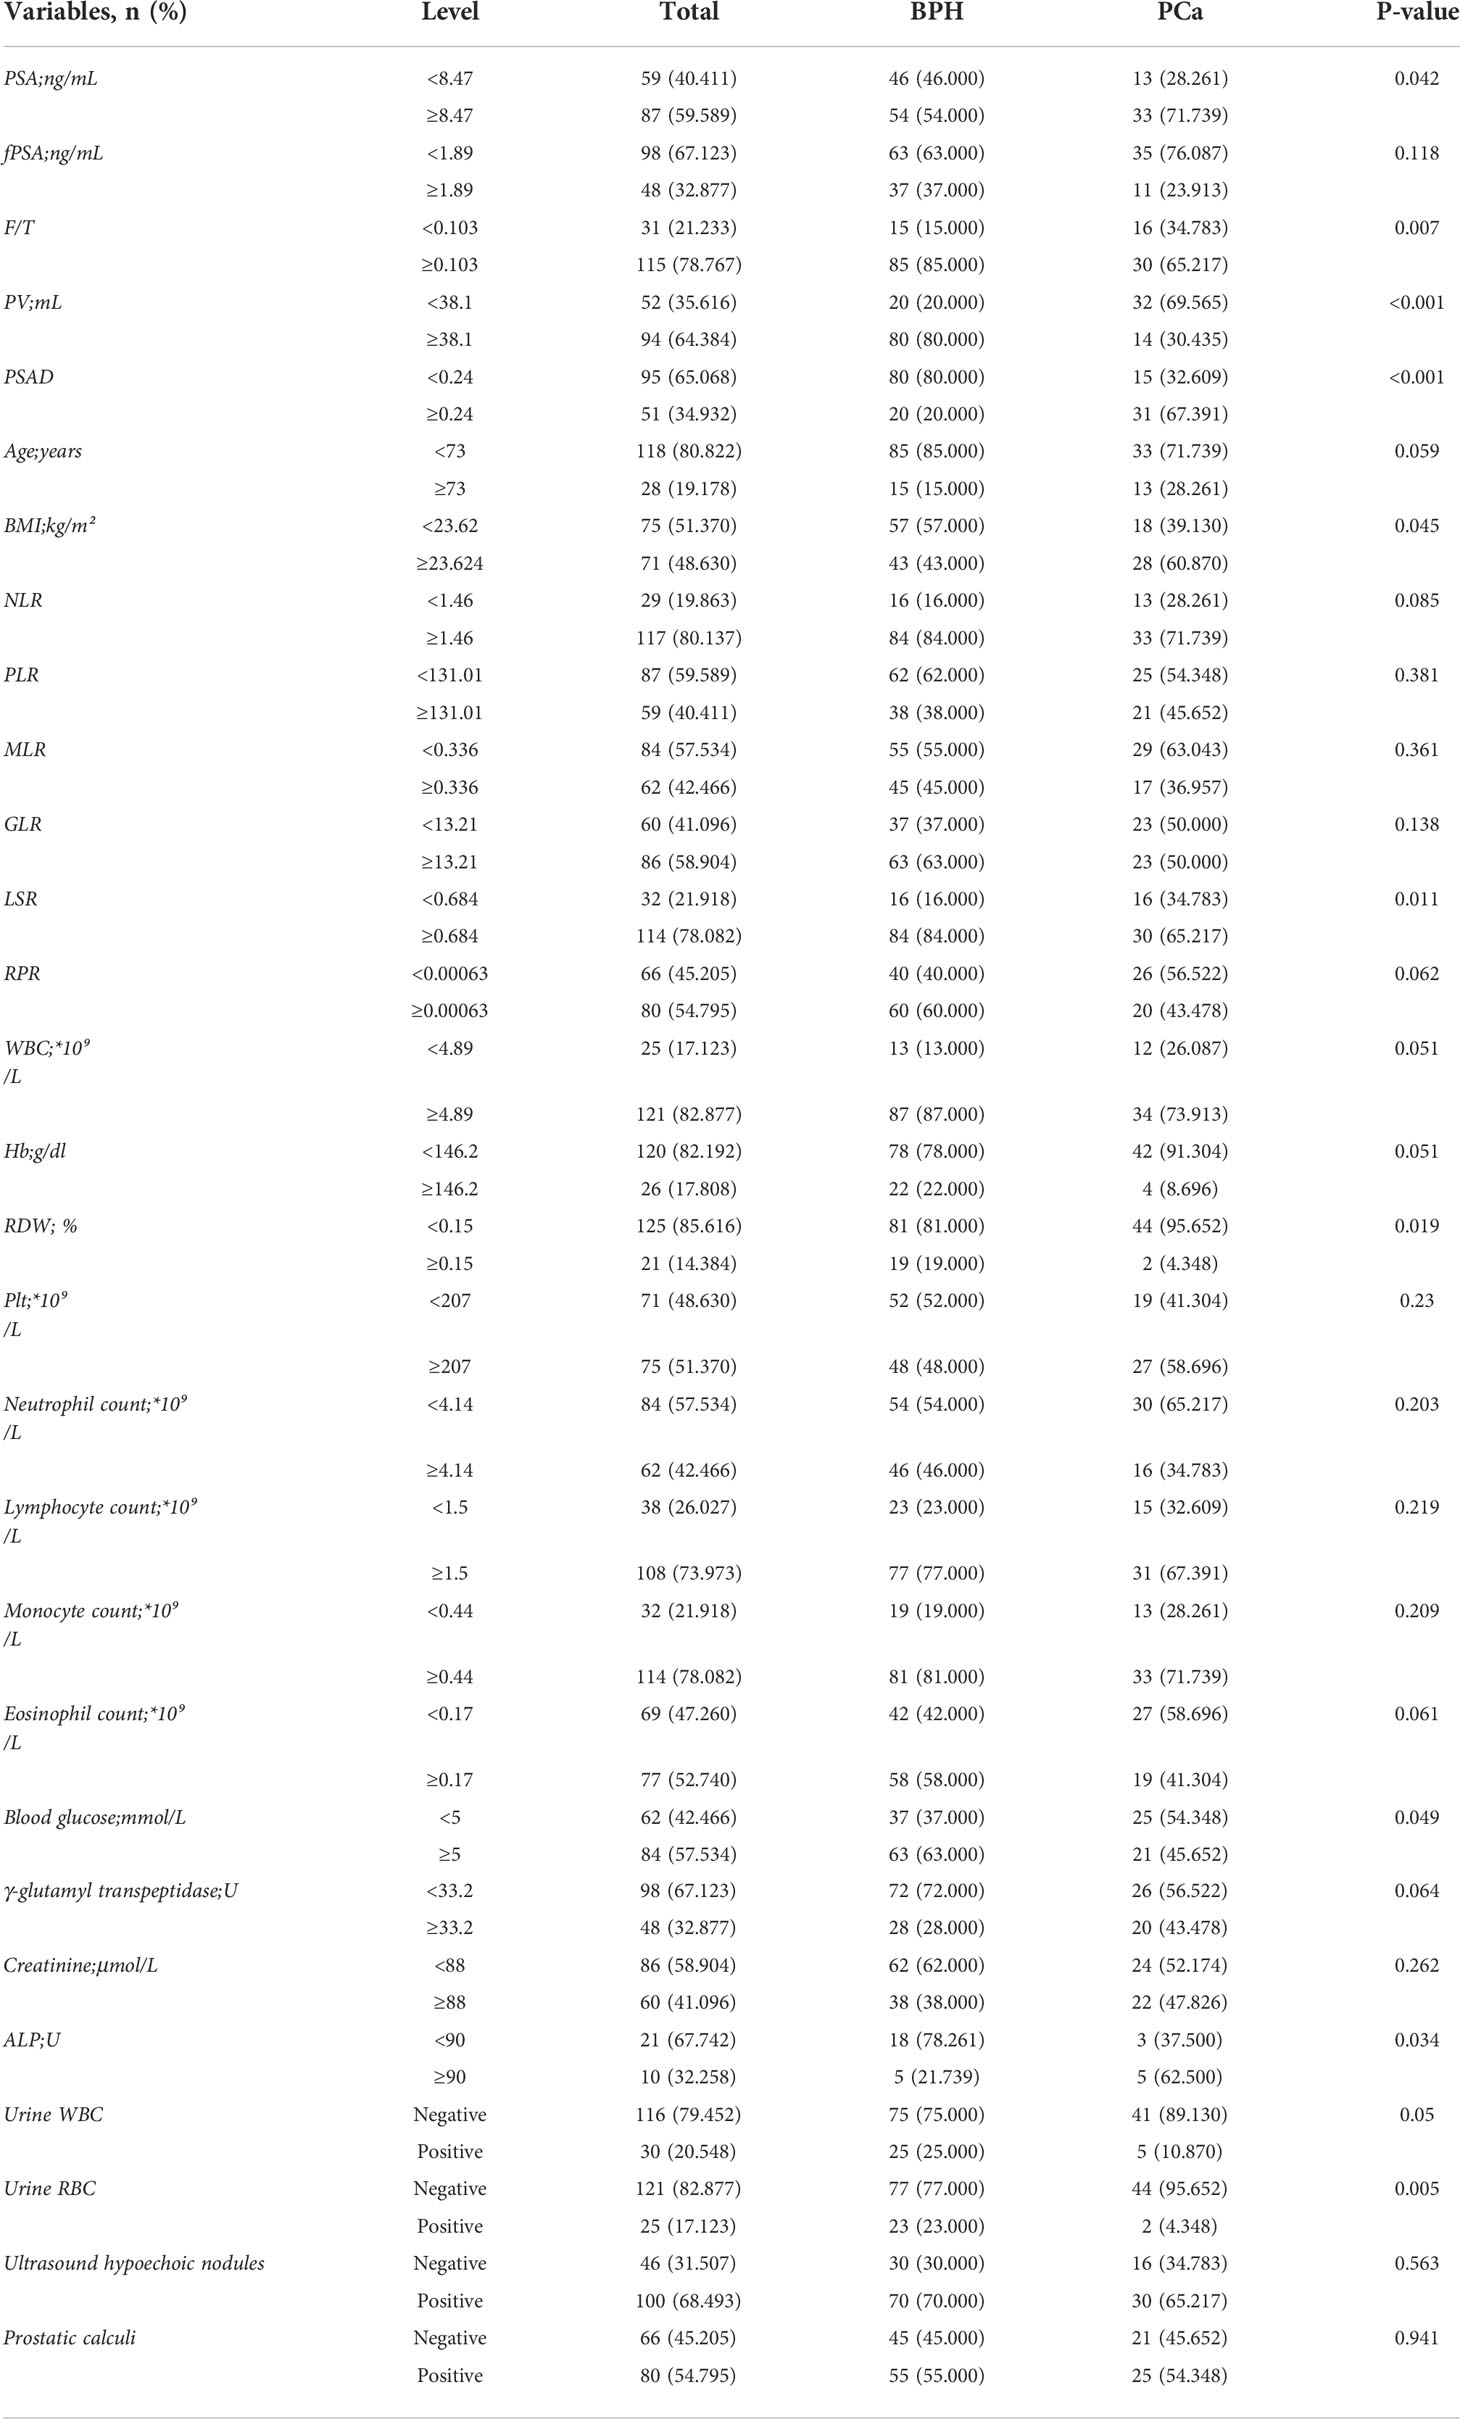
Table 1 Clinical characteristics of patients in the training cohort.
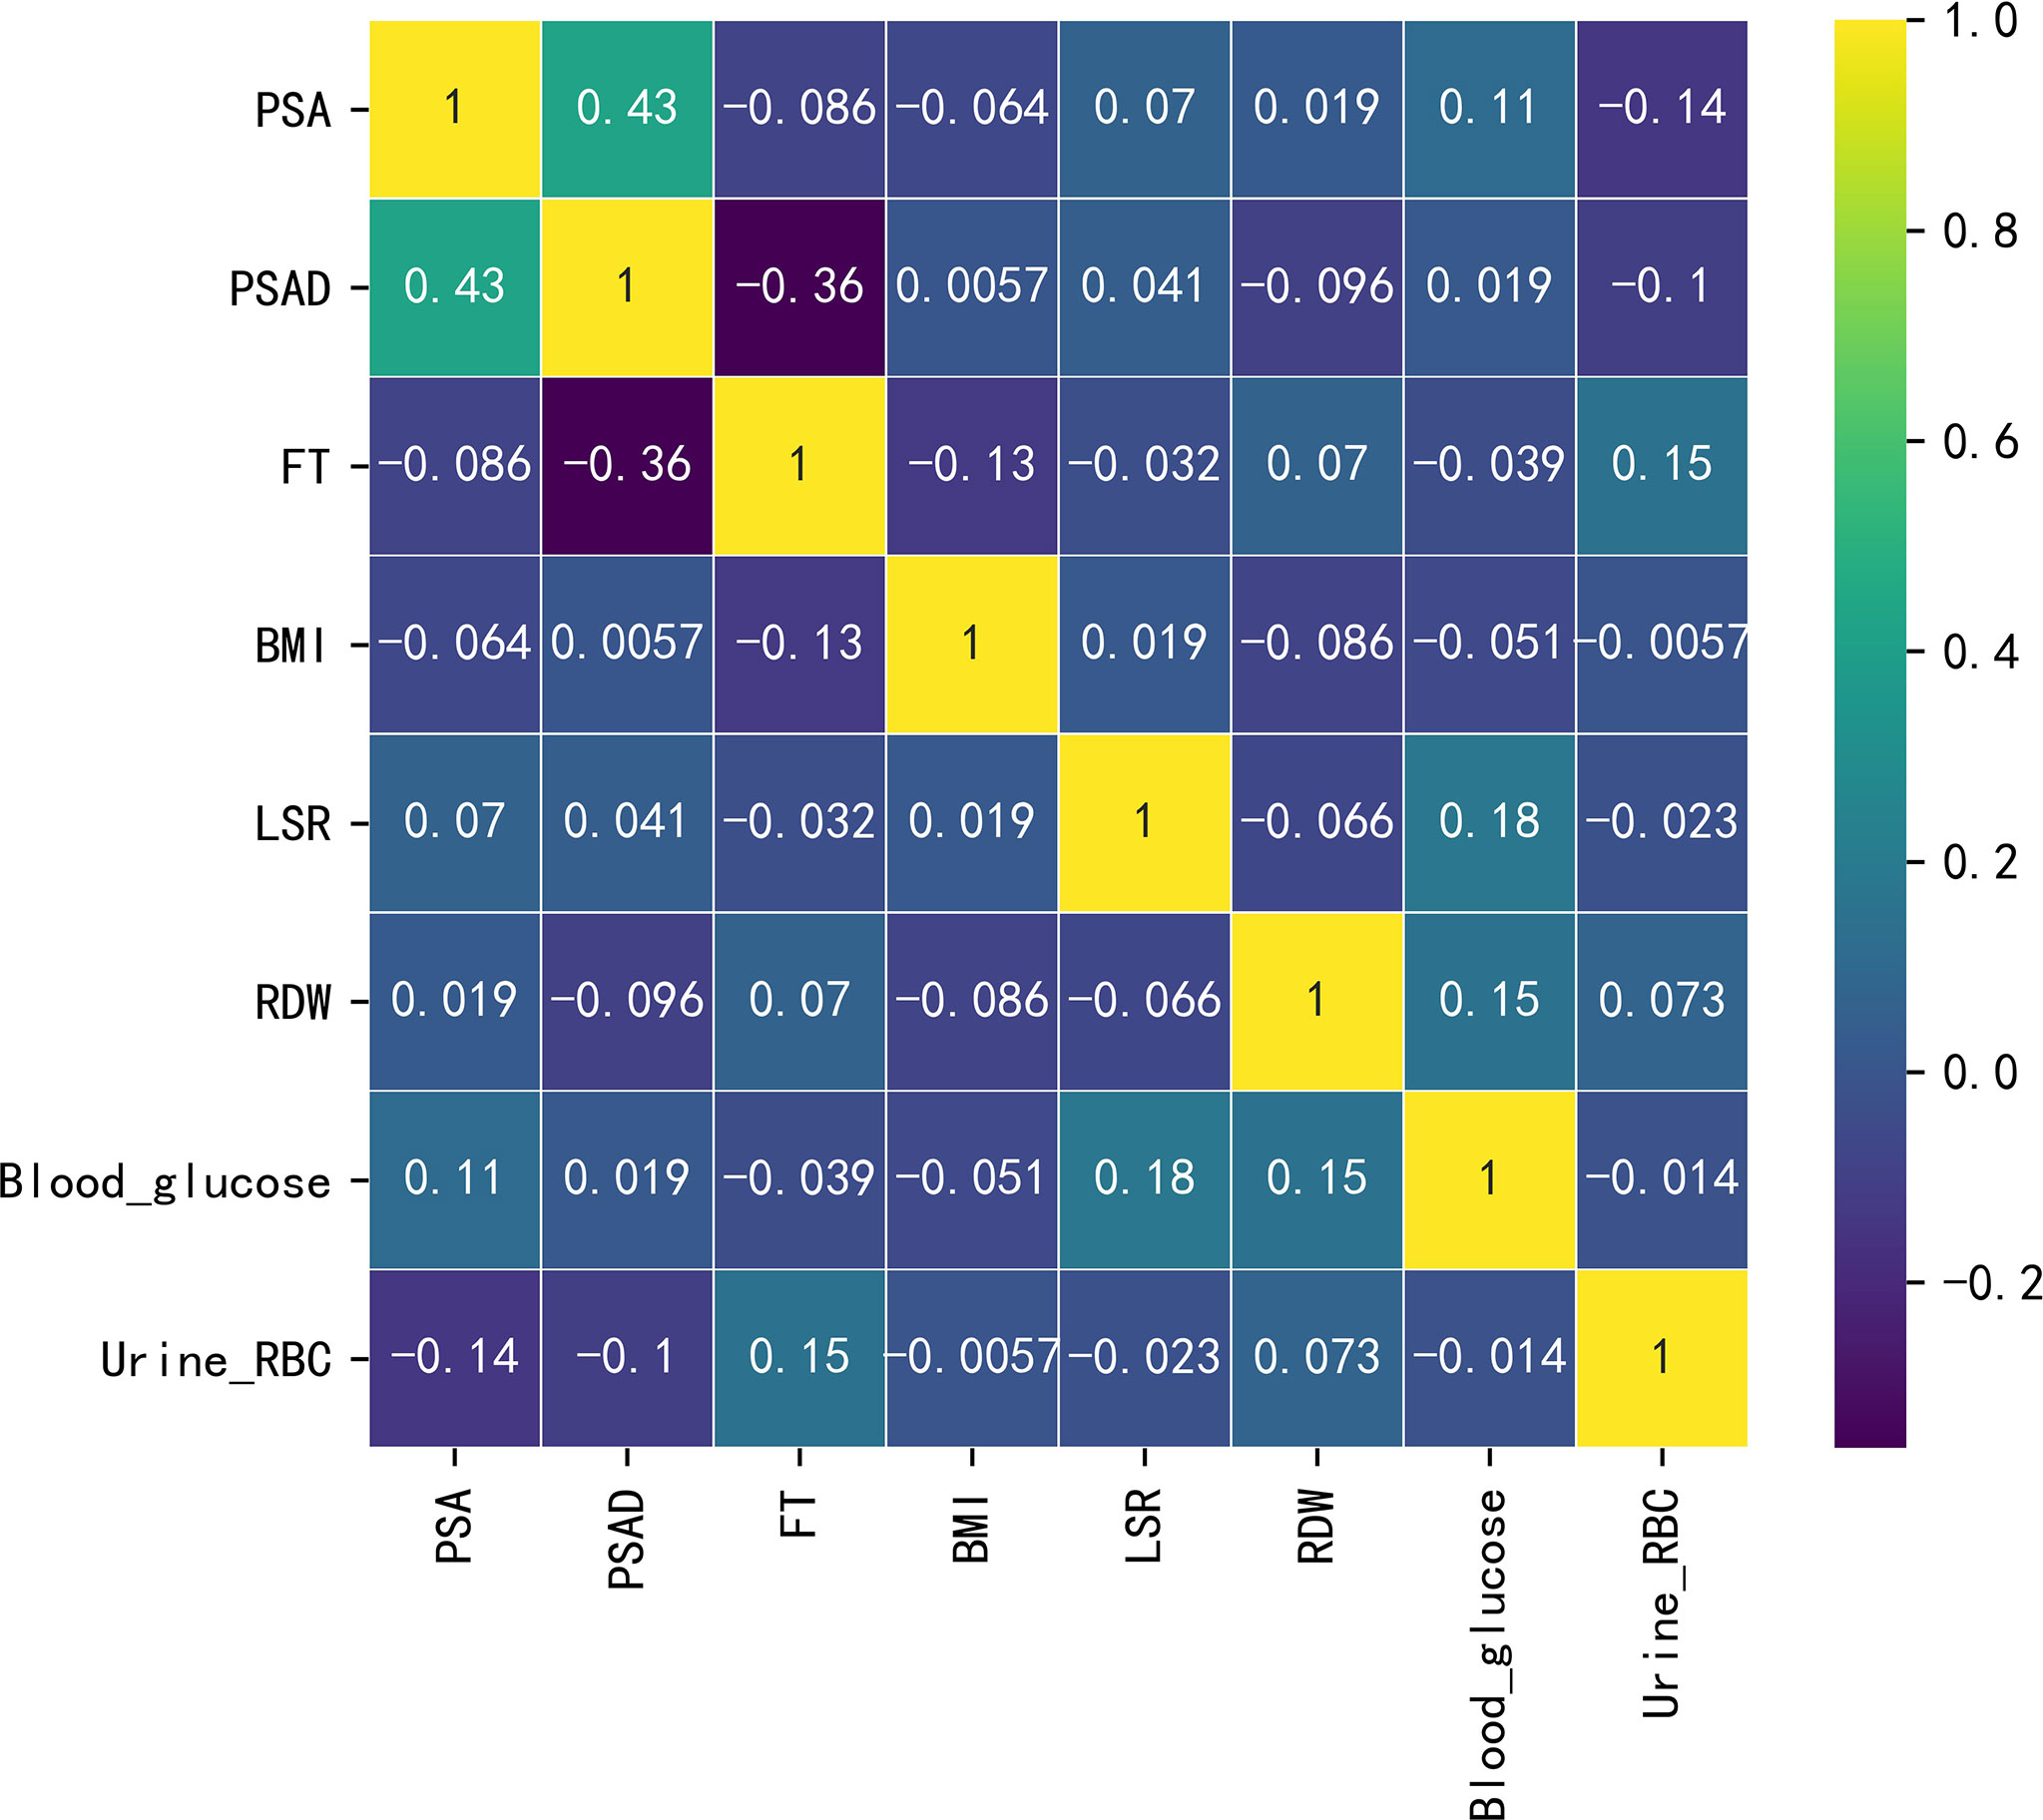
Figure 1 Heat map depicting the correlations between the examined variables.
According to univariate logistic regression analysis (Table 2), tPSA, PSAD, F/T, BMI, LSR, RDW, and blood glucose level were significant predictors of the occurrence of PCa in the overall population (P > 0.05). PSA and PSAD are significantly correlated, and the univariate analysis indicated that PSAD was more statistically significant as a predictor than PSA. Therefore, we only included PSAD in the multivariate analysis. The significant characteristics identified from the univariate analysis above were included in multivariate logistic regression analysis (Table 3). The odds ratios (ORs) calculated indicated the relative risk of PCa. The results showed that PSAD (OR = 11.539, 95% CI = 4.388–33.993), LSR (OR = 0.189, 95% CI = 0.059–0.561), BMI (OR = 2.638, 95% CI = 1.067–6.871), and urine RBC level (OR = 0.136, 95% CI = 0.018–0.620) were independent predictors of PCa. In addition, ALP (OR = 6.00, 95% CI = 1.052–34.212) was also identified as a significant independent predictor (P = 0.044) in univariate logistic regression analysis, but it was not included in further analysis as there were too many missing values (n = 31), Supplementary Tables 2, 3.
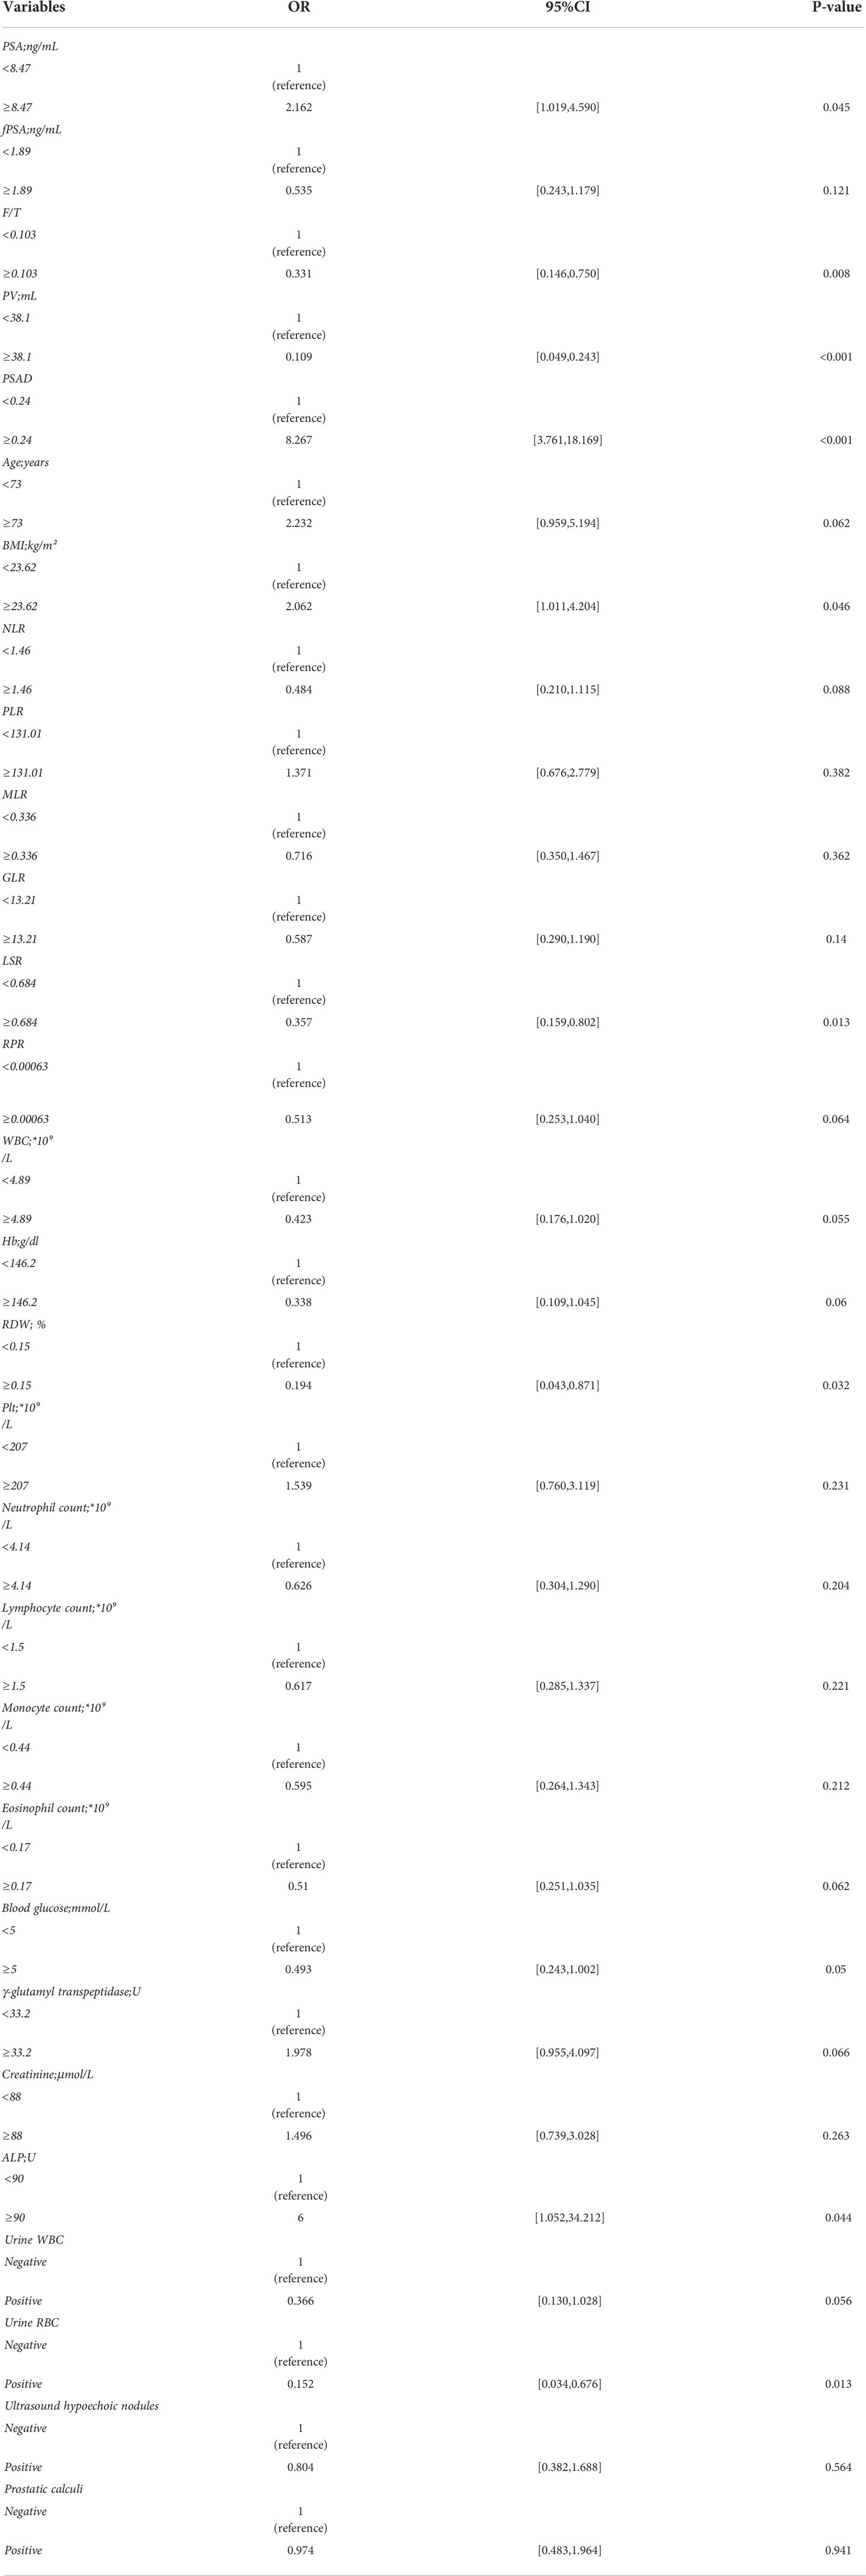
Table 2 Univariate logistic regression in the differential diagnosis of prostate cancer in the whole data cohort.
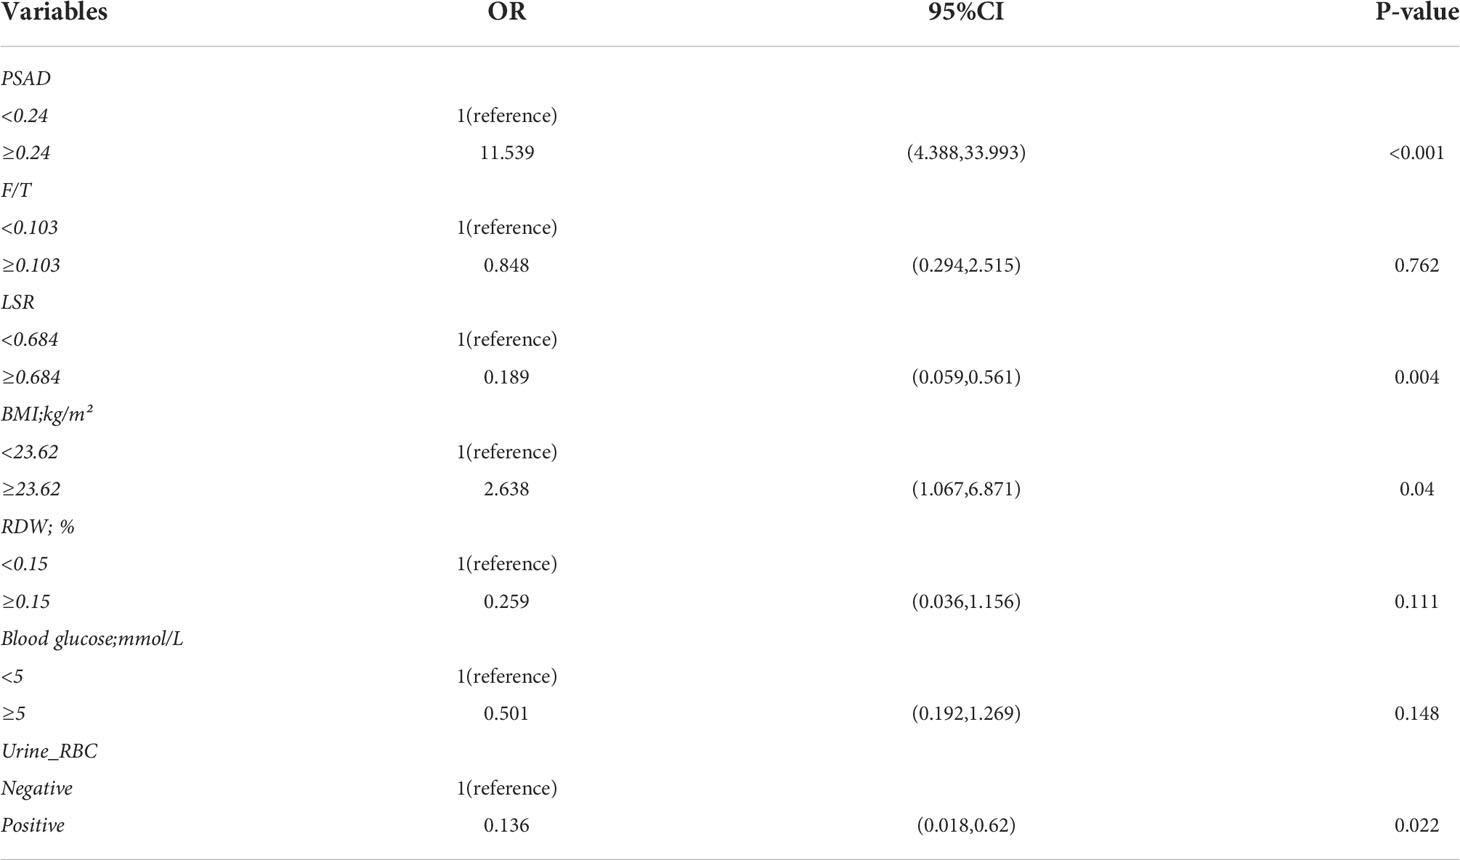
Table 3 Multivariate logistic regression in the differential diagnosis of prostate cancer in the whole data cohort.
To compare the predictive performance of the six ML algorithm models, ten-fold cross validation and decision curve analysis was applied (Figure 2). As shown in the figure, the RF model exhibited the best performance in the differential diagnosis of PCa, with an average AUC of 0.871 (95% CI = 0.808–0.933). The ML algorithm-based models outperformed PSA and its derivatives F/T and PSAD individually by a significant margin (AUC of PSA = 0.589, AUC of F/T = 0.599, AUC of PSAD = 0.737). Therefore, the RF model was finally regarded as the preferred prediction model. In the external validation group (Figure 3), RF (AUC = 0.780, 95% CI = 0.691–0.869), LR (AUC = 0.781, 95% CI = 0.692–0.871) and XGB (AUC = 0.780; 95% CI = 0.692–0.868) showed good AUC values of 0.780. Based on the findings for the training cohort and the external validation cohort together, we finally choose the RF algorithm model as the best model and used it for further analysis.
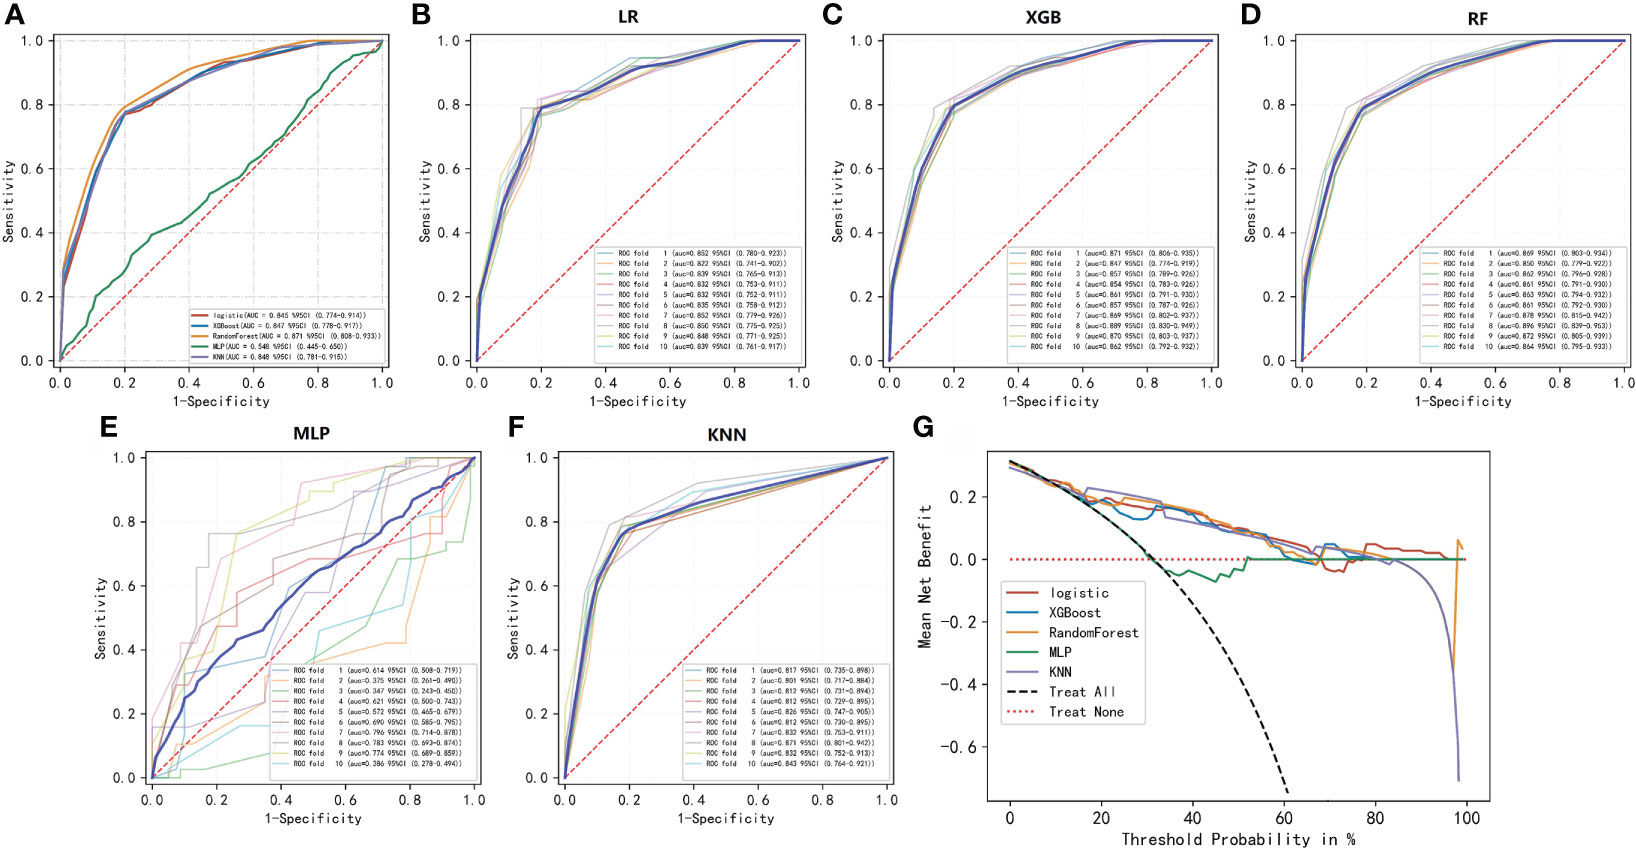
Figure 2 ROC and decision curve analyses of the five ML algorithms. (A–F) ROC curve analysis of a ten-fold cross-validation of five machine learning algorithms for predicting the risk of PCa in the training cohort. (G) Decision curve analysis demonstrating the net benefit associated with the use of the models for the prediction of upstaging.
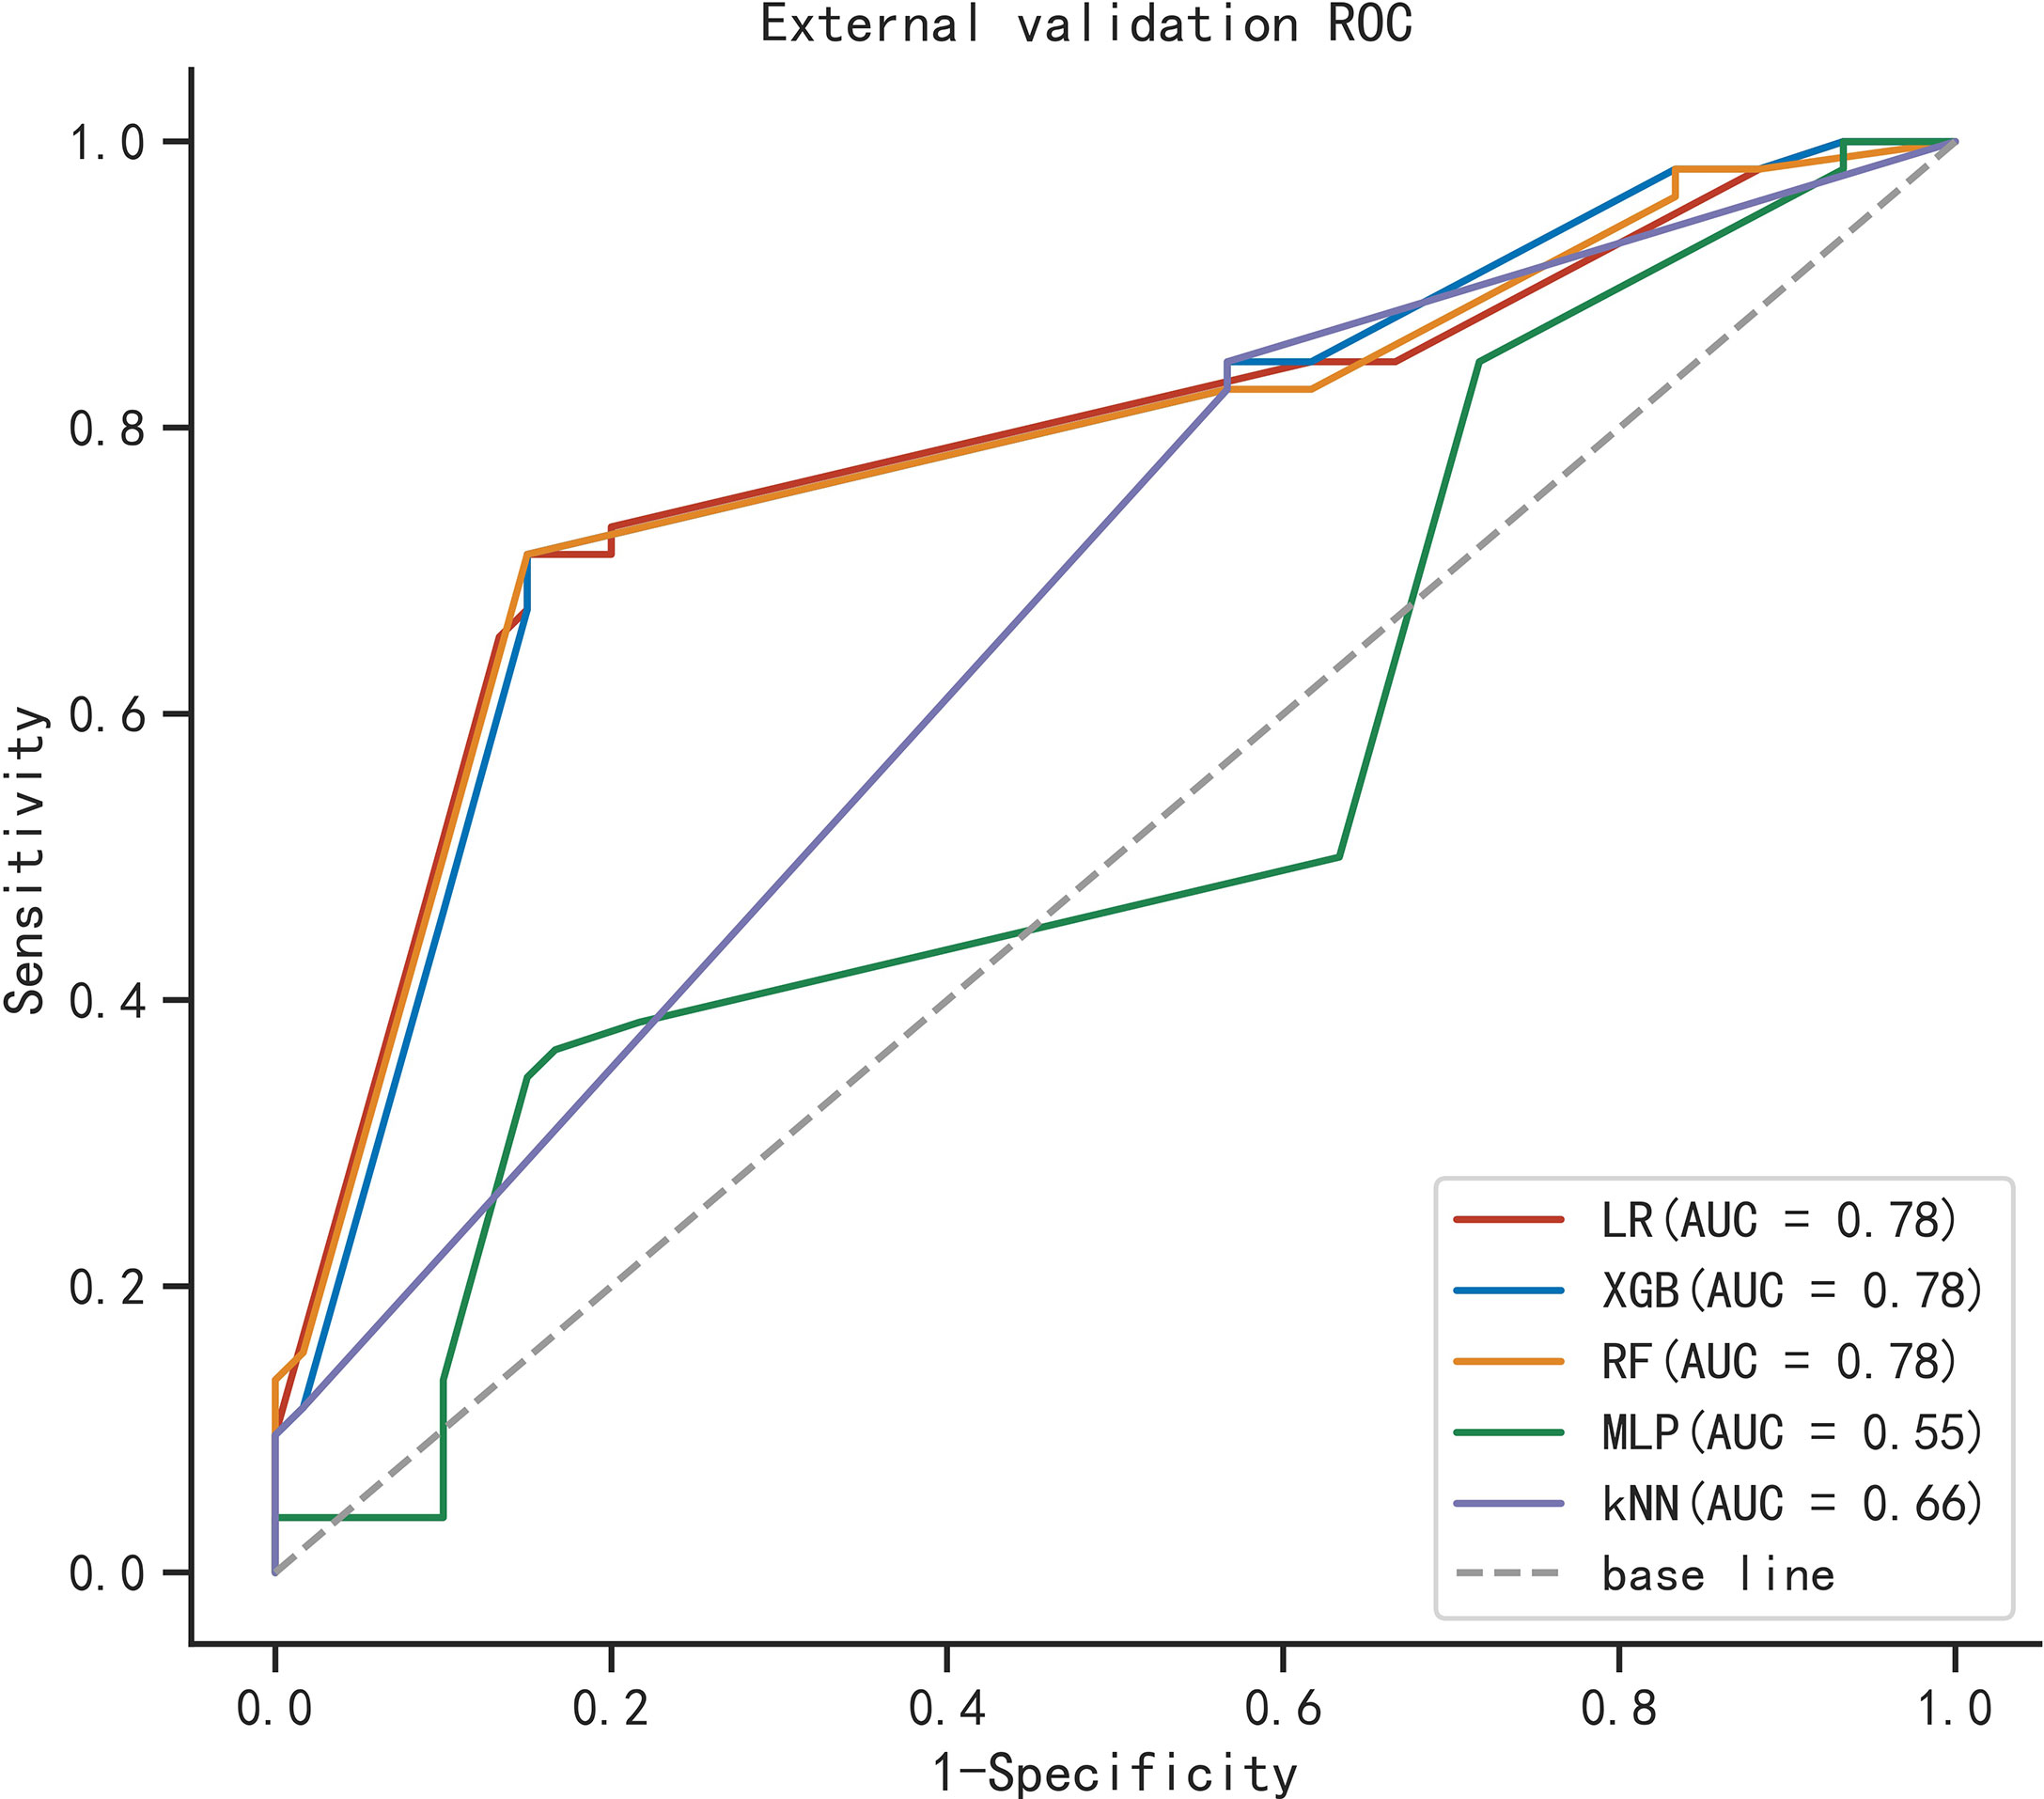
Figure 3 ROC curve analysis of five machine learning algorithms for predicting the risk of PCa in the external cohort.
The importance of the included features based on the RF algorithm differed from each other, and PSAD was identified as the most important variable. They were arranged as follows in descending order of importance: PSAD, LSR, urine RBC level, and BMI (Figure 4).
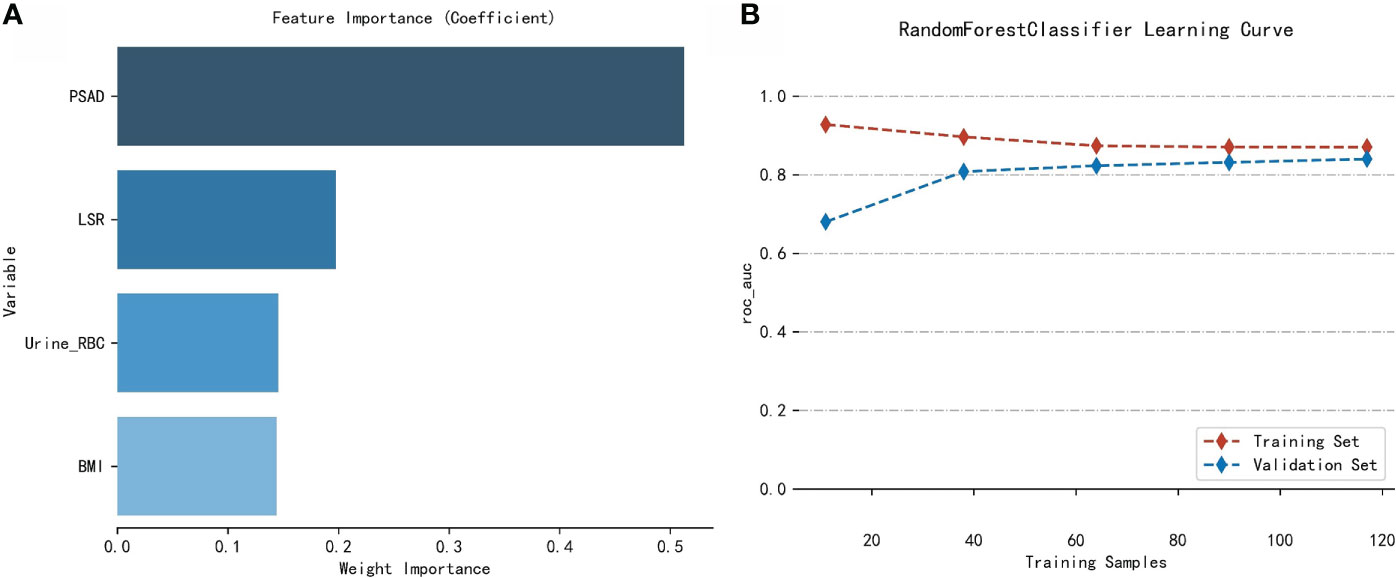
Figure 4 Analysis of the RF model. (A) Importance of the variables included in the RF model in the training cohort. (B) Learning curves of the RF model in the training cohort.
One of the main topics of research on urological prostate cancer is the improvement of prediction accuracy before prostate puncture biopsy in order to reduce unnecessary patient pain without compromising on early intervention in patients with a confirmed diagnosis. The study variables included in this study were non-invasive, and data on these variables were readily available prior to biopsy. Therefore, obtaining the data for these variables did not involve any unduly demanding conditions or excessive medical overhead. Previous studies have mostly been limited to PSA and its derivatives, and there are not enough studies on the differential value of other inflammatory markers (26–28). Further, the currently used prediction nomogram based on the conventional algorithm also has room for further improvement.
The clinical application of ML algorithms may facilitate a paradigm shift in the medical field, as these algorithms are efficient, objective, and reproducible when it comes to large amounts of nonlinear data (24, 29–32). They also have the potential to improve the quality of early diagnosis, identify disease progression, and increase the likelihood of predicting patient-specific outcomes (25, 33, 34). These advantages can facilitate the sharing of information for decision-making between clinicians and patients and promote efficient planning and visualization of the use of healthcare services. In addition, the model can be actively retrained over time to continuously improve its own predictive accuracy.
The AUC value of our RF algorithm was 0.871 in the training cohort, and this value is significantly higher than the individual AUC values of PSA (AUC = 0.589), F/T PSA (AUC = 0.599), and PSAD (AUC = 0.737). The RF-based model performed well in the external validation cohort, with an AUC value of 0.78, a sensitivity of 0.712, and a specificity of 0.85. Decision curve analysis was used to validate the efficacy and potential benefits of our novel model. This ML-based model can be used as a screening tool for prostate biopsy and has the potential to avoid missed diagnosis of PCa. Four independent predictors for PCa diagnosis were identified in our analysis: PSAD, BMI, LSR, and urine RBC level. Previous studies have suggested that obese patients have a higher risk of developing prostate cancer. This is probably because periprostatic fat is biologically active and can secrete factors that promote cancer growth. However, it is unclear whether reversing obesity can mitigate the progression of prostate cancer (35–38). The presence of a visible hematuria is a common sign of prostatic disease. We believe that urine RBC level emerged as a predictive factor in this study because there was a high percentage of patients with benign lesions, and prostatic hyperplasia is associated with a lower incidence of urinary tract symptoms. Difficulty in urination can cause damage to the microvasculature of the urinary system, and this can manifest as urine occult blood. In contrast, PCa in its early clinical stage is often insidious, and most patients only seek treatment when elevated PSA is detected during routine physical examination. In previous studies, LSR has been applied in the evaluation of gestational diabetes (21), diagnosis of cirrhosis (22), and prognosis of different cancers (39, 40). The levels of alanine aminotransferase and aspartate aminotransferase may be affected by obesity (41, 42), and fluctuations in these two indicators may influence the diagnosis of PCa in a similar way that BMI influences PCa. Although ALP was not further analyzed in the current study due to missing data, ALP may still be a promising indicator for the diagnosis of prostate cancer. Further, it has been suggested that prostate cancer may exhibit overexpression of tumor-derived ALP, but this needs to be validated in further studies (43)
Our study has several limitations. First, the small sample size may affect the conclusions of the statistical analysis. Second, our study was a single-center retrospective analysis, so there is a possibility of a selection bias that may have affected the accuracy of our model. Future external validation is needed to assess the clinical application of our ML model by using data from other institutions. Finally, some meaningful indicators may not have been included in our analysis because of the absence of some hematological data, and this may have affected the efficacy of the model. Therefore, these findings need to be confirmed in future investigations on larger patient samples.
We established an efficient ML model for the differential diagnosis of PCa. Our model exhibited excellent predictive accuracy and practical clinical utility, and may help guide the decision-making process of the urologist, avoid unnecessary prostate puncture biopsy, and increase the detection rate of PCa.
The original contributions presented in the study are included in the article/Supplementary Material. Further inquiries can be directed to the corresponding author.
This study was approved by the institutional review board of the First Affiliated Hospital of Guangxi Medical University. Written informed consent was obtained from all patients for the storage of their information for the purpose of research. All the research procedures were conducted in accordance with the Declaration of Helsinki.
XD, TL, LM and FW: contributed to the conception and design. XD, JJ, XH, BM and SP: collected, analyzed the data, drew the figures and tables, and wrote the draft. XD and JC contributed to manuscript writing and revision. All authors approved the final manuscript.
This study was sponsored by Guangxi Science and Technology Base and Talent Project (Grant No. Guike AD20238090) and Guangxi Clinical Research Center for Urology and Nephrology (Grant No. Guike AD20297081).
The authors declare that the research was conducted in the absence of any commercial or financial relationships that could be construed as a potential conflict of interest.
All claims expressed in this article are solely those of the authors and do not necessarily represent those of their affiliated organizations, or those of the publisher, the editors and the reviewers. Any product that may be evaluated in this article, or claim that may be made by its manufacturer, is not guaranteed or endorsed by the publisher.
The Supplementary Material for this article can be found online at: https://www.frontiersin.org/articles/10.3389/fonc.2022.985940/full#supplementary-material
Supplementary Table 1 | Clinical characteristics of patients in the external validation cohort.
Supplementary Table 2 | Raw data from the First Affiliated Hospital of Guangxi Medical University, Guangxi, China.
Supplementary Table 3 | Validation database from Changhai Hospital, Naval Medical University, Shanghai, China.
1. Siegel RL, Miller KD, Fuchs HE, Jemal A. Cancer statistics, 2022. CA Cancer J Clin (2022) 72:7–33. doi: 10.3322/caac.21708
2. Verma P, Malhotra G, Agrawal R, Sonavane S, Meshram V, Asopa RV. Evidence of prostate-specific membrane antigen expression in metastatic differentiated thyroid cancer using 68Ga-PSMA-HBED-CC PET/CT. Clin Nucl Med (2018) 43:e265–8. doi: 10.1097/RLU.0000000000002161
3. Aminsharifi A, Howard L, Wu Y, De Hoedt A, Bailey C, Freedland SJ, et al. Prostate specific antigen density as a predictor of clinically significant prostate cancer when the prostate specific antigen is in the diagnostic gray zone: Defining the optimum cutoff point stratified by race and body mass index. J Urol. (2018) 200:758–66. doi: 10.1016/j.juro.2018.05.016
4. Roehrborn CG, McConnell J, Bonilla J, Rosenblatt S, Hudson PB, Malek GH, et al. Serum prostate specific antigen is a strong predictor of future prostate growth in men with benign prostatic hyperplasia. PROSCAR long-term efficacy and safety study. J Urol. (2000) 163:13–20. doi: 10.1016/S0022-5347(05)67962-1
5. Mao Q, Zheng X, Jia X, Wang Y, Qin J, Yang K, et al. Relationships between total/free prostate-specific antigen and prostate volume in Chinese men with biopsy-proven benign prostatic hyperplasia. Int Urol Nephrol. (2009) 41:761–6. doi: 10.1007/s11255-009-9533-1
6. Ahyai SA, Graefen M, Steuber T, Haese A, Schlomm T, Walz J, et al. Contemporary prostate cancer prevalence among T1c biopsy-referred men with a prostate-specific antigen level < or = 4.0 ng per milliliter. Eur Urol. (2008) 53:750–7. doi: 10.1016/j.eururo.2007.10.017
7. Franlund M, Arnsrud GR, Carlsson SV, Lilja H, Mansson M, Stranne J, et al. Prostate cancer risk assessment in men with an initial P.S.a. below 3 ng/mL: Results from the goteborg randomized population-based prostate cancer screening trial. Scand J Urol. (2018) 52:256–62. doi: 10.1080/21681805.2018.1508166
8. Huang GL, Kang CH, Lee WC, Chiang PH. Comparisons of cancer detection rate and complications between transrectal and transperineal prostate biopsy approaches - a single center preliminary study. BMC Urol. (2019) 19:101. doi: 10.1186/s12894-019-0539-4
9. Mottet N, Bellmunt J, Bolla M, Briers E, Cumberbatch MG, De Santis M, et al. EAU-ESTRO-SIOG guidelines on prostate cancer. part 1: Screening, diagnosis, and local treatment with curative intent. Eur Urol. (2017) 71:618–29. doi: 10.1016/j.eururo.2016.08.003
10. Ilic D, Djulbegovic M, Jung JH, Hwang EC, Zhou Q, Cleves A, et al. Prostate cancer screening with prostate-specific antigen (PSA) test: A systematic review and meta-analysis. BMJ (2018) 362:k3519. doi: 10.1136/bmj.k3519
11. Chun FK, Epstein JI, Ficarra V, Freedland SJ, Montironi R, Montorsi F, et al. Optimizing performance and interpretation of prostate biopsy: A critical analysis of the literature. Eur Urol. (2010) 58:851–64. doi: 10.1016/j.eururo.2010.08.041
12. Pye H, Singh S, Norris JM, Carmona EL, Stavrinides V, Grey A, et al. Evaluation of PSA and PSA density in a multiparametric magnetic resonance imaging-directed diagnostic pathway for suspected prostate cancer: The INNOVATE trial. Cancers (Basel). (2021) 13(8):1985. doi: 10.3390/cancers13081985
13. Chiu ST, Cheng YT, Pu YS, Lu YC, Hong JH, Chung SD, et al. Prostate health index density outperforms prostate health index in clinically significant prostate cancer detection. Front Oncol (2021) 11:772182. doi: 10.3389/fonc.2021.772182
14. Lundgren PO, Kjellman A, Norming U, Gustafsson O. Association between one-time prostate-specific antigen (PSA) test with free/total PSA ratio and prostate cancer mortality: A 30-year prospective cohort study. Bju Int (2021) 128:490–6. doi: 10.1111/bju.15417
15. Hirahara T, Arigami T, Yanagita S, Matsushita D, Uchikado Y, Kita Y, et al. Combined neutrophil-lymphocyte ratio and platelet-lymphocyte ratio predicts chemotherapy response and prognosis in patients with advanced gastric cancer. BMC Cancer. (2019) 19:672. doi: 10.1186/s12885-019-5903-y
16. Robinson AV, Keeble C, Lo M, Thornton O, Peach H, Moncrieff M, et al. The neutrophil-lymphocyte ratio and locoregional melanoma: A multicentre cohort study. Cancer Immunol Immunother. (2020) 69:559–68. doi: 10.1007/s00262-019-02478-7
17. Li S, Xu W, Liao M, Zhou Y, Weng J, Ren L, et al. The significance of gamma-glutamyl transpeptidase to lymphocyte count ratio in the early postoperative recurrence monitoring and prognosis prediction of AFP-negative hepatocellular carcinoma. J Hepatocell Carcinoma. (2021) 8:23–33. doi: 10.2147/JHC.S286213
18. Cakir N, Koc AN. Gamma-glutamyl transpeptidase-platelet ratio, systemic immune inflammation index, and system inflammation response index in invasive aspergillosis. Rev Assoc Med Bras (1992). (2021) 67:1021–5. doi: 10.1590/1806-9282.20210475
19. Zhang X, Wang D, Chen Z, Guo N, Wang W, Xiong C, et al. Red cell distribution width-to-lymphocyte ratio: A novel predictor for HBV-related liver cirrhosis. Med (Baltimore). (2020) 99:e20638. doi: 10.1097/MD.0000000000020600
20. Lehmann F, Schenk LM, Bernstock JD, Bode C, Borger V, Gessler FA, et al. Elevated red cell distribution width to platelet ratio is associated with poor prognosis in patients with spontaneous, deep-seated intracerebral hemorrhage. Front Neurol (2021) 12:751510. doi: 10.3389/fneur.2021.751510
21. Song S, Zhang Y, Qiao X, Duo Y, Xu J, Peng Z, et al. ALT/AST as an independent risk factor of gestational diabetes mellitus compared with TG/HDL-c. Int J Gen Med (2022) 15:115–21. doi: 10.2147/IJGM.S332946
22. Reedy DW, Loo AT, Levine RA. AST/ALT ratio > or = 1 is not diagnostic of cirrhosis in patients with chronic hepatitis c. Dig Dis Sci (1998) 43:2156–9. doi: 10.1023/a:1018888021118
23. Kather JN, Pearson AT, Halama N, Jager D, Krause J, Loosen SH, et al. Deep learning can predict microsatellite instability directly from histology in gastrointestinal cancer. Nat Med (2019) 25:1054–6. doi: 10.1038/s41591-019-0462-y
24. Diller GP, Kempny A, Babu-Narayan SV, Henrichs M, Brida M, Uebing A, et al. Machine learning algorithms estimating prognosis and guiding therapy in adult congenital heart disease: Data from a single tertiary centre including 10 019 patients. Eur Heart J (2019) 40:1069–77. doi: 10.1093/eurheartj/ehy915
25. Wei L, Huang Y, Chen Z, Lei H, Qin X, Cui L, et al. Artificial intelligence combined with big data to predict lymph node involvement in prostate cancer: A population-based study. Front Oncol (2021) 11:763381. doi: 10.3389/fonc.2021.763381
26. Nan LB, Yin XT, Gao JP. Significant diagnostic value of (FPSA)/Prostate-specific antigen density (PSAD) and (F/T)/PSAD for prostate cancer of the chinese population in a single institution. Med Sci Monit (2019) 25:8345–51. doi: 10.12659/MSM.916900
27. Zheng Y, Huang Y, Cheng G, Zhang C, Wu J, Qin C, et al. Developing a new score system for patients with PSA ranging from 4 to 20 ng/mL to improve the accuracy of PCa detection. Springerplus. (2016) 5:1484. doi: 10.1186/s40064-016-3176-3
28. Wu Q, Li F, Yin X, Gao J, Zhang X. Development and validation of a nomogram for predicting prostate cancer in patients with PSA </= 20 ng/mL at initial biopsy. Med (Baltimore). (2021) 100:e28196. doi: 10.1097/MD.0000000000028196
29. Bien N, Rajpurkar P, Ball RL, Irvin J, Park A, Jones E, et al. Deep-learning-assisted diagnosis for knee magnetic resonance imaging: Development and retrospective validation of MRNet. PLoS Med (2018) 15:e1002699. doi: 10.1371/journal.pmed.1002699
30. Deo RC. Machine learning in medicine. Circulation. (2015) 132:1920–30. doi: 10.1161/CIRCULATIONAHA.115.001593
31. Komura D, Ishikawa S. Machine learning approaches for pathologic diagnosis. Virchows Arch (2019) 475:131–8. doi: 10.1007/s00428-019-02594-w
32. Hajiloo M, Rabiee HR, Anooshahpour M. Fuzzy support vector machine: An efficient rule-based classification technique for microarrays. BMC Bioinf (2013) 14 Suppl 13:S4. doi: 10.1186/1471-2105-14-S13-S4
33. Li W, Wang J, Liu W, Xu C, Li W, Zhang K, et al. Machine learning applications for the prediction of bone cement leakage in percutaneous vertebroplasty. Front Public Health (2021) 9:812023. doi: 10.3389/fpubh.2021.812023
34. Wang H, Fan T, Yang B, Lin Q, Li W, Yang M. Development and internal validation of supervised machine learning algorithms for predicting the risk of surgical site infection following minimally invasive transforaminal lumbar interbody fusion. Front Med (Lausanne). (2021) 8:771608. doi: 10.3389/fmed.2021.771608
35. Cao Y, Giovannucci E. Obesity and prostate cancer. Recent Results Cancer Res (2016) 208:137–53. doi: 10.1007/978-3-319-42542-9_8
36. Allott EH, Masko EM, Freedland SJ. Obesity and prostate cancer: Weighing the evidence. Eur Urol. (2013) 63:800–9. doi: 10.1016/j.eururo.2012.11.013
37. Vidal AC, Oyekunle T, Howard LE, De Hoedt AM, Kane CJ, Terris MK, et al. Obesity, race, and long-term prostate cancer outcomes. Cancer-Am Cancer Soc (2020) 126:3733–41. doi: 10.1002/cncr.32906
38. Graff RE, Ahearn TU, Pettersson A, Ebot EM, Gerke T, Penney KL, et al. Height, obesity, and the risk of TMPRSS2:ERG-defined prostate cancer. Cancer Epidemiol Biomarkers Prev (2018) 27:193–200. doi: 10.1158/1055-9965.EPI-17-0547
39. Zhou L, Wang SB, Chen SG, Qu Q, Rui JA. Prognostic value of ALT, AST, and AAR in hepatocellular carcinoma with b-type hepatitis-associated cirrhosis after radical hepatectomy. Clin Lab (2018) 64:1739–47. doi: 10.7754/Clin.Lab.2018.180532
40. Chen SL, Li JP, Li LF, Zeng T, He X. Elevated preoperative serum alanine Aminotransferase/Aspartate aminotransferase (ALT/AST) ratio is associated with better prognosis in patients undergoing curative treatment for gastric adenocarcinoma. Int J Mol Sci (2016) 17(6):911. doi: 10.3390/ijms17060911
41. Johansen MJ, Gade J, Stender S, Frithioff-Bojsoe C, Lund M, Chabanova E, et al. The effect of overweight and obesity on liver biochemical markers in children and adolescents. J Clin Endocrinol Metab (2020) 105(2):dgz010. doi: 10.1210/clinem/dgz010
42. Maldonado-Hernandez J, Saldana-Davila GE, Pina-Aguero MI, Nunez-Garcia BA, Lopez-Alarcon MG. Association between plasmatic ceramides profile and AST/ALT ratio: C14:0 ceramide as predictor of hepatic steatosis in adolescents independently of obesity. Can J Gastroenterol Hepatol (2017) 2017:3689375. doi: 10.1155/2017/3689375
Keywords: prostate cancer, prostate-specific antigen, diagnosis, machine learning, predictive model, real-world study
Citation: Deng X, Li T, Mo L, Wang F, Ji J, He X, Mohamud BH, Pradhan S and Cheng J (2022) Machine learning model for the prediction of prostate cancer in patients with low prostate-specific antigen levels: A multicenter retrospective analysis. Front. Oncol. 12:985940. doi: 10.3389/fonc.2022.985940
Received: 04 July 2022; Accepted: 28 July 2022;
Published: 18 August 2022.
Edited by:
Xiongbing Zu, Xiangya Hospital, Central South University, ChinaReviewed by:
Bin Xu, Shanghai Jiao Tong University, ChinaCopyright © 2022 Deng, Li, Mo, Wang, Ji, He, Mohamud, Pradhan and Cheng. This is an open-access article distributed under the terms of the Creative Commons Attribution License (CC BY). The use, distribution or reproduction in other forums is permitted, provided the original author(s) and the copyright owner(s) are credited and that the original publication in this journal is cited, in accordance with accepted academic practice. No use, distribution or reproduction is permitted which does not comply with these terms.
*Correspondence: Jiwen Cheng, Y2hlbmdqaXdlbjE5NzdAZm94bWFpbC5jb20=
Disclaimer: All claims expressed in this article are solely those of the authors and do not necessarily represent those of their affiliated organizations, or those of the publisher, the editors and the reviewers. Any product that may be evaluated in this article or claim that may be made by its manufacturer is not guaranteed or endorsed by the publisher.
Research integrity at Frontiers
Learn more about the work of our research integrity team to safeguard the quality of each article we publish.