- 1Men’s Health and Reproductive Health Research Center, Shahid Beheshti University of Medical Sciences, Tehran, Iran
- 2Department of Medical Genetics, School of Medicine, Shahid Beheshti University of Medical Sciences, Tehran, Iran
- 3University of Tehran, Tehran, Iran
- 4Department of Pharmacognosy, College of Pharmacy, Hawler Medical University, Erbil, Iraq
- 5Center of Research and Strategic Studies, Lebanese French University, Erbil, Iraq
- 6Urology and Nephrology Research Center, Shahid Beheshti University of Medical Sciences, Tehran, Iran
- 7Institute of Human Genetics, Jena University Hospital, Jena, Germany
- 8Skull Base Research Center, Loghman Hakim Hospital, Shahid Beheshti University of Medical Sciences, Tehran, Iran
Non-functioning pituitary adenoma (NFPA) is a benign tumor arising from the adenohypophyseal cells. They can be associated with symptoms arising from mass effect. Although these tumors are regarded to be benign tumors, they are associated with increased comorbidity and mortality. Several studies have indicated abnormal expression of genes in these tumors. In the current study, we have used existing methods to identify differentially expressed genes (DEGs) including DE long non-coding RNAs (DElncRNAs) and DE microRNAs (DEmiRNAs) in NFPAs compared with normal samples. Then, we have assessed the relation between these genes and important signaling pathways. Our analyses led to identification of 3131 DEGs, including 189 downregulated DEGs (such as RPS4Y1 and DDX3Y) and 2898 upregulated DEGs (such as ASB3 and DRD4), and 44 DElncRNAs, including 8 downregulated DElncRNAs (such as NUTM2B-AS1 and MALAT1) and 36 upregulated DElncRNAs (such as BCAR4 and SRD5A3-AS1). GnRH signaling pathway, Tight junction, Gap junction, Melanogenesis, DNA replication, Nucleotide excision repair, Mismatch repair and N-Glycan biosynthesis have been among dysregulated pathways in NFPAs. Taken together, our study has revealed differential expression of several genes and signaling pathways in this type of tumors.
Introduction
Non-functioning pituitary adenoma (NFPA) is a benign tumor arising from the adenohypophyseal cells. This type of tumor is described by the lack of clinical signs of hypersecretion of hormones. Statistics show a prevalence of 7–41.3/100,000 for NFPA (1–3). The incidence of this type of tumors seems to be increased during recent years, possibly due to enhanced numbers of incidentally identified adenomas in brain imaging conducted for other purposes (4).
Eight subtypes identified for NFPA are as follow: silent gonadotroph, corticotroph, somatotroph, thyrotroph, lactotroph, plurihormonal Pit-1, null-cell, and double/triple NFPAs (5). NFPA has variable clinical manifestations ranging from asymptomatic to symptoms resulting from effects of mass on neighboring regions leading to headache, visual defect, and/or hypopituitarism (2, 6).
Although these tumors are regarded to be benign tumors from a histological point of view, they are associated with increased comorbidity and mortality (3, 7).
Recent studies have indicated abnormal expression pattern of several coding and non-coding genes in NFPA (8, 9). For instance, transcriptome analysis has shown distinct profiles in pituitary adenomas compared to the non-tumoral tissues, irrespective of the identified immunophenotype. Notably, calcium metabolism and immune-related genes are among the mostly altered genes in adenomas (9).
In the current study, we have used existing methods to identify differentially expressed genes (DEGs) including DE long non-coding RNAs (DElncRNAs) and DE microRNAs (DEmiRNAs) in NFPAs compared with normal samples. Then, we have assessed the relation between these genes and important signaling pathways.
Methods
Microarray data collection
We used the Gene Expression Omnibus (GEO; http://www.ncbi.nlm.nih.gov/geo/) to obtain the human expression profiles of GSE62960 (Agilent-014850 Whole Human Genome Microarray 4x44K G4112F) and GSE63357 (Affymetrix Human Genome U133 Plus 2.0 Array), which contained 28 and 25 samples, respectively. We selected 10 non-functioning pituitary adenoma samples from GSE62960 and 5 normal pituitary samples from GSE63357 for further analysis. The expression data contained both lncRNAs and mRNAs expression signatures.
Microarray data processing, integrative meta-analysis and assessment of data quality
Processing and integration of all microarray data were performed using the R statistical programming language, the mentioned datasets have different and trendy platforms (Agilent and Affymetrix), a sensitive step in the integration of heterogeneous data is normalization (10). Batch effects (non-biological differences) were removed by applying the ComBat function from the R Package Surrogate Variable Analysis (SVA) (11). Batch effect removal was checked by PCA and boxplot. The meta-analysis outcome is a unit expression matrix (the combination of four datasets of this study). Then, we used quantile normalization method to normalize data expression matrix.
To accomplish quantile normalization, we used the preprocessCore R package. Also, we utilized ComBat function based on its description in sva package (ComBat permits adjustment of batch effects in datasets where the batch covariate is known (12)) and bioconductor (The sva package can be utilized to eliminate artifacts by three methods: (1) recognizing and appraising surrogate variables for unknown sources of variation in high-throughput experiments (13), (2) directly eliminating identified batch effects using ComBat (12) and (3) removing batch effects with known control probes. We used this function after merging two datasets. This method has been used in recent publications as well (14).
Analysis of differentially expressed lncRNAs and mRNAs
The Limma package in R language (15) was used to obtain DEGs and DElncRNAs between NFPA and normal samples. Furthermore, we used Bonferroni in the multtest package to adjust the P value into the FDR. We used the FDR < 0.05 and |log2 FC| > 1 as the cutoff criteria for DEGs and DElncRNAs. Then we identified DElncRNAs using HUGO gene nomenclature committee.
Two-way clustering of DEGs and DElncRNAs
The gene expression parameters of substantial differentially expressed genes and lncRNAs were obtained. Then, the pheatmap package in R language (version 1.0.12) (16) was used to conduct the two-way clustering based on the Euclidean distance.
Gene ontology (GO) enrichment analyses
In order to find the function of the obtained considerably downregulated and upregulated DEGs, we performed Gene Ontology (GO) enrichment analysis using the clusterProfiler R package (17). We set p-value < 0.05 as the thresholds of the functional categories.
Kyoto encyclopedia of genes and genomes (KEGG) pathway analysis
KEGG pathway analysis of considerably downregulated and upregulated DEGs was performed to find the potential function of these genes contributing to the pathways based on the KEGG database (18).
Constructing the ceRNA network
We built a ceRNA network through the following steps: 1) Searching the miR2Disease database (http://watson.compbio.iupui.edu:8080/miR2Disease/index.jsp) (19) for the pituitary adenoma (PA)-related miRNAs using the keyword “Pituitary Adenoma”. 2) Using miRcode (http://www.mircode.org/) for assessment of interaction between lncRNAs and miRNAs based on the PA-related miRNAs; 2) Application of miRDB (http://www.mirdb.org/) (20), TargetScan (http://www.targetscan.org/) (21) and miRWalk (http://129.206.7.150/) (22) for prediction of miRNAs-targeted mRNAs; 3) Finding the intersections of the differentially expressed lncRNAs and mRNAs, and establishment of lncRNA/mRNA/miRNA ceRNA network using Cytoscape v3.0 (23); and 4) we used cytohubba (24) to detect 15 hub genes with best degree in ceRNA network.
Survival analysis
GEPIA (25) was used to depict survival curves according to prognostic value of top 10 genes with best degree in ceRNA network. The clinical data for patients with low grade glioma was obtained from TCGA. The TCGA-LGG data (https://portal.gdc.cancer.gov/) included 515 primary solid tumor samples. This analysis was done on June 9, 2022.
Kaplan–Meier curves were depicted for evaluation of univariate survival. P-values less than 0.05 were considered statistically significant.
Results
Dataset quality assessment
Figure 1 demonstrates the boxplot of raw data before and after batch effect removal. These boxplots indicates that the quality of the expression data was reliable.
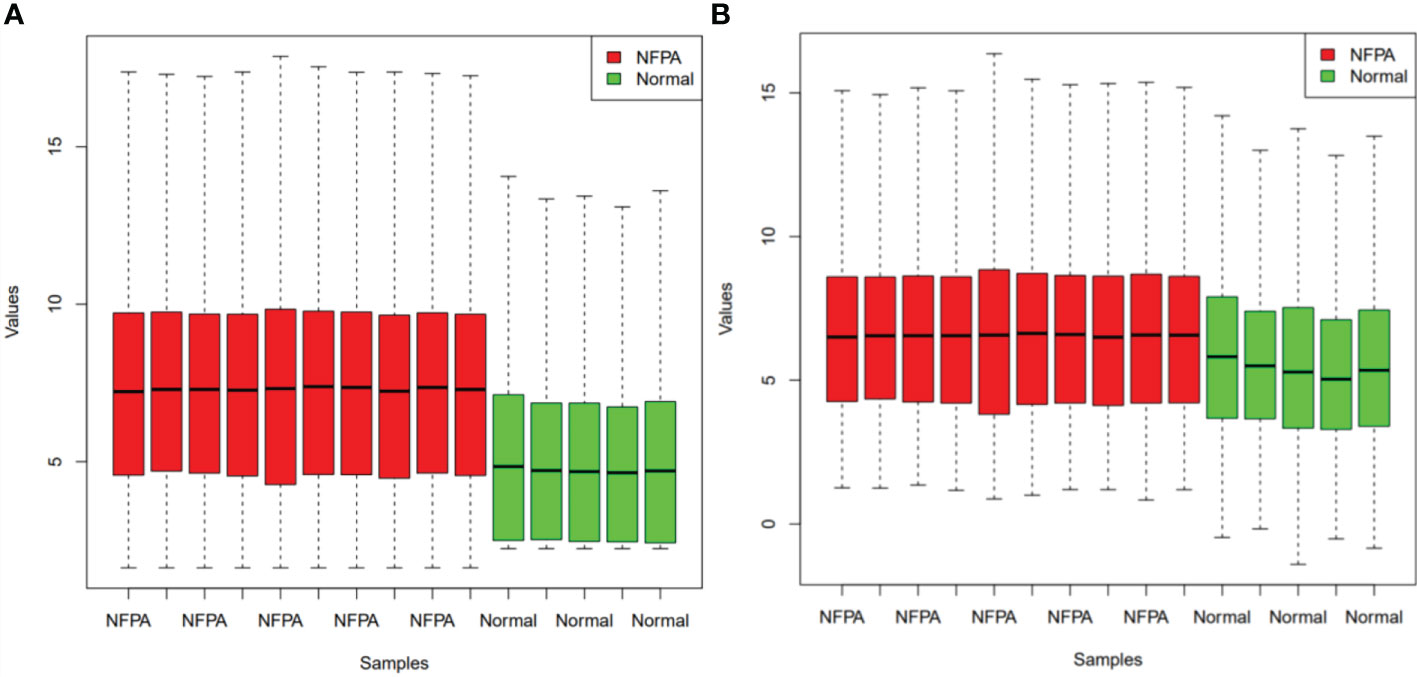
Figure 1 Boxplots for the data before (A) and after (B) batch effect removal. Red boxes indicate NFPA samples and green boxes show healthy samples.
Figure 2 displays the Euclidean distances between the samples after batch effect removal. Tumor and healthy samples were divided into two groups and put into two clusters.
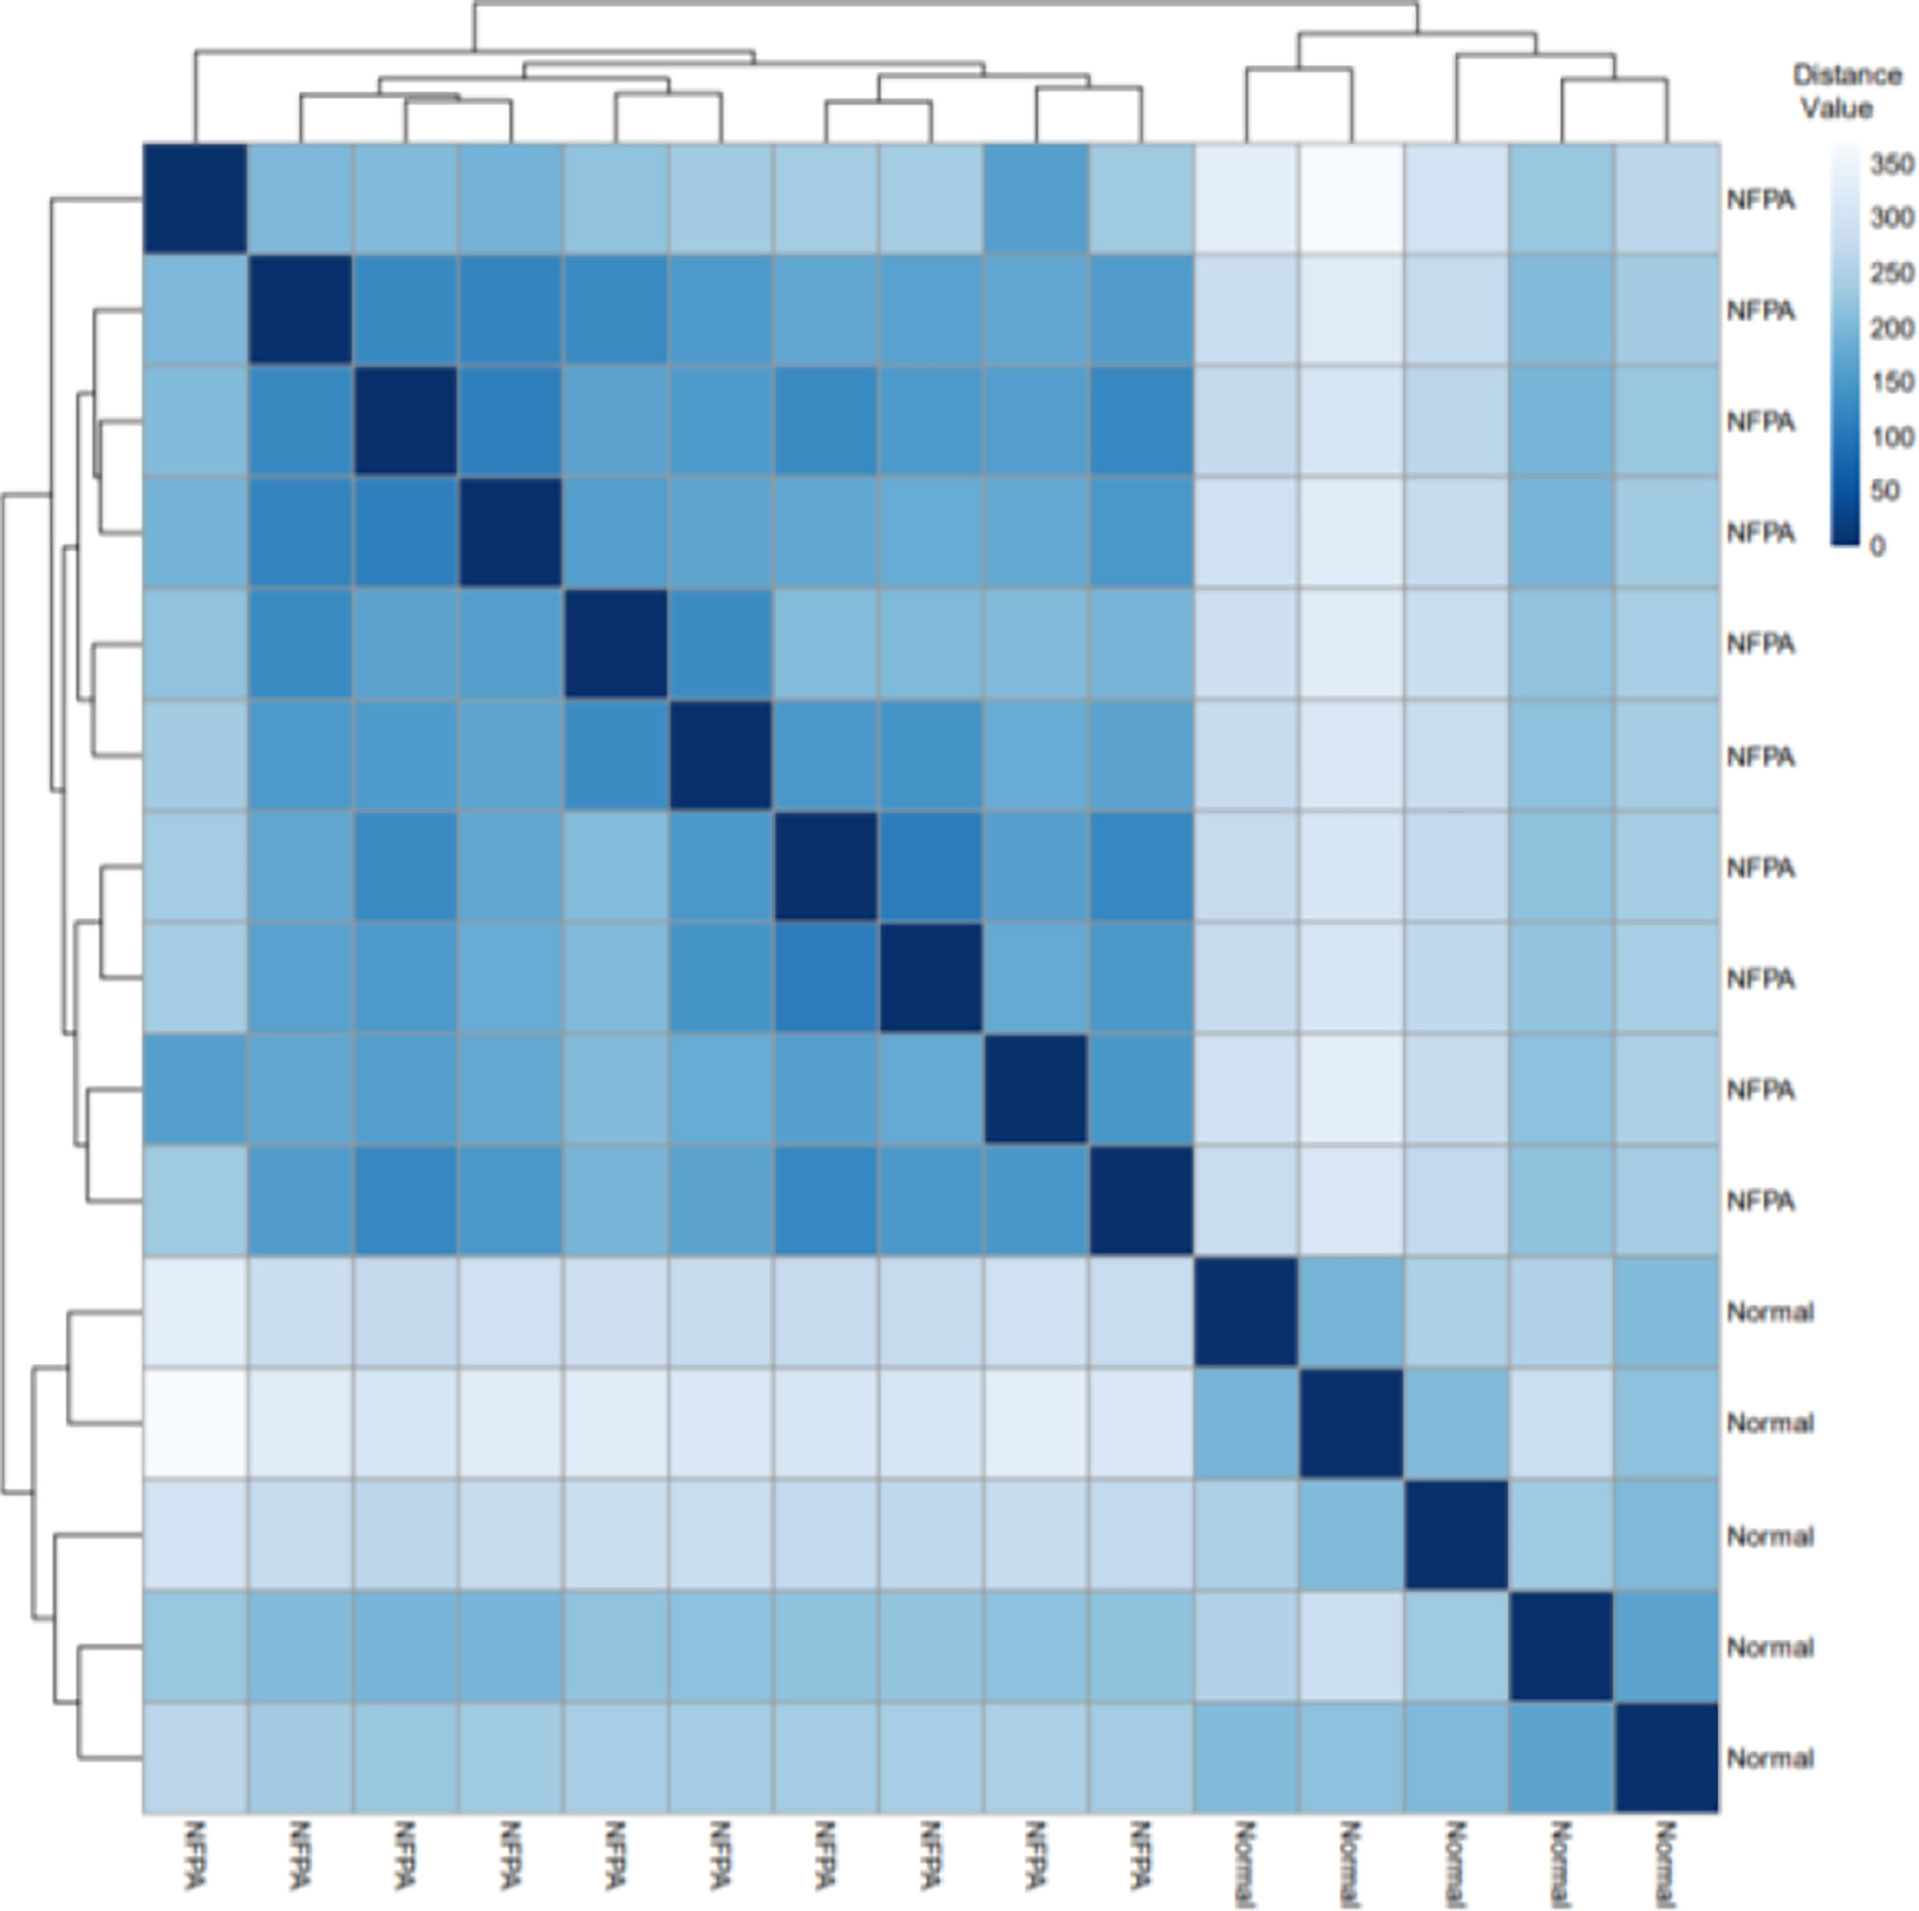
Figure 2 The Euclidean distances between the samples. Based on the Euclidean distance, hierarchical clustering between the samples has been established; the distance values between samples are shown.
The 15 samples are displayed in the 2D plane covered by their first two principal components in the PCA plot (PC1 and PC2) (Figure 3). This plot shows the good relative variance between the NFPA and normal samples.
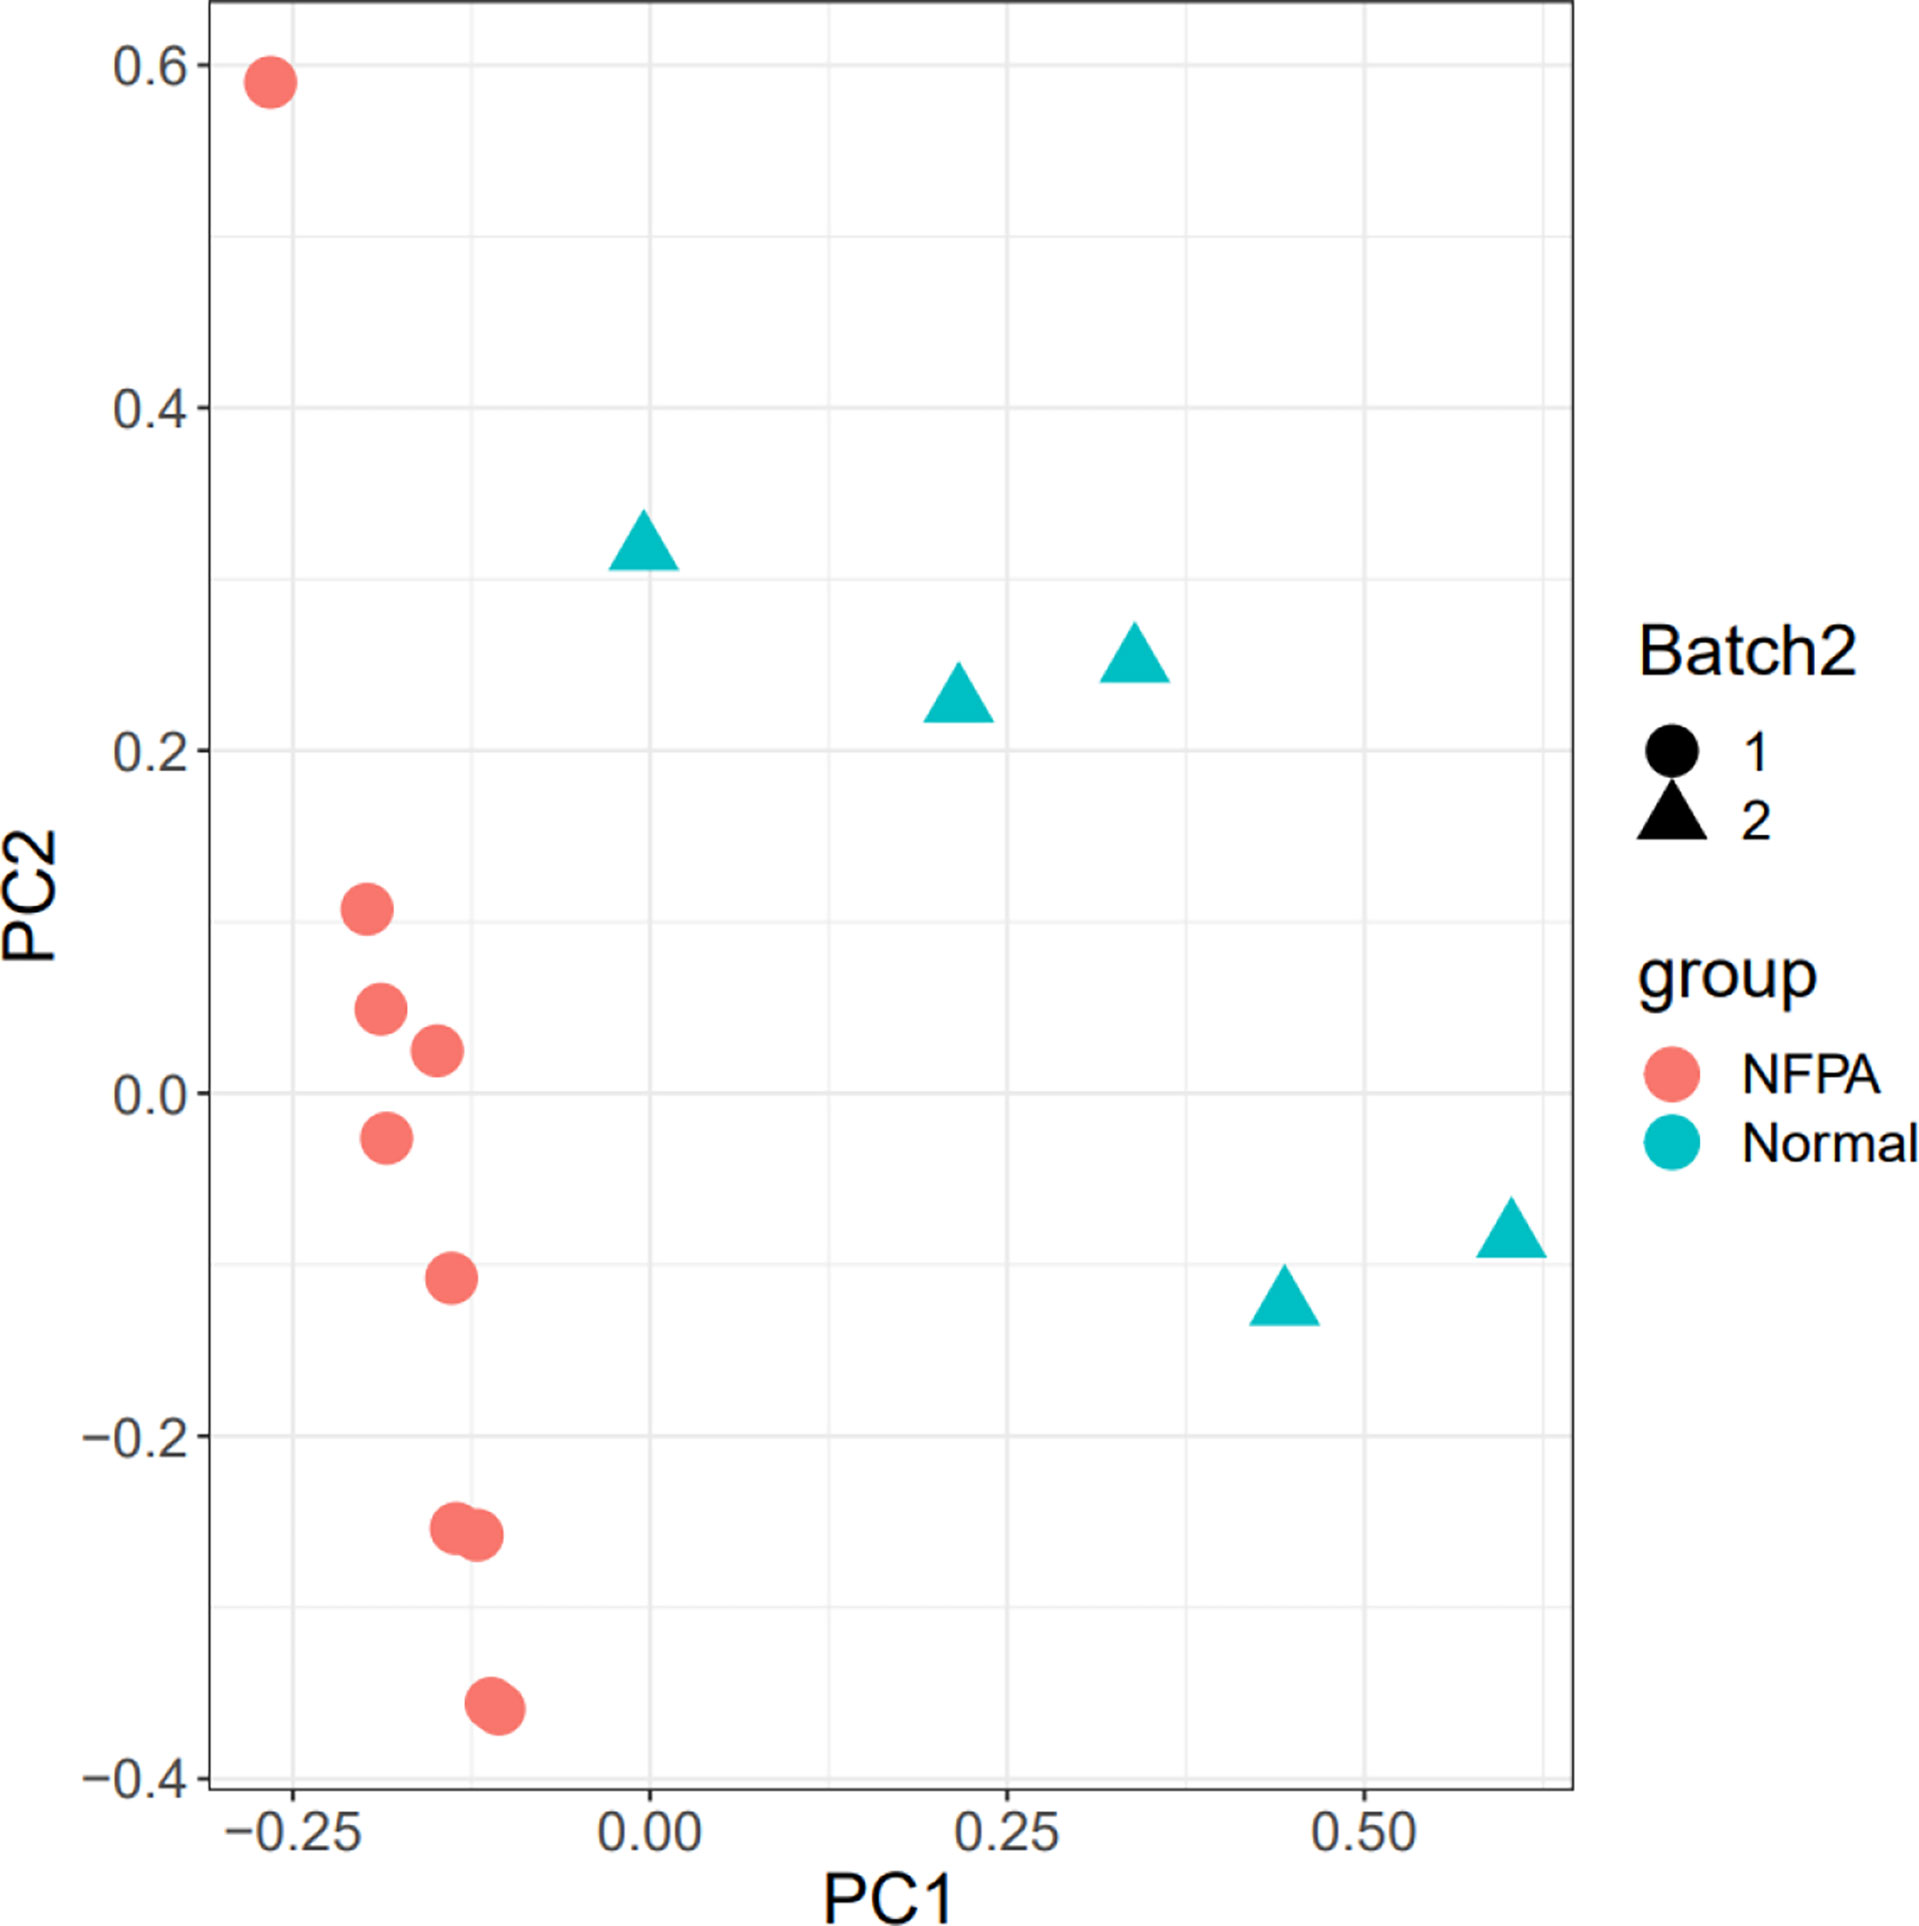
Figure 3 PCA plot. The Batch implies that the data includes two platforms. Also, healthy and tumor samples were divided into two groups.
DEGs analysis
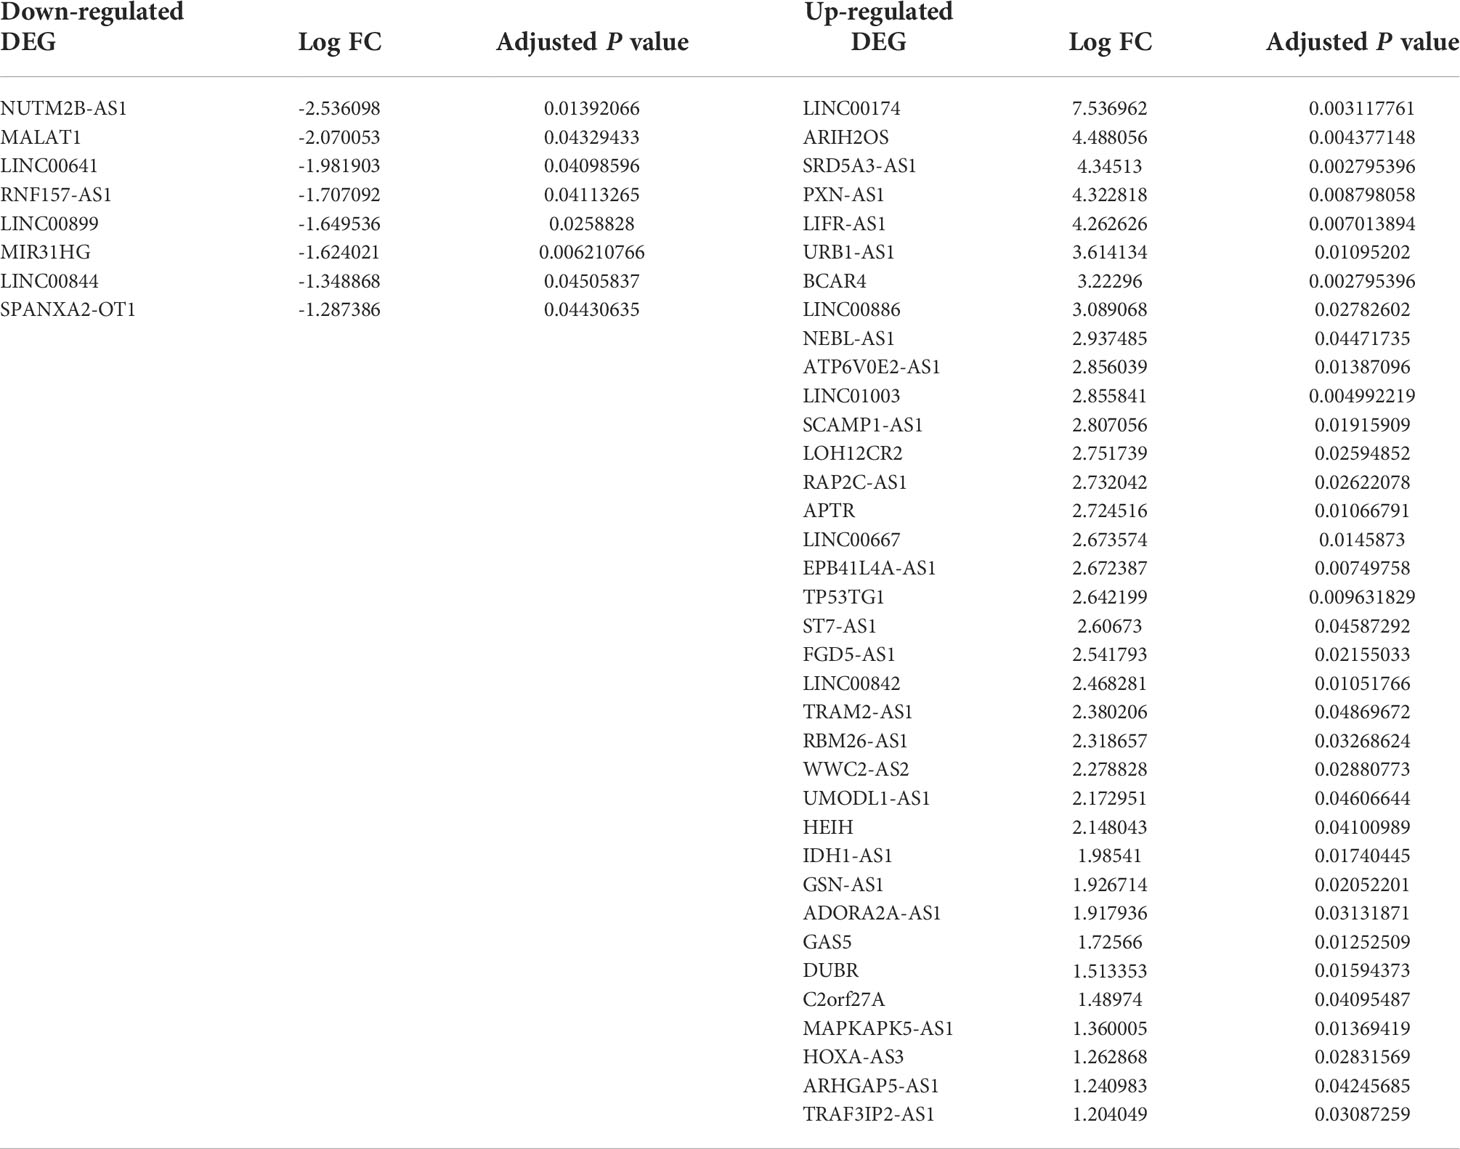
According to analyses of the microarray data between NFPA and normal samples by limma, we obtained 3131 DEGs, including 189 downregulated DEGs (such as RPS4Y1 and DDX3Y) and 2898 upregulated DEGs (such as ASB3 and DRD4), and 44 DElncRNAs, including 8 downregulated DElncRNAs (such as NUTM2B-AS1 and MALAT1) and 36 upregulated DElncRNAs (such as BCAR4 and SRD5A3-AS1). Table 1 lists the top 10 markedly downregulated and upregulated DEGs.
Table 2 lists the markedly downregulated and upregulated lncRNAs.
Volcano plots were depicted to visualize and assess variation (or reproducibility) of lncRNA and mRNA expressions between NFPA and normal samples (Figure 4). Some of the differentially expressed genes included in the tables were displayed in this plot.
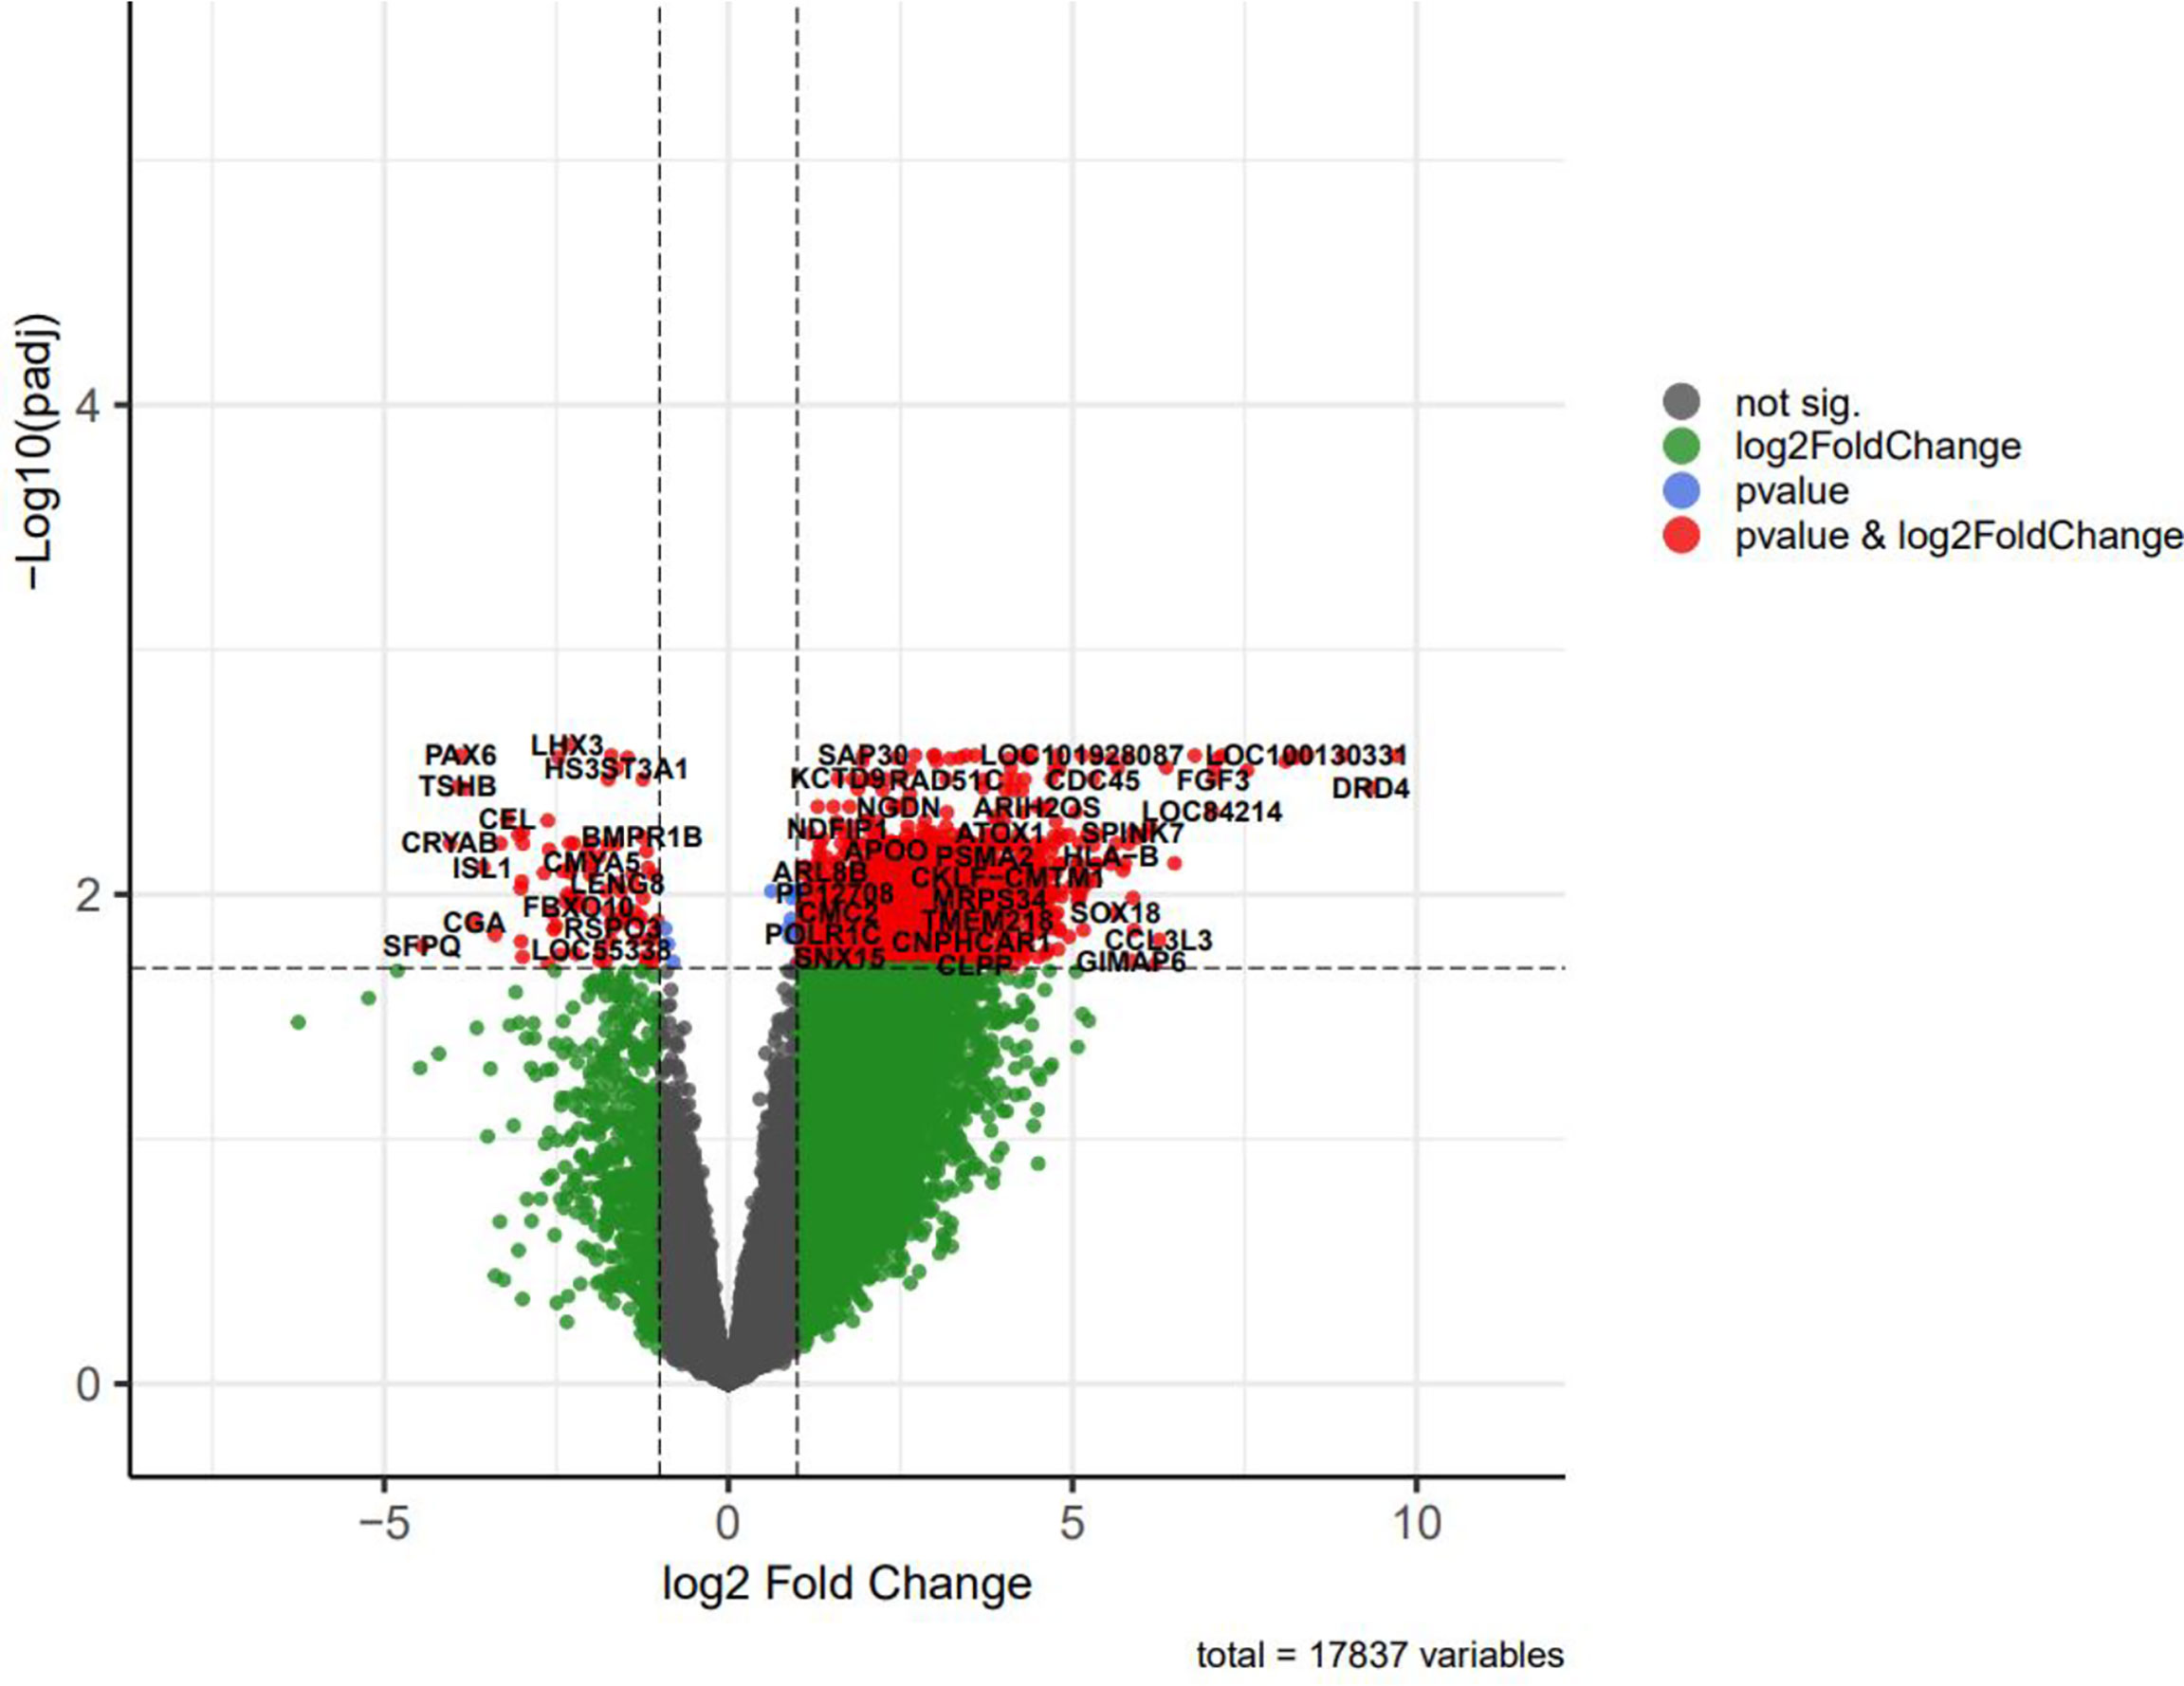
Figure 4 The volcano plot of differentially expressed genes (DEGs); horizontal axis, log2(FC); vertical axis, -log10 (adjusted P value).
Besides, the two-way clustering showed that lncRNAs and mRNAs expression pattern between PA and healthy controls was distinctive (Figure 5). Also, a heatmap depicts the expression of these DElncRNAs (Figure 6).
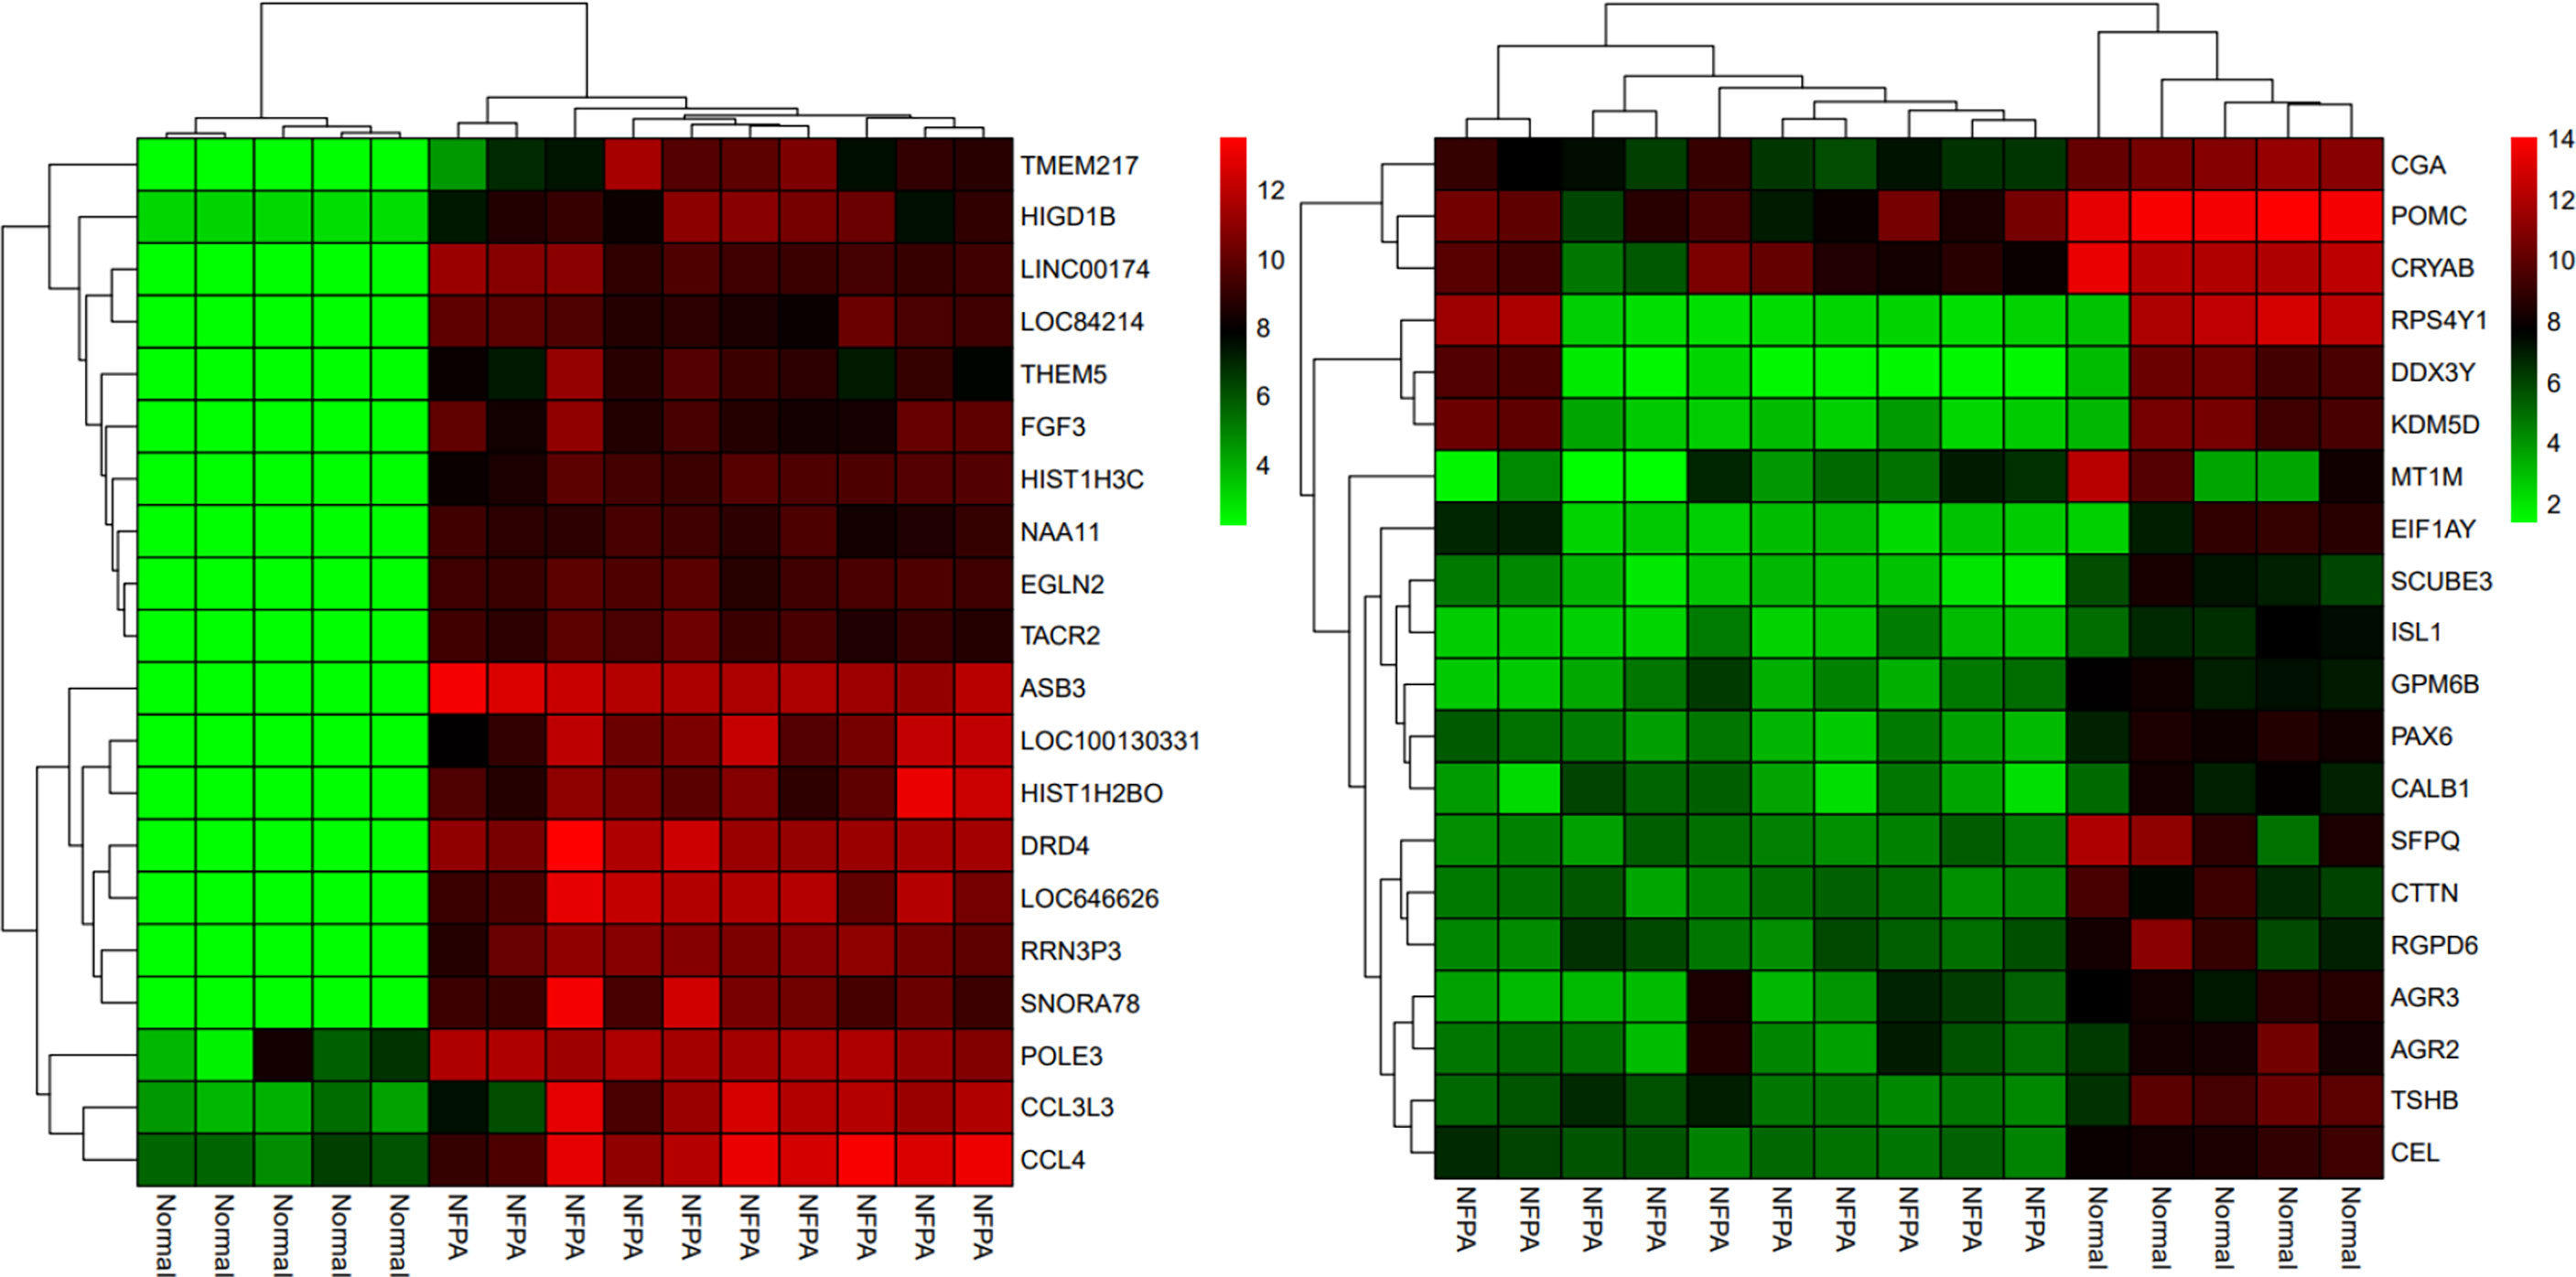
Figure 5 The two-way clustering of top 20 DEGs between NFPA samples and normal tissue samples; horizontal axis, the samples; vertical axis, DEGs between Normal tissues samples and NFPA samples.
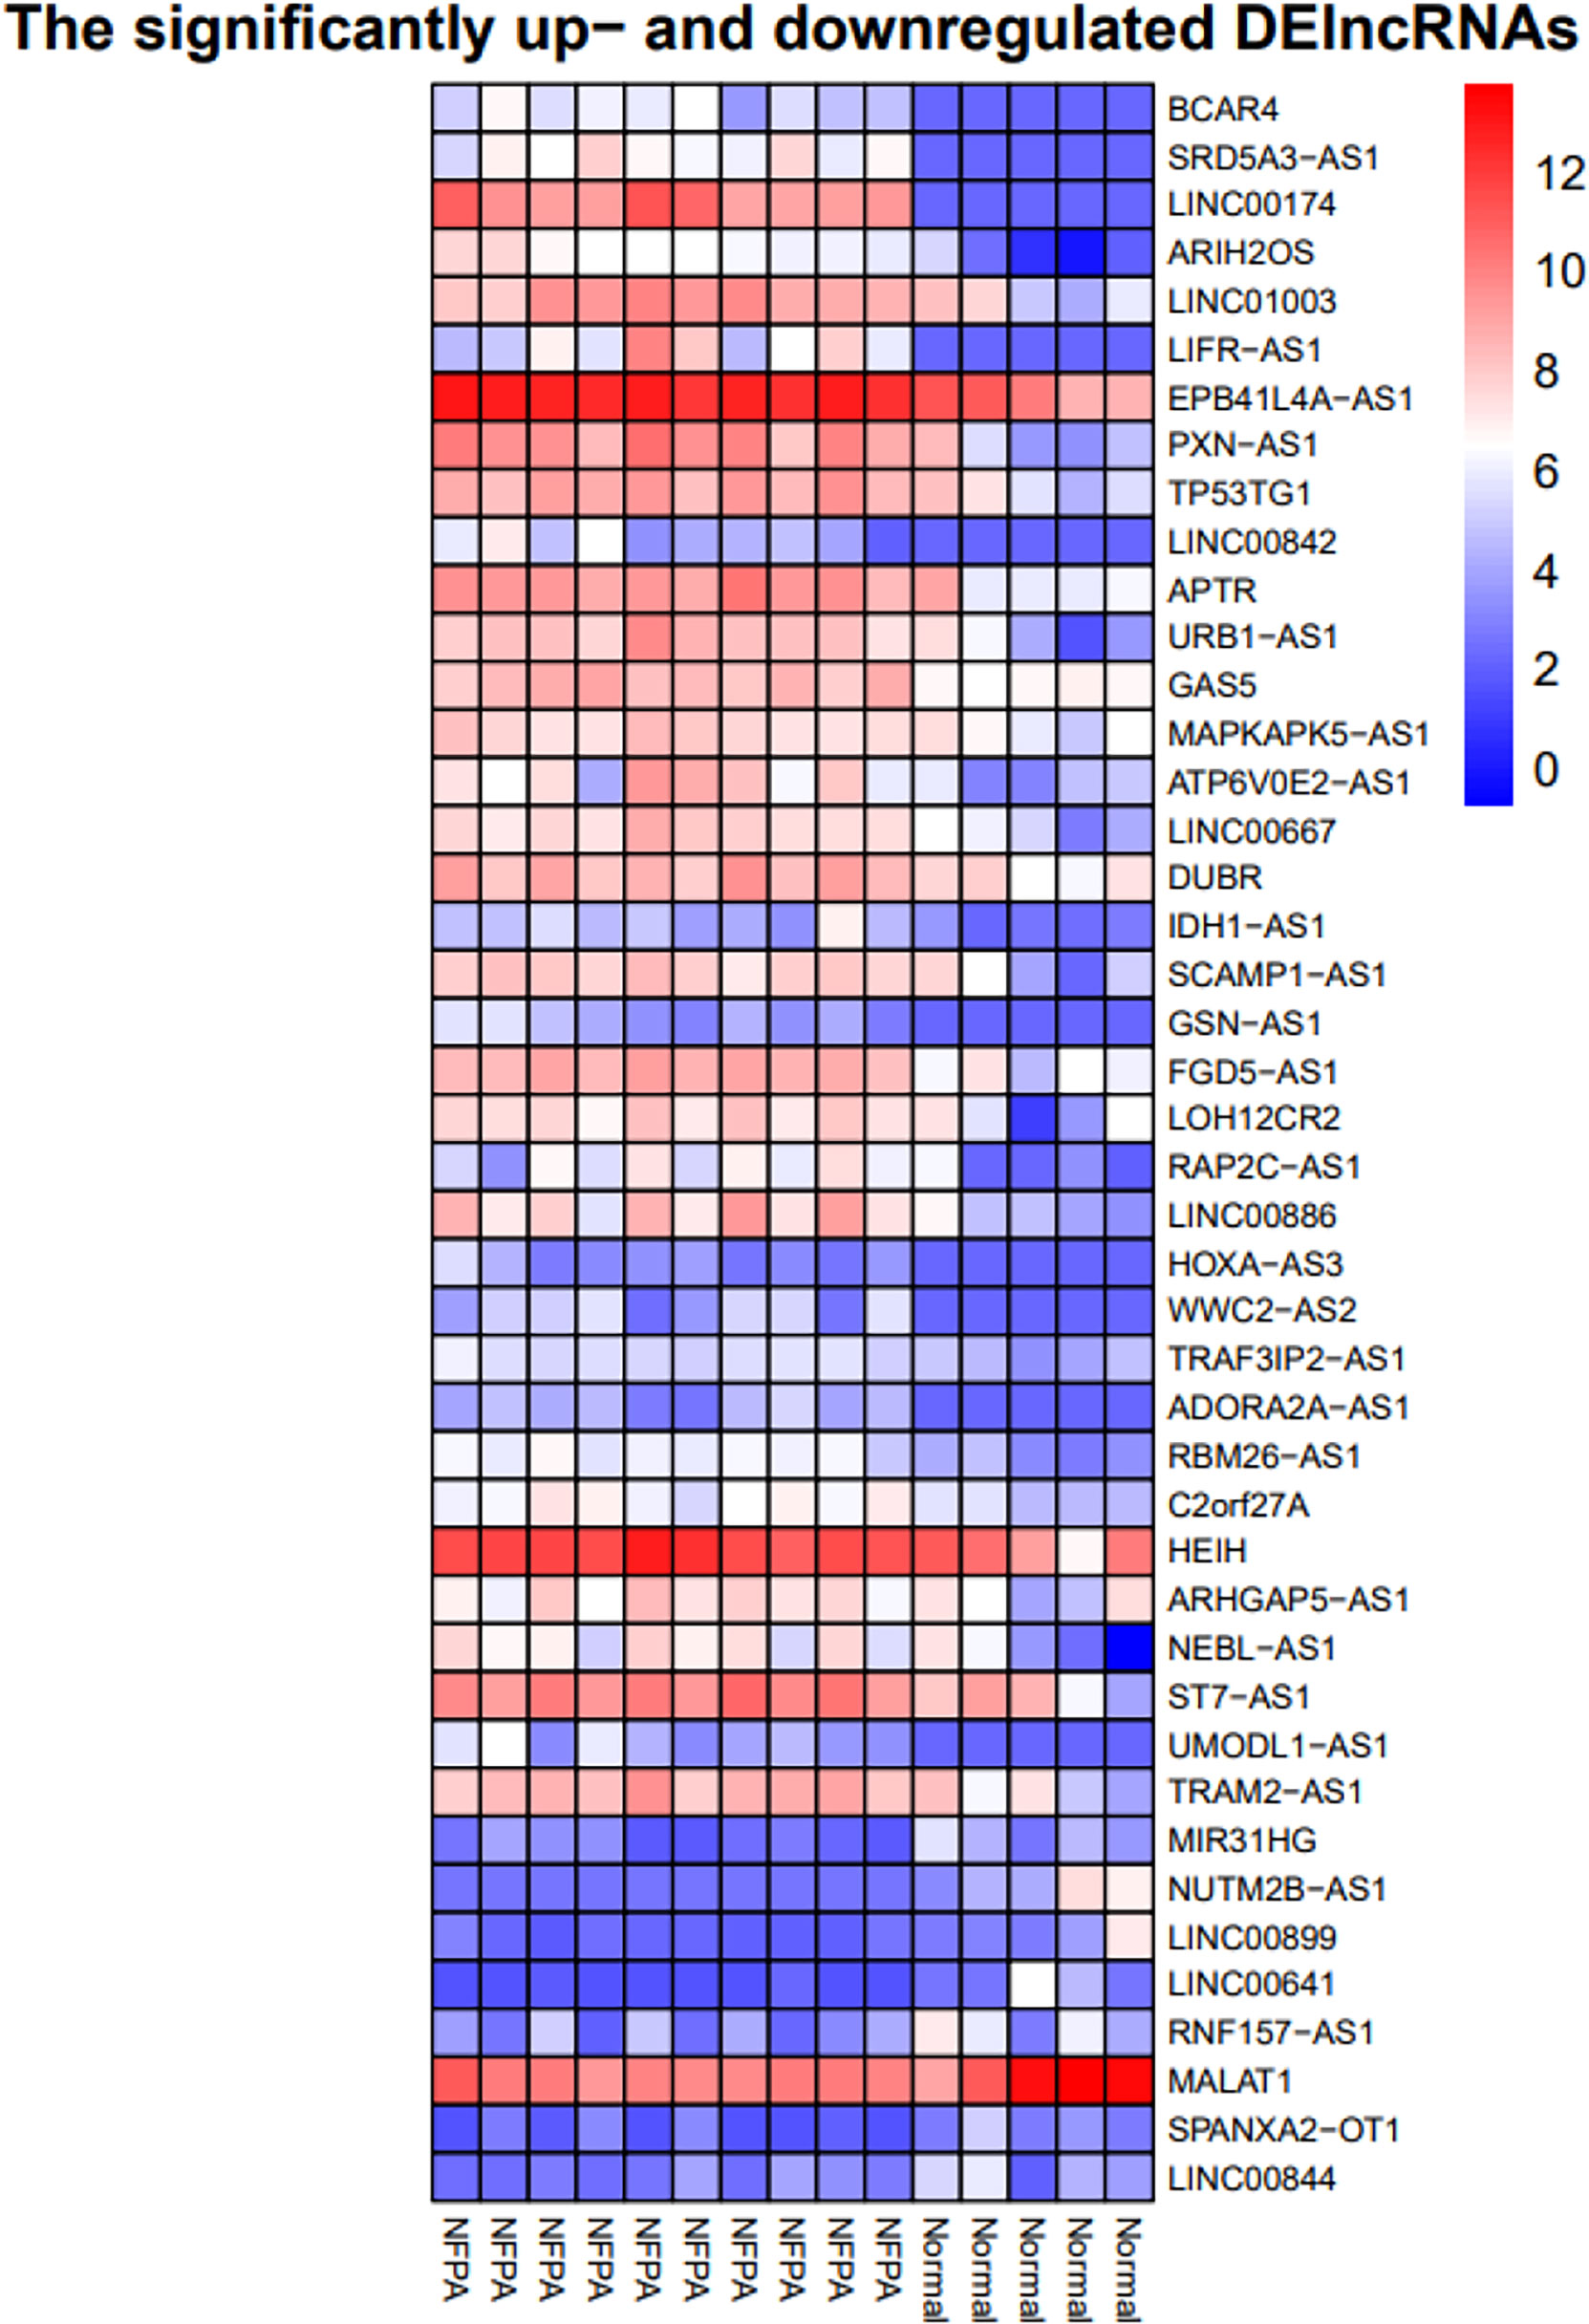
Figure 6 Heatmap of differentially expressed lncRNAs. The horizontal axis shows the names of 15 samples. The vertical axis presents the lncRNAs names.
GO enrichment analysis of DEGs
The noticeably DEGs were enriched in 3171 GO terms. We used Clusterprofiler package to perform analysis. in GO functional enrichment analysis, 25 GO entries satisfy Adjusted P value less than 0.05, most of which are biological processes, followed by cellular component and molecular function. The first 25 entries are integral component of endoplasmic reticulum membrane, intrinsic component of endoplasmic reticulum membrane, extracellular exosome, extracellular organelle, extracellular vesicle, mitochondrial inner membrane, mitochondrial envelope, mitochondrial membrane, carbohydrate binding, antigen binding, hormone activity, G protein-coupled receptor activity, diencephalon development, endocrine system development, cell fate specification, small molecule metabolic process, immune response, sensory organ development, immune effector process, cell fate commitment, adaptive immune response, forebrain development, pancreas development, cell differentiation in spinal cord and response to interferon-gamma. Figures S1 and S2 show the barplots of function enrichment analyses and GO enrichment analysis of DEGs, respectively.
Pathway analysis
Using Pathview (26) and gage (27) packages in R, KEGG pathways analysis of 189 downregulated and 2898 upregulated DEGs were conducted to detect the potential functional genes (Table 3 and Figure 7).
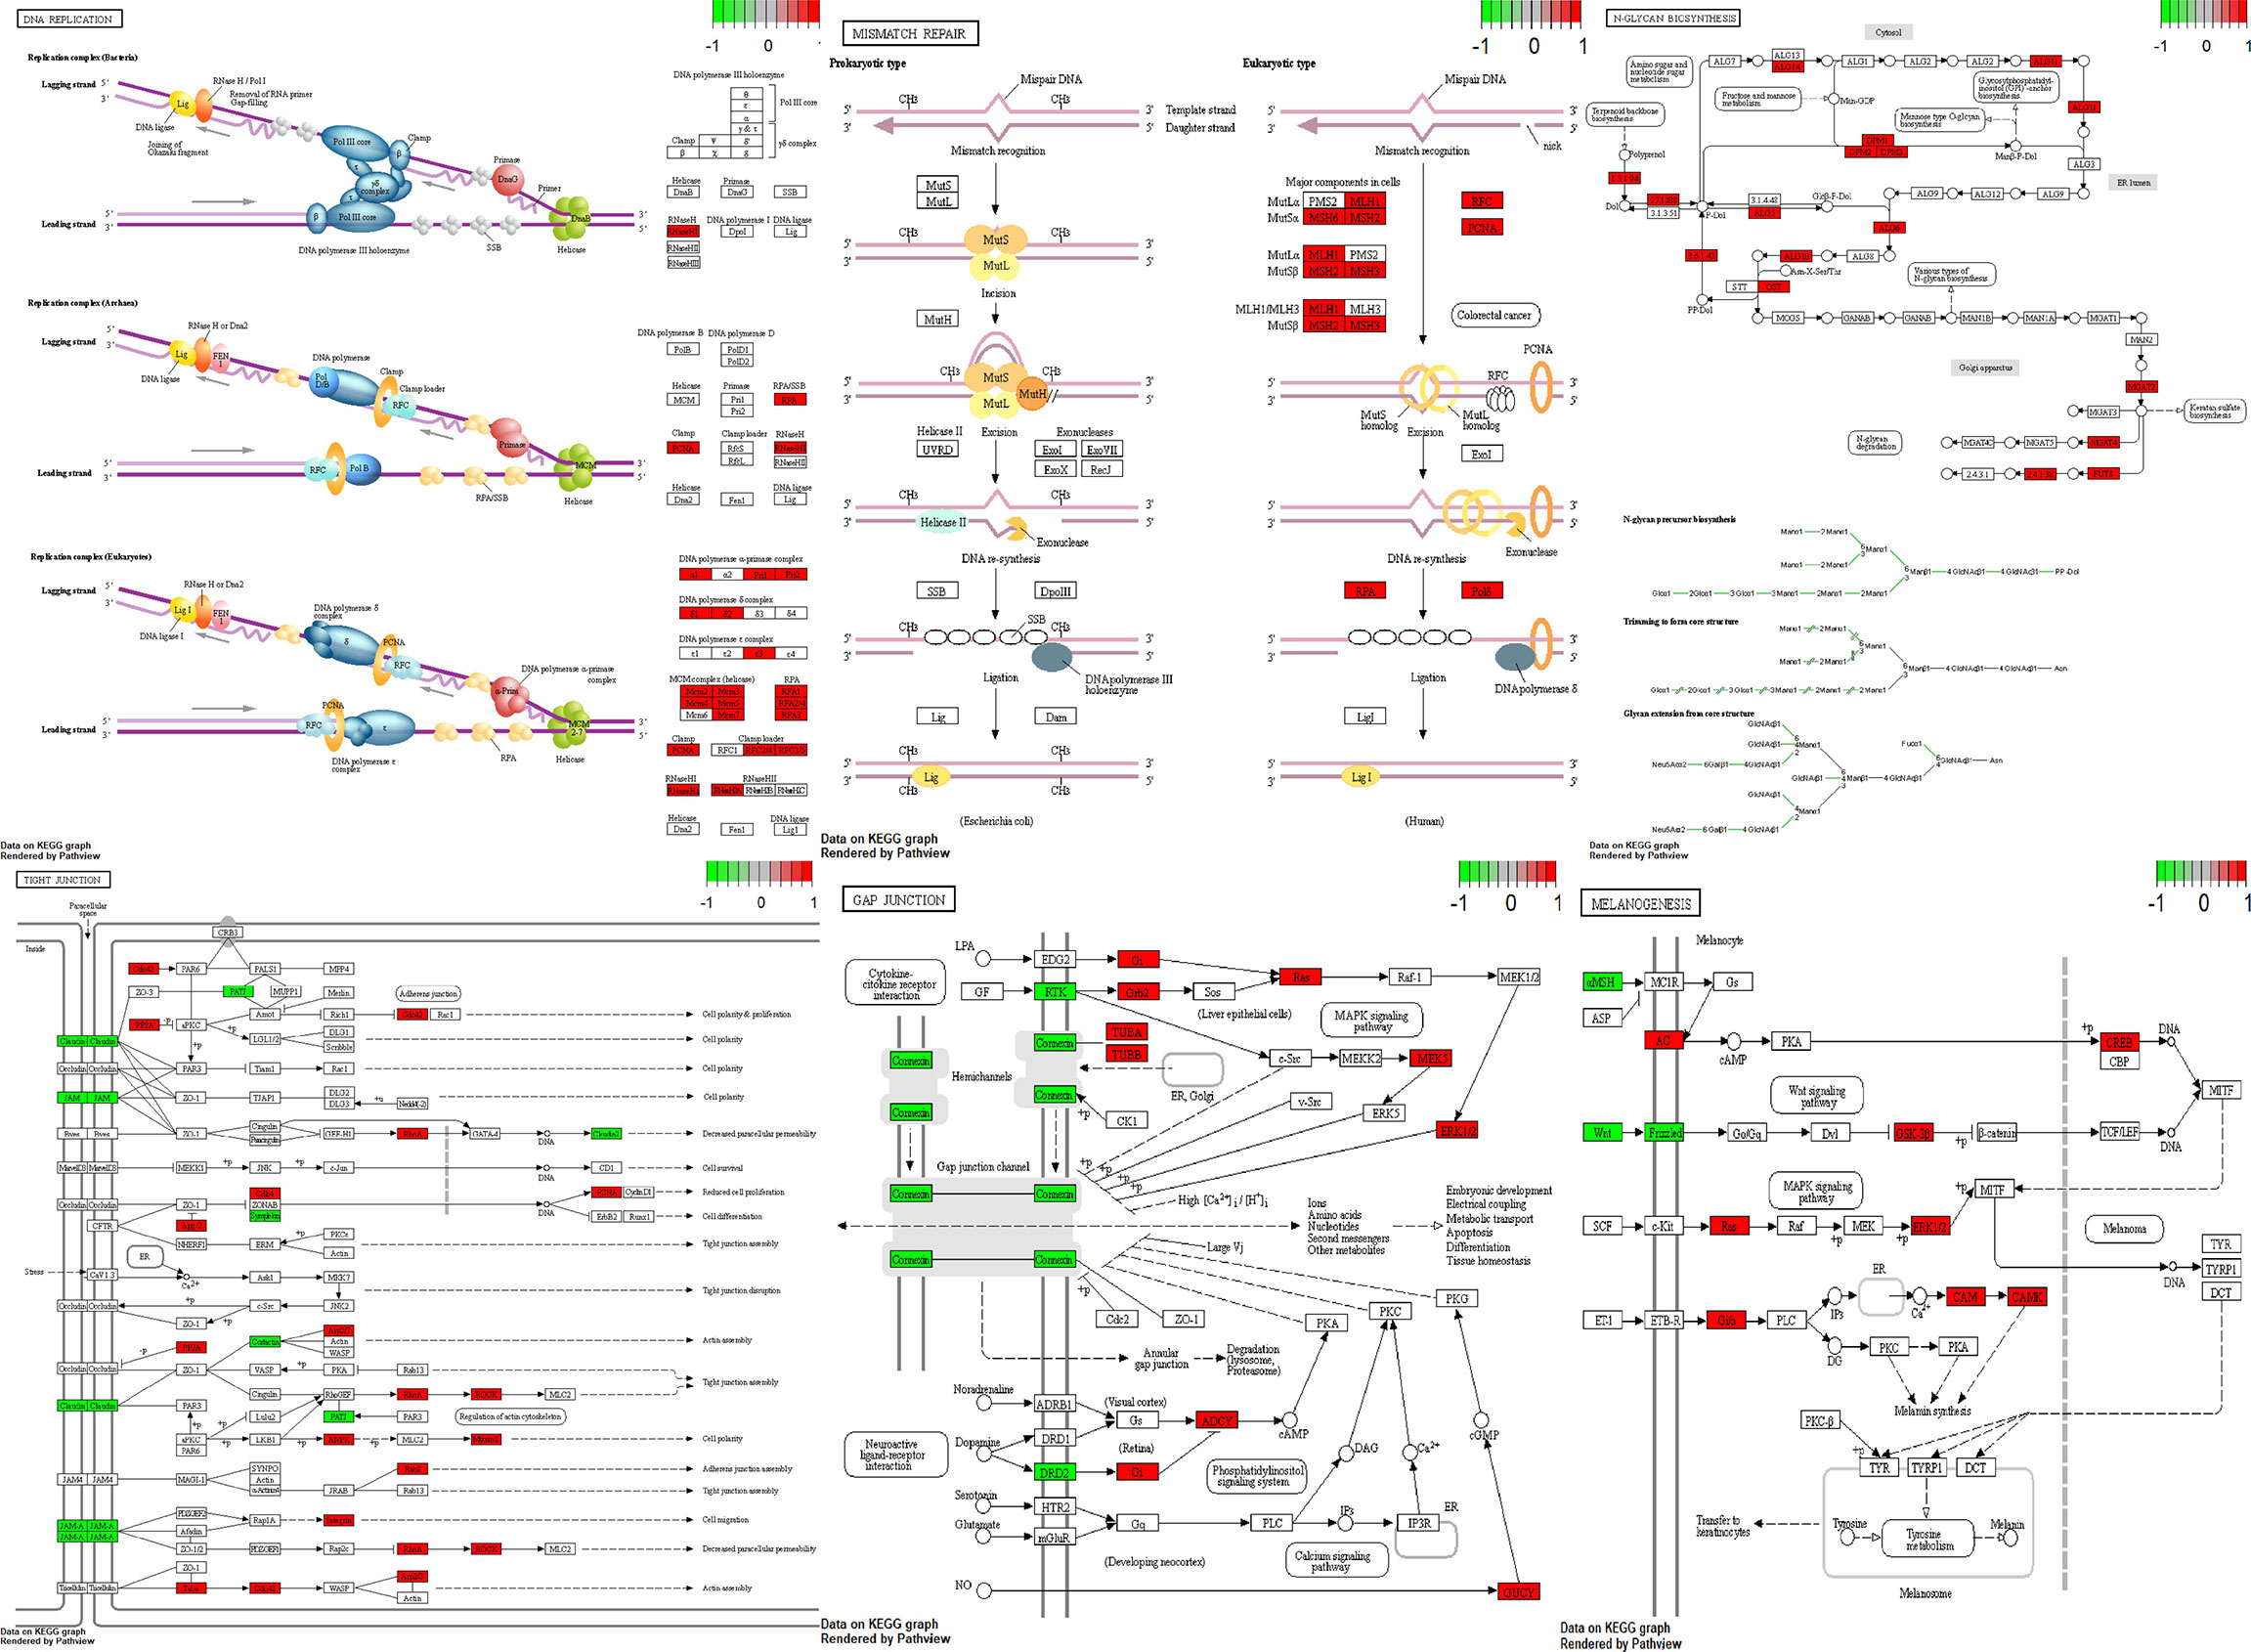
Figure 7 Visualization of pathways. Green boxes are downregulated genes and red boxes are upregulated genes.
ceRNA network construction in NFPA
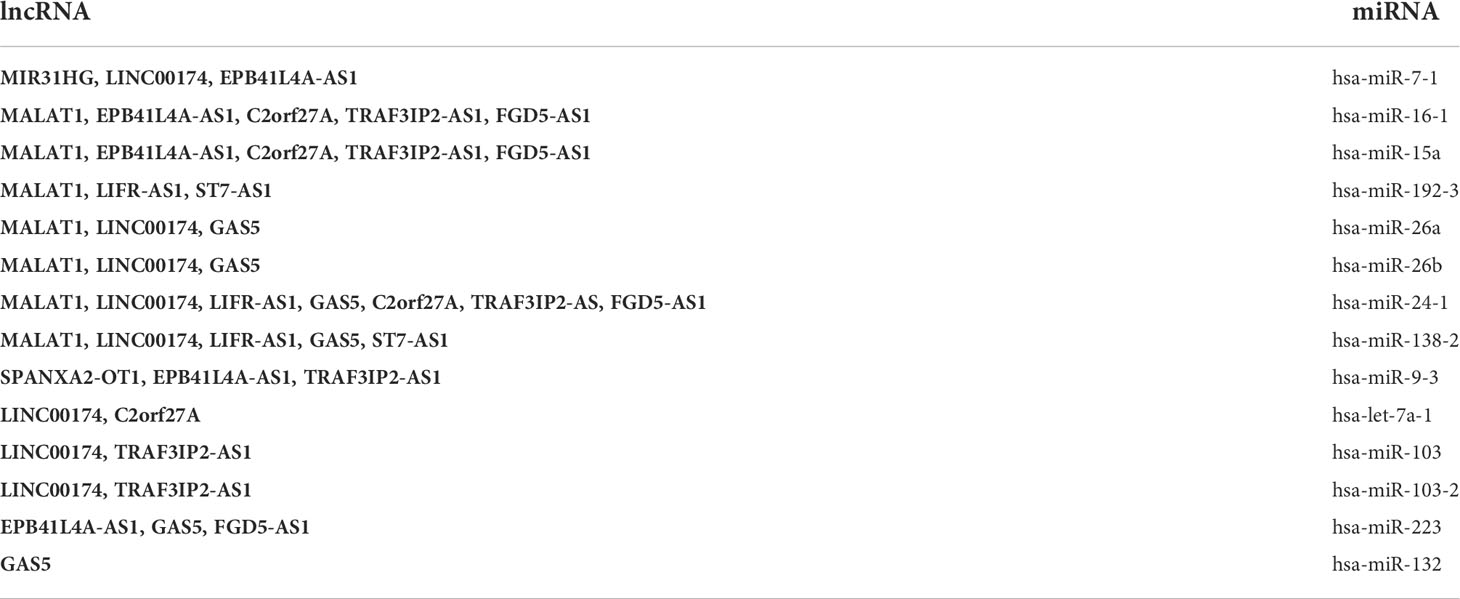
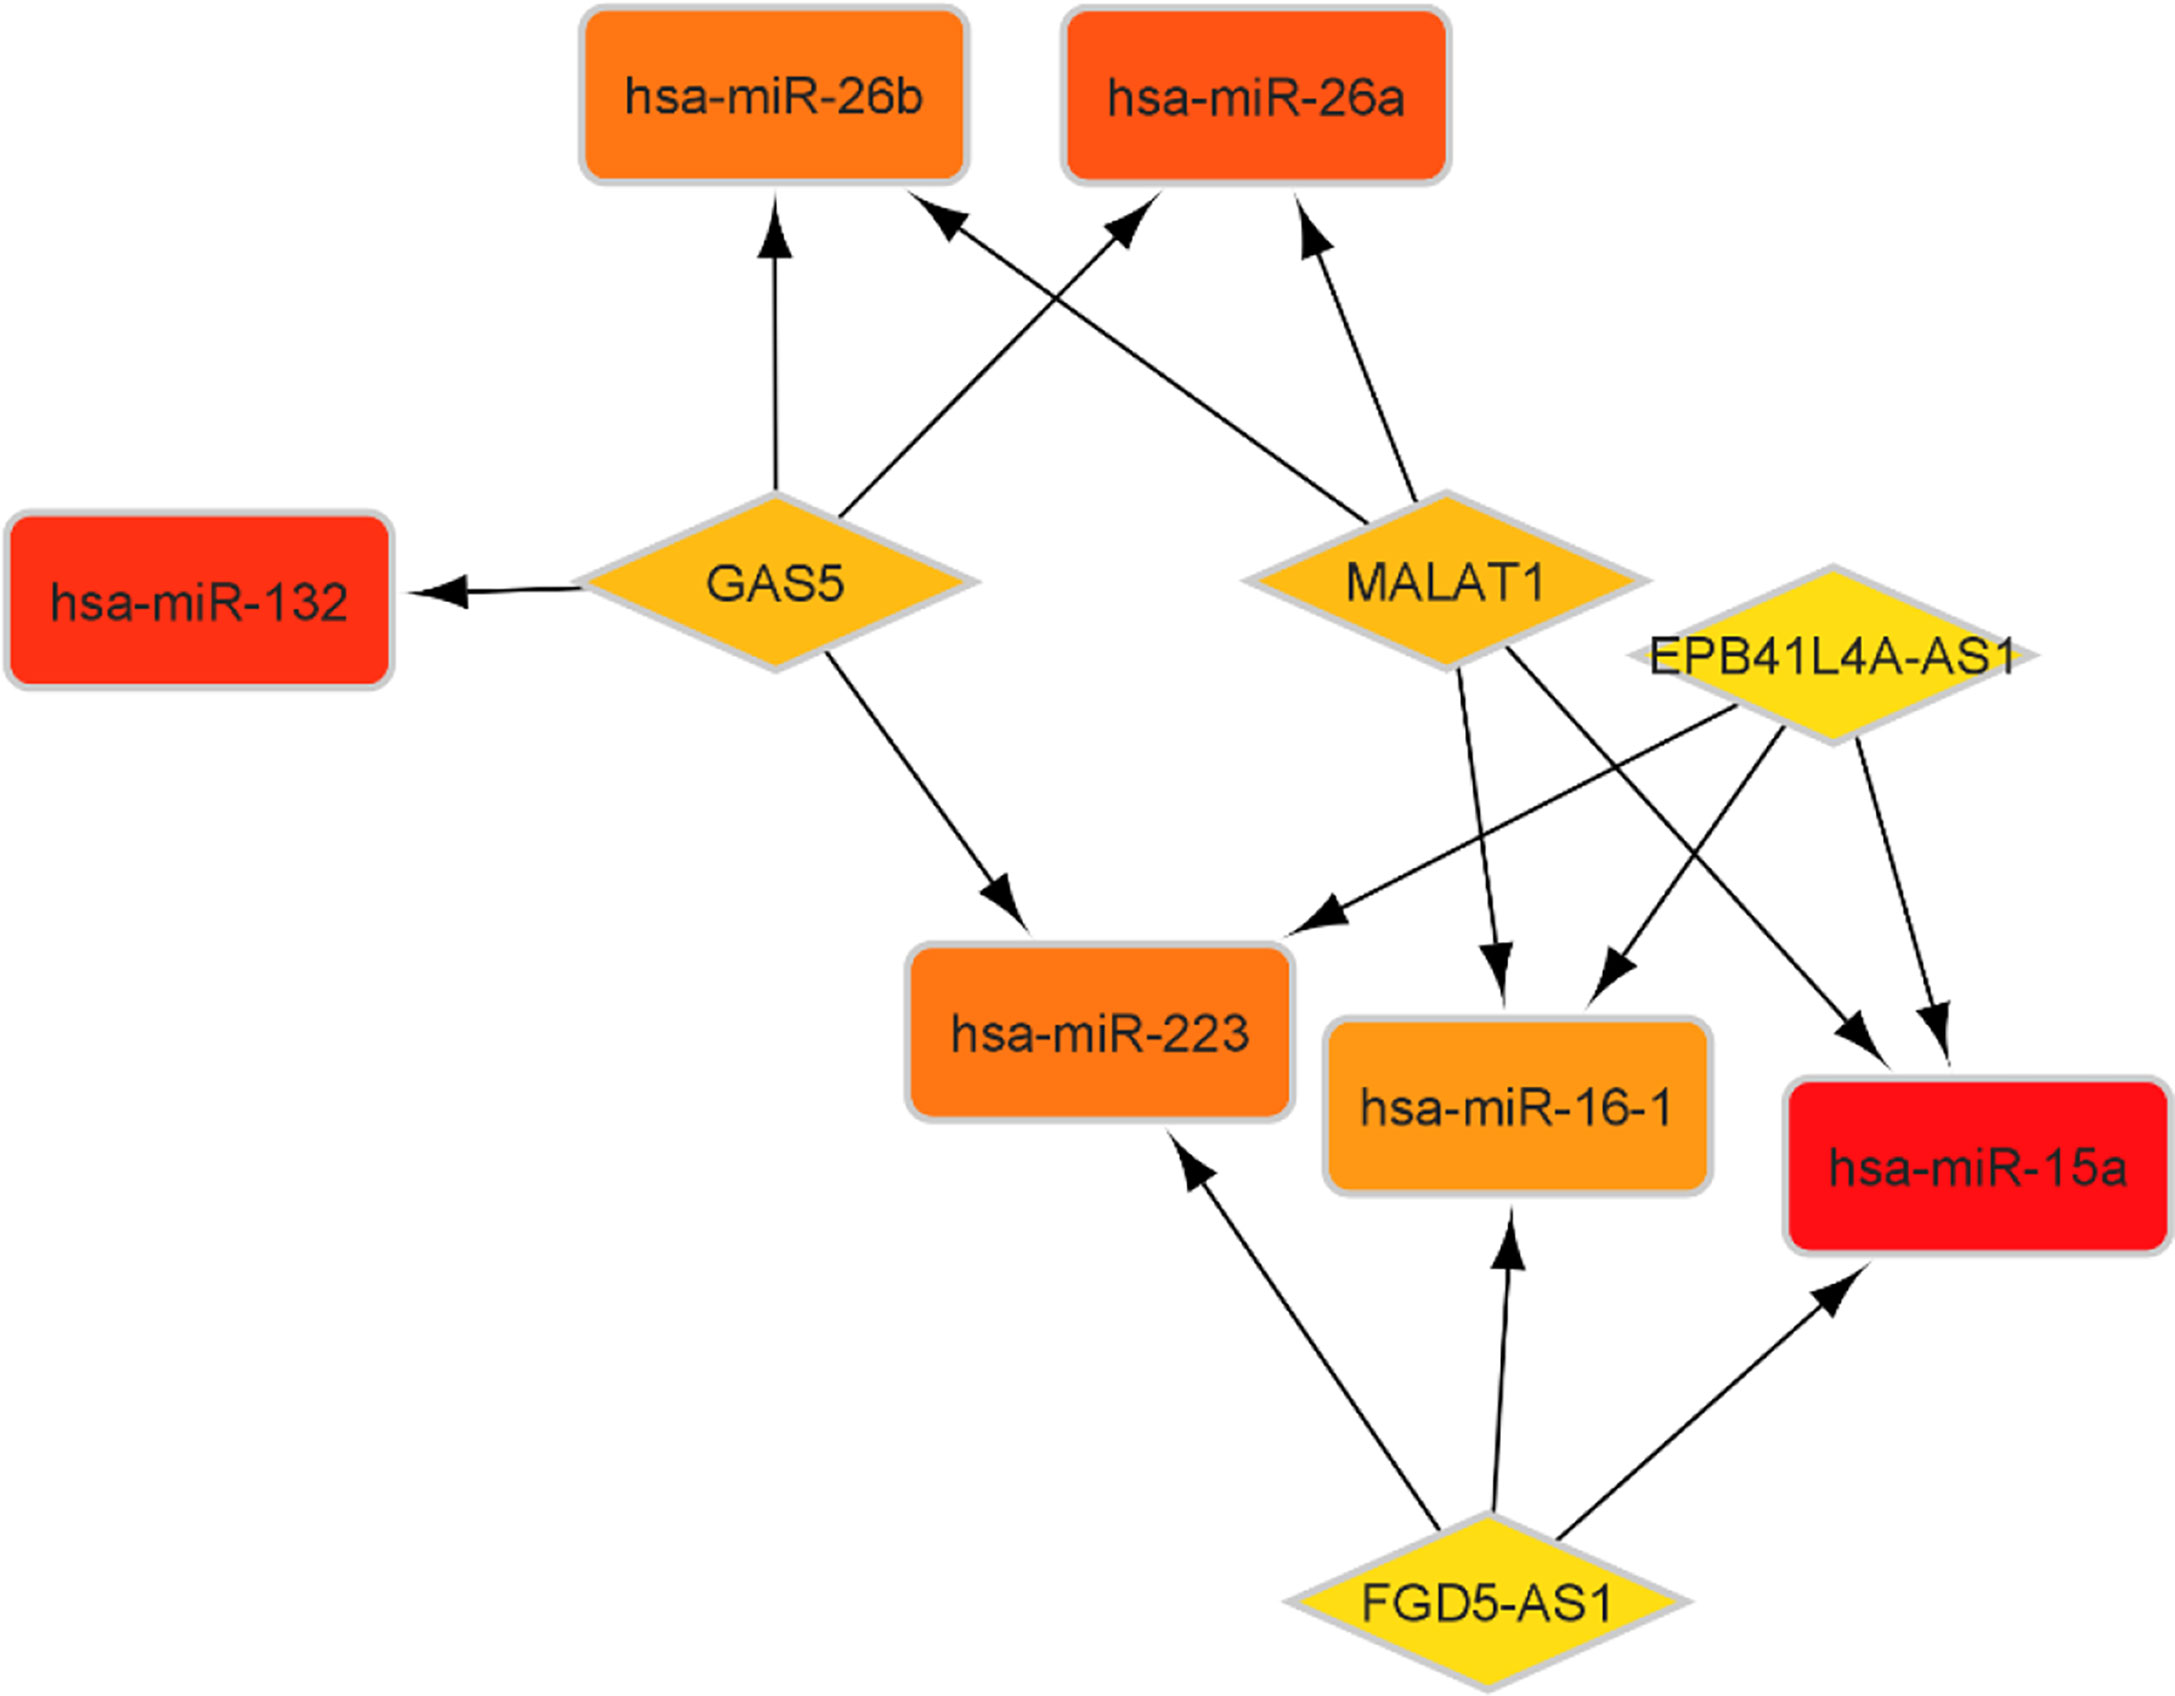
According to the miR2Disease database, we identified 26 PA-related miRNAs. Then, miRcode was used to assess interaction between lncRNAs and miRNAs. This step showed that 14 of 26 PA-specific miRNAs may target to the 11 of 44 lncRNAs (Table 4). Subsequently, miRDB, TargetScan and miRWalk were used for prediction of these 12 miRNA-targeted mRNAs to find the relationship between miRNAs and mRNAs. Only 5 PA-specific miRNAs were found that might target 51 of the 3131 NFPA-specific mRNAs (Table 5). miRNA-targeted mRNAs were excluded in the case that they were not detected in DERNAs. Accordingly, Cytoscape 3.9 was used for construction of lncRNA-miRNA-mRNA ceRNA network. A total of 11 lncRNAs, 51 mRNAs, and 14 miRNAs were included in the ceRNA network (Figure 8). Finally, we computed nodes degrees and displayed 10 hub genes in the network using cytohubba app (24) (Figure 9). We found has-miR-15a, has-miR-132, has-miR-26a, has-miR-26b, has-miR-223, has-miR-16-1, MALAT1, GAS5, EPB41L4A-AS1 and FGD5-AS1 as 10 hub genes in ceRNA network.

Table 5 miRWalk, miRDB and TargetScan databases revealed interactions between 5 DEmiRNAs and 51 DEmRNAs.
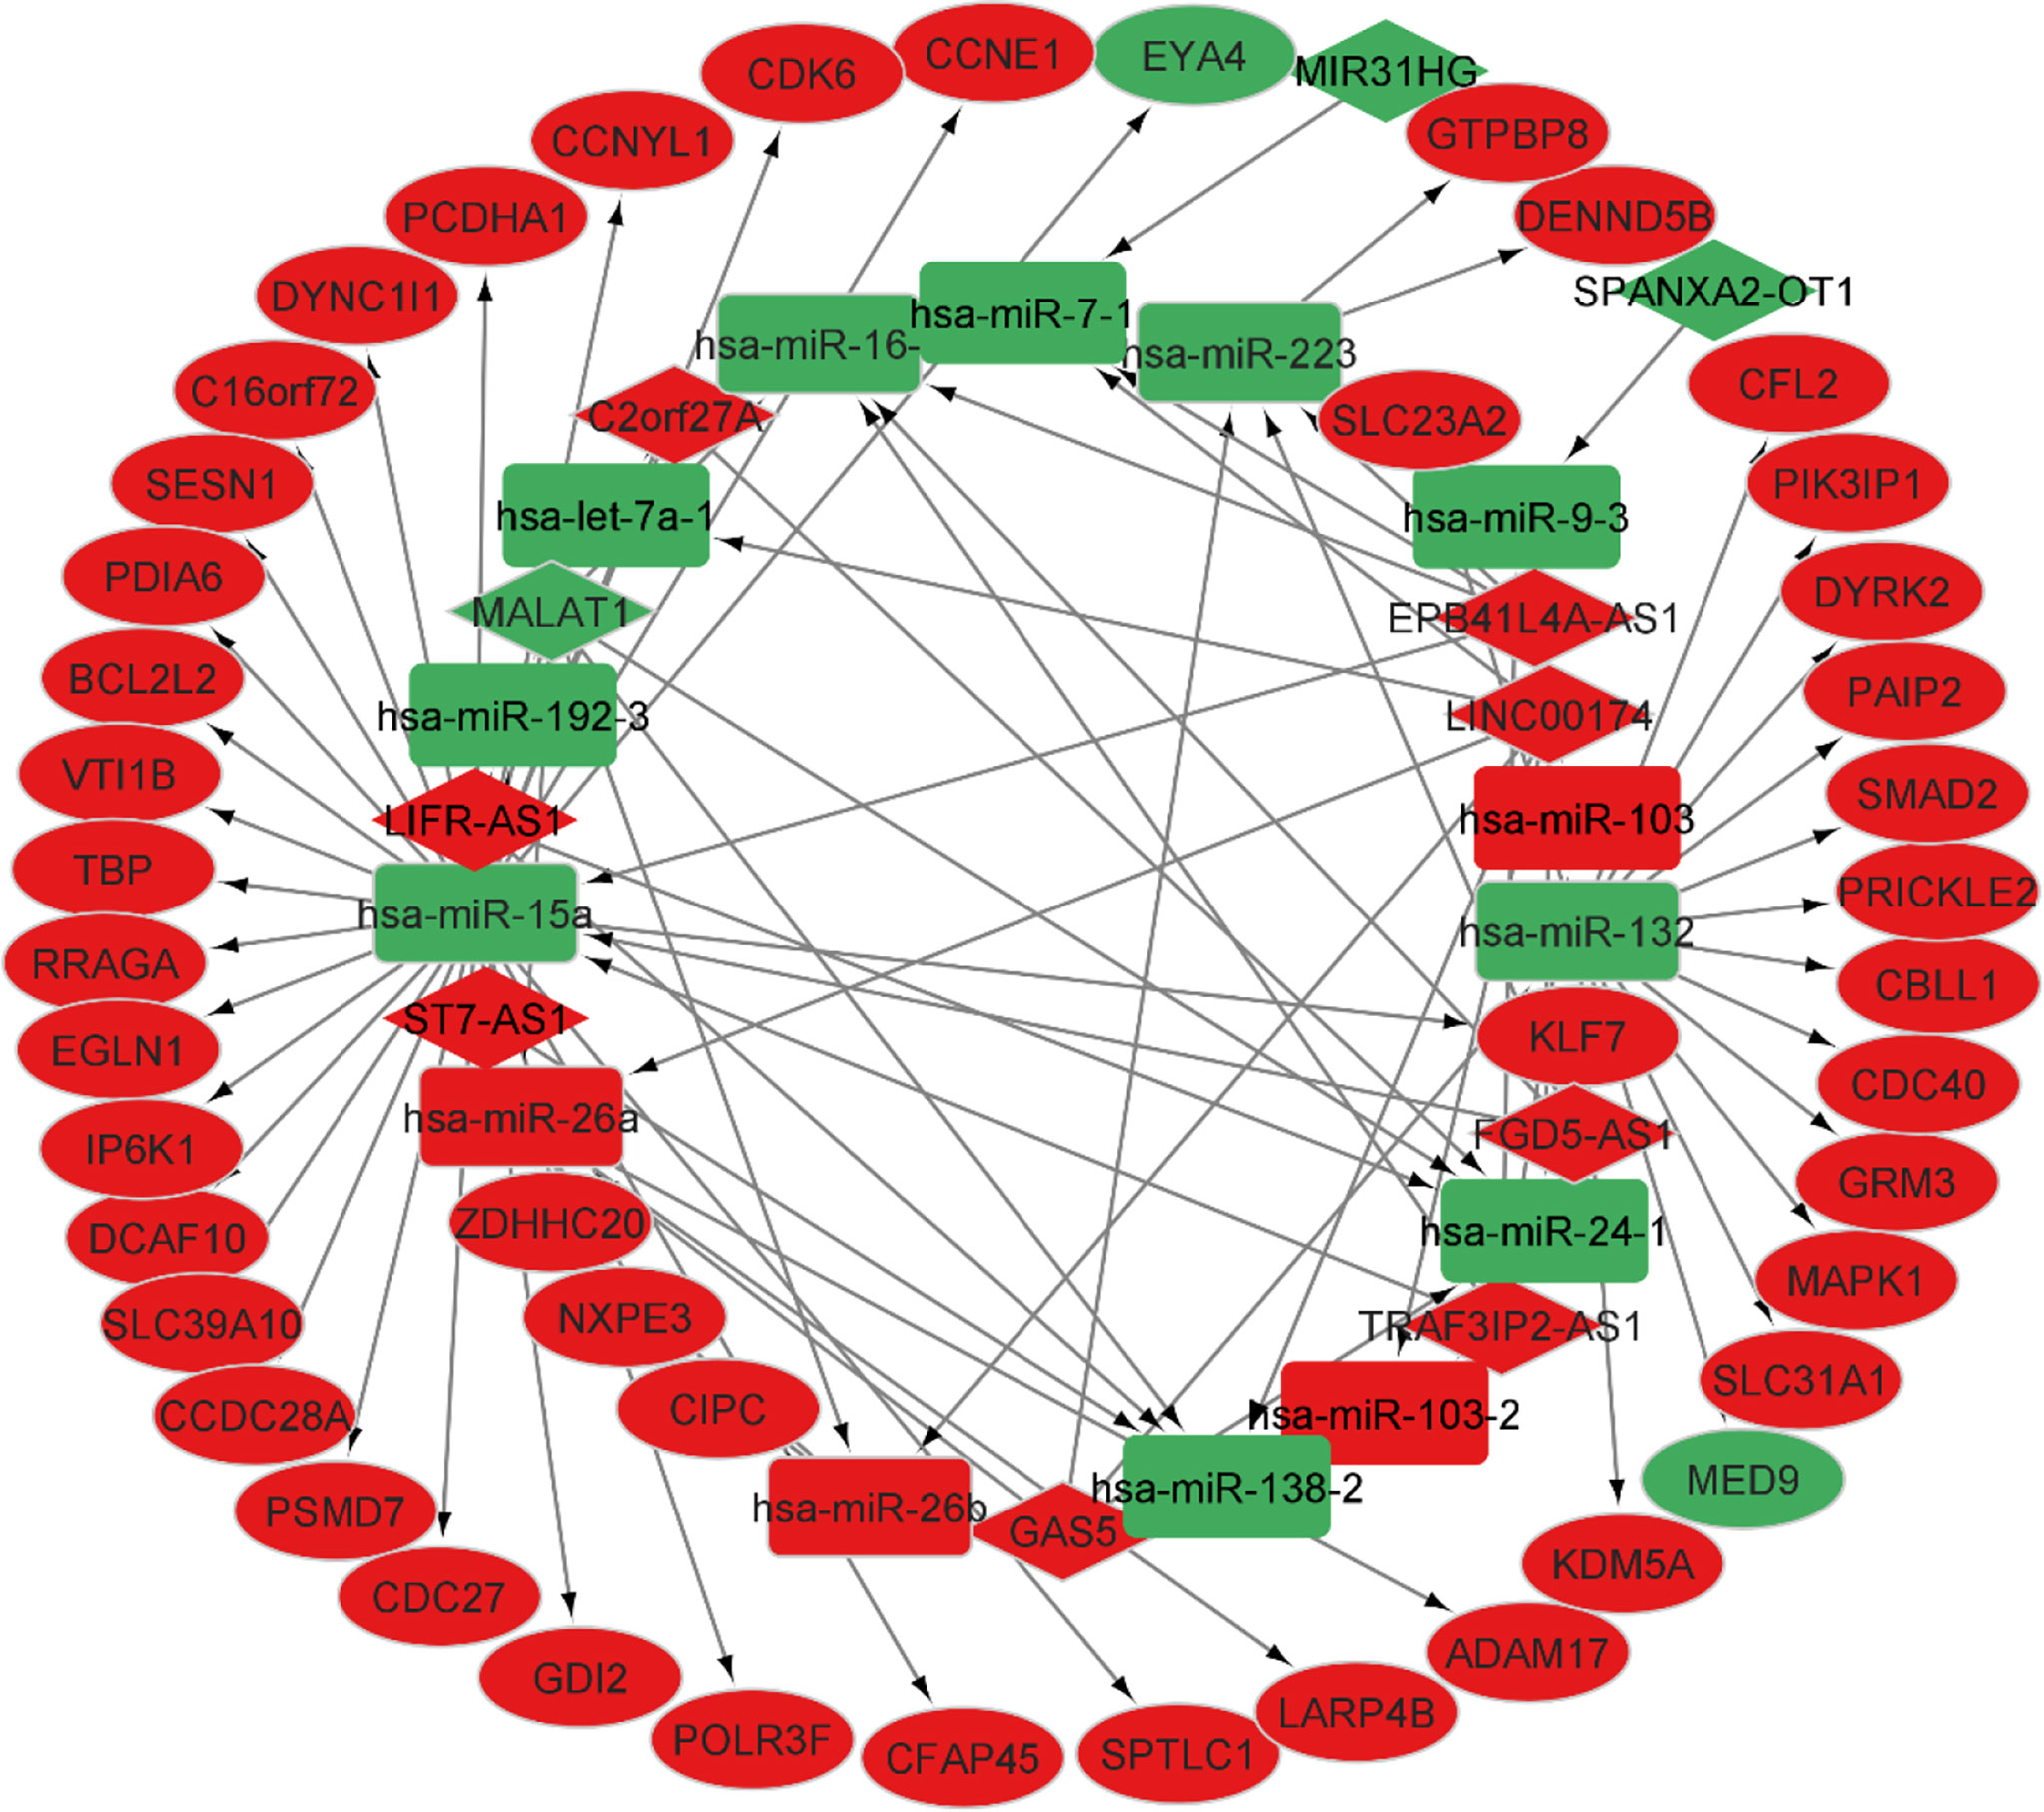
Figure 8 CeRNA network in NFPA. Red nodes show a high level of expression, while green nodes show a low level of expression. Ellipses represent protein-coding genes; round rectangles represent miRNAs; diamonds show lncRNAs; gray edges indicate lncRNA-miRNA-mRNA interactions.
Survival analysis
In this section, we retrieved RNA-seq data of brain low grade glioma. Survival analysis was performed based on Kaplan-Meier curve analyses using Survival package in R. We performed the survival analysis based on the hub genes in ceRNA network. The difference was regarded significant with log-rank P < 0.05. This analysis showed that EPB41L4A-AS1 and GAS5 were correlated with low survival time in patients with brain low grade glioma (Figure 10).
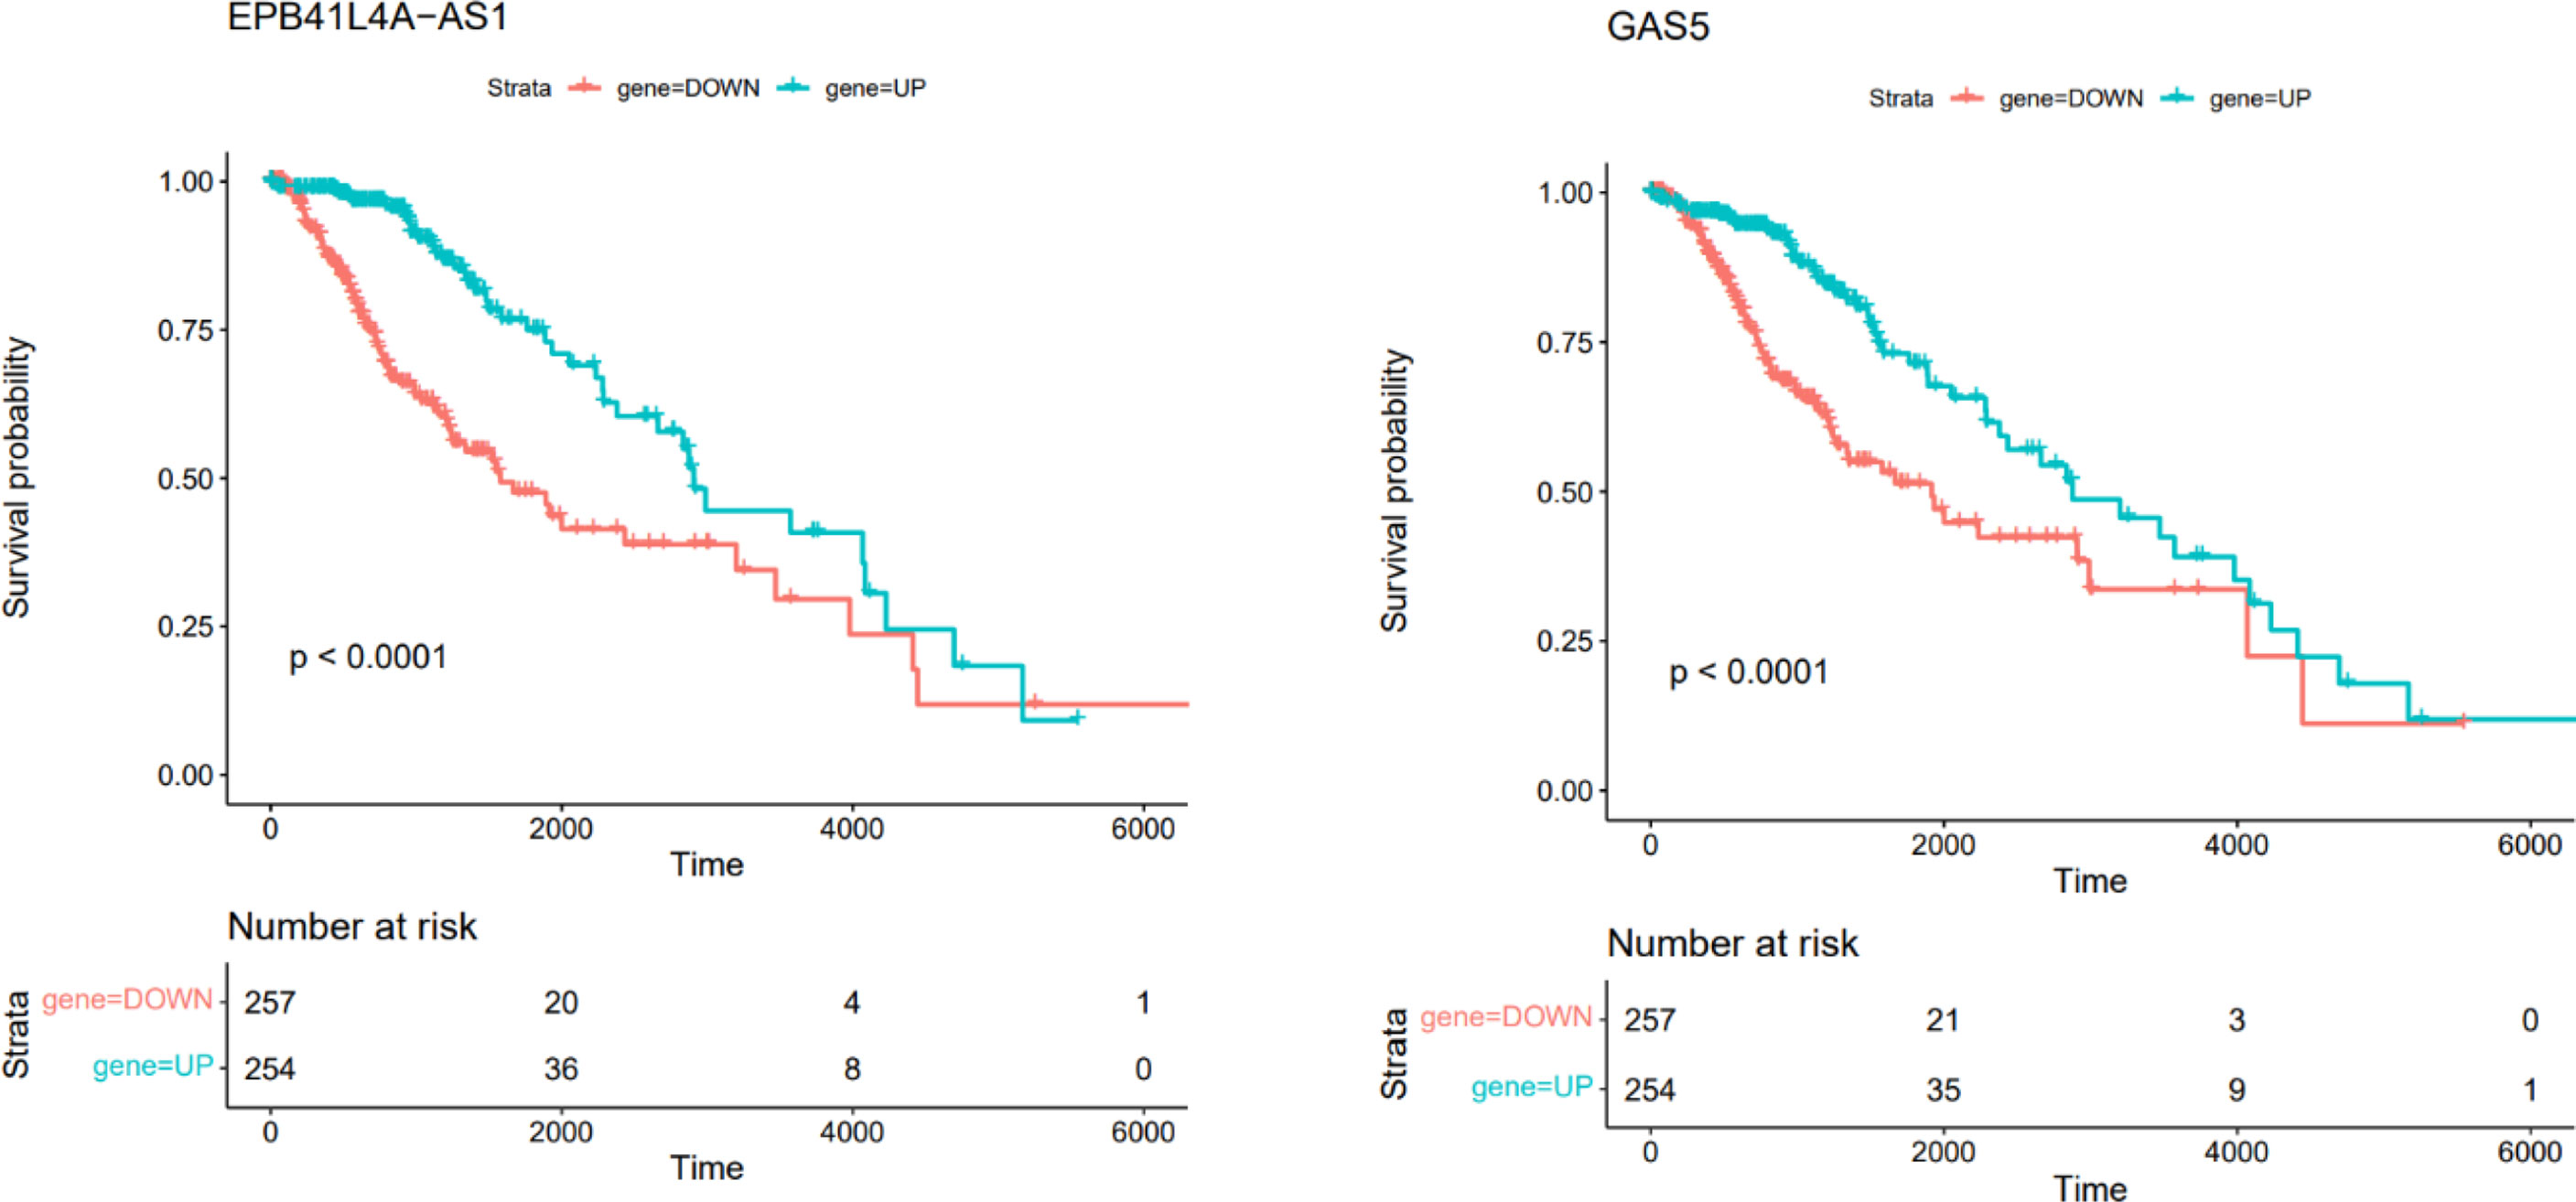
Figure 10 Kaplan–Meier survival curves of DElncRNAs associated with overall survival of patients with low grade glioma.
Discussion
The current study aimed to identify DEGs between NFPAs and normal samples and find the importance of these genes in the pathoetiology of this disorder. Our analyses led to identification of 3131 DEGs, including 189 downregulated DEGs (such as RPS4Y1 and DDX3Y) and 2898 upregulated DEGs (such as ASB3 and DRD4). RPS4Y1 and DDX3Y have been among downregulated genes in 12 cancers in a recent whole transcriptome analysis (28). The dopamine receptor DRD4 is also among important gens in the carcinogenic processes (29).
Moreover, we found 44 DElncRNAs, including 8 downregulated DElncRNAs (such as NUTM2B-AS1 and MALAT1) and 36 upregulated DElncRNAs (such as BCAR4 and SRD5A3-AS1). Notably, MALAT1 is commonly regarded as an oncogene in the carcinogenic processes. However, some reports have suggested a tumor-suppressing effect for MALAT1 (30, 31). It seems that MALAT1 exerts an anti-cancer effect in NFPAs. In addition, NUTM2B‐AS1 has been among up‐regulated lncRNAs in hepatocellular carcinoma (HCC) whose expressions have been associated with poor prognosis of affected persons. This lncRNA has also been found to participate in the construction of ceRNA network in this type of cancer (32). Thus, the aforementioned results indicate distinct role of some lncRNAs in the pathogenesis of different types of cancers. BCAR4 has been shown to exert an oncogenic role in breast cancer inducing endocrine resistance in these cells (33). SRD5A3-AS1 is transcribed from the antisense region of SRD5A3, a gene that induces tumor growth and is associated with poor survival of HCC (34).
Hsa-miR-15a, hsa-miR-26a, hsa-miR-26b, hsa-miR-223 and hsa-miR-132 are related miRNAs with these lncRNAs. miR-26a and miR-26b are two tumor suppressor miRNAs in colorectal cancer that can suppress aggressive behavior of cancer cells through regulating FUT4 (35). In addition, miR-15a has been shown to target several oncogenes, such as BCL2, MCL1, CCND1, and WNT3A. This miRNA has been reported to be down-regulated in chronic lymphocytic lymphoma, pituitary adenomas, and prostate carcinoma (36). miR-132 and miR-223 have been shown to regulate positive feedback circuit through regulation of FOXO3a (37).
GnRH signaling pathway, Tight junction, Gap junction, Melanogenesis, DNA replication, Nucleotide excision repair, Mismatch repair and N-Glycan biosynthesis have been among dysregulated pathways in NFPAs. Thus, DNA repair systems are implicated in the pathogenesis of NFPAs.
Then, we constructed a ceRNA network which included 11 lncRNAs, 51 mRNAs, and 14 miRNAs. This ceRNA network not only represents complicated pathoetiology of NFPAs, but also provides candidates for targeted therapy of this kind of tumor.
Two DElncRNAs, including EPB41L4A-AS1 and GAS5 have been associated with survival time of patients with brain tumors. Although the association between expression pattern of these lncRNAs and mortality or morbidity of patients with NFPAs has not been investigated yet, this finding suggests the importance of these lncRNAs in this regard. GAS5 lncRNA is mainly regarded as a tumor suppressor in human cancers. This lncRNA is down-regulated in several kinds of cancer, regulating cellular processes such as cell proliferation, apoptosis and invasion. Down-regulation of GAS5 expression is associated with higher ability of proliferation and poor prognosis in some malignancies (38). Association between expression of EPB41L4A-AS1 and survival of patients has been less studied. A single study in colorectal cancer has revealed an oncogenic role for this lncRNA and indicated it as a regulator of Rho/ROCK pathway (39).
Taken together, our study has revealed differential expression of several genes and signaling pathways in this type of tumors. Some of the identified DE genes in NFPAs are predicted to exert a specific role in this type of tumor. Others have common effects in the regulation of cell proliferation in several types of cancers.
Data availability statement
The original contributions presented in the study are included in the article/Supplementary Material. Further inquiries can be directed to the corresponding authors.
Author contributions
SG-F wrote the draft and revised it. MT and MA-B designed and supervised the study. BH, AS, and ND collected the data and designed the figures and tables. AS performed the bioinformatic analysis. All the authors read the submitted version and approved it.
Acknowledgments
The authors would like to thank the clinical Research Development Unit (CRDU) of Loghman Hakim Hospital, Shahid Beheshti University of Medical Sciences, Tehran, Iran for their support, cooperation and assistance throughout the period of study (Grant Number 43002285).
Conflict of interest
The authors declare that the research was conducted in the absence of any commercial or financial relationships that could be construed as a potential conflict of interest.
Publisher’s note
All claims expressed in this article are solely those of the authors and do not necessarily represent those of their affiliated organizations, or those of the publisher, the editors and the reviewers. Any product that may be evaluated in this article, or claim that may be made by its manufacturer, is not guaranteed or endorsed by the publisher.
Supplementary material
The Supplementary Material for this article can be found online at: https://www.frontiersin.org/articles/10.3389/fonc.2022.978016/full#supplementary-material
References
1. Tjörnstrand A, Gunnarsson K, Evert M, Holmberg E, Ragnarsson O, Rosen T. The incidence rate of pituitary adenomas in Western Sweden for the period 2001-2011. Eur J Of Endocrinol (2014) 171:519–26. doi: 10.1530/EJE-14-0144
2. Ntali G, Wass JA. Epidemiology, clinical presentation and diagnosis of non-functioning pituitary adenomas. Pituitary (2018) 21:111–8. doi: 10.1007/s11102-018-0869-3
3. Olsson DS, Nilsson AG, Bryngelsson I-L, Trimpou P, Johannsson G, Andersson E. Excess mortality in women and young adults with nonfunctioning pituitary adenoma: A Swedish nationwide study. J Of Clin Endocrinol Metab (2015) 100:2651–8. doi: 10.1210/jc.2015-1475
4. Raappana A, Koivukangas J, Ebeling T, Pirila T. Incidence of pituitary adenomas in northern Finland in 1992–2007. J Of Clin Endocrinol Metab (2010) 95:4268–75. doi: 10.1210/jc.2010-0537
5. Manojlovic-Gacic E, Engström BE, Casar-Borota O. Histopathological classification of non-functioning pituitary neuroendocrine tumors. Pituitary (2018) 21:119–29. doi: 10.1007/s11102-017-0855-1
6. Rosenbluh J, Nijhawan D, Chen Z, Wong KK, Masutomi K, Hahn WC. Rmrp is a non-coding rna essential for early murine development. PLoS One (2011) 6:E26270. doi: 10.1371/journal.pone.0026270
7. Olsson DS, Bryngelsson I-L, Ragnarsson O. Higher incidence of morbidity in women than men with non-functioning pituitary adenoma: A Swedish nationwide study. Eur J Endocrinol (2016) 175:55–61. doi: 10.1530/EJE-16-0173
8. Cheng S, Xie W, Miao Y, Guo J, Wang J, Li C, et al. Identification of key genes in invasive clinically non-functioning pituitary adenoma by integrating analysis of dna methylation and mrna expression profiles. J Of Trans Med (2019) 17:1–12. doi: 10.1186/s12967-019-02148-3
9. Taniguchi-Ponciano K, Gomez-Apo E, Chavez-Macias L, Vargas G, Espinosa-Cardenas E, Ramirez-Renteria C, et al. Molecular alterations in non-functioning pituitary adenomas. Cancer Biomark (2020) 28:193–9. doi: 10.3233/CBM-191121
10. Castillo D, Gálvez JM, Herrera LJ, Román BS, Rojas F, Rojas I. Integration of rna-seq data with heterogeneous microarray data for breast cancer profiling. BMC Bioinf (2017) 18:506. doi: 10.1186/s12859-017-1925-0
11. Leek JT, Johnson WE, Parker HS, Fertig EJ, Jaffe AE, Storey JD, et al. Sva: Surrogate variable analysis. R Package Version (2019) 3:882–3.
12. Johnson WE, Li C, Rabinovic A. Adjusting batch effects in microarray expression data using empirical bayes methods. Biostatistics (2007) 8:118–27. doi: 10.1093/biostatistics/kxj037
13. Leek JT, Storey JD. Capturing heterogeneity in gene expression studies by surrogate variable analysis. PLoS Genet (2007) 3:E161. doi: 10.1371/journal.pgen.0030161
14. Jafarinejad-Farsangi S, Moazzam-Jazi M, Ghale-Noie ZN, Askari N, Karam ZM, Mollazadeh S, et al. Investigation of genes and pathways involved in breast cancer subtypes through gene expression meta-analysis. Gene (2022) 821:146328. doi: 10.1016/j.gene.2022.146328
15. Ritchie ME, Phipson B, Wu D, Hu Y, Law CW, Shi W, et al. Limma powers differential expression analyses for rna-sequencing and microarray studies. Nucleic Acids Res (2015) 43:E47–7. doi: 10.1093/nar/gkv007
16. Kolde R. pheatmap: Pretty Heatmaps. R package version 1.0. 12. Available at: CRAN - Package pheatmap (r-project.org).
17. Wu T, Hu E, Xu S, Chen M, Guo P, Dai Z, et al. Clusterprofiler 4.0: A universal enrichment tool for interpreting omics data. Innovation (2021) 2:100141. doi: 10.1016/j.xinn.2021.100141
18. Kanehisa M, Goto S. Kegg: Kyoto encyclopedia of genes and genomes. Nucleic Acids Res (2000) 28:27–30. doi: 10.1093/nar/28.1.27
19. Jiang Q, Wang Y, Hao Y, Juan L, Teng M, Zhang X, et al. Mir2disease: A manually curated database for microrna deregulation in human disease. Nucleic Acids Res (2009) 37:D98–D104. doi: 10.1093/nar/gkn714
20. Chen Y, Wang X. Mirdb: An online database for prediction of functional microrna targets. Nucleic Acids Res (2020) 48:D127–31. doi: 10.1093/nar/gkz757
21. Mcgeary SE, Lin KS, Shi CY, Pham TM, Bisaria N, Kelley GM, et al. The biochemical basis of microrna targeting efficacy. Science (2019) 366:Eaav1741. doi: 10.1126/science.aav1741
22. Sticht C, de la Torre C, Parveen A, Gretz N. Mirwalk: An online resource for prediction of microrna binding sites. PLoS One (2018) 13:E0206239. doi: 10.1371/journal.pone.0206239
23. Shannon P, Markiel A, Ozier O, Baliga NS, Wang JT, Ramage D, et al. Cytoscape: A software environment for integrated models of biomolecular interaction networks. Genome Res (2003) 13:2498–504. doi: 10.1101/gr.1239303
24. Chin C-H, Chen S-H, Wu H-H, Ho C-W, Ko M-T, Lin C-Y. Cytohubba: Identifying hub objects and Sub-networks from complex interactome. BMC Syst Biol (2014) 8 Suppl 4:S11–1. doi: 10.1186/1752-0509-8-S4-S11
25. Tang Z, Li C, Kang B, Gao G, Li C, Zhang Z. Gepia: A web server for cancer and normal gene expression profiling and interactive analyses. Nucleic Acids Res (2017) 45:W98–W102. doi: 10.1093/nar/gkx247
26. Luo W, Brouwer C. Pathview: An R/Bioconductor package for pathway-based data integration and visualization. Bioinformatics (2013) 29:1830–1. doi: 10.1093/bioinformatics/btt285
27. Luo W, Friedman MS, Shedden K, Hankenson KD, Woolf PJ. Gage: Generally applicable gene set enrichment for pathway analysis. BMC Bioinf (2009) 10:1–17. doi: 10.1186/1471-2105-10-161
28. Cáceres A, Jene A, Esko T, Pérez-Jurado LA, González JR. Extreme downregulation of chromosome y and cancer risk in men. J Of Natl Cancer Institute (2020) 112:913–20. doi: 10.1093/jnci/djz232
29. Mirzaghasab A, Rigi G. Differential expression analysis of dopamine receptor genes Drd2, Drd3 and Drd4 in the tumoral and tumor margin samples of breast cancer patients. Biomacromolecular J (2020) 6:56–63.
30. Sun Y, Ma L. New insights into long non-coding rna Malat1 in cancer and metastasis. Cancers (2019) 11:216. doi: 10.3390/cancers11020216
31. Ghafouri-Fard S, Abak A, Hussen BM, Taheri M, Sharifi G. The emerging role of non-coding rnas in pituitary gland tumors and meningioma. Cancers (Basel) (2021) 13:5987. doi: 10.3390/cancers13235987
32. Lei Y, Yan W, Lin Z, Liu J, Tian D, Han P. Comprehensive analysis of partial epithelial mesenchymal transition-related genes in hepatocellular carcinoma. J Cell Mol Med (2021) 25:448–62. doi: 10.1111/jcmm.16099
33. Godinho M, Meijer D, Setyono-Han B, Dorssers LC, Van Agthoven T. Characterization of Bcar4, a novel oncogene causing endocrine resistance in human breast cancer cells. J Cell Physiol (2011) 226:1741–9. doi: 10.1002/jcp.22503
34. Mai Q, Sheng D, Chen C, Gou Q, Chen M, Huang X, et al. Steroid 5 alpha-reductase 3 (Srd5a3) promotes tumor growth and predicts poor survival of human hepatocellular carcinoma (Hcc). Aging (Albany Ny) (2020) 12:25395–411. doi: 10.18632/aging.104142
35. Li Y, Sun Z, Liu B, Shan Y, Zhao L, Jia L. Tumor-suppressive mir-26a and mir-26b inhibit cell aggressiveness by regulating Fut4 in colorectal cancer. Cell Death Dis (2017) 8:E2892. doi: 10.1038/cddis.2017.281
36. Aqeilan R, Calin G, Croce C. Mir-15a and mir-16-1 in cancer: Discovery, function and future perspectives. Cell Death Differentiation (2010) 17:215–20. doi: 10.1038/cdd.2009.69
37. Kim HY, Kwon HY, Ha Thi HT, Lee HJ, Kim GI, Hahm KB, et al. Microrna-132 and microrna-223 control positive feedback circuit by regulating Foxo3a in inflammatory bowel disease. J Gastroenterol Hepatol (2016) 31:1727–35. doi: 10.1111/jgh.13321
38. Ji J, Dai X, Yeung SJ, He X. The role of long non-coding rna Gas5 in cancers. Cancer Manag Res (2019) 11:2729–37. doi: 10.2147/CMAR.S189052
Keywords: non-functioning pituitary adenoma, lncRNA, miRNA, expression, biomarker
Citation: Ghafouri-Fard S, Safarzadeh A, Akhavan-Bahabadi M, Hussen BM, Taheri M and Dilmaghani NA (2022) Expression pattern of non-coding RNAs in non-functioning pituitary adenoma. Front. Oncol. 12:978016. doi: 10.3389/fonc.2022.978016
Received: 25 June 2022; Accepted: 08 August 2022;
Published: 02 September 2022.
Edited by:
Shahab Uddin, Hamad Medical Corporation, QatarReviewed by:
Olga Brovkina, German Cancer Research Center (DKFZ), GermanyDaozhi Xu, Shenyang Medical College, China
Copyright © 2022 Ghafouri-Fard, Safarzadeh, Akhavan-Bahabadi, Hussen, Taheri and Dilmaghani. This is an open-access article distributed under the terms of the Creative Commons Attribution License (CC BY). The use, distribution or reproduction in other forums is permitted, provided the original author(s) and the copyright owner(s) are credited and that the original publication in this journal is cited, in accordance with accepted academic practice. No use, distribution or reproduction is permitted which does not comply with these terms.
*Correspondence: Mohammad Taheri, bW9oYW1tYWQudGFoZXJpQHVuaS1qZW5hLmRl; Nader Akbari Dilmaghani, bmFkYWtiYXJpQHNibXUuYWMuaXI=
 Soudeh Ghafouri-Fard
 Arash Safarzadeh
 Mehdi Akhavan-Bahabadi3
 Bashdar Mahmud Hussen
 Mohammad Taheri
