 Hao Zhang
 Jun Pang
95% of researchers rate our articles as excellent or good
Learn more about the work of our research integrity team to safeguard the quality of each article we publish.
Find out more
SYSTEMATIC REVIEW article
Front. Oncol. , 02 September 2022
Sec. Genitourinary Oncology
Volume 12 - 2022 | https://doi.org/10.3389/fonc.2022.975183
This article is part of the Research Topic The Application of Artificial Intelligence In Diagnosis, Treatment and Prognosis In Urologic Oncology View all 11 articles
Objectives: (1) To assess the methodological quality and risk of bias of radiomics studies investigating the diagnostic performance in adrenal masses and (2) to determine the potential diagnostic value of radiomics in adrenal tumors by quantitative analysis.
Methods: PubMed, Embase, Web of Science, and Cochrane Library databases were searched for eligible literature. Methodological quality and risk of bias in the included studies were assessed by the Quality Assessment of Diagnostic Accuracy Studies 2 (QUADAS-2) and Radiomics Quality Score (RQS). The diagnostic performance was evaluated by pooled sensitivity, specificity, diagnostic odds ratio (DOR), and area under the curve (AUC). Spearman’s correlation coefficient and subgroup analysis were used to investigate the cause of heterogeneity. Publication bias was examined using the Deeks’ funnel plot.
Results: Twenty-eight studies investigating the diagnostic performance of radiomics in adrenal tumors were identified, with a total of 3579 samples. The average RQS was 5.11 (14.2% of total) with an acceptable inter-rater agreement (ICC 0.94, 95% CI 0.93–0.95). The risk of bias was moderate according to the result of QUADAS-2. Nine studies investigating the use of CT-based radiomics in differentiating malignant from benign adrenal tumors were included in the quantitative analysis. The pooled sensitivity, specificity, DOR and AUC with 95% confidence intervals were 0.80 (0.68-0.88), 0.83 (0.73-0.90), 19.06 (7.87-46.19) and 0.88 (0.85–0.91), respectively. There was significant heterogeneity among the included studies but no threshold effect in the meta-analysis. The result of subgroup analysis demonstrated that radiomics based on unenhanced and contrast-enhanced CT possessed higher diagnostic performance, and second-order or higher-order features could enhance the diagnostic sensitivity but also increase the false positive rate. No significant difference in diagnostic ability was observed between studies with machine learning and those without.
Conclusions: The methodological quality and risk of bias of studies investigating the diagnostic performance of radiomics in adrenal tumors should be further improved in the future. CT-based radiomics has the potential benefits in differentiating malignant from benign adrenal tumors. The heterogeneity between the included studies was a major limitation to obtaining more accurate conclusions.
Systematic Review Registration: https://www.crd.york.ac.uk/PROSPERO/ CRD 42022331999 .
Due to the increasing use of abdominal imaging, the discovery of adrenal incidentalomas has kept rising. It is reported that adrenal incidentalomas account for 4-5% of patients without malignancy (1). Although most adrenal masses are benign and non-functional, their functional status and malignant potential should be evaluated when they are detected, according to the latest recommendations (2). However, it is challenging for radiologists to accurately diagnose adrenal masses via conventional imaging assessments (3, 4). To begin, imaging features of pitfalls and mimics that are related to various abnormalities and aberrant appearances may potentially lead to misdiagnosis (3). For example, large adenomas usually present as heterogeneous masses on computed tomography (CT) images can not be easily differentiated from adrenocortical carcinoma visually (5, 6). Secondly, conventional imaging assessments depend largely on the experience and knowledge level of the radiologist. Consequently, exploring better approaches to improve the diagnostic value of adrenal imaging is crucial, considering that inappropriate diagnosis can lead to increased treatment costs or unnecessary examination (7).
Radiomics, first pioneered by Philippe Lambin, generally aims to extract quantitative and reproducible data that are imperceptible to the human eye from biomedical images for a series of medical purposes (8, 9). Extracted features, divided into shape-based, first-, second-, and higher-order statistics, can be translated into high-throughput and quantitative data for analysis (10, 11). The features that contribute the most to the objective will be selected for constructing the model via statistical approaches and artificial intelligence. Furthermore, radiomics features may achieve complementarity and improve accuracy when combined with clinically acquired, treatment-related, and genomic data (12). As artificial intelligence advances by leaps and bounds, radiomics has been extensively tested and applied in various aspects of oncology, including diagnosis, classification, and prognosis prediction (10). Recently, an increasing number of studies also established that radiomics could offer a risk-free and efficient method to increase the value of diagnostic imaging of adrenal masses. Nakajo et al. investigated the diagnostic performance of standardized uptake value (SUV)-related and texture parameters of F-18-fluorodeoxyglucose positron emission tomography/computedtomography (FDG PET/CT) between benign and metastatic adrenal tumors (13). In one study, texture analysis was applied to evaluate CT-abnormal adrenal glands in order to differentiate between malignant and benign tumors in patients with lung cancer (14). Moreover, Kong et al. designed a radiomic-based nomogram for pheochromocytoma diagnosis and achieved robust performance (15).
Although radiomics offers a relatively objective and quantitative diagnostic pattern, it is also subjected to data collection, radiomics characteristics processing, and modeling methods. Considering that the quality and results of published studies are mixed, diagnostic performance and feasibility of radiomics in adrenal masses remain elusive. Hence, the aim of the present review was to assess the methodological quality and risk of bias of radiomics studies investigating diagnostic performance in adrenal masses and to determine the potential diagnostic value of radiomics in adrenal tumors by quantitative analysis.
This review followed the Cochrane Handbook for Systematic Reviews of Interventions and was conducted in accordance with the PRISMA-DTA (Preferred Reporting Items for Systematic Reviews and Meta-analysis for Diagnostic Test Accuracy) statement (16, 17). The protocol of this review is available through PROSPERO (CRD 42022331999).
PubMed, Embase, Web of Science, and Cochrane Library databases were searched by two independent observers to identify eligible studies in May 2022. Additionally, the reference lists of the included studies were manually searched for studies that might meet the inclusion criteria.
The titles and abstracts of potentially relevant studies were screened by two reviewers (HZ and HL) independently. Then, the same two reviewers analyzed the full texts of eligible studies and determined the pieces of literature that met the inclusion criteria. Discrepancies between the two investigators were resolved by consensus with a third reviewer (JP).
All single, comparative studies, and primary studies that met the following PICO criteria were selected:
P (patients): Patients with benign or malign adrenal tumors;
I (interventions): Radiomics or texture analysis;
C (comparison): Standard-of-care imaging including computed tomography (CT) and magnetic resonance imaging (MRI), and positron emission tomography/computedtomography (PET/CT);
O (outcome): Histologic typing (including differentiation between different adrenal masses and differentiation between benign and malign adrenal tumors).
The exclusion criteria were as follows: (a) letters, reviews, editorials, expert opinions, case reports, meeting abstracts and comments; (b) non-human research; (c) the study was not written in English. The full search terms are outlined in Table S1.
The Radiomics Quality Score (RQS) and Quality Assessment of Diagnostic Accuracy Studies 2 (QUADAS-2) tools were utilized to assess the methodological quality and risk of bias of the included studies, respectively (18, 19). RQS comprises a total of 16 criteria, and the score of each item corresponds to the importance of the methodological quality of the study. The total score ranges from -8 to +36 points, with -8 to 0 points defined as 0% and 36 as 100% (16). The QUADAS-2 tool includes four evaluation criteria: (a) patient selection; (b) index test; (c) reference standard; and (d) flow and timing. Two independent reviewers (HZ and HL) performed the quality assessment, and disagreements between the two reviewers were resolved by consensus with a third reviewer (JP).
A meta-analysis may be performed only when a sufficient number of studies attempt to answer a similar question. In this study, we performed a meta-analysis of all studies investigating the diagnostic performance of CT-based radiomics between malign and benign adrenal tumors. Data from all the eligible studies were extracted by two independent reviewers (HZ and HL). Discrepancies were resolved by consensus with a third reviewer (JP). Only studies from which a two-by-two contingency table could be extracted or reconstructed were included. If there were multiple models in the study, only the one with the highest area under the curve (AUC) was extracted. Moreover, the data from the model with the highest Youden’s Index was selected if AUC was not reported. When multiple publications were from the same research, only the study with the higher methodological quality was included.
Pooled sensitivity, specificity, diagnostic odds ratio (DOR), positive likelihood ratio (PLR), and negative likelihood ratio (NLR) with 95% confidence intervals (CIs) were employed to quantify the diagnostic performance. In addition, diagnostic accuracy was outlined by the summary receiver operating characteristic curve (SROC) and area under the curve (AUC). The heterogeneity of studies was assessed by calculating the I 2 index, where an I 2 value of 0–25% represents insignificant heterogeneity, >25–50% indicates low heterogeneity, >50–75% indicates moderate heterogeneity, and >75% indicates high heterogeneity (20). A p < 0.05 was considered statistically significant. A random-effects model was employed to evaluate effect size and pool studies. Forest plots were constructed for visualization of the results. Spearman’s correlation coefficient was used to assess the threshold effect between sensitivity logit and (1-specificity) logit. In order to investigate the source of heterogeneity, a subgroup analysis was also conducted with the following covariates: (a) CT Type; (b) CT Feature Type; (c) Machine Learning; (d) Reference. The sensitivity analysis was performed by eliminating the included studies one after another. Publication bias was explored using the Deeks’ funnel plot, and statistical significance was assessed by Deeks’ asymmetry test. Clinical utility was examined using a Fagan plot, which provided the posttest probability when pretest probabilities were calculated (21).
Stata software (Stata Corporation, College Station, TX, USA, version 16.0) and the Open Meta-analyst (a completely open-source, cross-platform software) were used to conduct the meta-analysis. The interclass correlation coefficient (ICC), which described inter-rater agreement for the RQS and QUADAS-2 and Spearman’s correlation coefficient, was determined by SPSS software (IBM, Armonk, NY, USA, version 25.0).
The PRISMA flow-chart of the literature search of this systematic review and meta-analysis is presented in Figure 1. 613 studies were screened following the removal of 316 duplicate records. Then, 574 articles were excluded by evaluating the abstract and title. After thoroughly screening the full-text, 3 studies were excluded for being reviews or meta-analyses; 6 for being meeting abstracts; one for being a letter; and one for being in a non-English language. Eventually, 28 studies were enrolled in this research. Table 1 summarizes the characteristics of the included studies.
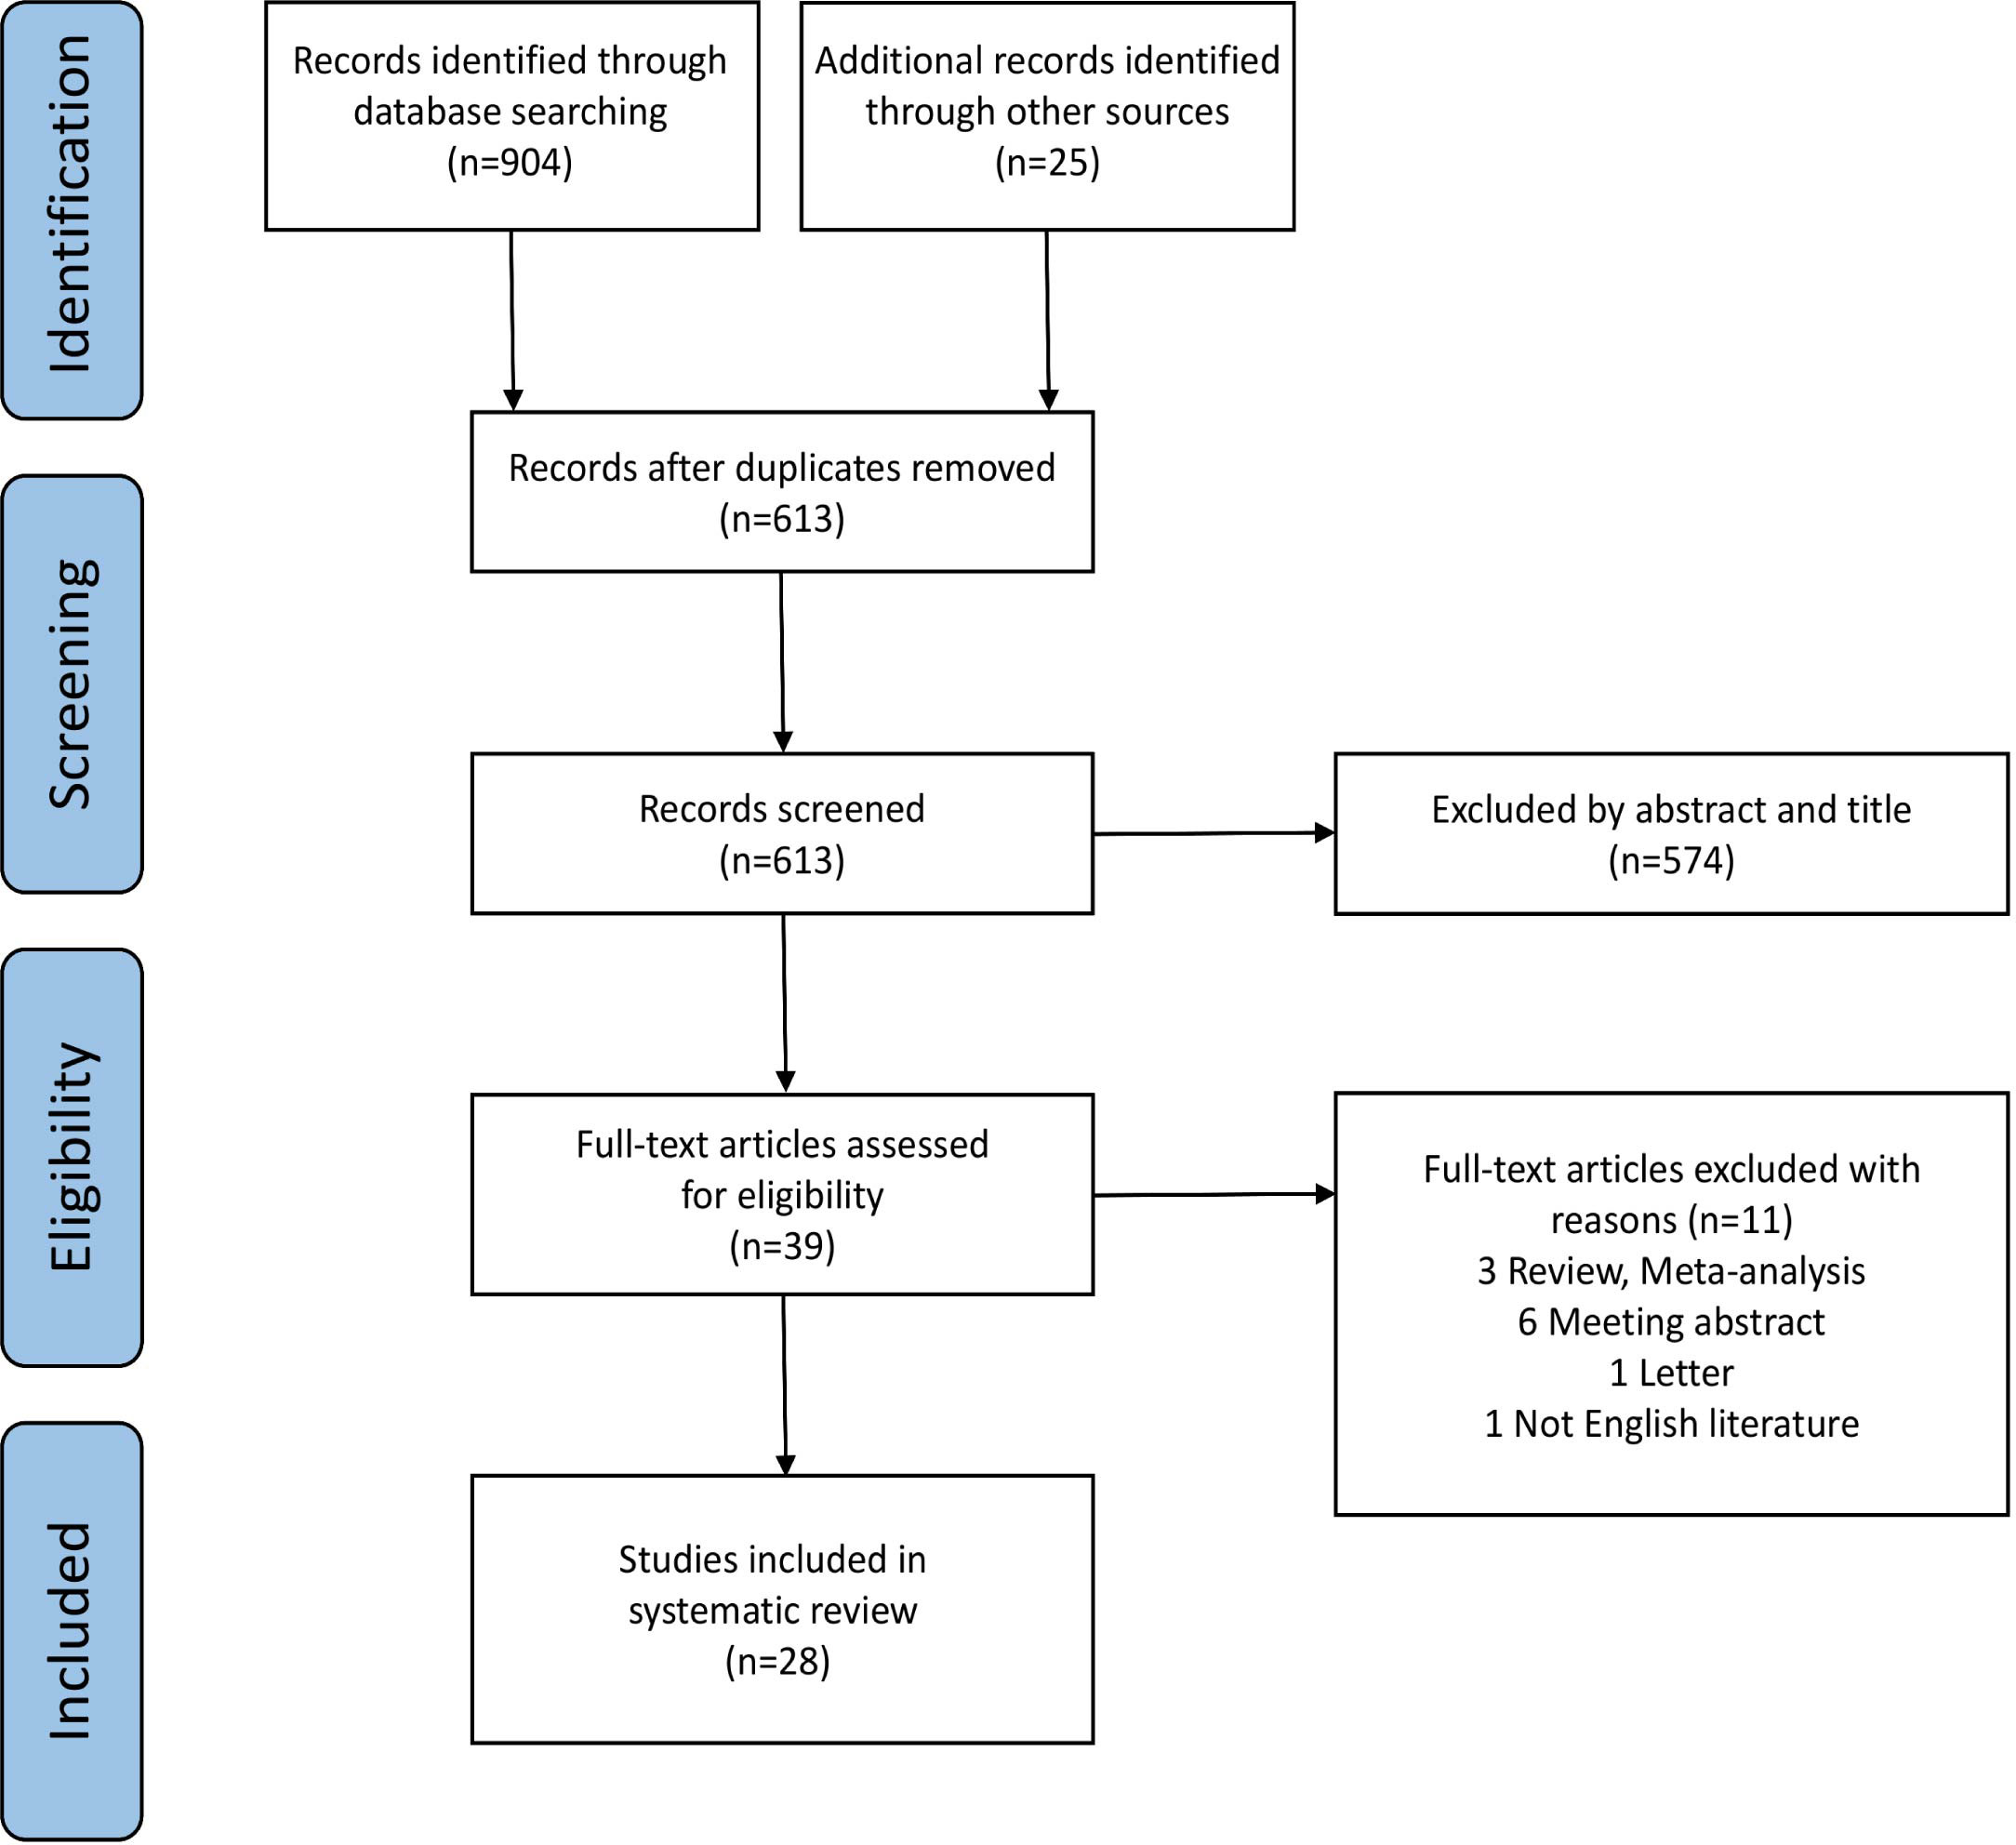
Figure 1 Flow diagram of study selection.
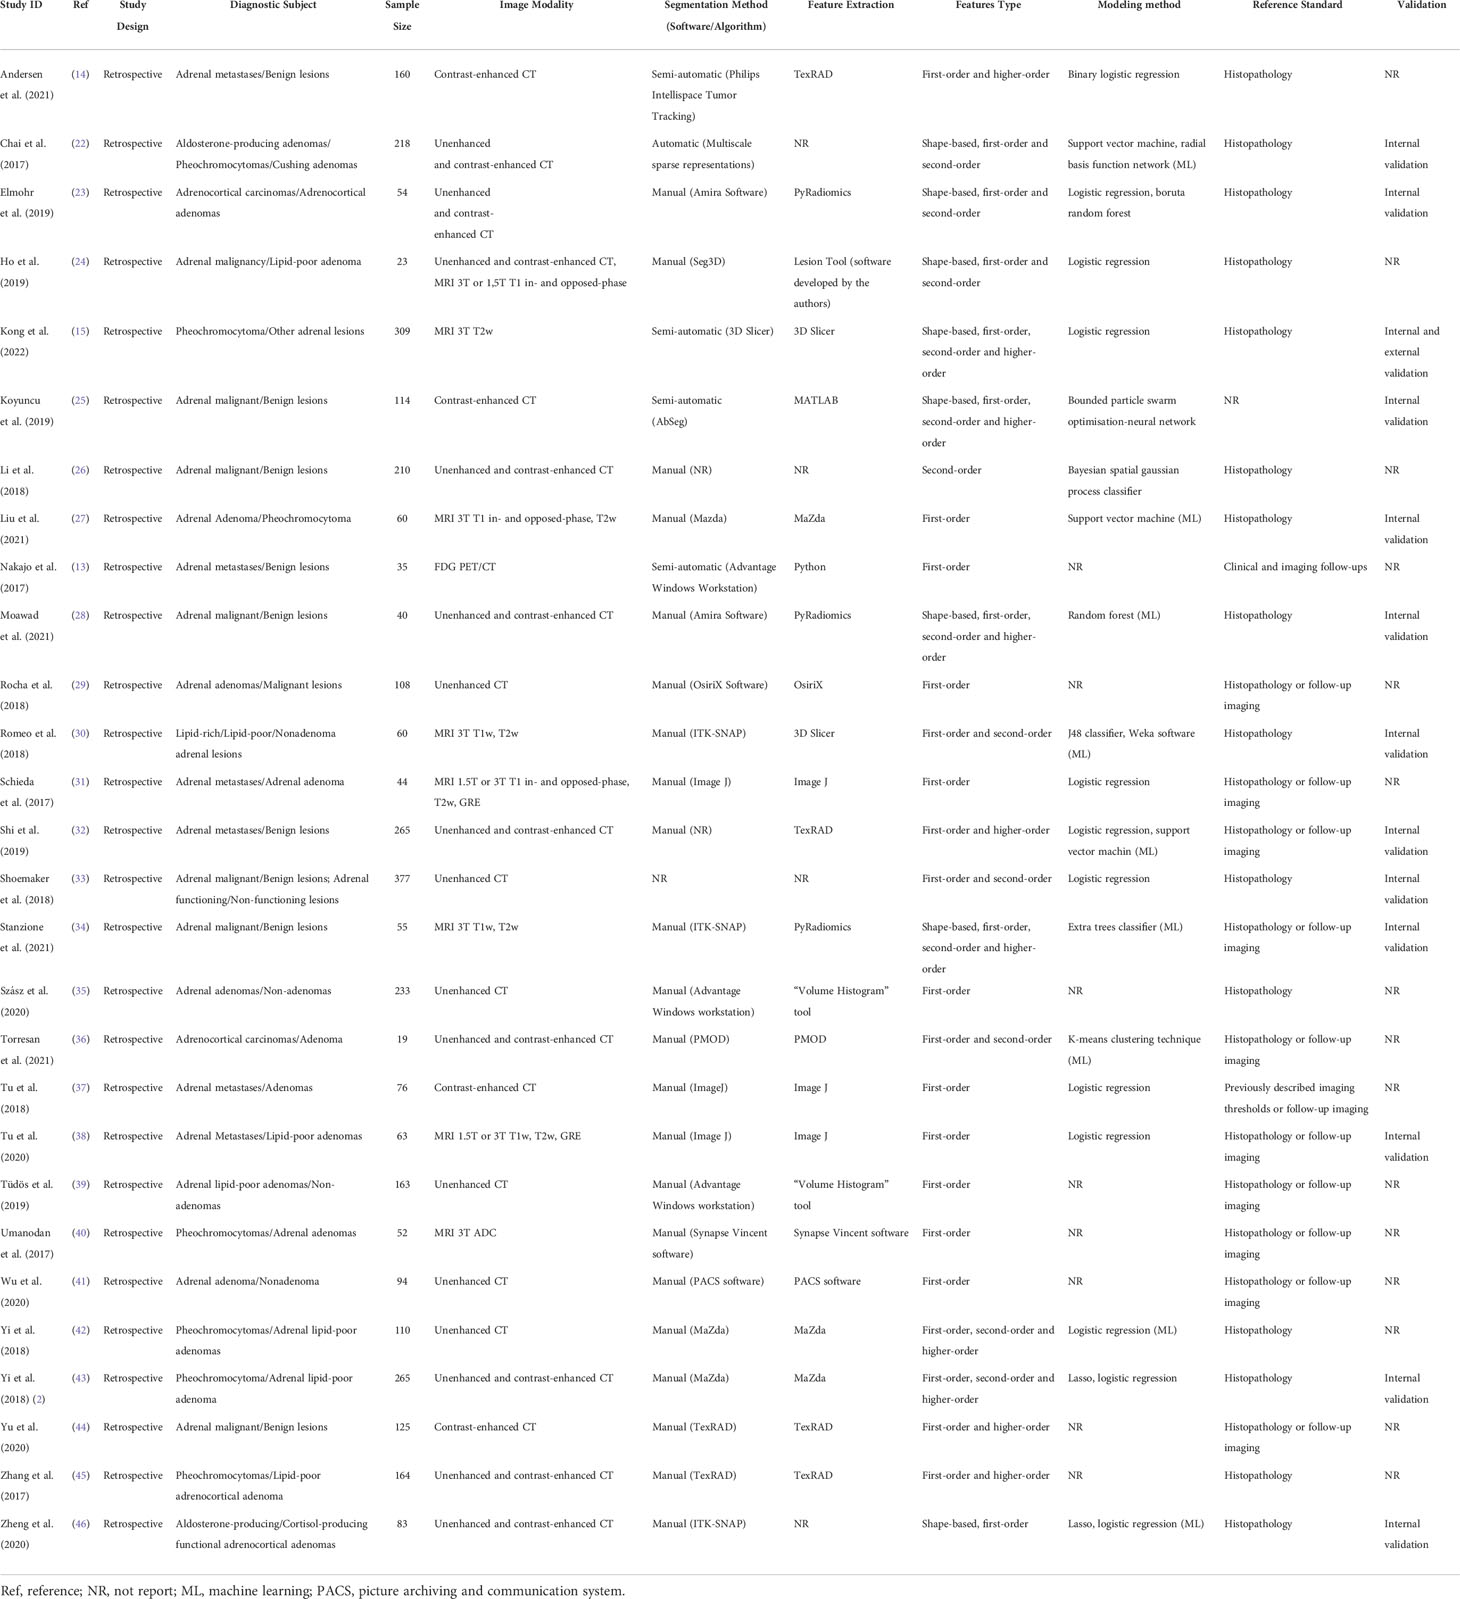
Table 1 Characteristics of the included studies.
All 28 studies were retrospective cohort studies, and the sample size (number of lesions) ranged from 19 to 377. Most objectives of the included studies were differentiation between benign and malignant adrenal neoplasms by radiomics, followed by the differentiation between pheochromocytoma and adenoma. Other studies distinguished adrenal adenomas from non-adenomas or identified subtypes of adrenal adenomas. The majority of studies focused on the diagnostic performance of radiomics using CT imaging (n=19), while a quarter was based on magnetic resonance imaging (n=7). Additionally, one study explored the use of radiomics based on a combination of CT and MR and one based on FDG PET/CT. More than 78% (22/28) of studies used manual segmentation. Radiomics feature types used by different studies varied. Interestingly, over half of the included studies (n=17) extracted second or higher-order features for analyses. As for the modeling method, 12 studies conducted logistic regression, eight studies did not provide relevant information and the remainder employed other algorithms such as support vector machine, random forest, extra trees classifier and so forth. More than half studies utilized histopathology as the gold reference (n=15). Ten studies combined histopathology and follow-up imaging. Two articles exclusively considered clinical and imaging follow-ups, and one study failed to report the reference standard. Outcomes of the included studies are summarized in Table 2.
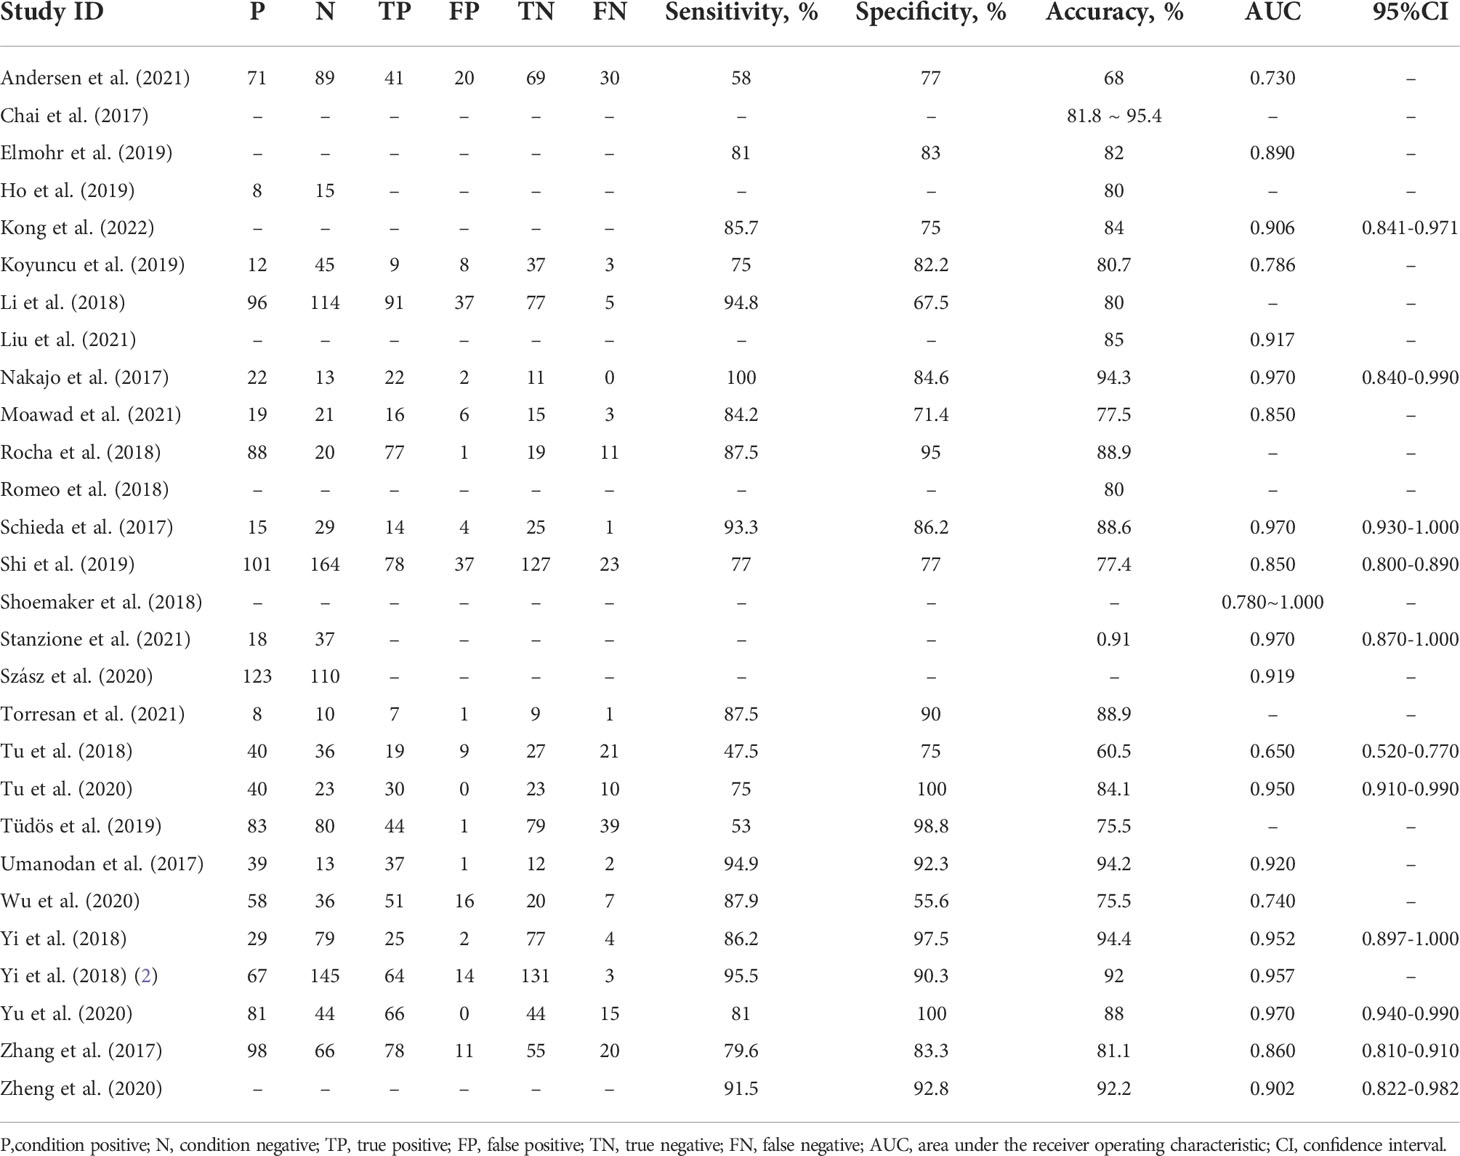
Table 2 Outcomes of the included studies.
The included studies achieved an mean ± standard deviation RQS of 5.11 ± 7.70, a median of 3.5, interquartile range 14, and a range of -5 to 25. The mean RQS proportion was 14.2%, with a maximum of 69.4%. The mode scores for the 16 dimensions are summarized in Table 3. The individual scores of each study and final scores of RQS are presented in Tables S2 and S3, respectively.
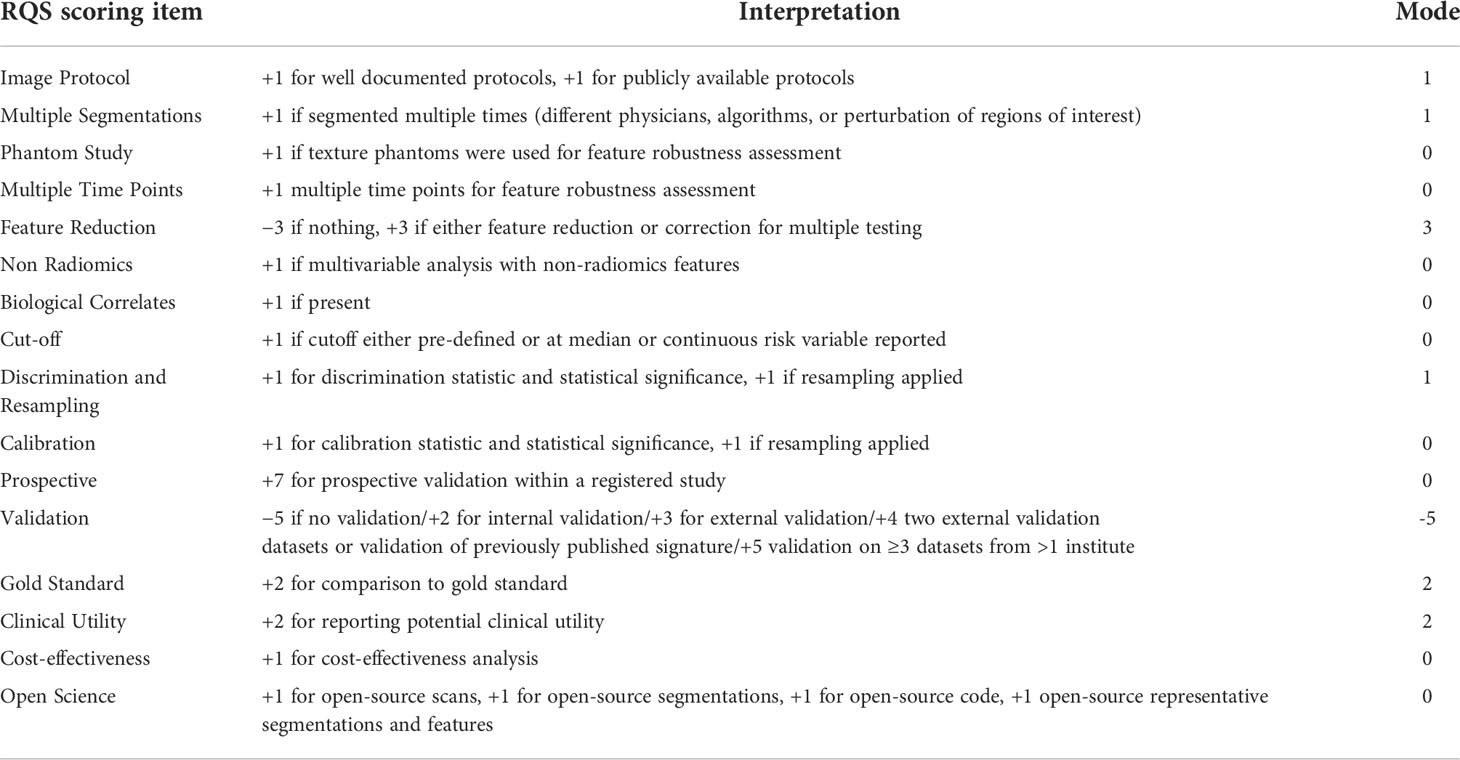
Table 3 Elements of the RQS and average rating achieved by the studies included in this systematic review.
The majority of studies provided details about the imaging scheme, applied discrimination statistics and achieved their potential clinical utility. Conversely, none of the included studies employed phantoms, considered biological correlates or assessed the repeatability of radiomics analysis at multiple time points. Moreover, feature reduction or adjustment of multiple tests were performed in 16/28 (57%) studies, and non-radiomics features were applied in 3/28 (11%) studies. Only a few studies conducted model calibration, assessed the cost-effectiveness and publicly shared segmentations or code. The inter-reader agreement was found to be moderate to excellent for radiomics features in 39% (11/28) of the included studies. Nevertheless, validation of more than half of the included studies was missing (15/28, 50%). Only one study (28) compared the diagnostic performance of the classifier with an expert radiologist, but no significant differences were noted. In general, the quality of included articles was acceptable, and the assessment of the risk of bias and applicability of the 28 included studies are illustrated in Figure 2. The detail of the individual and final evaluation of the risk of bias and applicability concerns are presented in Tables S4 and S5, respectively.
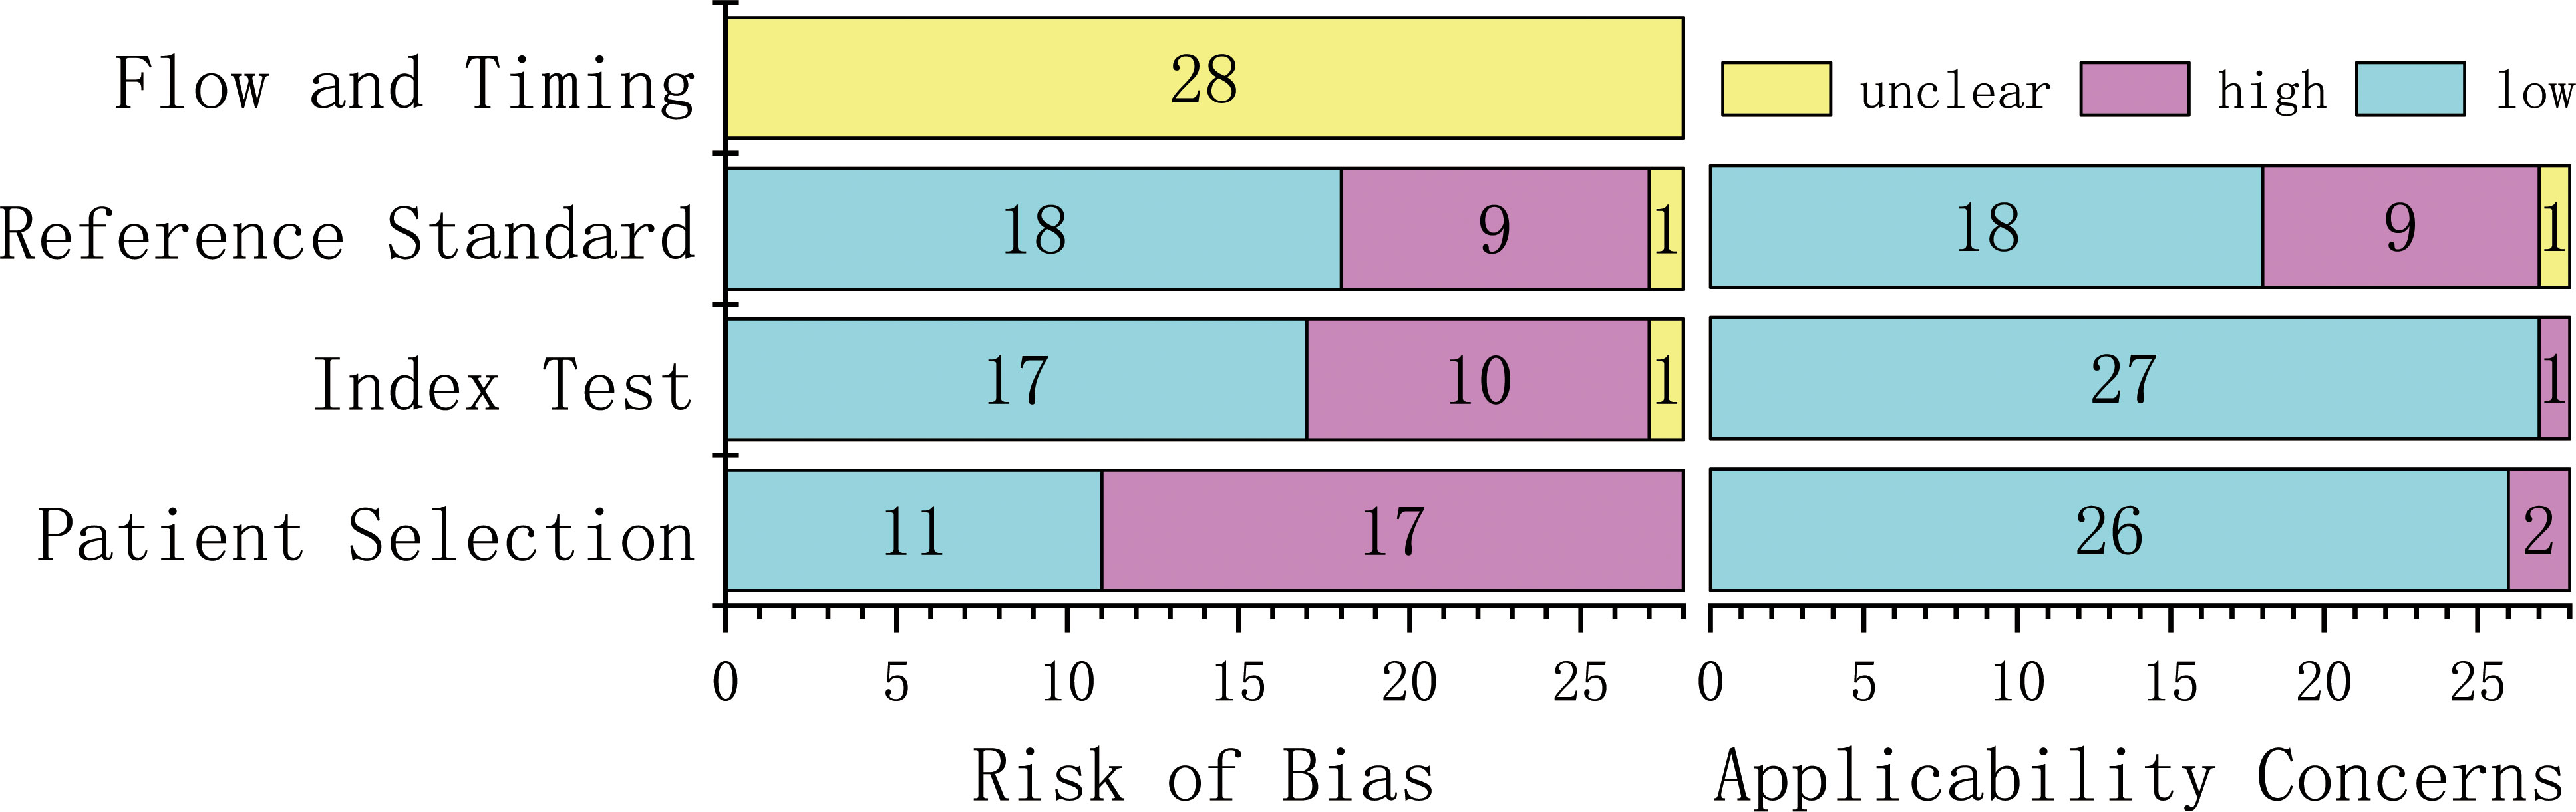
Figure 2 The risk of bias and concerns regarding applicability of 28 included studies.
Inter-rater agreements of RQS and QUADAS-2 were also assessed by the ICC. The ICC for the RQS was 0.94 (95% CI 0.93–0.95). Six criteria of RQS reached a moderate agreement, while ten items achieved substantial or almost perfect agreement (Table 4). The ICC for the QUADAS-2 was 0.96 (95% CI 0.95–0.97). Except for two dimensions reaching a moderate agreement, the others exceeded 75% agreement (Table 5).
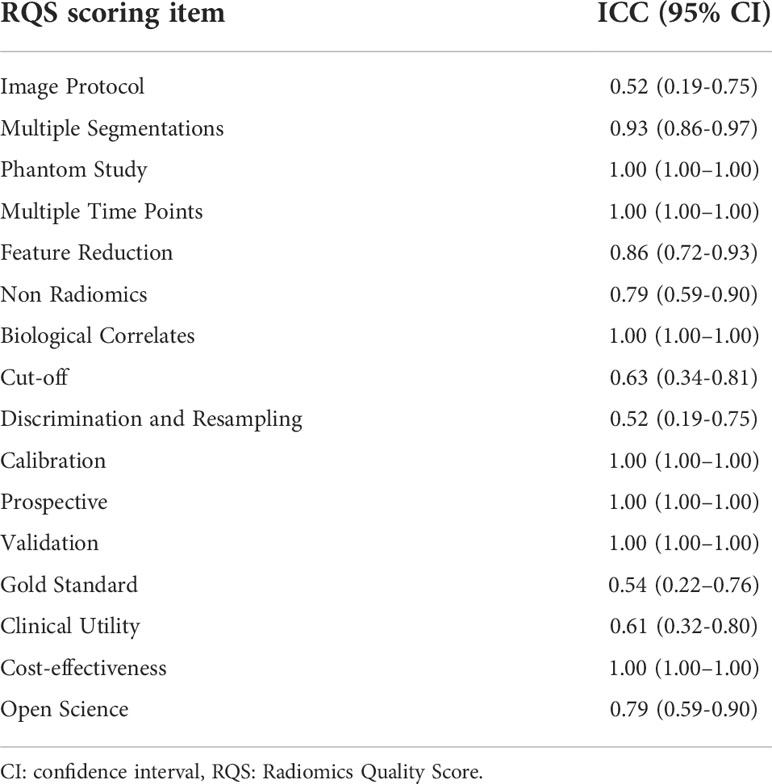
Table 4 Inter-rater agreement in RQS assessment.
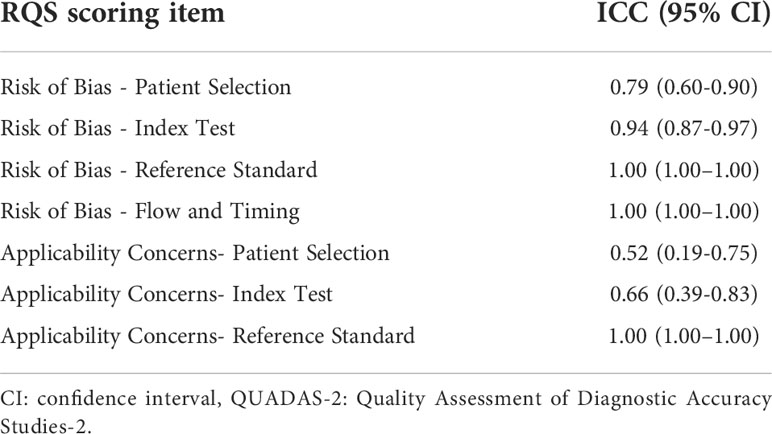
Table 5 Inter-rater agreement in QUADAS-2 assessment.
We performed a meta-analysis investigating the use of CT-based radiomics in differentiating malignant from benign adrenal tumors and enrolled nine eligible studies, from which a two-by-two contingency table could be extracted or reconstructed. As shown in Table 6, the mean values and 95% CIs of the pooled sensitivity, specificity, PLR, NLR, and DOR for the radiomics signature based on CT in differentiating malignant adrenal tumors from benign tumors were 0.80 (0.68-0.88), 0.83 (0.73-0.90), 4.70 (2.80-8.00), 0.25 (0.15-0.41) and 19.06 (7.87-46.19) respectively. The summary receiver operating characteristic curve showed an overall pooled AUC of 0.88 (95% CI 0.85–0.91) (Figure 3). Significant heterogeneity in sensitivity (I 2 = 87.09%) and specificity (I 2 = 72.1%) were noted, as depicted in Figure 4. Consequently, diagnostic threshold analysis was carried out, which revealed that there was no threshold effect, given that the Spearman’s correlation coefficient was -0.036 and the p-value was 0.932. In order to further explore the cause of heterogeneity, subgroup analysis was also performed, as outlined in Table 6.
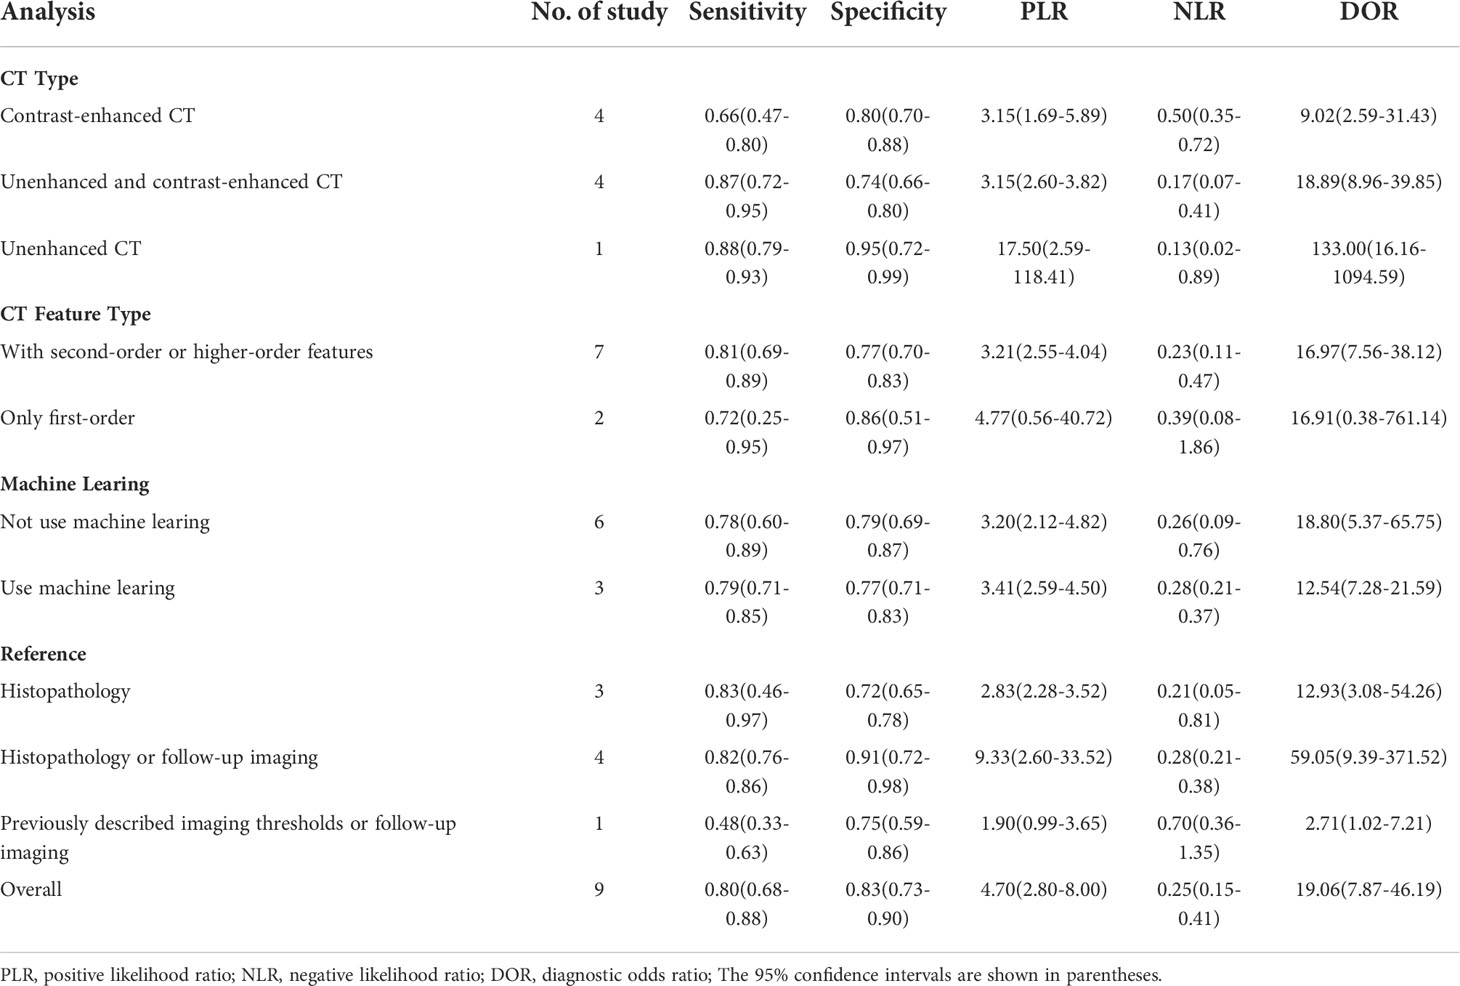
Table 6 The results of subgroup analysis.
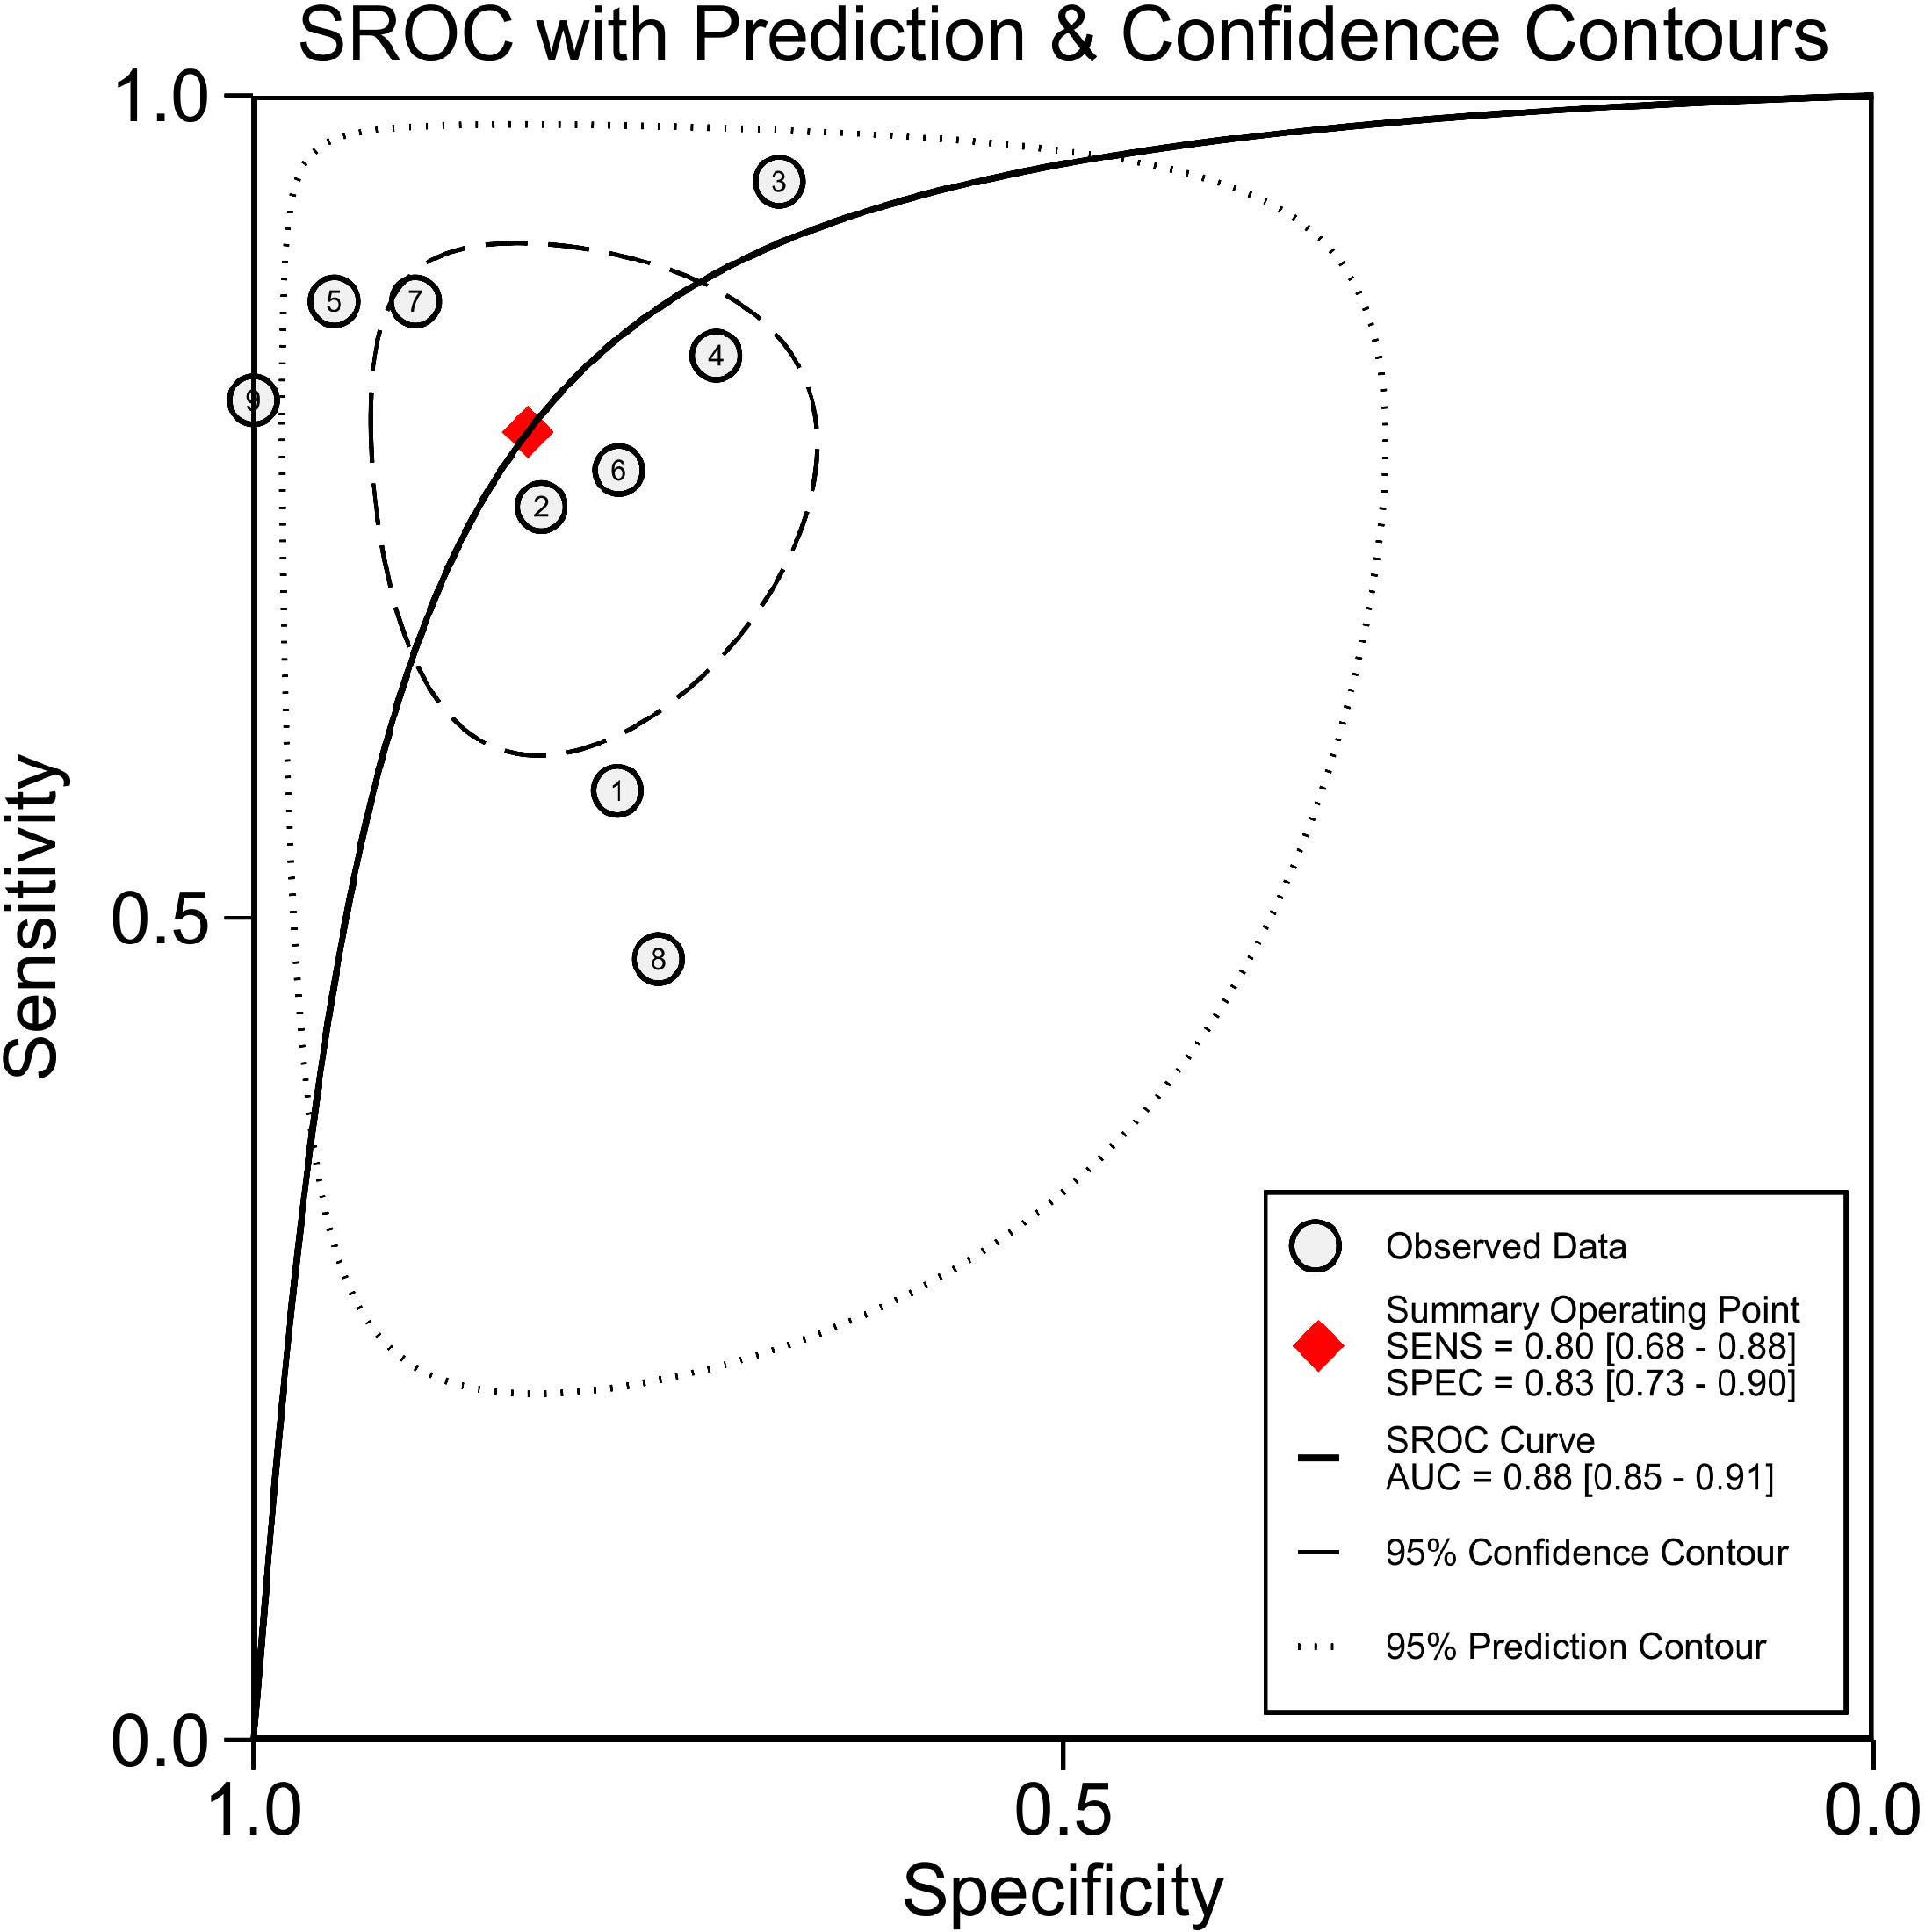
Figure 3 Summary receiver operating characteristic (SROC). AUC, area under the curve.
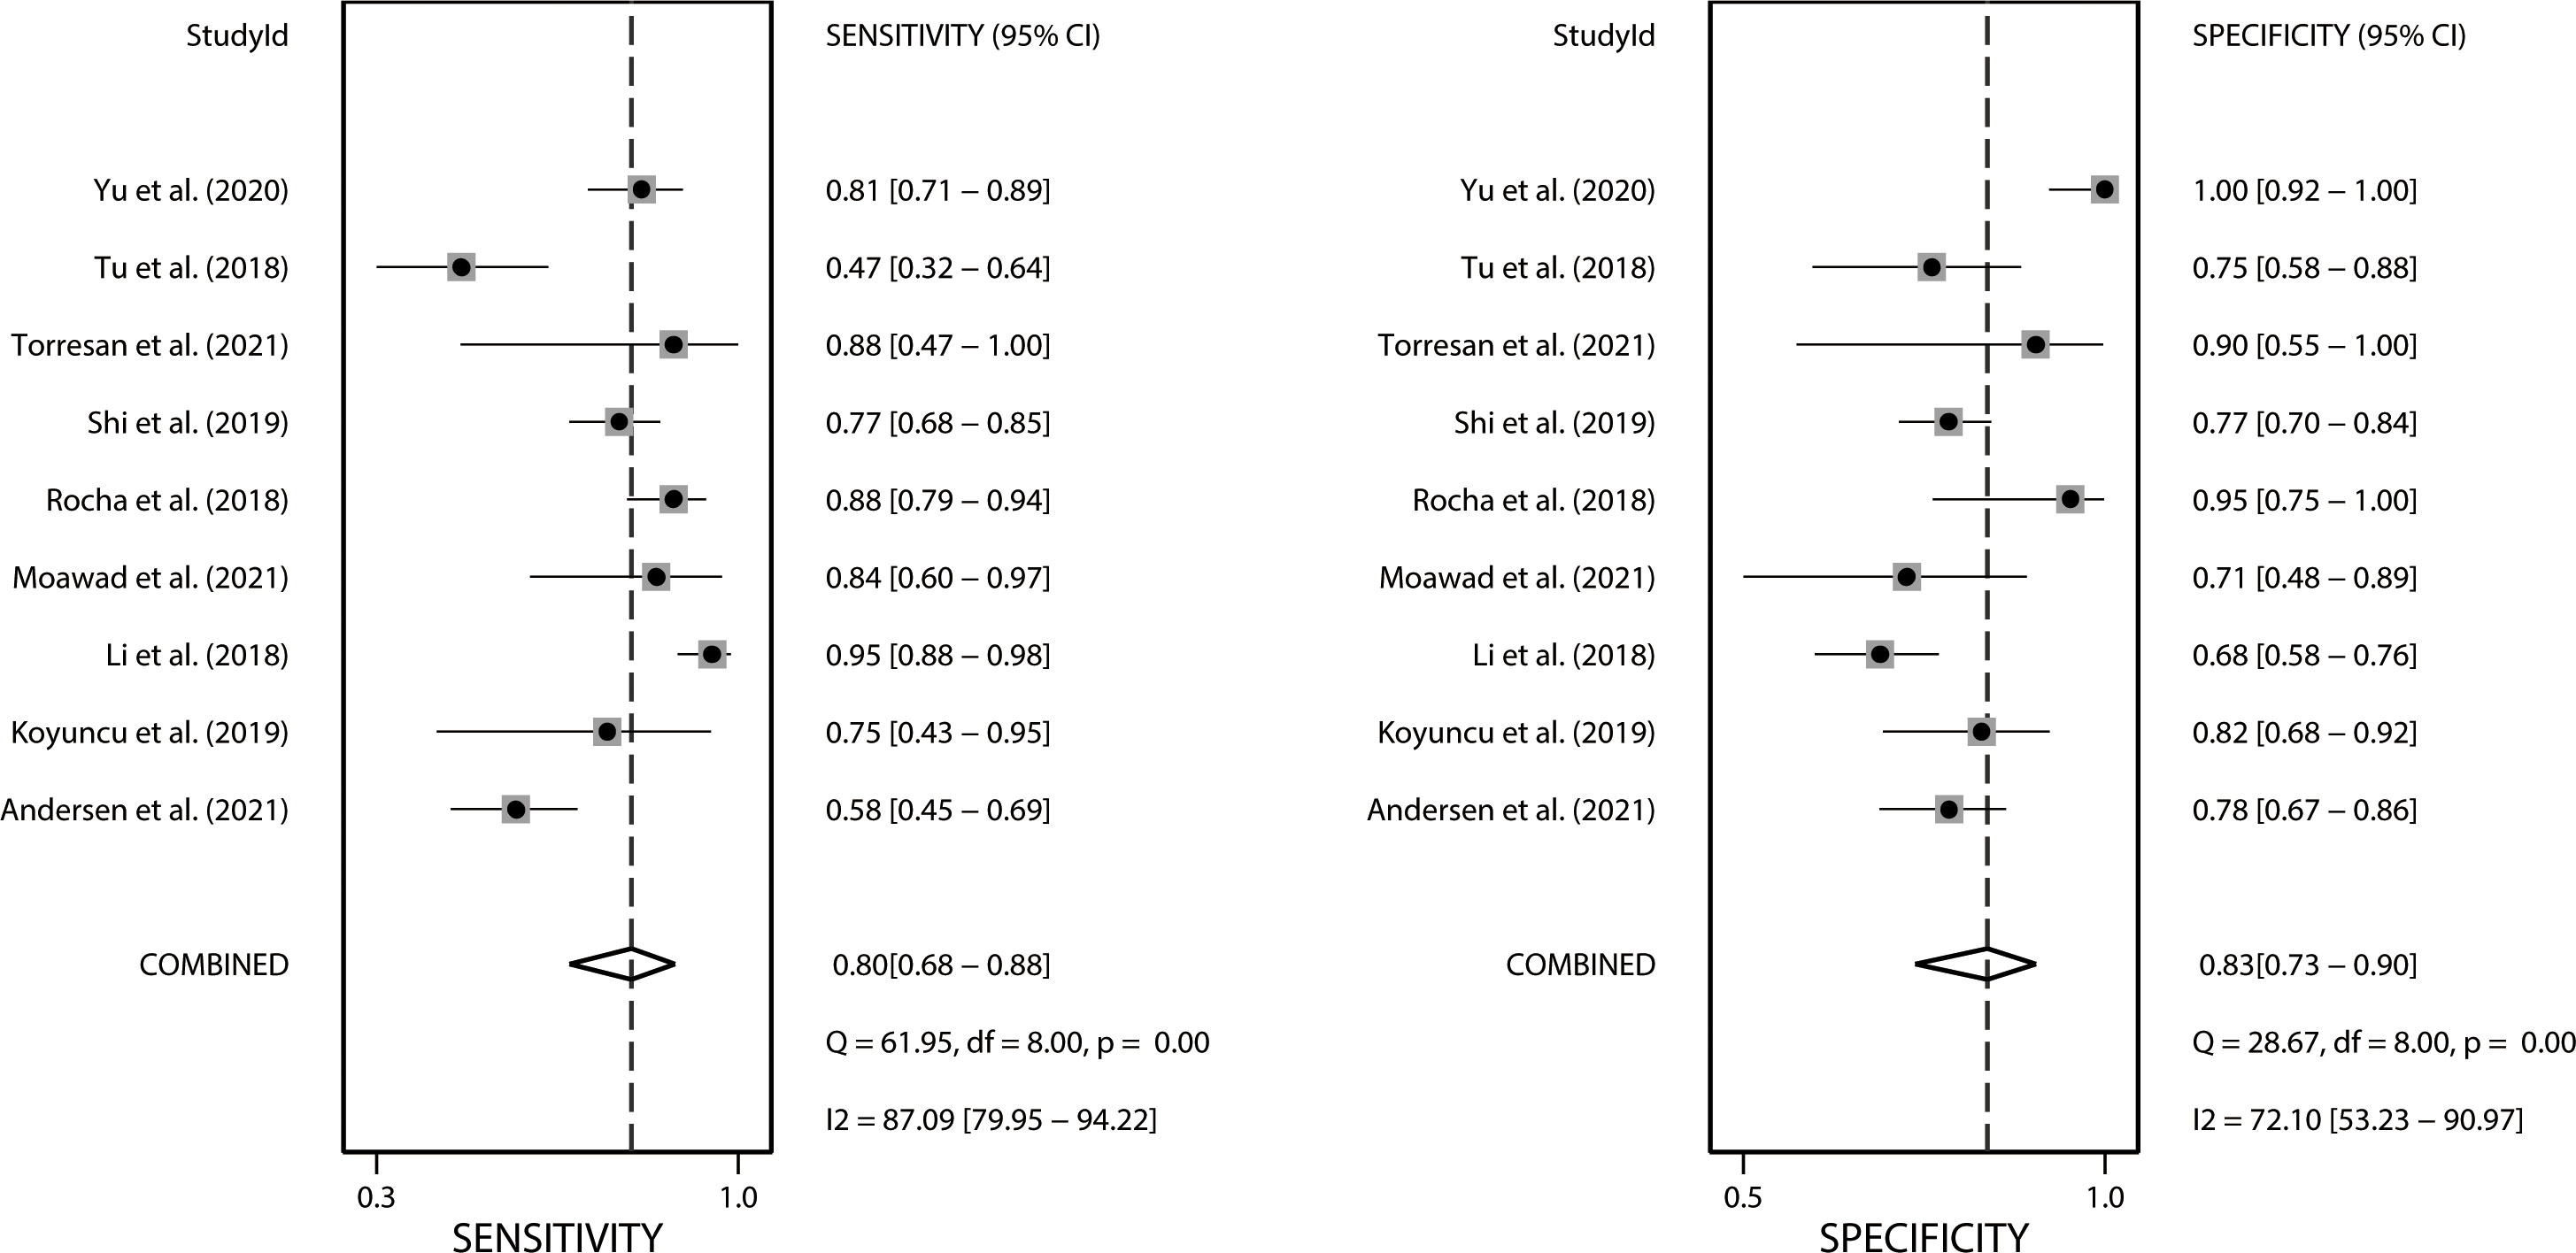
Figure 4 Forest plots of the sensitivity and specificity of CT-based radiomics in differentiating malignant from benign adrenal tumors. I2 >50% indicates substantial heterogeneity among included studies.
Four studies with radiomics based on unenhanced and contrast-enhanced CT demonstrated higher sensitivity (0.87 vs. 0.66) but lower specificity (0.74 vs. 0.80) than studies using only contrast-enhanced CT. Studies (n=2) that only included first-order features had lower sensitivity (0.72 vs. 0.81) but higher specificity (0.86 vs. 0.77) compared to those that combined with second-order or higher-order features. Interestingly, the studies (n=3) that applied machine learning gained equivalent sensitivity (0.79 vs. 0.78) as well as specificity (0.77 vs. 0.79) compared to those did not use (n=6). Four studies that considered histopathology or follow-up imaging as a reference had higher specificity (0.91 vs. 0.72) and equivalent sensitivity (0.82 vs. 0.83) than studies (n=3) using only histopathology. The corresponding forest plots for sensitivity and specificity are delineated in Figures S1–S4.
As shown in Table S6, we can hardly identify significant changes in the pooled effect value when eliminating studies one by one. There was no publication bias based on the Deeks’ funnel plot (p=0.77), as presented in Figure 5. Furthermore, the clinical utility was also evaluated using a Fagan plot. Using a CT-based radiomics model would increase the posttest probability to 54% from 20% with a PLR of 5 when the pretest was positive and reduce the posttest probability to 6% with an NLR of 0.25 when the pretest was negative, as depicted in Figure S5.
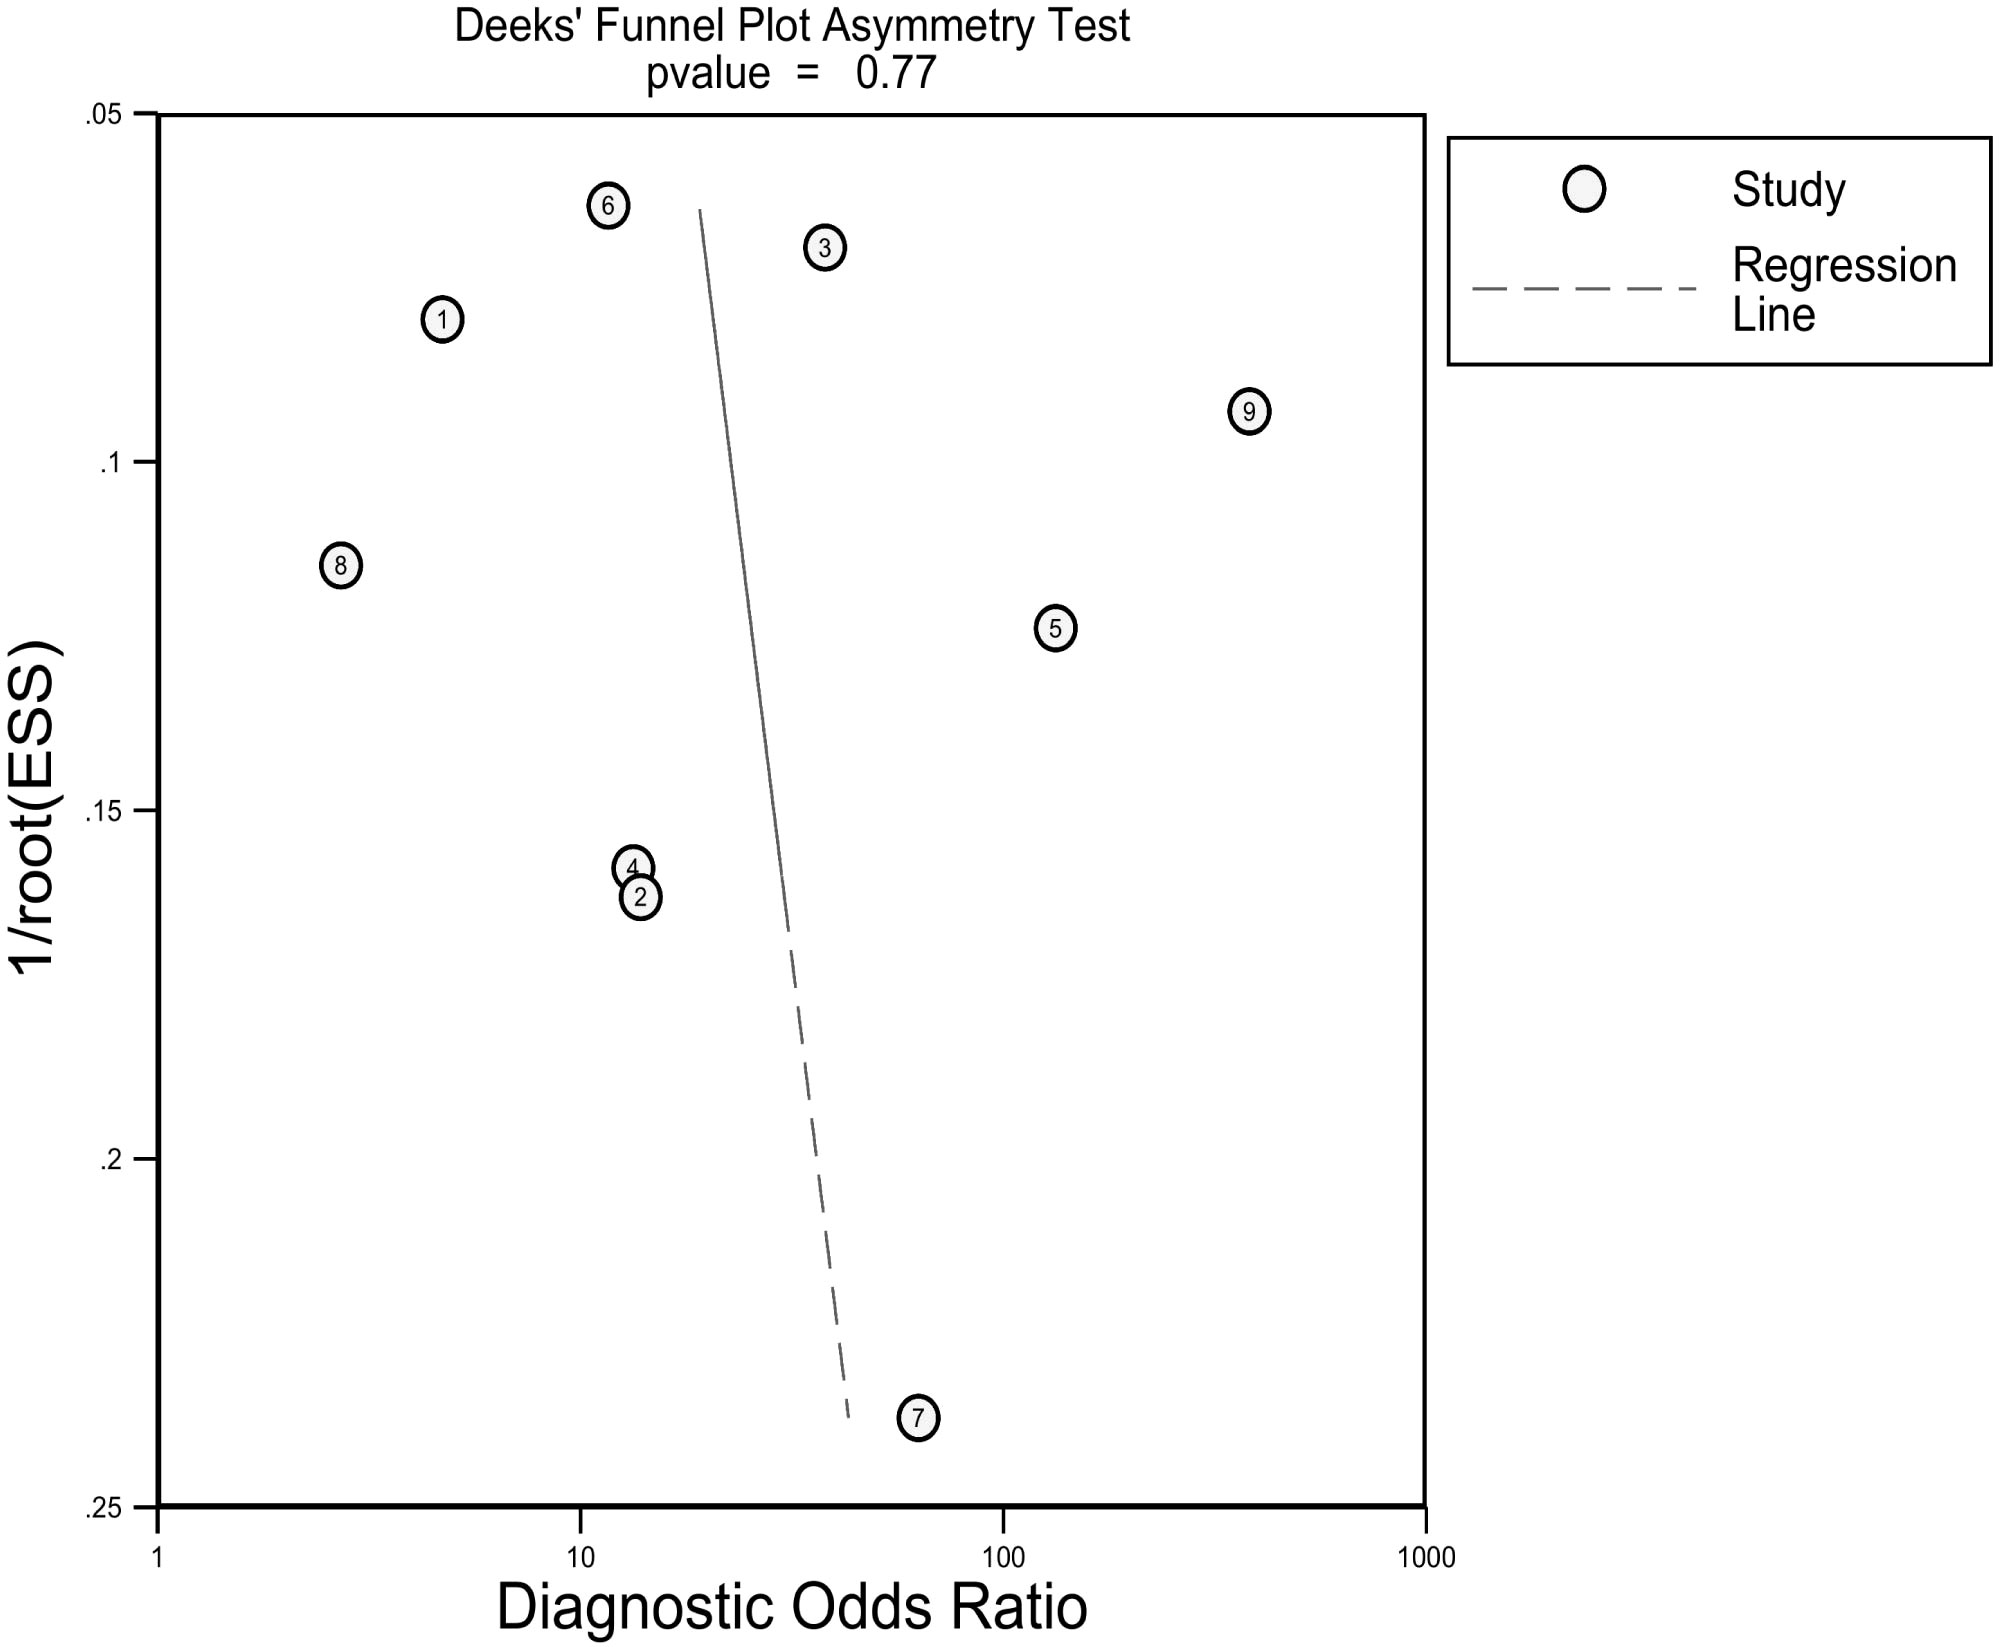
Figure 5 Deeks funnel plot reveals the possibility of publication bias is low with a p value of 0.77. ESS, effective sample size.
Radiomics has recently attracted the attention of oncology researchers, given that it can noninvasively and effectively reflect tumor heterogeneity, treatment response, prognosis, and other information (47–49). Published studies involving radiomics for adrenal tumors mainly focused on the differentiation of benign and malignant tumors and the differentiation of histological types of adrenal masses, but no clinical transformation or practical application has been described so far. Considering that the research of radiomics remains in its infancy, there are a host of problems to be addressed, such as the lack of a robust workflow based on standardized and strict methods to ensure the stability and reliability of the results (50, 51).
It is well-established that the quality of reporting of existing predictive models is poor (52). Lambin et al. proposed a comprehensive and clear standard to evaluate all aspects of predictive models in the field of radiomics to enhance their qualities (18). In our systematic review, the overall quality was relatively low (mean RQS of 5.11, ranging from -5 to 25). The primary causes impacting the RQS score included the absence of feature reduction, scarcity of open science and source, deficiency in internal or external validation and prospective data support, minimal consideration of cost-effectiveness, and so on. Reducing features that are poorly reproducible is crucial for reducing the risk of overfitting when the number of radiomics features exceeds the number of patients (53). 43% of studies did not conduct feature reduction or adjustment in our review owing to specific diagnostic algorithms or processing, which may partially undermine the stability of the models. Following internal and external validation, the diagnostic performance of the model can be confirmed. Furthermore, the practical application of radiomics in clinical practice also requires multi-center validation and prospective testing (54, 55). Regrettably, over half of the included studies failed to process validation attributable to the limited sample size. Most of the remaining studies merely conducted internal validation in a single center. Furthermore, only one study performed validation with multiple data sets and tested prospectively (15). Furthermore, comparing the diagnostic performance with the radiologist is also a pivotal step in verifying the performance of the model. Because only when the diagnostic effect is better than that of the radiologist can the superiority of radiomics be demonstrated. However, most studies did not compare the diagnostic performance with a radiologist. The choice of scanner manufacturer and model, 2D or 3D segmentation of the region of interest, acquisition, and reconstruction parameters all lead to the heterogeneity of imaging data. Most studies (25/28) provided image acquisition parameters in our review, but values varied considerably. Zwanenburg et al. designed the Image Biomarker Standardization Initiative (IBSI) to enhance the reproducibility of radiomics research, including establishing general feature naming, definition, general radiological image processing scheme, and so on (56). Thus, open science and the source of radiomics is the premise to realizing reproducibility. In the present review, only three included studies publicly shared segmentations or code. The challenge of open science and validation based on a sufficient sample size may hinder further development and practice of radiomics in the diagnosis of adrenal masses. Besides, the cost-effectiveness analyses of radiomics cannot be overlooked because it may boost the superiority of this technology.
Although radiomics studies differ methodologically from conventional trials, and there may be potential unsuitability of the QUADAS-2 tool, the results that reflected the risk of bias and applicability of included studies is advisable to some extent. The results of QUADAS-2 exposed that the risk of bias needs to be minimized in terms of patient selection, index test, and reference standards. The concerns regarding applicability are excellent except for the reference standard. The reliablity of individual ratings needs to be assessed by inter-rater agreement analysis. In this review, the ICC was applied to describe the inter-rater agreement of RQS and QUADAS-2. The fact that most items achieved substantial or almost perfect agreement while others had moderate agreement demonstrates that the scores accurately reflect the quality of the included studies.
Since there are few pieces of literature included in the meta-analysis, the results should be treated with caution. In our meta-analysis, radiomics technology showed promise for differentiating malignant from benign adrenal tumors, with a pooled sensitivity, specificity, and AUC of 0.8, 0.83, and 0.88, respectively. Nonetheless, it cannot be ignored that there was distinct heterogeneity between the studies. The threshold effect is one of the chief causes of heterogeneity in DTA studies (57). A threshold effect will result in a correlation coefficient between sensitivity and a false positive rate of 0.6 or higher (58). The result of the Spearman correlation coefficient showed no threshold effect in this meta-analysis. Consequently, we attempted to determine the causes of heterogeneity via subgroup analysis. Our results demonstrated that the radiomics group based on unenhanced and contrast-enhanced CT had a higher DOR than studies using contrast-enhanced CT only. This is likely due to the fact that unenhanced CT provides additional features for analysis and bring higher sensitivity. Different levels of radiomics features contain distinct dimensions of information regarding the lesion. First-order statistics features describe the distribution of voxel values without concern for their spatial relationships (11). Second-order statistics, which describe spatial relationships between voxels with similar gray levels within a lesion, can provide a measure of intralesional heterogeneity (11, 59). Higher-order statistics are obtained after imposing filter grids on an image, and the processing can confirm repetitive or non-repetitive patterns, suppress image noise, highlight details, and so on (60). According to our results, studies that only included first-order features had lower sensitivity but higher specificity compared to those that combined second-order or higher-order features. This finding signals that more complex and deeper texture features analyses can improve diagnostic sensitivity while also increasing the false positive rate. Since deeper texture features analyses inevitably yield a large number of unstable and unrepeatable features, advanced features have higher requirements for feature selection and modeling algorithms. Machine learning is a broad term for a class of statistical analysis algorithms that can iteratively improve the predictive performance of a model by “learning” from data (61). Reliable machine-learning approaches can drive the success of radiomic applications in clinical care (62). In our subgroup analysis, studies with machine learning achieved equivalent diagnostic performance to those without. However, the number of studies (n=3) is insufficient to represent the true impact of machine learning. We recommend that further studies be conducted to determine whether machine learning is beneficial to the diagnosis of adrenal tumors using radiomics. Some studies included in this meta-analysis enrolled patients without histopathology results and regarded follow-up imaging as the diagnostic reference (29, 32, 36, 37, 44). On the one hand, these studies may lower selection bias, as potential bias will be generated if studies only include patients who underwent surgeries (those with high suspicion of malignancy are more likely to be operated on). On the other hand, the diagnostic accuracy of this method based on follow-up images remains to be determined. The 2017 American College of Radiology white paper (63) suggests that stability for 1 year or more indicates that uncertain adrenal nodules are benign, whereas enlarged nodules are suspected to be malignant. However, benign tumors can also grow, and the threshold growth rate to consider malignancy remains unknown. Studies that regarded histopathology or follow-up imaging as the reference had higher diagnostic specificity than studies using histopathology only. The reason may be that the true negative ratio was overestimated since some follow-up imaging failed to detect potential malignancies. Additionally, the possibility that heterogeneity was caused by other factors that have not been considered cannot be ruled out.
To the best of our knowledge, there are two previous reviews related to similar topics. One study systematically reviewed the diagnostic accuracy of CT texture analysis in adrenal tumors (64). In another review, Stanzione et al. summarized the application of radiomics in adrenal cross-sectional imaging and assessed the methodological quality by RQS (65). Generally, more comprehensive and in-depth analyses of diagnostic performance of radiomics in adrenal masses were done in our study. First of all, we focused on diagnostic performance of radiomics in various radiological imaging of adrenal tumors. Secondly, RQS and QUADAS-2 of the included studies were independently evaluated by two reviewers. Besides, inter-rater agreement for RQS and QUADAS-2 were also assessed, which can reflect the true quality of the included studies better. In addition to a systematic review of the included studies, we also conducted a meta-analysis investigating the role of CT-based radiomics in differentiating malignant from benign adrenal tumors. Although the heterogeneity was significant, it reflected the diagnostic value of radiomics in differentiating benign and malignant adrenal masses to some extent.
There are several limitations of this review that warrant consideration. To begin, grey literature was not included in this review since it was limited to special circulation channels, which might have led to publication bias. Secondly, the overall quality of the included studies was not optimal (mean RQS 14.2%), which may have partly influenced the quality of the subsequent analysis. Thirdly, it is worthwhile mentioning the heterogeneity of studies included in the quantitative synthesis. Except for CT type, CT feature type, machine learning, and diagnostic reference, the heterogeneity may be pertinent to diversity in pathological types, methods of image segmentation and reconstruction, and feature extraction and modeling algorithms. However, because the subgroup distribution was scattered, we were unable to analyze these detailed features. Hence, the results of the quantitative analysis should be interpreted with caution. Fourthly, the diagnostic performance of radiomics between specific adrenal histologic types could not be assessed because of a lack of studies for the same objective. Lastly, given that only a few studies compared the diagnostic performance with a radiologist, the added value of radiomics in comparison to the accuracy of human assessment could not be explored.
In conclusion, we systematically reviewed studies investigating the diagnostic performance of radiomics in adrenal masses and conducted a meta-analysis. Collectively, the results of quantitative synthesis outline the potential benefits of CT-based radiomics in differentiating malignant from benign adrenal tumors. However, the existing limitations of relevant studies, including the lack of validation and prospective tests, the lack of comparison with a radiologist, and the absence of a standardized radiomics process, hinder the further development of radiomics. We postulate that the translational gap between radiomics research and clinical applications in the field of adrenal tumors diagnosis will be overcome in the future by addressing the aforementioned shortcomings.
The original contributions presented in the study are included in the article/Supplementary Material, further inquiries can be directed to the corresponding author.
Conceptualization and methodology: HZ and HL. Data analysis, drafting and revising: HZ, HL, and JP. Writing, editing, and revision of manuscript: HZ. Supervision, review, project administration and funding acquisition: JP. All authors contributed to the article and approved the submitted version.
This work was supported by Sanming Project of Medicine in Shenzhen (00101100032).
The authors declare that the research was conducted in the absence of any commercial or financial relationships that could be construed as a potential conflict of interest.
All claims expressed in this article are solely those of the authors and do not necessarily represent those of their affiliated organizations, or those of the publisher, the editors and the reviewers. Any product that may be evaluated in this article, or claim that may be made by its manufacturer, is not guaranteed or endorsed by the publisher.
The Supplementary Material for this article can be found online at: https://www.frontiersin.org/articles/10.3389/fonc.2022.975183/full#supplementary-material
1. Song JH, Chaudhry FS, Mayo-Smith WW. The incidental adrenal mass on CT: Prevalence of adrenal disease in 1,049 consecutive adrenal masses in patients with no known malignancy. Am J Roentgenol (2008) 190:1163–8. doi: 10.2214/AJR.07.2799
2. Beltsevich D, Troshina E, Melnichenko G, Platonova N, Ladygina D, Chevais A. Draft of the clinical practice guidelines “Adrenal incidentaloma”. Endo Serg (2022) 15(1):4–26. doi: 10.14341/serg12712
3. Elsayes KM, Elmohr MM, Javadi S, Menias CO, Remer EM, Morani AC, et al. Mimics, pitfalls, and misdiagnoses of adrenal masses on CT and MRI. Abdom Radiol (2020) 45:982–1000. doi: 10.1007/s00261-019-02082-4
4. Anagnostis P, Karagiannis A, Tziomalos K, Kakafika AI, Athyros VG, Mikhailidis DP. Adrenal incidentaloma: a diagnostic challenge. Hormones (Athens) (2009) 8:163–84. doi: 10.14310/horm.2002.1233
5. Johnson PT, Horton KM, Fishman EK. Adrenal mass imaging with multidetector CT: pathologic conditions, pearls, and pitfalls. Radiographics (2009) 29:1333–51. doi: 10.1148/rg.295095027
6. Park SY, Park BK, Park JJ, Kim CK. CT sensitivities for large (≥3 cm) adrenal adenoma and cortical carcinoma. Abdom Imaging (2015) 40:310–7. doi: 10.1007/s00261-014-0202-1
7. Pandharipande PV, Herts BR, Gore RM, Mayo-Smith WW, Harvey HB, Megibow AJ, et al. Rethinking normal: Benefits and risks of not reporting harmless incidental findings. J Am Coll Radiol (2016) 13:764–7. doi: 10.1016/j.jacr.2016.03.017
8. Gillies RJ, Kinahan PE, Hricak H. Radiomics: Images are more than pictures, they are data. Radiology (2016) 278:563–77. doi: 10.1148/radiol.2015151169
9. Lambin P, Rios-Velazquez E, Leijenaar R, Carvalho S, van Stiphout RGPM, Granton P, et al. Radiomics: extracting more information from medical images using advanced feature analysis. Eur J Cancer (2012) 48:441–6. doi: 10.1016/j.ejca.2011.11.036
10. Ding H, Wu C, Liao N, Zhan Q, Sun W, Huang Y, et al. Radiomics in oncology: A 10-year bibliometric analysis. Front Oncol (2021) 11:689802. doi: 10.3389/fonc.2021.689802
11. Incoronato M, Aiello M, Infante T, Cavaliere C, Grimaldi AM, Mirabelli P, et al. Radiogenomic analysis of oncological data: A technical survey. Int J Mol Sci (2017) 18:1–28. doi: 10.3390/ijms18040805
12. Gatenby RA, Grove O, Gillies RJ. Quantitative imaging in cancer evolution and ecology. Radiology (2013) 269:8–15. doi: 10.1148/radiol.13122697
13. Nakajo M, Jinguji M, Nakajo M, Shinaji T, Nakabeppu Y, Fukukura Y, et al. Texture analysis of FDG PET/CT for differentiating between FDG-avid benign and metastatic adrenal tumors: efficacy of combining SUV and texture parameters. Abdom Radiol (New York) (2017) 42:2882–9. doi: 10.1007/s00261-017-1207-3
14. Andersen MB, Bodtger U, Andersen IR, Thorup KS, Ganeshan B, Rasmussen F. Metastases or benign adrenal lesions in patients with histopathological verification of lung cancer: Can CT texture analysis distinguish? Eur J Radiol (2021) 138:109664. doi: 10.1016/j.ejrad.2021.109664
15. Kong J, Zheng J, Wu J, Wu S, Cai J, Diao X, et al. Development of a radiomics model to diagnose pheochromocytoma preoperatively: a multicenter study with prospective validation. J Transl Med (2022) 20:31. doi: 10.1186/s12967-022-03233-w
16. Cumpston M, Li T, Page MJ, Chandler J, Welch VA, Higgins JP, et al. Updated guidance for trusted systematic reviews: a new edition of the cochrane handbook for systematic reviews of interventions. Cochrane Database Syst Rev (2019) 10:ED000142. doi: 10.1002/14651858.ED000142
17. McInnes MDF, Moher D, Thombs BD, McGrath TA, Bossuyt PM, Clifford T, et al. Preferred reporting items for a systematic review and meta-analysis of diagnostic test accuracy studies the PRISMA-DTA statement. JAMA - J Am Med Assoc (2018) 319:388–96. doi: 10.1001/jama.2017.19163
18. Lambin P, Leijenaar RTH, Deist TM, Peerlings J, De Jong EEC, Van Timmeren J, et al. Radiomics: The bridge between medical imaging and personalized medicine. Nat Rev Clin Oncol (2017) 14:749–62. doi: 10.1038/nrclinonc.2017.141
19. Reitsma JB, Leeflang MMG, Sterne JAC, Bossuyt PMM, Whiting PF, Rutjes AWSS, et al. QUADAS-2: a revised tool for the quality assessment of diagnostic accuracy studies. Ann Intern Med (2011) 155:529–36. doi: 10.7326/0003-4819-155-8-201110180-00009
20. Higgins JPT, Thompson SG, Deeks JJ, Altman DG. Measuring inconsistency in meta-analyses. BMJ (2003) 327:557–60. doi: 10.1136/bmj.327.7414.557
21. Hellmich M, Lehmacher W. A ruler for interpreting diagnostic test results. Methods Inf Med (2005) 44:124–6. doi: 10.1055/s-0038-1633930
22. Chai H, Guo Y, Wang Y, Zhou G. Automatic computer aided analysis algorithms and system for adrenal tumors on CT images. Technol Heal Care (2017) 25:1105–18. doi: 10.3233/THC-160597
23. Elmohr MM, Fuentes D, Habra MA, Bhosale PR, Qayyum AA, Gates E, et al. Machine learning-based texture analysis for differentiation of large adrenal cortical tumours on CT. Clin Radiol (2019) 74:818.e1–7. doi: 10.1016/j.crad.2019.06.021
24. Ho LM, Samei E, Mazurowski MA, Zheng Y, Allen BC, Nelson RC, et al. Can texture analysis be used to distinguish benign from malignant adrenal nodules on unenhanced CT, contrast-enhanced CT, or in-phase and opposed-phase MRI? AJR Am J Roentgenol (2019) 212:554–61. doi: 10.2214/AJR.18.20097
25. Koyuncu H, Ceylan R, Asoglu S, Cebeci H, Koplay M. An extensive study for binary characterisation of adrenal tumours. Med Biol Eng Comput (2019) 57:849–62. doi: 10.1007/s11517-018-1923-z
26. Li X, Guindani M, Ng CS, Hobbs BP. Spatial Bayesian modeling of GLCM with application to malignant lesion characterization. J Appl Stat (2018) 46:230–46. doi: 10.1080/02664763.2018.1473348
27. Liu J, Xue K, Li S, Zhang Y, Cheng J. Combined diagnosis of whole-lesion histogram analysis of T1- and T2-weighted imaging for differentiating adrenal adenoma and pheochromocytoma: A support vector machine-based study. Can Assoc Radiol J = J l’Association Can Des Radiol (2021) 72:452–9. doi: 10.1177/0846537120911736
28. Moawad AW, Ahmed A, Fuentes DT, Hazle JD, Habra MA, Elsayes KM. Machine learning-based texture analysis for differentiation of radiologically indeterminate small adrenal tumors on adrenal protocol CT scans. Abdom Radiol (New York) (2021) 46:4853–63. doi: 10.1007/s00261-021-03136-2
29. Rocha TO, Albuquerque TC, Nather JCJ, Salmon CEG, Tucci SJ, Wang JZ, et al. Histogram analysis of adrenal lesions with a single measurement for 10th percentile: Feasibility and incremental value for diagnosing adenomas. AJR Am J Roentgenol (2018) 211:1227–33. doi: 10.2214/AJR.17.19159
30. Romeo V, Maurea S, Cuocolo R, Petretta M, Mainenti PP, Verde F, et al. Characterization of adrenal lesions on unenhanced MRI using texture analysis: A machine-learning approach. J Magn Reson Imaging (2018) 48:198–204. doi: 10.1002/jmri.25954
31. Schieda N, Krishna S, McInnes MDF, Moosavi B, Alrashed A, Moreland R, et al. Utility of MRI to differentiate clear cell renal cell carcinoma adrenal metastases from adrenal adenomas. AJR Am J Roentgenol (2017) 209:W152–9. doi: 10.2214/AJR.16.17649
32. Shi B, Zhang G-M-Y, Xu M, Jin Z-Y, Sun H. Distinguishing metastases from benign adrenal masses: what can CT texture analysis do? Acta Radiol (2019) 60:1553–61. doi: 10.1177/0284185119830292
33. Shoemaker K, Hobbs BP, Bharath K, Ng CS, Baladandayuthapani V. Tree-based methods for characterizing tumor density heterogeneity. Pac Symp Biocomput (2018) 23:216–27. doi: 10.1142/9789813235533_0020
34. Stanzione A, Cuocolo R, Verde F, Galatola R, Romeo V, Mainenti PP, et al. Handcrafted MRI radiomics and machine learning: Classification of indeterminate solid adrenal lesions. Magn Reson Imaging (2021) 79:52–8. doi: 10.1016/j.mri.2021.03.009
35. Szász P, Kučera P, Čtvrtlík F, Langová K, Hartmann I, Tüdös Z, et al. Diagnostic value of unenhanced CT attenuation and CT histogram analysis in differential diagnosis of adrenal tumors. Medicina-Lithuania (2020) 56(11):597. doi: 10.3390/medicina56110597
36. Torresan F, Crimì F, Ceccato F, Zavan F, Barbot M, Lacognata C, et al. Radiomics: a new tool to differentiate adrenocortical adenoma from carcinoma. BJS Open (2021) 5(1):zraa061. doi: 10.1093/bjsopen/zraa061
37. Tu W, Verma R, Krishna S, McInnes MDF, Flood TA, Schieda N. Can adrenal adenomas be differentiated from adrenal metastases at single-phase contrast-enhanced CT? AJR Am J Roentgenol (2018) 211:1044–50. doi: 10.2214/AJR.17.19276
38. Tu W, Abreu-Gomez J, Udare A, Alrashed A, Schieda N. Utility of T2-weighted MRI to differentiate adrenal metastases from lipid-poor adrenal adenomas. Radiol Imaging Cancer (2020) 2:e200011. doi: 10.1148/rycan.2020200011
39. Tüdös Z, Kučera P, Szász P, Hartmann I, Langová K, Škarda J, et al. Influence of slice thickness on result of CT histogram analysis in indeterminate adrenal masses. Abdom Radiol (New York) (2019) 44:1461–9. doi: 10.1007/s00261-018-1835-2
40. Umanodan T, Fukukura Y, Kumagae Y, Shindo T, Nakajo M, Takumi K, et al. ADC Histogram analysis for adrenal tumor histogram analysis of apparent diffusion coefficient in differentiating adrenal adenoma from pheochromocytoma. J Magn Reson Imaging (2017) 45:1195–203. doi: 10.1002/jmri.25452
41. Wu ZJ, Clark TJ, Hippe DS, Soloff EV, Zhang M, Hsu L, et al. Comparison of histogram-based Gaussian analysis with and without noise correction for the characterization of indeterminate adrenal nodules. AJR Am J Roentgenol (2020) 215:896–902. doi: 10.2214/AJR.19.22531
42. Yi X, Guan X, Chen C, Zhang Y, Zhang Z, Li M, et al. Adrenal incidentaloma: machine learning-based quantitative texture analysis of unenhanced CT can effectively differentiate sPHEO from lipid-poor adrenal adenoma. J Cancer (2018) 9:3577–82. doi: 10.7150/jca.26356
43. Yi X, Guan X, Zhang Y, Liu L, Long X, Yin H, et al. Radiomics improves efficiency for differentiating subclinical pheochromocytoma from lipid-poor adenoma: a predictive, preventive and personalized medical approach in adrenal incidentalomas. EPMA J (2018) 9:421–9. doi: 10.1007/s13167-018-0149-3
44. Yu H, Parakh A, Blake M, McDermott S. Texture analysis as a radiomic marker for differentiating benign from malignant adrenal tumors. J Comput Assist Tomogr (2020) 44:766–71. doi: 10.1097/RCT.0000000000001051
45. Zhang G-M-Y, Shi B, Sun H, Jin Z-Y, Xue H-D. Differentiating pheochromocytoma from lipid-poor adrenocortical adenoma by CT texture analysis: feasibility study. Abdom Radiol (New York) (2017) 42:2305–13. doi: 10.1007/s00261-017-1118-3
46. Zheng Y, Liu X, Zhong Y, Lv F, Yang H. A preliminary study for distinguish hormone-secreting functional adrenocortical adenoma subtypes using multiparametric CT radiomics-based machine learning model and nomogram. Front Oncol (2020) 10:570502. doi: 10.3389/fonc.2020.570502
47. Yip SSF, Aerts HJWL. Applications and limitations of radiomics. Phys Med Biol (2016) 61:R150–66. doi: 10.1088/0031-9155/61/13/R150
48. Moon SH, Kim J, Joung J-G, Cha H, Park W-Y, Ahn JS, et al. Correlations between metabolic texture features, genetic heterogeneity, and mutation burden in patients with lung cancer. Eur J Nucl Med Mol Imaging (2019) 46:446–54. doi: 10.1007/s00259-018-4138-5
49. Sala E, Mema E, Himoto Y, Veeraraghavan H, Brenton JD, Snyder A, et al. Unravelling tumour heterogeneity using next-generation imaging: radiomics, radiogenomics, and habitat imaging. Clin Radiol (2017) 72:3–10. doi: 10.1016/j.crad.2016.09.013
50. van Timmeren JE, Cester D, Tanadini-Lang S, Alkadhi H, Baessler B. Radiomics in medical imaging-"how-to" guide and critical reflection. Insights Imaging (2020) 11:91. doi: 10.1186/s13244-020-00887-2
51. Park JE, Kim D, Kim HS, Park SY, Kim JY, Cho SJ, et al. Quality of science and reporting of radiomics in oncologic studies: room for improvement according to radiomics quality score and TRIPOD statement. Eur Radiol (2020) 30:523–36. doi: 10.1007/s00330-019-06360-z
52. Collins GS, Reitsma JB, Altman DG, Moons KGM. Transparent reporting of a multivariable prediction model for individual prognosis or diagnosis (TRIPOD): the TRIPOD statement. BMJ (2015) 350:g7594. doi: 10.1136/bmj.g7594
53. Ursprung S, Beer L, Bruining A, Woitek R, Stewart GD, Gallagher FA, et al. Radiomics of computed tomography and magnetic resonance imaging in renal cell carcinoma-a systematic review and meta-analysis. Eur Radiol (2020) 30:3558–66. doi: 10.1007/s00330-020-06666-3
54. O’Connor JPB, Aboagye EO, Adams JE, Aerts HJWL, Barrington SF, Beer AJ, et al. Imaging biomarker roadmap for cancer studies. Nat Rev Clin Oncol (2017) 14:169–86. doi: 10.1038/nrclinonc.2016.162
55. McShane LM, Altman DG, Sauerbrei W, Taube SE, Gion M, Clark GM. Reporting recommendations for tumor marker prognostic studies (remark). Exp Oncol (2006) 28:99–105. doi: 10.1007/s10549-006-9242-8
56. Zwanenburg A, Vallières M, Abdalah MA, Aerts HJWL, Andrearczyk V, Apte A, et al. The image biomarker standardization initiative: Standardized quantitative radiomics for high-throughput image-based phenotyping. Radiology (2020) 295:328–38. doi: 10.1148/radiol.2020191145
57. Jeong E, Park J, Lee J. Diagnostic test accuracy of the 4AT for delirium detection: A systematic review and meta-analysis. Int J Environ Res Public Health (2020) 17(20):7515. doi: 10.3390/ijerph17207515
58. Devillé WL, Buntinx F, Bouter LM, Montori VM, de Vet HCW, van der Windt DAWM, et al. Conducting systematic reviews of diagnostic studies: didactic guidelines. BMC Med Res Methodol (2002) 2:9. doi: 10.1186/1471-2288-2-9
59. Davnall F, Yip CSP, Ljungqvist G, Selmi M, Ng F, Sanghera B, et al. Assessment of tumor heterogeneity: an emerging imaging tool for clinical practice? Insights Imaging (2012) 3:573–89. doi: 10.1007/s13244-012-0196-6
60. Rizzo S, Botta F, Raimondi S, Origgi D, Fanciullo C, Morganti AG, et al. Radiomics: the facts and the challenges of image analysis. Eur Radiol Exp (2018) 2:36. doi: 10.1186/s41747-018-0068-z
61. Jordan MI, Mitchell TM. Machine learning: Trends, perspectives, and prospects. Science (2015) 349:255–60. doi: 10.1126/science.aaa8415
62. Parmar C, Grossmann P, Bussink J, Lambin P, Aerts HJWL. Machine learning methods for quantitative radiomic biomarkers. Sci Rep (2015) 5:13087. doi: 10.1038/srep13087
63. Mayo-Smith WW, Song JH, Boland GL, Francis IR, Israel GM, Mazzaglia PJ, et al. Management of incidental adrenal masses: A white paper of the ACR incidental findings committee. J Am Coll Radiol (2017) 14:1038–44. doi: 10.1016/j.jacr.2017.05.001
64. Crimì F, Quaia E, Cabrelle G, Zanon C, Pepe A, Regazzo D, et al. Diagnostic accuracy of CT texture analysis in adrenal masses: A systematic review. Int J Mol Sci (2022) 23(2):637. doi: 10.3390/ijms23020637
Keywords: adrenal tumor, radiomics, machine learning, diagnostic performance, radiomics quality score
Citation: Zhang H, Lei H and Pang J (2022) Diagnostic performance of radiomics in adrenal masses: A systematic review and meta-analysis. Front. Oncol. 12:975183. doi: 10.3389/fonc.2022.975183
Received: 22 June 2022; Accepted: 17 August 2022;
Published: 02 September 2022.
Edited by:
Jian Lu, Peking University Third Hospital, ChinaReviewed by:
Arnaldo Stanzione, University of Naples Federico II, ItalyCopyright © 2022 Zhang, Lei and Pang. This is an open-access article distributed under the terms of the Creative Commons Attribution License (CC BY). The use, distribution or reproduction in other forums is permitted, provided the original author(s) and the copyright owner(s) are credited and that the original publication in this journal is cited, in accordance with accepted academic practice. No use, distribution or reproduction is permitted which does not comply with these terms.
*Correspondence: Jun Pang, cGFuZ2p1bjJAbWFpbC5zeXN1LmVkdS5jbg==
Disclaimer: All claims expressed in this article are solely those of the authors and do not necessarily represent those of their affiliated organizations, or those of the publisher, the editors and the reviewers. Any product that may be evaluated in this article or claim that may be made by its manufacturer is not guaranteed or endorsed by the publisher.
Research integrity at Frontiers
Learn more about the work of our research integrity team to safeguard the quality of each article we publish.