 Guyue Hu1*
 Katharina Niepel1
 Franka Risch2
 Christopher Kurz3Matthias Würl1Thomas Kröncke2Florian Schwarz2,4†
 Katia Parodi1†
 Guillaume Landry1,3,5†
- 1Department of Medical Physics, Faculty of Physics, Ludwig-Maximilians-Universität München (LMU), Garching bei München, Germany
- 2Department of Diagnostic and Interventional Radiology, Universitätsklinikum Augsburg, Augsburg, Germany
- 3Department of Radiation Oncology, LMU Klinikum, Munich, Germany
- 4Medical Faculty, Ludwig-Maximilians-Universität München, Munich, Germany
- 5German Cancer Consortium (DKTK), Partner Site Munich, Munich, Germany
As one of the latest developments in X-ray computed tomography (CT), photon-counting technology allows spectral detection, demonstrating considerable advantages as compared to conventional CT. In this study, we investigated the use of a first-generation clinical photon-counting computed tomography (PCCT) scanner and estimated proton relative (to water) stopping power (RSP) of tissue-equivalent materials from virtual monoenergetic reconstructions provided by the scanner. A set of calibration and evaluation tissue-equivalent inserts were scanned at 120 kVp. Maps of relative electron density (RED) and effective atomic number (EAN) were estimated from the reconstructed virtual monoenergetic images (VMI) using an approach previously applied to a spectral CT scanner with dual-layer detector technology, which allows direct calculation of RSP using the Bethe-Bloch formula. The accuracy of RED, EAN, and RSP was evaluated by root-mean-square errors (RMSE) averaged over the phantom inserts. The reference RSP values were obtained experimentally using a water column in an ion beam. For RED and EAN, the reference values were calculated based on the mass density and the chemical composition of the inserts. Different combinations of low- and high-energy VMIs were investigated in this study, ranging from 40 to 190 keV. The overall lowest error was achieved using VMIs at 60 and 180 keV, with an RSP accuracy of 1.27% and 0.71% for the calibration and the evaluation phantom, respectively.
1 Introduction
Proton therapy allows for a highly conformal dose to the tumor region, sparing the surrounding healthy tissue (1). On the other hand, it requires accurate prediction of proton range, which is typically determined by the proton relative (to water) stopping power (RSP). In current clinical practice, RSP is estimated using single-energy X-ray computed tomography (CT) by conversion from CT numbers measured in Hounsfield units (HU). The relations between CT numbers and RSP are not unique, causing uncertainties for the semi-empirical HU-RSP conversion (2). Proton range uncertainties of 3.5% have been reported (3). In contrast, dual-energy CT (DECT), using two different energy spectra, makes it possible to directly estimate the relative electron density (RED) and effective atomic number (EAN) of materials from CT images acquired at different energies, and subsequently calculate the proton RSP. This approach thus potentially reduces RSP estimation errors and range prediction uncertainties (4–8). DECT has recently seen clinical implementation, and has led to the reduction of range uncertainty safety margins to 2% in at least two institutions (9, 10). The technique has also been compared favorably to direct measurement approaches under development such as proton or ion CT (11, 12).
Photon-counting detector technology, in which individual photons are counted in selected energy bins, is one of the latest developments in X-ray CT (13–15). Photon-counting CT (PCCT) datasets allow multi-energy processing beyond what is feasible with DECT. Early work using a prototype PCCT scanner reported that performance was on par with DECT (16). Recently, first-generation clinical PCCT scanners have been clinically introduced. However, these scanners do not yet come with software allowing the extraction of quantitative information used for radiation therapy treatment planning, such as RED, EAN, and RSP, and their performance has not been investigated yet. In this work, we aim at evaluating a first-generation clinical PCCT scanner with an approach relying on the virtual monoenergetic images (VMIs) which can be reconstructed using the standard scanner software and are available to all users. Using these images, RED, EAN, and RSP were derived for two phantoms containing tissue-equivalent inserts and compared to reference values.
2 Materials and methods
2.1 Phantom scans
The measurements were performed on a new clinical PCCT scanner (Siemens NAEOTOM Alpha, Siemens Healthineers, Forchheim, Germany) at a dose level of CTDIvol=40 mGy (measured in a head dosimetry phantom with a diameter of 16 cm) with dose modulation turned off, a collimation width of 144 × 0.4mm, and a pitch of 0.55. A calibration phantom (Ø 150 mm) containing twelve Gammex 467 inserts (Gammex, Inc., Middleton, WI, USA) and an evaluation phantom (Ø 130 mm) containing six CIRS 062M inserts (CIRS, Inc., Norfolk, VA, USA), as listed in Table 1, were scanned at a tube voltage of 120 kVp using a four energy bins mode which are combined to yield two basis images. The four energy thresholds are manufacturer-specified. Subpixels are read out in 2×2 groups for this mode (17). The clinical scanner software does not allow direct access to the reconstructed basis images used in Taasti et al. (16) for RSP estimation. We thus made use of VMIs which are easily accessible. VMIs were reconstructed with the Qr36f kernel at energies ranging from 40 keV to 190 keV in 10 keV increments, resulting in 512×512-pixel images with 0.38 × 0.38mm2 pixel spacing and 1 mm slice thickness.

Table 1 Mass percent elemental composition and mass density of insert materials.
2.2 Conversion of PCCT data
Following the approach adopted by (18), RED (ρe ), EAN (Zeff ), and RSP were converted from PCCT data using the VMIs and the formalism proposed by Saito and Sagara (19) implemented in in-house software. RED, represented by ρe , was derived using results of calibrations with mean CT numbers of Gammex inserts based on each pair of high- and low-energy VMIs, denoted by HUH and HUL (20):
where a , b , and α were obtained by least-squares fitting of ρe of the Gammex inserts to a weighted subtraction of CT numbers from high- and low-energy VMIs.
In order to estimate EAN, denoted by Zeff , the ratio of EAN of Gammex insert materials to that of water was fitted to the reduced CT number and RED (19):
where γL and γ0 were obtained by least-squares fitting. EAN was evaluated by Mayneord’s equation with an exponent m=3.3 (21, 22):
where ωi represents the mass weight of the composing element with an atomic number of Zi and an atomic mass of Ai . The elemental composition of the insert materials are listed in Table 1.
Mean excitation energy I was calibrated against EAN for soft-tissue and bone-tissue inserts, respectively, with a separation point at EAN=8.8 (21):
where Iw=78 eV is the mean excitation energy of water recommended by ICRU report 90 (23, 24); the mean excitation energy of the studied inserts is defined as (21):
Two sets of and were obtained with least-squares fitting for soft-tissue and bone-tissue inserts, respectively.
In this study, we exploited various pairs of monoenergies from the reconstructed VMIs ranging from 40 keV to 190 keV in 10 keV increments. For VMIs at each low energy EL, a sequence of high energies ranging from EL+10 to 190keV was selected, which resulted in 105 different energy pairs. For each high- and low-energy pair, the measured CT numbers were converted to RED, EAN, and mean excitation energy using the obtained fit parameters. RSP of each voxel was calculated from the RED and mean excitation energy by the Bethe-Bloch formula (21):
where me is electron mass, c the speed of light, and β the velocity relative to the speed of light.
2.3 Evaluation of RED, EAN, and RSP accuracy
Mean values of the estimated RED, EAN, and RSP were calculated in a region of interest (ROI) for each insert. For each insert, which has a diameter of 29mm (Gammex) or 30mm (CIRS), a cylindrical ROI covering the central volume of the insert was used, with a margin of 5 pixels (i.e., 1.9mm) excluding voxels at the borders.
In order to evaluate the accuracy of RED, EAN, and RSP, the mean estimated values for the calibration and evaluation inserts were compared to their reference values. The reference RED values were calculated from the mass density ρ of the inserts provided by the manufacturers:
where the denominator is the weighted sum of Z/A for composing elements of water. Equation 3 was used to obtain reference values of EAN. The weighting factors ωi , atomic numbers Zi , atomic masses Ai , and mean excitation energies Ii in equations 3, 5, and 7 used in this work are tabulated in Table 1.
For RSP, the reference values were experimentally assessed through PEAKFINDER (PTW, Freiburg, Germany) water column measurements in a carbon ion beam for all the inserts in this study except the Gammex insert Muscle, as reported in Hudobivnik et al. (25). For RSP accuracy calculations the Muscle insert was thus omitted.
For each high- and low-energy pair, root-mean-square errors (RMSE) of the estimated RED, EAN, and RSP were evaluated for the calibration and the evaluation phantom, respectively, using the following equations:
Here, valueest is the mean estimated value per voxel in a region of interest (ROI) for each insert, valueref the reference value obtained either from manufacturer information (RED and EAN) or water column measurements (RSP); N is the number of inserts of each phantom.
3 Results
From the analyzed 105 energy pairs, we report here the results for the energy pair of 60 keV and 180 keV, which showed the overall best accuracy of EAN and RSP estimation for the calibration Gammex phantom inserts. RED was less sensitive to the choice of energy pair.
3.1 RED, EAN, and RSP accuracy
Figure 1 shows calibration curves from fitting procedures corresponding to equations 1 (Figure 1A), 2 (Figure 1B), and 4 (Figure 1C) using measured CT numbers of Gammex inserts from VMIs at 60 and 180 keV. RED was well fitted with a coefficient of determination R2 = 0.9999. For fitting EAN as plotted in Figure 1B, R2 was 0.9934. The outlier is the LN-300 Lung insert with the largest residuals. The calibration for the conversion of EAN to mean excitation energy yielded R2 = 0.6974 for soft-tissue inserts and R2 = 0.9804 for bone-tissue inserts.
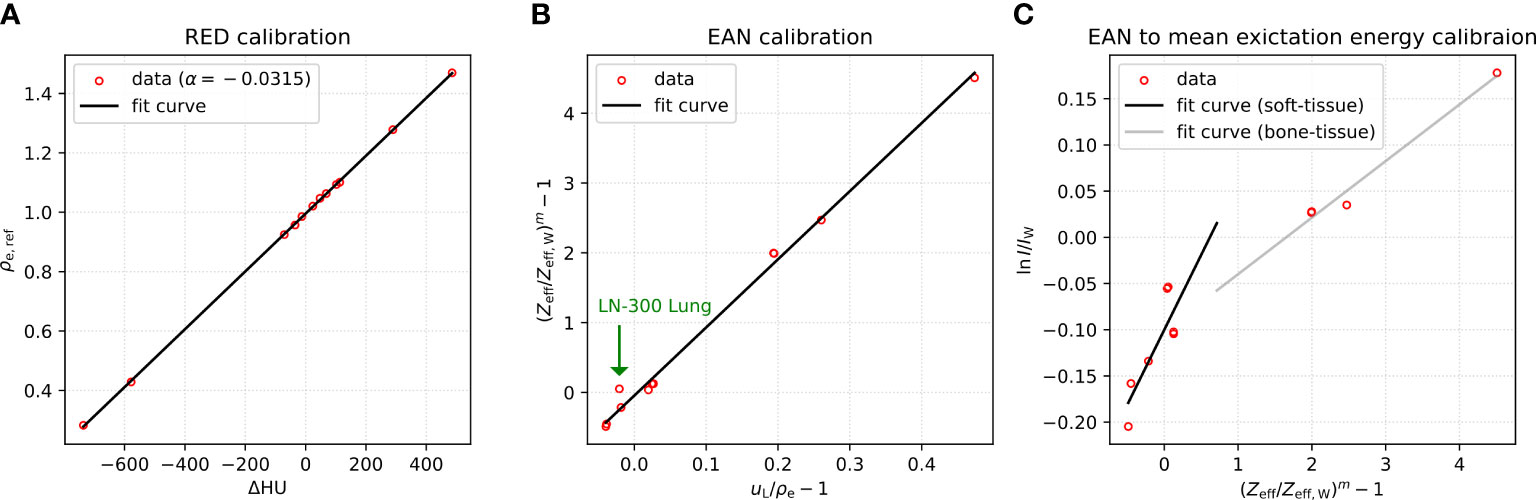
Figure 1 (A) RED calibration, (B) EAN calibration, and (C) EAN to mean excitation energy calibration based on measured CT numbers of Gammex phantom at virtual monoenergies 60 and 180 keV.
The fit parameters obtained are listed in Table 2. Using the acquired fit parameters, the measured CT numbers were converted into RED (Figure 2B), EAN (Figure 2A), and mean excitation energy (Figure 2C) for both the calibration and evaluation phantoms. Figure 2 presents the maps of these quantities, along with RSP (Figure 2D) calculated from RED and mean excitation energy, at three different slices of the CIRS (evaluation) phantom.
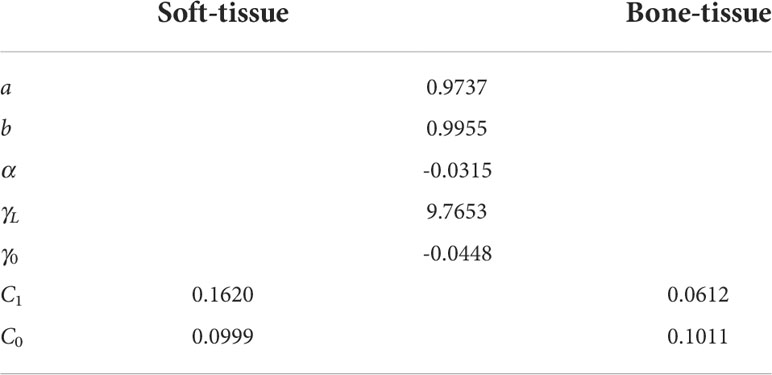
Table 2 Fit parameters obtained using VMIs of Gammex (calibration) phantom at 60 and 180 keV.
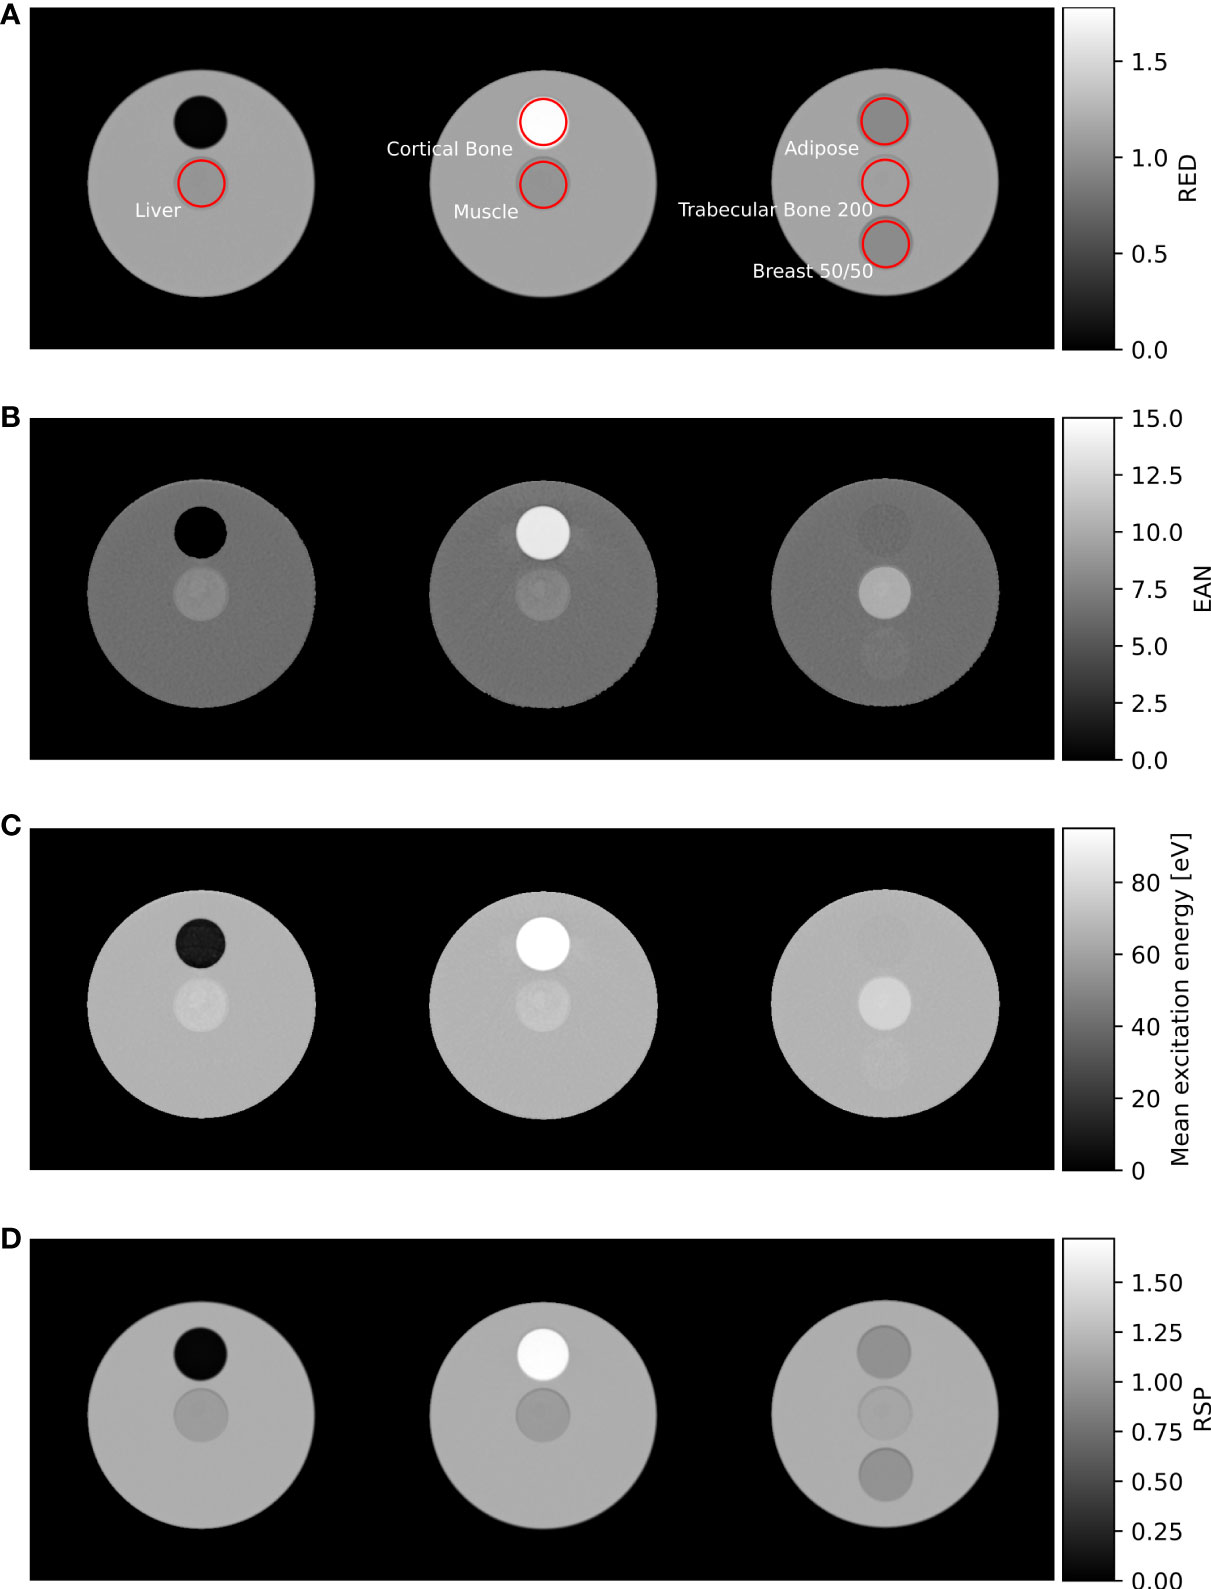
Figure 2 (A) RED, (B) EAN, (C) mean excitation energy, and (D) RSP maps of the CIRS (evaluation) phantom, acquired from VMIs at 60 and 180 keV. Insert ROIs used for data analysis are shown in red.
The residuals of RED, EAN, and RSP evaluated for both calibration and evaluation inserts within the ROIs shown in red in Figure 2A are presented in Figure 3. As shown in the left-most plot (Figure 3A), the estimation of RED demonstrated an accuracy within 0.8% except -1.6% and -4.8% for the two lung inserts. For EAN, an agreement with reference values within 2.8% can be observed for most of the inserts, whereas for Liver (CIRS), LN-300 Lung (Gammex), and BRN-SR2 Brain (Gammex) the errors exceeded 4.4% (see Figure 3B). For RSP, the majority of the inserts had residuals below 1.0%; two inserts, Liver and Muscle (CIRS), exhibited values slightly above 1.0%. The LN-300 Lung insert had the highest error (-3.9%, see Figure 3C).
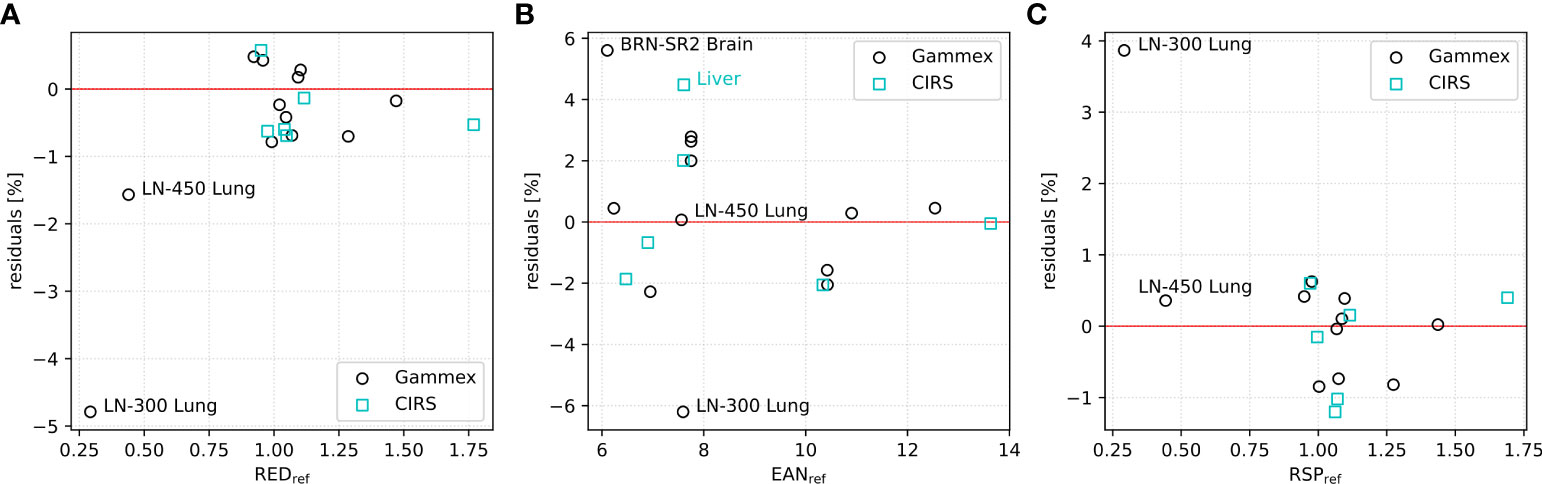
Figure 3 Residuals of mean calculated (A) RED, (B) EAN, and (C) RSP values within insert ROIs for Gammex (calibration, in black) and CIRS (evaluation, in cyan) phantoms using 60 and 180 keV VMIs.
The corresponding RMSEs averaged over phantom inserts are given in Table 3. As the RSP value of the Gammex Muscle insert was not measured (25), the RMSE calculation of RSP for the Gammex (calibration) phantom excluded the Muscle insert. The two lung-mimicking inserts (LN-450 Lung and LN-300 Lung) showed relatively worse results as also observed in previous studies (18, 25, 26). Therefore, the RMSEs for the Gammex phantom were also calculated excluding lung inserts. Additionally, RMSEs of RSP acquired at a state-of-the-art dual-source DECT scanner (SOMATOM Definition FORCE, Siemens Healthineers, Forchheim, Germany) at 150 kVp with Sn filtration and 90 kVp in previous studies (11, 25) are presented in Table 3.
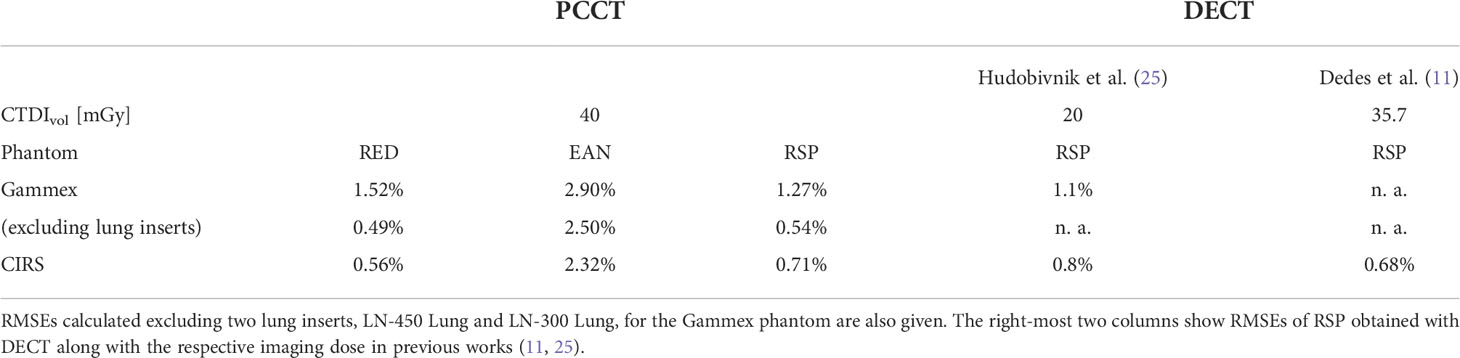
Table 3 RMSEs of RED, EAN, and RSP for the calibration (Gammex) and evaluation (CIRS) phantoms using VMIs at 60 and 180 keV.
Detailed information about measured CT numbers and reference and calculated RED, EAN, and RSP values of the studied inserts are listed in Table 4.
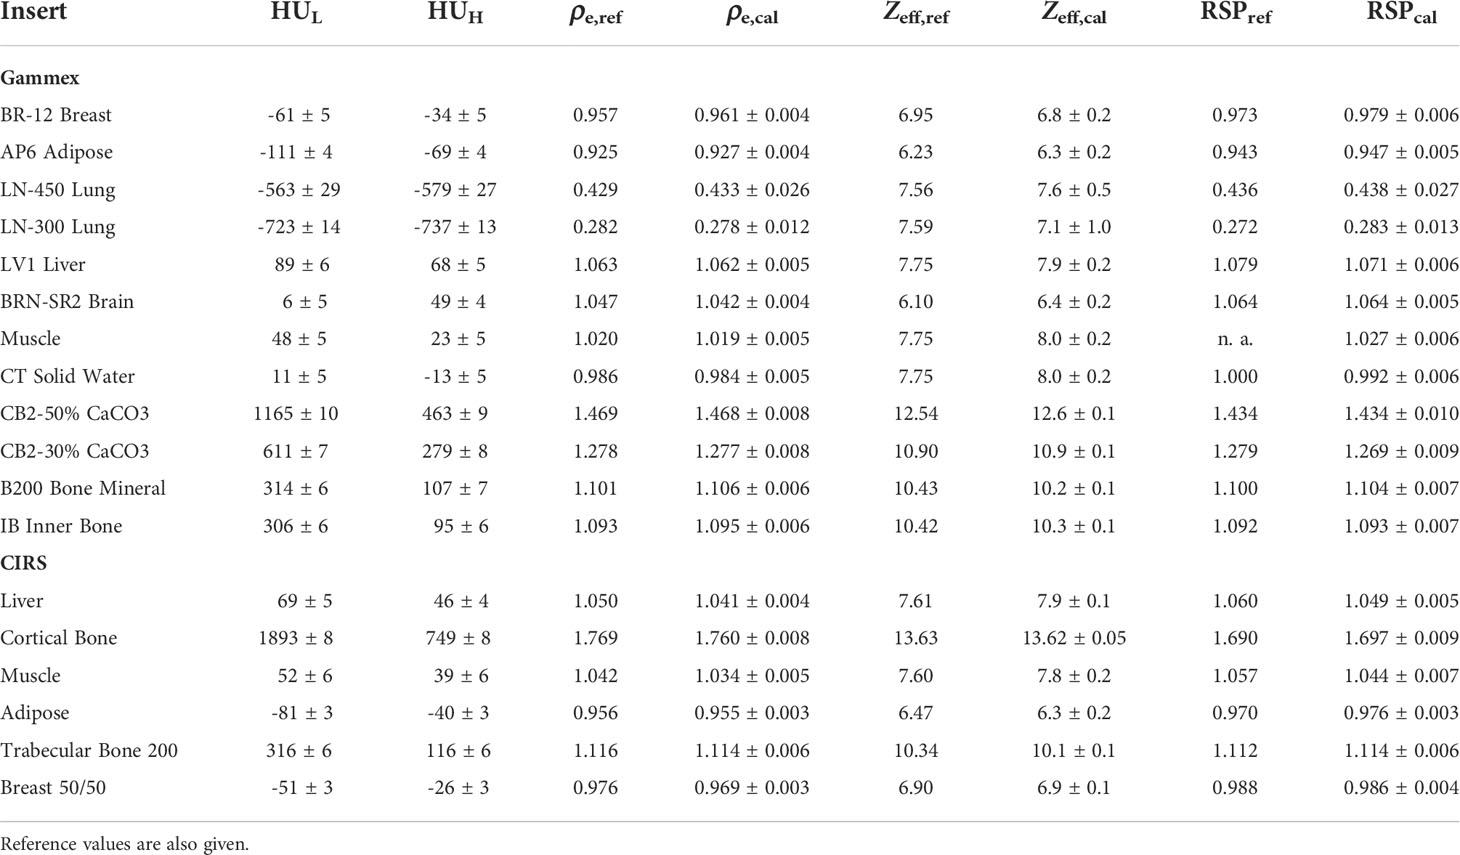
Table 4 Mean and standard deviation of CT numbers for Gammex and CIRS inserts from 60 keV (HUL) and 180 keV (HUH) VMIs, along with the mean and standard deviation of the calculated RED (ρe,cal), EAN (Zeff,cal), and RSP values for all inserts.
3.2 Comparison between different low- and high-energy pairs
Figure 4A shows mean and standard deviation of CT numbers at all the monoenergies for four exemplary evaluation (CIRS) inserts with the highest and the lowest density: Cortical Bone, Muscle, Adipose, and Trabecular Bone 200. The corresponding contrast-to-noise ratios (CNRs) are plotted in Figure 4B.
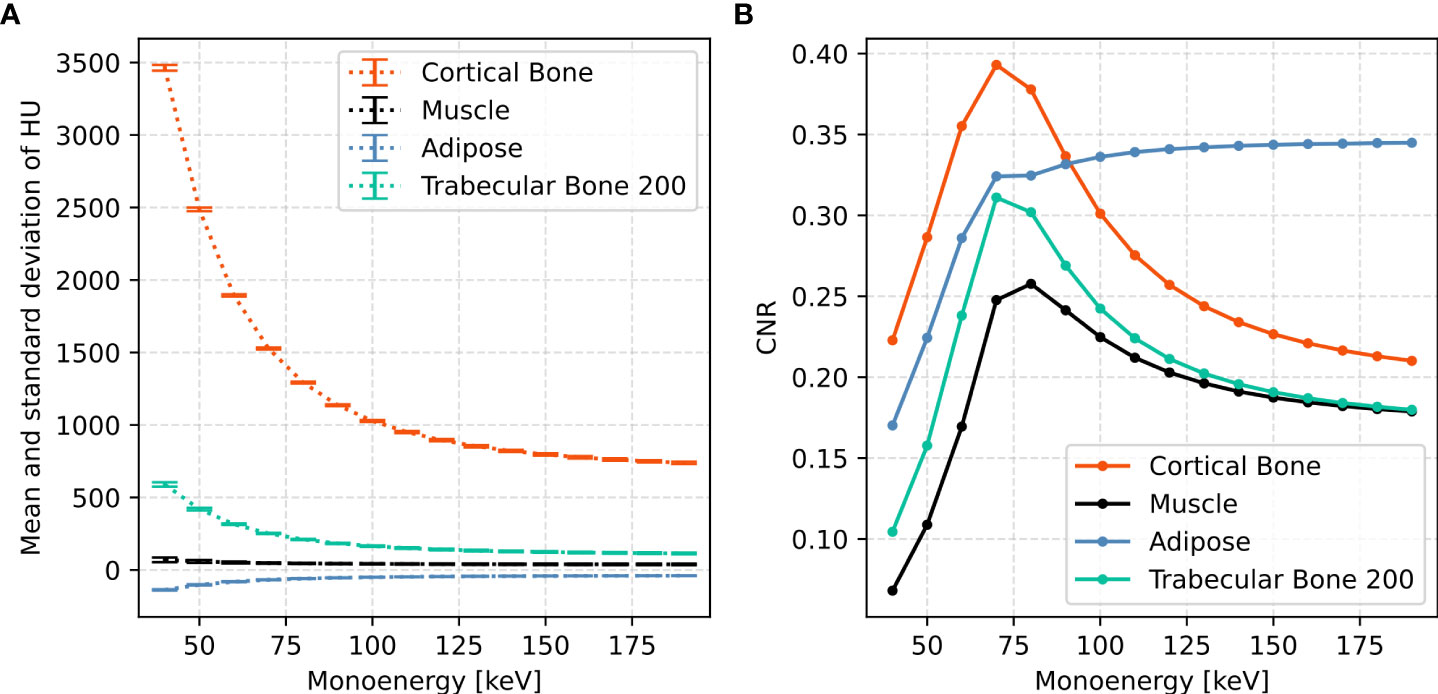
Figure 4 (A) Mean (HUmean ) and standard deviation (HUstd ) of CT numbers and (B) the corresponding CNR at monoenergies ranging from 40 to 190 keV in 10 keV increments for four CIRS inserts: Liver, \textit{Cortical Bone}, Muscle, and Adipose. CNR was calculated by CNR=(HUmean/1000+1)/HUstd.
Regardless of the chosen low- and high-energy pair, the RMSE of RED mostly (102 out of 105 pairs) ranges from 0.55% to 0.56% for the CIRS (evaluation) phantom and from 1.51% to 1.54% for the Gammex (calibration) phantom. The few exceptions with a higher RMSE are listed in Table 5.
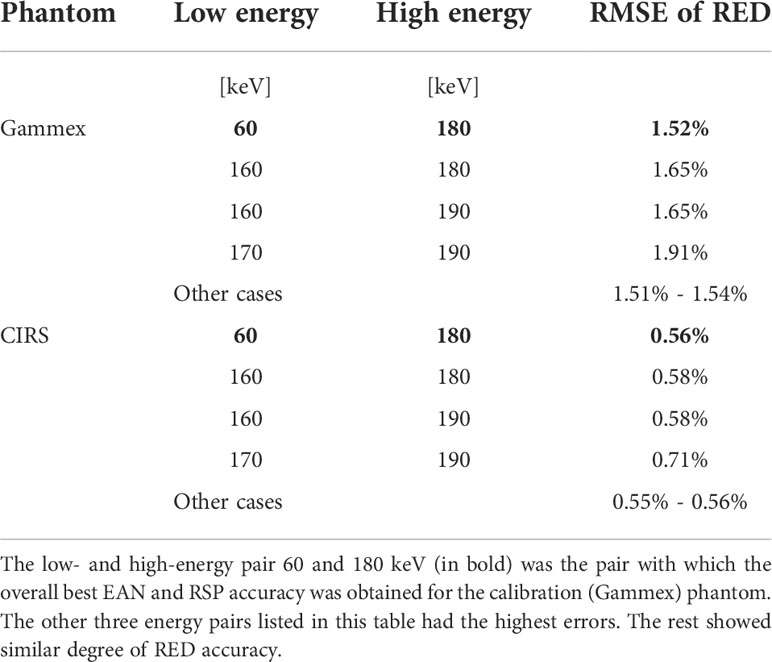
Table 5 RMSEs of RED for different monoenergy pairs.
Figure 5 presents RMSEs of EAN evaluated for both phantoms using different low- and high-energy pairs of VMIs. RMSE values are displayed on a background of different shades of colors corresponding to the value. Similar patterns can be observed for the two phantoms: energy pairs sharing the same low-energy VMIs had nearly the same RMSE, although a minimum could still be identified. Errors of EAN using 40 keV low-energy VMIs were remarkably high, around 90% and 99% for the Gammex and the CIRS phantom, respectively. The low energy 60 keV had the best EAN accuracy, 50 keV the second. The EAN accuracy decreased with an increasing low energy. The lowest error, 2.90% for the Gammex phantom and 2.32% for the CIRS phantom, obtained with 60 and 180 keV VMIs, is marked by a red box in both plots.
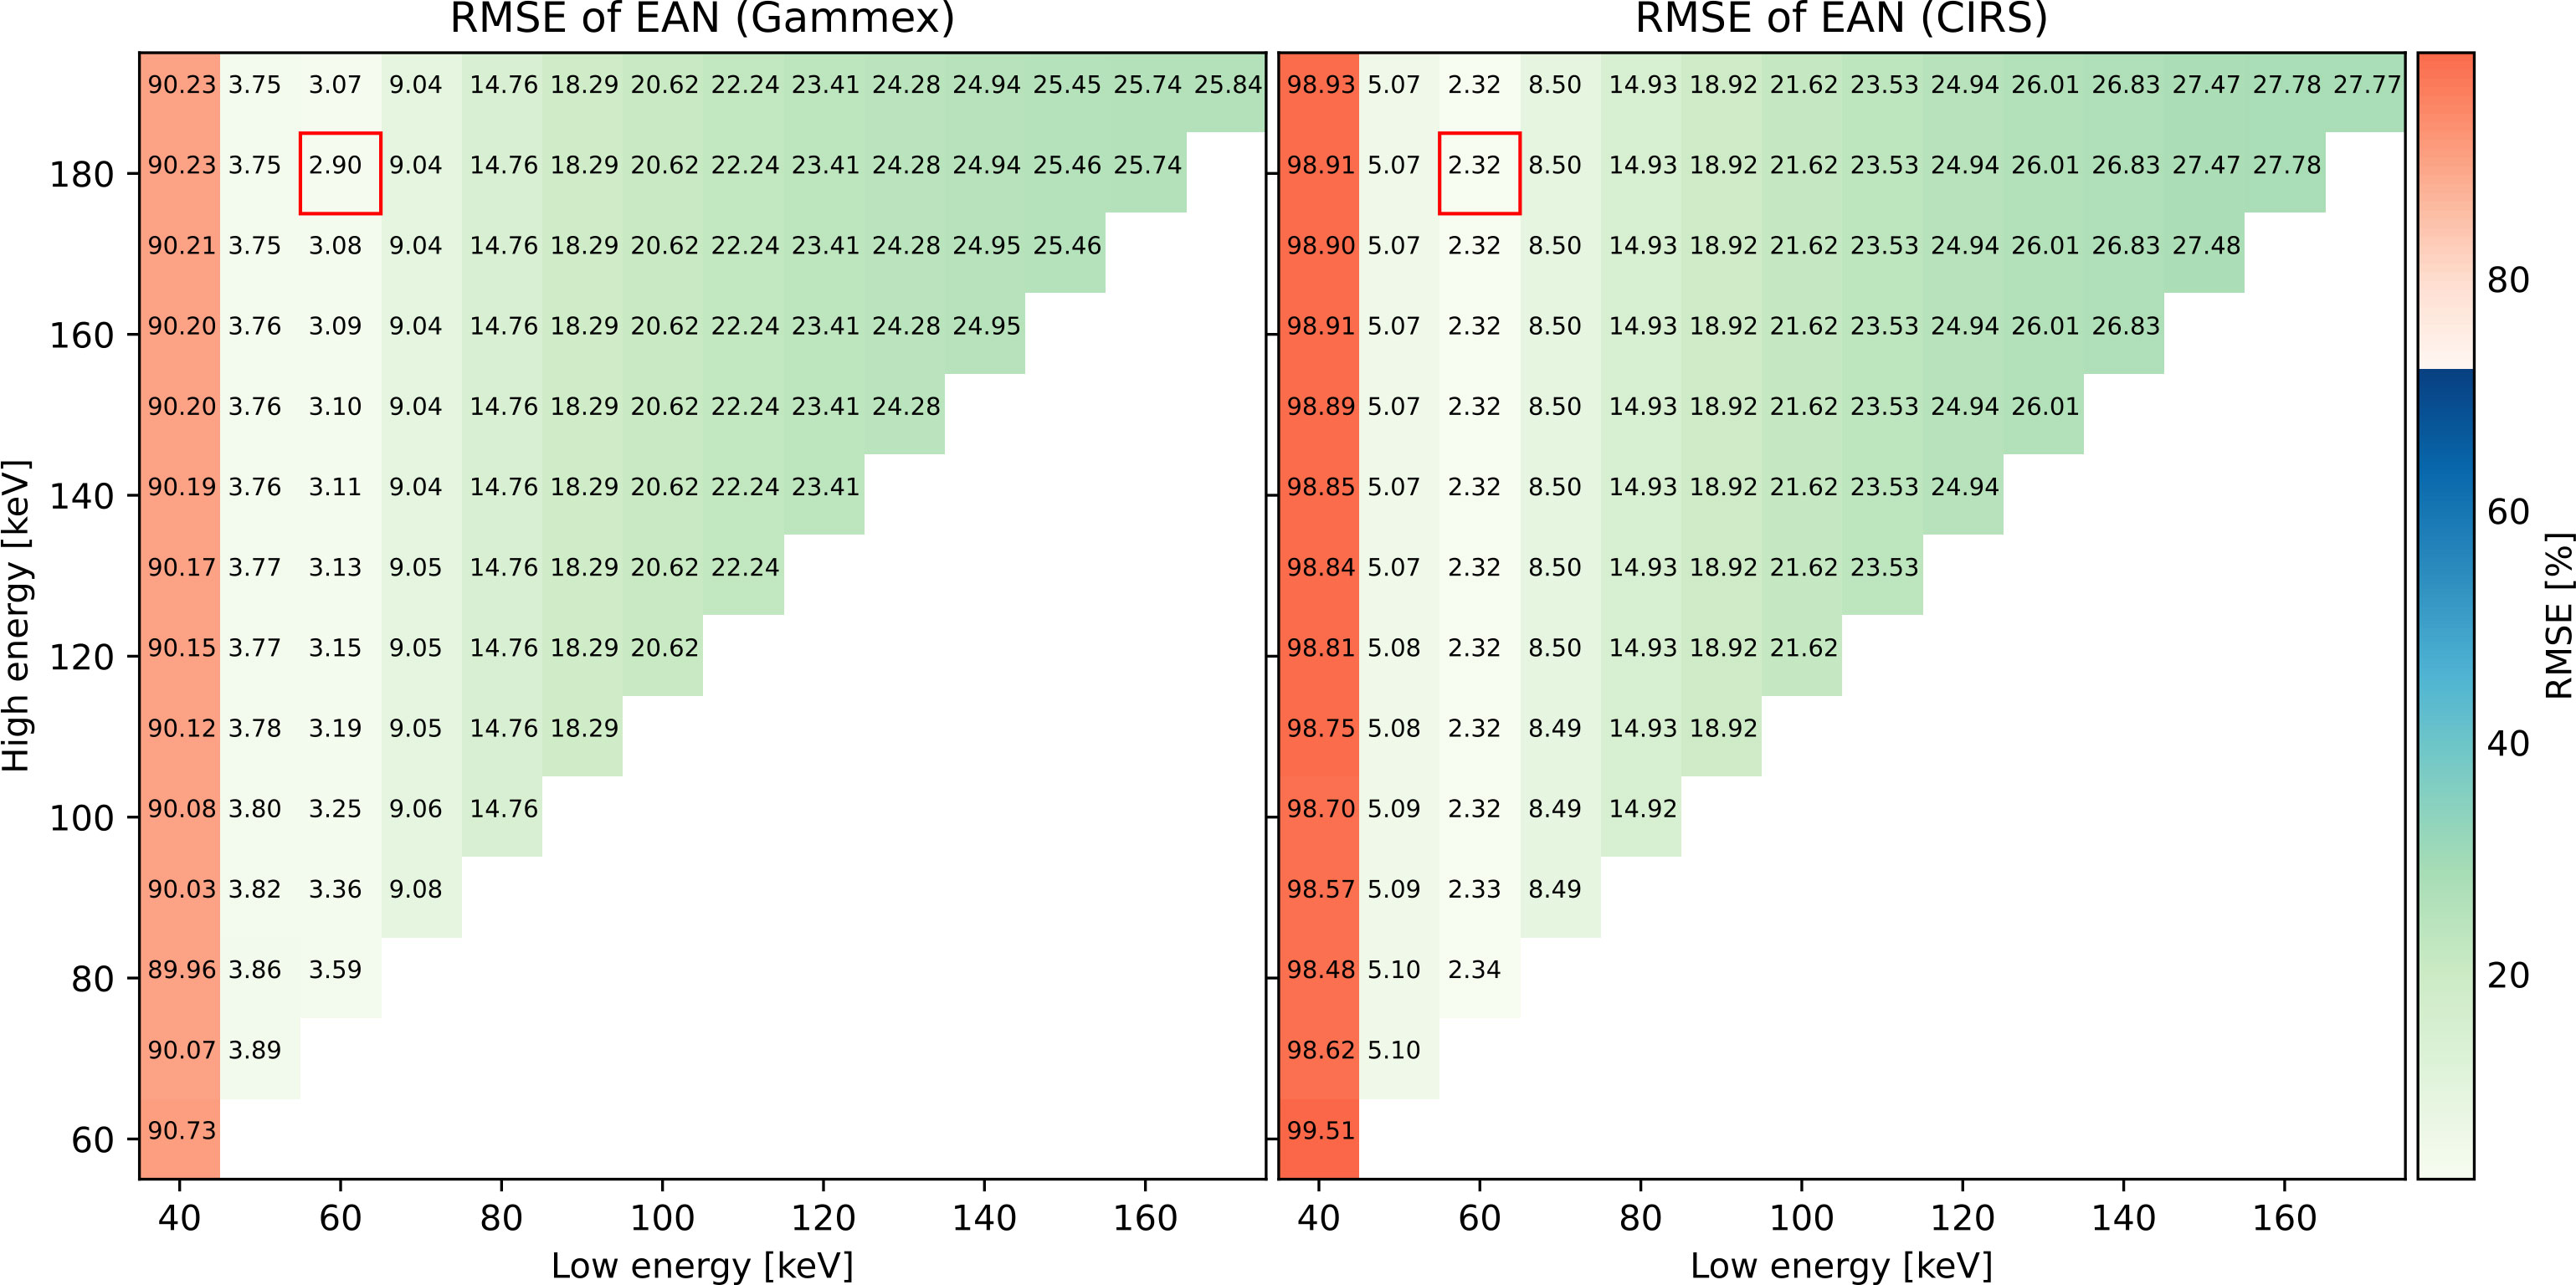
Figure 5 RMSEs of EAN for all the monoenergy pairs.
Like EAN, RMSEs of RSP are shown in Figure 6, and similar trends were observed: For the same low energy, RMSE barely varied despite the different choice of high energy. The RSP accuracy using the optimal energy pair 60 and 180 keV, 1.27% for the Gammex phantom and 0.71% for the CIRS phantom, is marked by a red box in both plots.
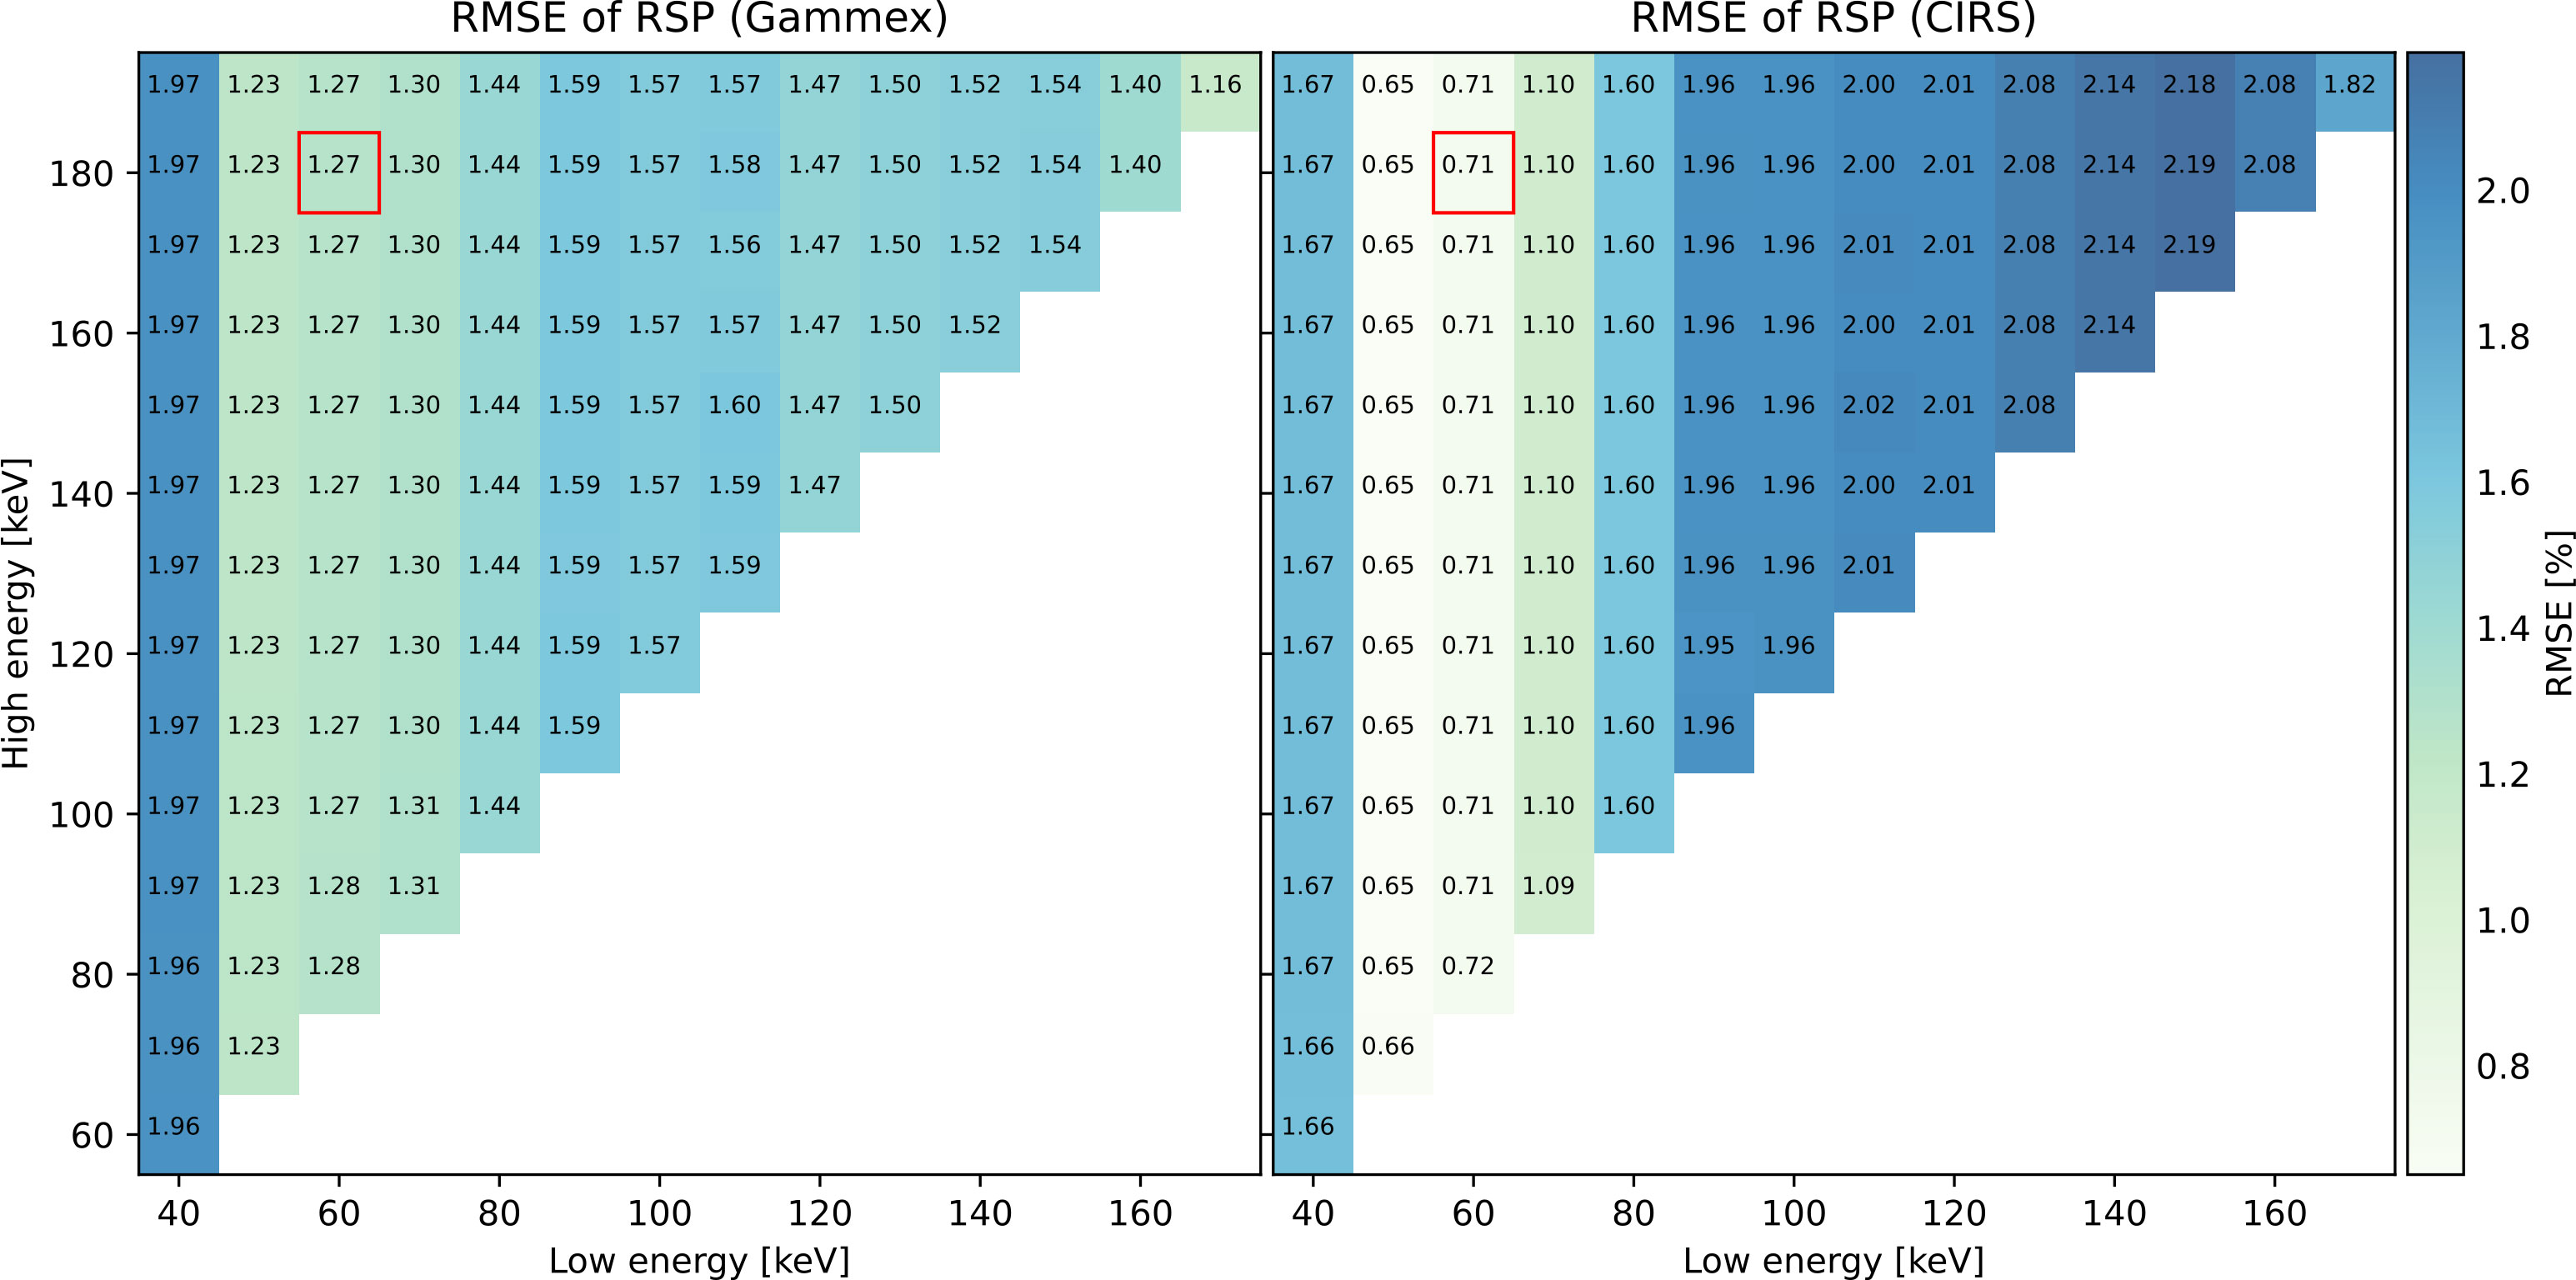
Figure 6 RMSEs of RSP for all the monoenergy pairs.
4 Discussion
The low R2 for soft-tissue inserts was potentially caused by suboptimal tissue equivalence in terms of the relation between Zeff and ln I for the calibration inserts. It was demonstrated in Yang et al. (27) that the fit showed a higher R2 when performed based on tabulated human tissues [see Figure 3 in Yang et al. (27)].
The Gammex phantom showed higher errors (1.52%) than the CIRS phantom (0.56%) in RED estimation due to the relatively high residuals of lung inserts. The RED RMSE for the calibration (Gammex) inserts was reduced to 0.49% when the lung inserts were excluded.
The EAN estimation accuracy was much worse when using 40 keV as the low-energy VMI than when a higher energy was used. This could arise from the dominant photoelectric absorption at lower energies. As a result, EAN calibration curves were less well fitted, leading to higher errors at 40 keV.
In Hudobivnik et al. (25), Gammex and CIRS inserts were scanned at a dual-source DECT scanner, yielding an RSP RMSE of 1.1% for the Gammex phantom and 0.8% for the CIRS phantom. In (11), the RMSE of RSP was 0.68% considering the same CIRS inserts as studied in this work (cf. Table 3). Using PCCT data in this study, comparable accuracy was demonstrated: 1.27% for the Gammex phantom and 0.71% for the CIRS phantom.
Using equation 6, Doolan et al. (28) have shown that the theoretical calculation of RSP using ICRU I-values and manufacturer-provided electron densities and elemental compositions leads to errors of 0.96% compared to measurements of Gammex tissue substitutes [see Table 6 in Doolan et al. (28)]. Uncertainties in the insert composition could affect the accuracy of RSP calculation in Doolan et al. (28) as well.
The optimal pair of VMIs, 60 keV low energy and 180 keV high energy, was determined solely on the basis of the calibration (Gammex) phantom. The use of VMIs to assess RED, EAN, and RSP allows analyzing data without access to the underlying vendor processing software, whereas access to basis images, which were weighted by the scanner software to yield VMIs, would be an alternative to using VMIs. The same formalism as used in this study would be applicable to a pair of basis images.
In this work, two sets of tissue-equivalent materials were used for calibration and evaluation. The same calibration method was used for DECT conversion in Niepel et al. (8), where RSP estimation results in animal tissues have been shown more accurate than in tissue-equivalent materials.
A high dose (CTDIvol=40 mGy ), comparable to previous DECT studies (11), was used in the scans with the intention of observing the performance limits. It would be worth performing tests at lower doses in future studies. The analysis was limited to data acquired at a tube voltage of 120 kVp, a more extensive study with comparison to measurements at 140 kVp tube voltage would be of interest, as well as studying the impact of the number of energy bins and basis images.
The results reported in this work were obtained in the first year of operation of the scanner. Forthcoming studies will address reproducibility assessment and possible improvements due to latest upgrades by the manufacturer, and compare performance to DECT not only in terms of RSP accuracy but also in terms of noise and resolution performance. Additionally, the accuracy of tissue composition estimation compared to DECT will be investigated (29).
5 Conclusion
We performed measurements of tissue-mimicking inserts at a first-generation clinical PCCT scanner and evaluated the accuracy of RSP estimation from VMIs provided by the scanner. The optimal pair of VMIs at 60 and 180 keV energies showed comparable accuracy to that obtained at DECT scanners. The RMSEs of RSP for the calibration and the evaluation phantom were 1.27% (0.54% when lung inserts were excluded) and 0.71%, respectively.
Data availability statement
The mean HU values of the optimal VMI pair necessary to reproduce our results can already be found in Table 4. Requests to access the datasets should be directed to GH, R3V5dWUuSHVAcGh5c2lrLnVuaS1tdWVuY2hlbi5kZQ==; KP, S2F0aWEuUGFyb2RpQHBoeXNpay51bmktbXVlbmNoZW4uZGU=.
Author contributions
GL, KP, FS, and TK contributed to design of the study. CK, GL, and FS were involved in the data acquisition. FR supported the data reconstruction. KN supported the data analysis. GH analyzed the data. GH, KN, KP, GL, CK, and MW critically assessed the results. GH, GL, and KP contributed to the writing. All authors provided feedback to the manuscript. All authors contributed to the article and approved the submitted version.
Funding
This work was funded by the German Research Foundation (DFG) within the Research Training Group GRK 2274 (grant number 299102935).
Acknowledgments
The authors acknowledge Dr. Bernhard Schmidt from Siemens Healthineers for answering questions related to the scanner.
Conflict of interest
FS and University Hospital Augsburg have received speaker honoraria from Siemens Healthineers.
The remaining authors declare that the research was conducted in the absence of any commercial or financial relationships that could be construed as a potential conflict of interest.
Publisher’s note
All claims expressed in this article are solely those of the authors and do not necessarily represent those of their affiliated organizations, or those of the publisher, the editors and the reviewers. Any product that may be evaluated in this article, or claim that may be made by its manufacturer, is not guaranteed or endorsed by the publisher.
References
2. Schneider U, Pedroni E, Lomax A. The calibration of CT hounsfield units for radiotherapy treatment planning. Phys Med Biol (1996) 41:111–24. doi: 10.1088/0031-9155/41/1/009
3. Yang M, Zhu X, Park P, Titt U, Mohan R, Virshup G, et al. Comprehensive analysis of proton range uncertainties related to patient stopping-power-ratio estimation using the stoichiometric calibration. Phys Med Biol (2012) 57:4095–115. doi: 10.1088/0031-9155/57/13/4095
4. Taasti V, Michalak G, Hansen D, Deisher A, Kruse J, Krauss B, et al. Validation of proton stopping power ratio estimation based on dual energy CT using fresh tissue samples. Phys Med Biol (2017) 63:015012. doi: 10.1088/1361-6560/aa952f
5. Taasti V, Muren L, Jensen K, Petersen J, Thygesen J, Tietze A, et al. Comparison of single and dual energy ct for stopping power determination in proton therapy of head and neck cancer. Phys Imaging Radiat Oncol (2018) 6:14–9. doi: 10.1016/j.phro.2018.04.002
6. Möhler C, Wohlfahrt P, Richter C, Greilich S. Range prediction for tissue mixtures based on dual-energy CT. Phys Med Biol (2016) 61:N268–75. doi: 10.1088/0031-9155/61/11/n268
7. Wohlfahrt P, Möhler C, Hietschold V, Menkel S, Greilich S, Krause M, et al. Clinical implementation of dual-energy ct for proton treatment planning on pseudo-monoenergetic ct scans. Int J Radiat Oncol Biol Phys (2017) 97:427–34. doi: 10.1016/j.ijrobp.2016.10.022
8. Niepel K, Stanislawski M, Würl M, Dörringer F, Pinto M, Dietrich O, et al. Animal tissue-based quantitative comparison of dual-energy CT to SPR conversion methods using high-resolution gel dosimetry. Phys Med Biol (2021) 66:075009. doi: 10.1088/1361-6560/abbd14
9. Peters N, Wohlfahrt P, Hofmann C, Möhler C, Menkel S, Tschiche M, et al. Reduction of clinical safety margins in proton therapy enabled by the clinical implementation of dual-energy ct for direct stopping-power prediction. Radiother oncol: J Eur Soc Ther Radiol Oncol (2022) 166:71–8. doi: 10.1016/j.radonc.2021.11.002
10. Kassaee A, Cheng C, Yin L, Zou W, Li T, Lin A, et al. Dual-energy computed tomography proton-dose calculation with scripting and modified hounsfield units. Int J Part Ther (2021) 8:62–72. doi: 10.14338/IJPT-20-00075.1
11. Dedes G, Dickmann J, Niepel K, Wesp P, Johnson RP, Pankuch M, et al. Experimental comparison of proton ct and dual energy x-ray ct for relative stopping power estimation in proton therapy. Phys Med Biol (2019) 64:165002. doi: 10.1088/1361-6560/ab2b72
12. Bär E, Volz L, Collins-Fekete CA, Brons S, Runz A, Schulte R, et al. Experimental comparison of photon versus particle computed tomography to predict tissue relative stopping powers. Med Phys (2022) 49:474–87. doi: 10.1002/mp.15283
13. Willemink M, Persson M, Pourmorteza A, Pelc N, Fleischmann D. Photon-counting ct: Technical principles and clinical prospects. Radiology (2018) 289:293–312. doi: 10.1148/radiol.2018172656
14. Si-Mohamed S, Bar-Ness D, Sigovan M, Cormode D, Coulon P, Coche E, et al. Review of an initial experience with an experimental spectral photon-counting computed tomography system. Nucl Instrum Methods Phys Res A (2017) 873:27–35. doi: 10.1016/j.nima.2017.04.014
15. Wohlfahrt P, Richter C. Status and innovations in pre-treatment ct imaging for proton therapy. Br J Radiol (2020) 93:20190590. doi: 10.1259/bjr.20190590
16. Taasti V, Hansen D, Michalak G, Deisher A, Kruse J, Muren L, et al. Theoretical and experimental analysis of photon counting detector ct for proton stopping power prediction. Med Phys (2018) 45:5186–96. doi: 10.1002/mp.13173
17. Rajendran K, Petersilka M, Henning A, Shanblatt E, Schmidt B, Flohr T, et al. First clinical photon-counting detector ct system: Technical evaluation. Radiology (2022) 303:130–8. doi: 10.1148/radiol.212579
18. Landry G, Dörringer F, Si-Mohamed S, Douek P, Abascal J, Peyrin F, et al. Technical note: Relative proton stopping power estimation from virtual monoenergetic images reconstructed from dual-layer computed tomography. Med Phys (2019) 46:1821–8. doi: 10.1002/mp.13404
19. Saito M, Sagara S. A simple formulation for deriving effective atomic numbers via electron density from dual-energy ct data in the human body. Med Phys (2017) 44:2293–303. doi: 10.1002/mp.12176
20. Saito M. Potential of dual-energy subtraction for converting ct numbers to electron density based on a single linear relationship. Med Phys (2012) 39:2021–30. doi: 10.1118/1.3694111
21. Saito M, Sagara S. Simplified derivation of stopping power ratio in the human body from dual-energy ct data. Med Phys (2017) 44:4179–87. doi: 10.1002/mp.12386
23. Seltzer S, Fernandez-Varea J, Andreo P, Bergstrom P, Burns D, Bronic IK, et al. Report 90: Key data for ionizing-radiation dosimetry: Measurement standards and applications. J ICRU (2014) 14:31–48. doi: 10.1093/jicru/ndw034
24. Sigmund P, Schinner A, Paul H. Errata and addenda for icru report 73, stopping of ions heavier than helium. I C R U J 5 (2009) 5:113–237. doi: 10.1093/jicru/ndi013
25. Hudobivnik N, Schwarz F, Johnson T, Agolli L, Dedes G, Tessonnier T, et al. Comparison of proton therapy treatment planning for head tumors with a pencil beam algorithm on dual and single energy CT images. Med Phys (2016) 43:495. doi: 10.1118/1.4939106
26. Hansen D, Seco J, Sørensen T, Petersen J, Wildberger J, Verhaegen F, et al. A simulation study on proton computed tomography (CT) stopping power accuracy using dual energy CT scans as benchmark. Acta Oncol (2015) 54:1638–42. doi: 10.3109/0284186X.2015.1061212
27. Yang M, Virshup G, Clayton J, Zhu X, Mohan R, Dong L. Theoretical variance analysis of single- and dual-energy computed tomography methods for calculating proton stopping power ratios of biological tissues. Phys Med Biol (2010) 55:1343–62. doi: 10.1088/0031-9155/55/5/006
28. Doolan P, Collins-Fekete C, Dias M, Ruggieri T, D’Souza D, Seco J. Inter-comparison of relative stopping power estimation models for proton therapy. Phys Med Biol (2016) 61:8085–104. doi: 10.1088/0031-9155/61/22/8085
Keywords: photon-counting CT, relative stopping power (RSP), proton therapy, virtual monoenergetic images (VMIs), relative electron density, effective atomic number
Citation: Hu G, Niepel K, Risch F, Kurz C, Würl M, Kröncke T, Schwarz F, Parodi K and Landry G (2022) Assessment of quantitative information for radiation therapy at a first-generation clinical photon-counting computed tomography scanner. Front. Oncol. 12:970299. doi: 10.3389/fonc.2022.970299
Received: 15 June 2022; Accepted: 17 August 2022;
Published: 14 September 2022.
Edited by:
John C. Roeske, Loyola University Medical Center, United StatesReviewed by:
Till Tobias Böhlen, Centre Hospitalier Universitaire Vaudois (CHUV), SwitzerlandVicki Taasti, Maastro Clinic, Netherlands
Copyright © 2022 Hu, Niepel, Risch, Kurz, Würl, Kröncke, Schwarz, Parodi and Landry. This is an open-access article distributed under the terms of the Creative Commons Attribution License (CC BY). The use, distribution or reproduction in other forums is permitted, provided the original author(s) and the copyright owner(s) are credited and that the original publication in this journal is cited, in accordance with accepted academic practice. No use, distribution or reproduction is permitted which does not comply with these terms.
*Correspondence: Guyue Hu, R3V5dWUuSHVAcGh5c2lrLnVuaS1tdWVuY2hlbi5kZQ==
†These authors have contributed equally to this work