 Weiyong Sheng1†
 Shouli Xia2†Yaru Wang2
 Lizhao Yan3
 Songqing Ke4
 Evelyn Mellisa5Fen Gong2Yun Zheng6*Tiansheng Tang1*
- 1Department of Cardiothoracic Surgery, The First Affiliated Hospital of Wannan Medical College, Wuhu, China
- 2First Clinical Medical College, Guangzhou University of Chinese Medicine, Guangzhou, China
- 3Department of Hand Surgery, Union Hospital, Tongji Medical College, Huazhong University of Science and Technology, Wuhan, China
- 4Department of Science and Technology Research Management, Wuhan Blood Center, Wuhan, China
- 5Department of Emergency Surgery, Union Hospital, Tongji Medical College, Huazhong University of Science and Technology, Wuhan, China
- 6Department of Radiology, The First Affiliated Hospital of Guangzhou University of Chinese Medicine, Guangzhou, China
Background: Most studies of molecular subtype prediction in breast cancer were mainly based on two-dimensional MRI images, the predictive value of three-dimensional volumetric features from dynamic contrast-enhanced magnetic resonance imaging (DCE-MRI) for predicting breast cancer molecular subtypes has not been thoroughly investigated. This study aimed to look into the role of features derived from DCE-MRI and how they could be combined with clinical data to predict invasive ductal breast cancer molecular subtypes.
Methods: From January 2019 to December 2021, 190 Chinese women with invasive ductal breast cancer were studied (32 triple-negative, 59 HER2-enriched, and 99 luminal lesions) in this institutional review board-approved retrospective cohort study. The image processing software extracted 1130 quantitative radiomic features from the segmented lesion area, including shape-based, first-order statistical, texture, and wavelet features. Three binary classifications of the subtypes were performed: triple-negative vs. non-triple-negative, HER2-overexpressed vs. non-HER2-overexpressed, and luminal (A + B) vs. non-luminal. For the classification, five machine learning methods (random forest, logistic regression, support vector machine, naïve Bayes, and eXtreme Gradient Boosting) were employed. The classifiers were chosen using the least absolute shrinkage and selection operator method. The area evaluated classification performance under the receiver operating characteristic curve, sensitivity, specificity, accuracy, F1-Score, false positive rate, precision, and geometric mean.
Results: EXtreme Gradient Boosting model showed the best performance in luminal and non-luminal groups, with AUC, sensitivity, specificity, accuracy, F1-Score, false positive rate, precision, and geometric mean of 0.8282, 0.7524, 0.6542, 0.6964, 0.6086, 0.3458, 0.8524 and 0.7016, respectively. Meanwhile, the random forest model showed the best performance in HER2-overexpressed and non-HER2-overexpressed groups, with AUC, sensitivity, specificity, accuracy, F1-Score, false positive rate, precision, and geometric mean of 0.8054, 0.2941, 0.9744, 0.7679, 0.4348, 0.0256, 0.8333 and 0.5353, respectively. Furthermore, eXtreme Gradient Boosting model showed the best performance in the triple-negative and non-triple-negative groups, with AUC, sensitivity, specificity, accuracy, F1-Score, false positive rate, precision, and geometric mean of 0.9031, 0.9362, 0.4444, 0.8571, 0.9167, 0.5556, 0.8980 and 0.6450.
Conclusion: Clinical data and three-dimension imaging features from DCE-MRI were identified as potential biomarkers for distinguishing between three molecular subtypes of invasive ductal carcinomas breast cancer. In the future, more extensive studies will be required to evaluate the findings.
Introduction
Breast cancer accounts for about 30% of female cancers worldwide, with a mortality-to-incidence ratio of 15% (1). As the world’s largest developing country, China ranks first in terms of female breast cancer incidence and deaths, accounting for 17.6% and 15.6% of global female breast cancer incidence and deaths, respectively (2). Breast cancer subtyping has important therapeutic implications for the disease’s clinical management. The luminal (A or B), human epidermal growth factor receptor 2 (HER2)-overexpressed, and triple-negative subtypes of breast cancer are the most common molecular subtypes (3). Most invasive breast cancers (70%) are luminal tumors, which respond well to endocrine therapy. HER2-positive tumors are more likely to respond to targeted antibody therapy (4). Although triple-negative cancers are more aggressive and challenging to treat, some respond well to chemotherapy (4, 5). In routine clinical practice, breast cancer subtypes can be identified using genetic array testing or immunohistochemistry markers. Immunohistochemistry necessitates tissue samples, which are usually obtained through a needle biopsy. The subtyping assessment performed on a needle biopsy sample may not represent the tumor entirely due to the small tissue sample size and tumor heterogeneity.
The use of radiological images to characterize breast cancer subtypes has recently progressed. For example, the molecular subtypes of breast cancer are linked to certain qualitative and visual information of imaging characteristics assessed on breast magnetic resonance imaging (MRI), mammography, or ultrasound (6, 7). The usage of MRI to obtain multiparametric data from morphologic and functional signals is becoming more prevalent (8). Several radiomic studies have been conducted in breast cancer research. They are primarily based on DCE-MRI or combined MRI with other imaging modalities, such as PET (9). MRI is the most sensitive imaging modality for detecting, characterization, and accurate extent definition of soft tissue tumors (10, 11). DCE-MRI is particularly useful in determining breast cancer’s anatomic and functional properties (12). Previous radiomic studies of breast cancer have been conducted for invasiveness assessment (13, 14), treatment response (15–17) and recurrence prediction (18, 19), and genomic correlation (18). However, these studies (20–23) were primarily based on texture analysis of two-dimensional images; the predictive value of three-dimensional volumetric features from DCE-MRI for predicting breast cancer molecular subtypes has not been thoroughly investigated. This study aimed to see if features extracted from DCE-MRI three-dimensional imaging analyses and clinical data could be used to predict invasive ductal breast cancer molecular subtypes using machine learning. We are the first to classify three distinct molecular subtypes of invasive ductal breast cancer using three-dimensional volumetric imaging features based on a larger sample from Chinese women.
Materials and methods
Patients and clinical information
The Ethics Committee of the First Affiliated Hospital of Guangzhou University of Chinese Medicine reviewed and approved this retrospective cohort study (ethics approval number: JY2021-270_04.3.2). Informed consent was not obtained from the patient. The breast MRI was performed on 205 consecutive female patients scheduled to undergo treatment for pathologically proven invasive ductal carcinomas from January 2019 to December 2021. Fifteen patients were excluded due to previous resection or drug therapy and radiation therapy (n = 4), lack of pathologic biomarkers (n = 5), and incomplete menstrual history information in clinical medical records (n = 6). The largest tumor was chosen for analysis from patients with multiple synchronous tumors in the same breast. Finally, this study included 190 patients with 190 lesions (Figure 1). In addition, we used clinical information-based variables such as patient age, menstrual status, and tumor TIC type in this study.
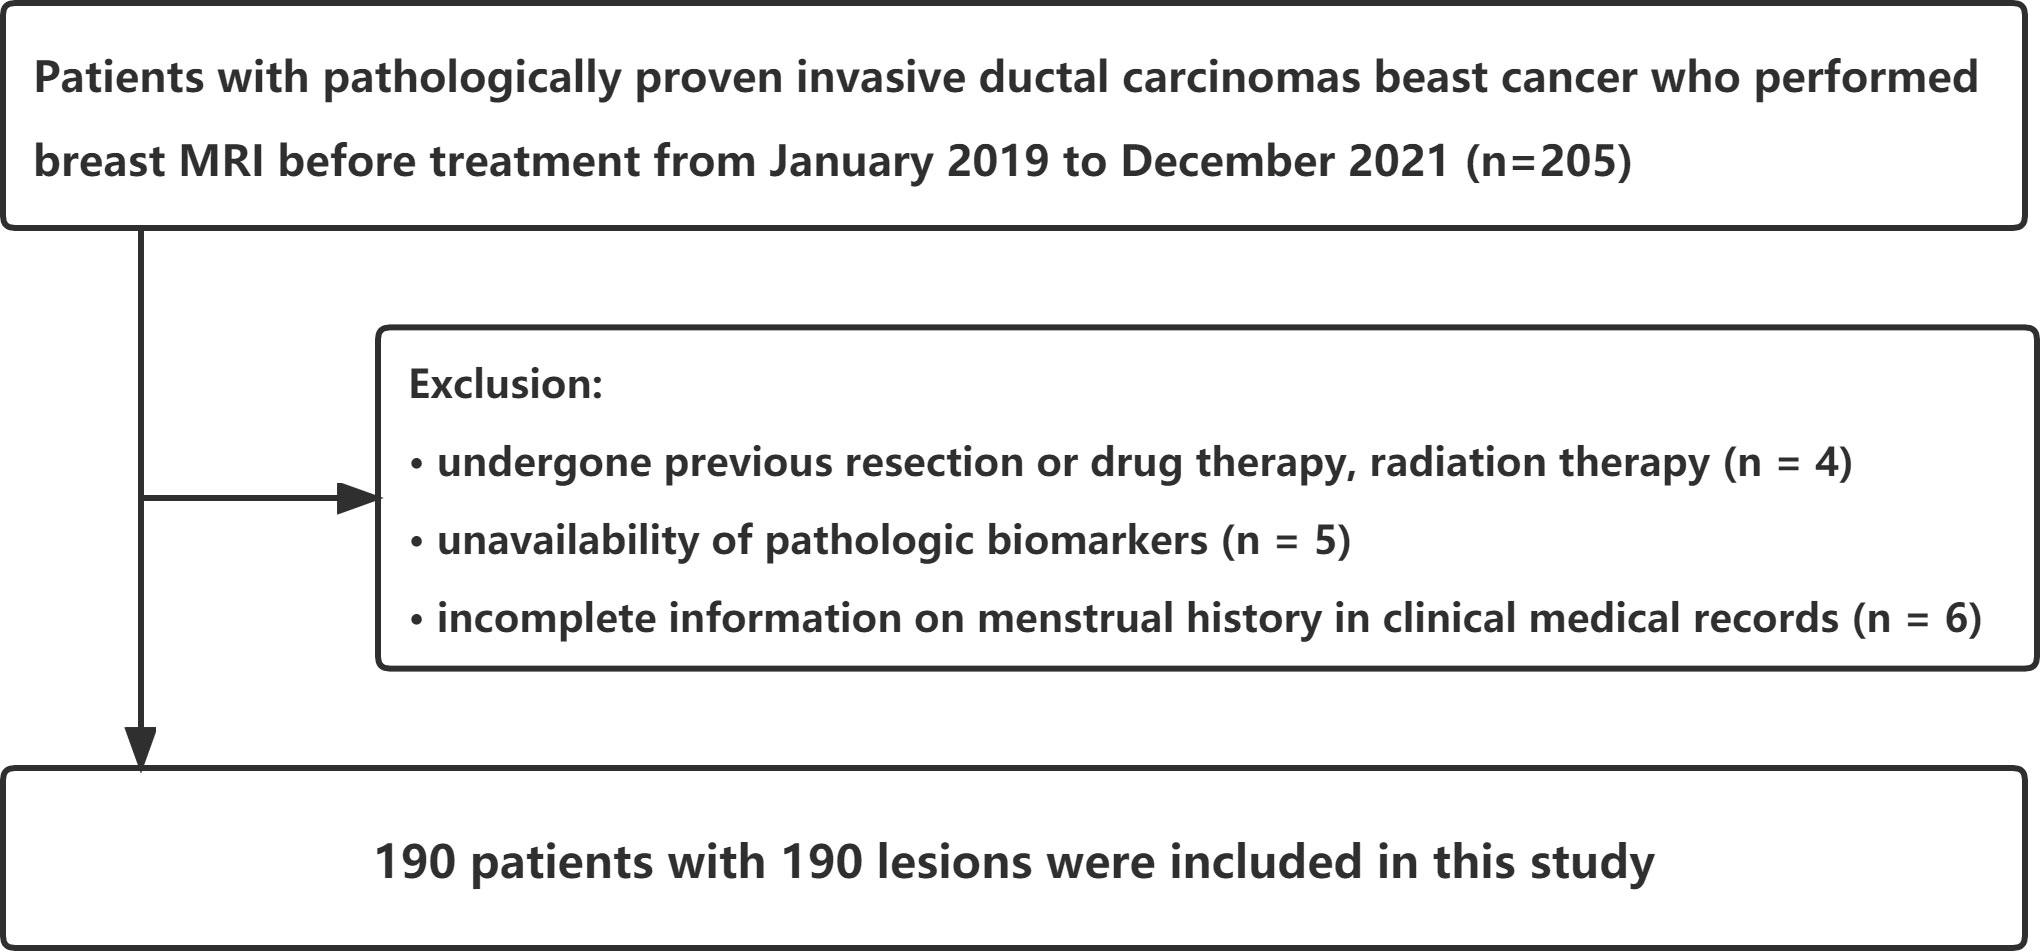
Figure 1 Flowchart of study population with exclusion criteria.
MRI acquisition and analysis
A 3-T MRI system (American GE Singa HDxt) and a dedicated eight-channel breast coil were used to perform the MRI in the prone position (NORAS MRI products). A total of nine phases were scanned, and the first phase was a plain scan mask. The plain scan included: (1) cross-sectional fat-suppressed T2 sequence (TR 3550 ms, TE 102 ms); (2) cross-sectional T1 sequence (TR 4.4 ms, TE 2.1 ms); (3) cross-sectional diffusion-weighted imaging (DWI) sequence (TR 6000ms, TE 69.2ms), slice thickness/slice spacing were both 4.0 mm/1.0 ms; and(4) dynamic enhancement was performed with cross-sectional Vibrant + enhancement sequence (TR 4.4 ms, TE 2.1 ms, layer thickness 1.2 mm). Gadopentetate meglumine (Gd-DTPA) was rapidly injected through the dorsal vein of the hand with a high-pressure syringe at a bolus injection rate of 2.0 ml/s and a dose of 0.2 ml/kg, followed by a rapid bolus injection of 20 mL of normal saline. Eight dynamic enhancement sequences were continuously scanned at 61s, 122s, 184s, 245s, 306s, 368s, and 429s after the injection.
Two radiologists (L.Z.Y. and F.G., with 10 and 5 years of experience in breast MRI, respectively) were blinded and evaluated MRI features in consensus. Multi-level step-by-step sketching of tumor lesions in T1 images of stage 2 after contrast injection using commercially available image processing software 3D Slicer (https://www.slicer.org, version number: 4.11.20210226 r29738/7a593c8). The sketched images were finally fused to form a three-dimensional VOI (Volume of Interest), as shown in Figure 2. Image features such as shape-based, first-order statistical, texture, wavelet, and laplacian of Gaussian (LOG) filter were extracted.
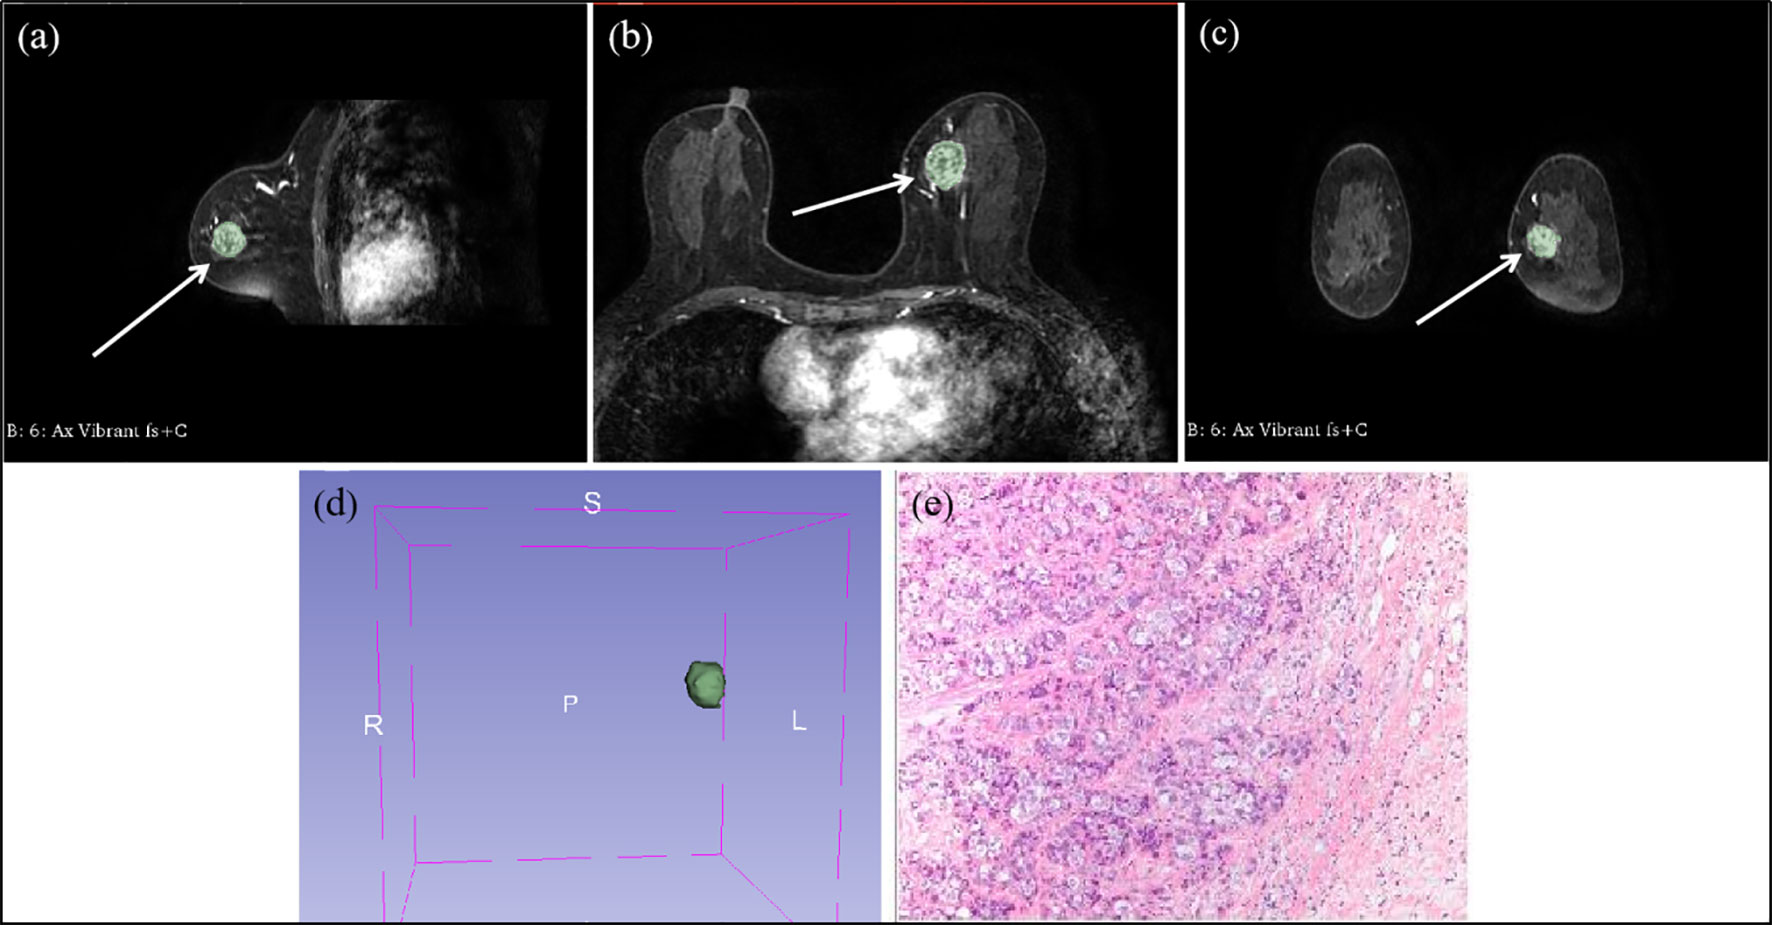
Figure 2 Multi-level step-by-step sketching of tumor lesions at contrast-enhanced T1-weighted MRI in a 49 year-old woman with invasive ductal cancer of the left breast. (A) sagittal position image shows an irregular shaped, irregular margined, heterogeneous enhancing mass (arrow). (B) transverse position image shows an irregular shaped, irregular margined, heterogeneous enhancing mass (arrow). (C) coronal position image shows an irregular shaped, irregular margined, heterogeneous enhancing mass (arrow). (D) the VOI fused into the outlined images step-by-step. (E) the pathological microscopic picture of invasive ductal cancer of the left breast.
Pathologic assessment
The molecular subtypes of breast cancers in this study were classified based on the expert consensus of the 2013 St. Gallen International Breast Cancer Conference (24) as follows: Luminal A (ER+, HER2–, and Ki67–); Luminal B (ER+, HER2–, and Ki67+; or ER+, HER2+, and Ki67); HER2-overexpressed (ER–, PR–, and HER2+); and triple-negative cancer (ER–, PR–, and HER2–). From a total of 190 patients, a mastectomy was performed on 60 patients, breast-conservation surgery was performed on 125 patients, and neoadjuvant chemotherapy and surgery were performed on five patients. We reviewed the pathology reports and included tumor size, histological grade, and axillary lymph node metastases in the statistical analysis.
Statistical analysis and model evaluation
This study divided all of the enrolled patients into three categories based on postoperative immunohistochemical molecular subtypes: (a). “luminal type”, (b). “HER2-overexpressed type” and (c). “triple-negative type”. For general data processing, analysis, and related graphics of the two groups under different categories, SAS 9.4 software and R language 3.6.1 (http://www.R-project.org) tools are used. Measurement data were expressed as mean ± standard deviation. The frequency data expressed the count data (composition ratio, percent). A t-test was used to figure out the age. For the largest diameter, the rank-sum test was used. The chi-square test determined menstrual status and axillary lymph node metastasis. The nonparametric Mann Whitney U test determined the tumor’s histological grade and TIC.
Using the R language random grouping function, the sample data for each category standard were randomly divided into the model training cohort and the model validation cohort in a 7:3 ratio. The pathology report variables and the MRI imaging characteristics parameters were both entered into the selection process, as shown in Figure 3. Least Absolute Shrinkage and Selection Operator (LASSO) regression was used to avoid the potential collinearity of variables measured from the same patient and over-fitting variables. Based on the value of λ, this logistic regression model penalizes the absolute size of the coefficients of a regression model. The estimates of weaker factors shrink toward zero as the penalties become more significant, leaving only the strongest predictors in the model. The optimal λ was used to select the most predictive covariates. Following that, we looked at five machine learning models for predicting molecular subtypes based on variables determined by LASSO regression: logistic regression (LR), support vector machine (SVM), naïve Bayes (NB), random forest (RF), and eXtreme Gradient Boosting (XGBoost). To verify the classification accuracy, a 5-fold cross-validation method was used to randomly divide the entire sample into five groups. In each round, four of the groups were used as a training set and one served as a validation set. This process was repeated five times until each group of the sample had been verified, and the mean accuracy, sensitivity, specificity, AUC, F1-Score, precision, geometric mean (GM), and false positive rate (FPR) of the training sets were calculated. The confusion matrix between the actual value and the prediction value of all samples was also calculated to make a comprehensive evaluation of the model. The parameters were defined as follows:
Accuracy = (True positive + True negative)/(True positive + True negative + False positive + False negative)
Sensitivity (Recall) = True positive/(True positive + False negative)
Specificity = True negative/(False positive + True negative)
FPR = False positive/(False positive + True negative)
Precision = True positive/(True positive + False positive)
F1-Score = 2 (Recall * Precision)/(Recall + Precision)
Geometric Mean = (Recall * Specificity) ^ 1/2
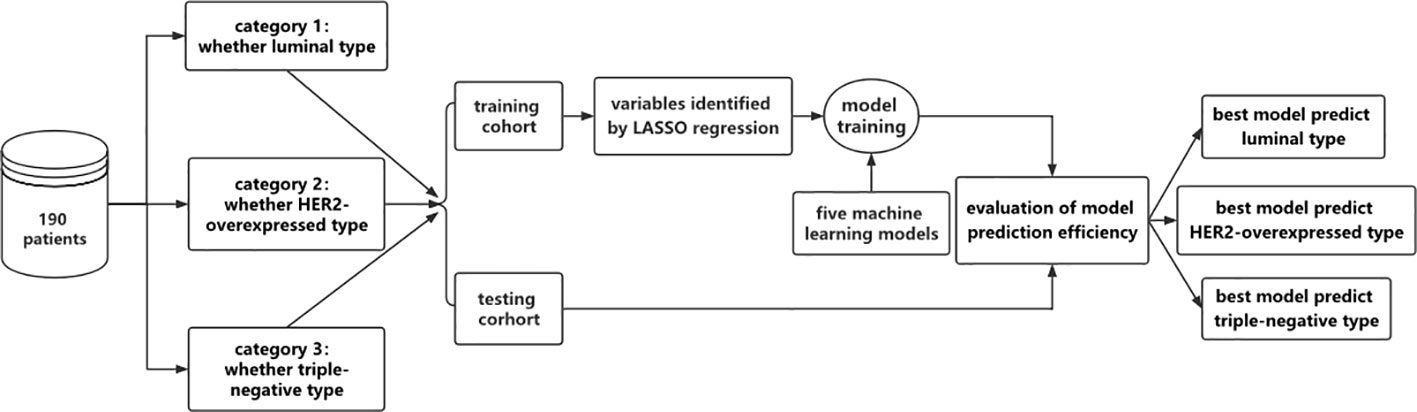
Figure 3 Flow chart of model establishment in this study. The 190 patients were grouped according to different molecular pressure types and divided into 3 categories, namely luminal and non-luminal, HER2-overexpressed and non-HER2-overexpressed, triple negative and non-triple negative. The following data were divided into training dataset and testing dataset. In the training dataset, the feature variables were screened by LASSO regression, and five machine learning models were used to construct the model. The performance evaluation of the model was carried out in the testing dataset to determine the optimal model.
Each model’s median value was calculated after the random split, and the analysis was repeated five times. Two statisticians (L.Z.Y. and S.Q.K.) conducted the analyses in January 2022.
Results
Patient characteristics
This study included 190 patients with bulky breast cancers (mean age 48.67 years; age range 24–89 years). The mean diameter of the breast tumors was 35.29 ± 24.23 mm. There were 99 cases of Luminal type, 59 cases were HER2-overexpressed, and 32 cases were Triple-negative type. The tumor characteristics were shown in Table 1.
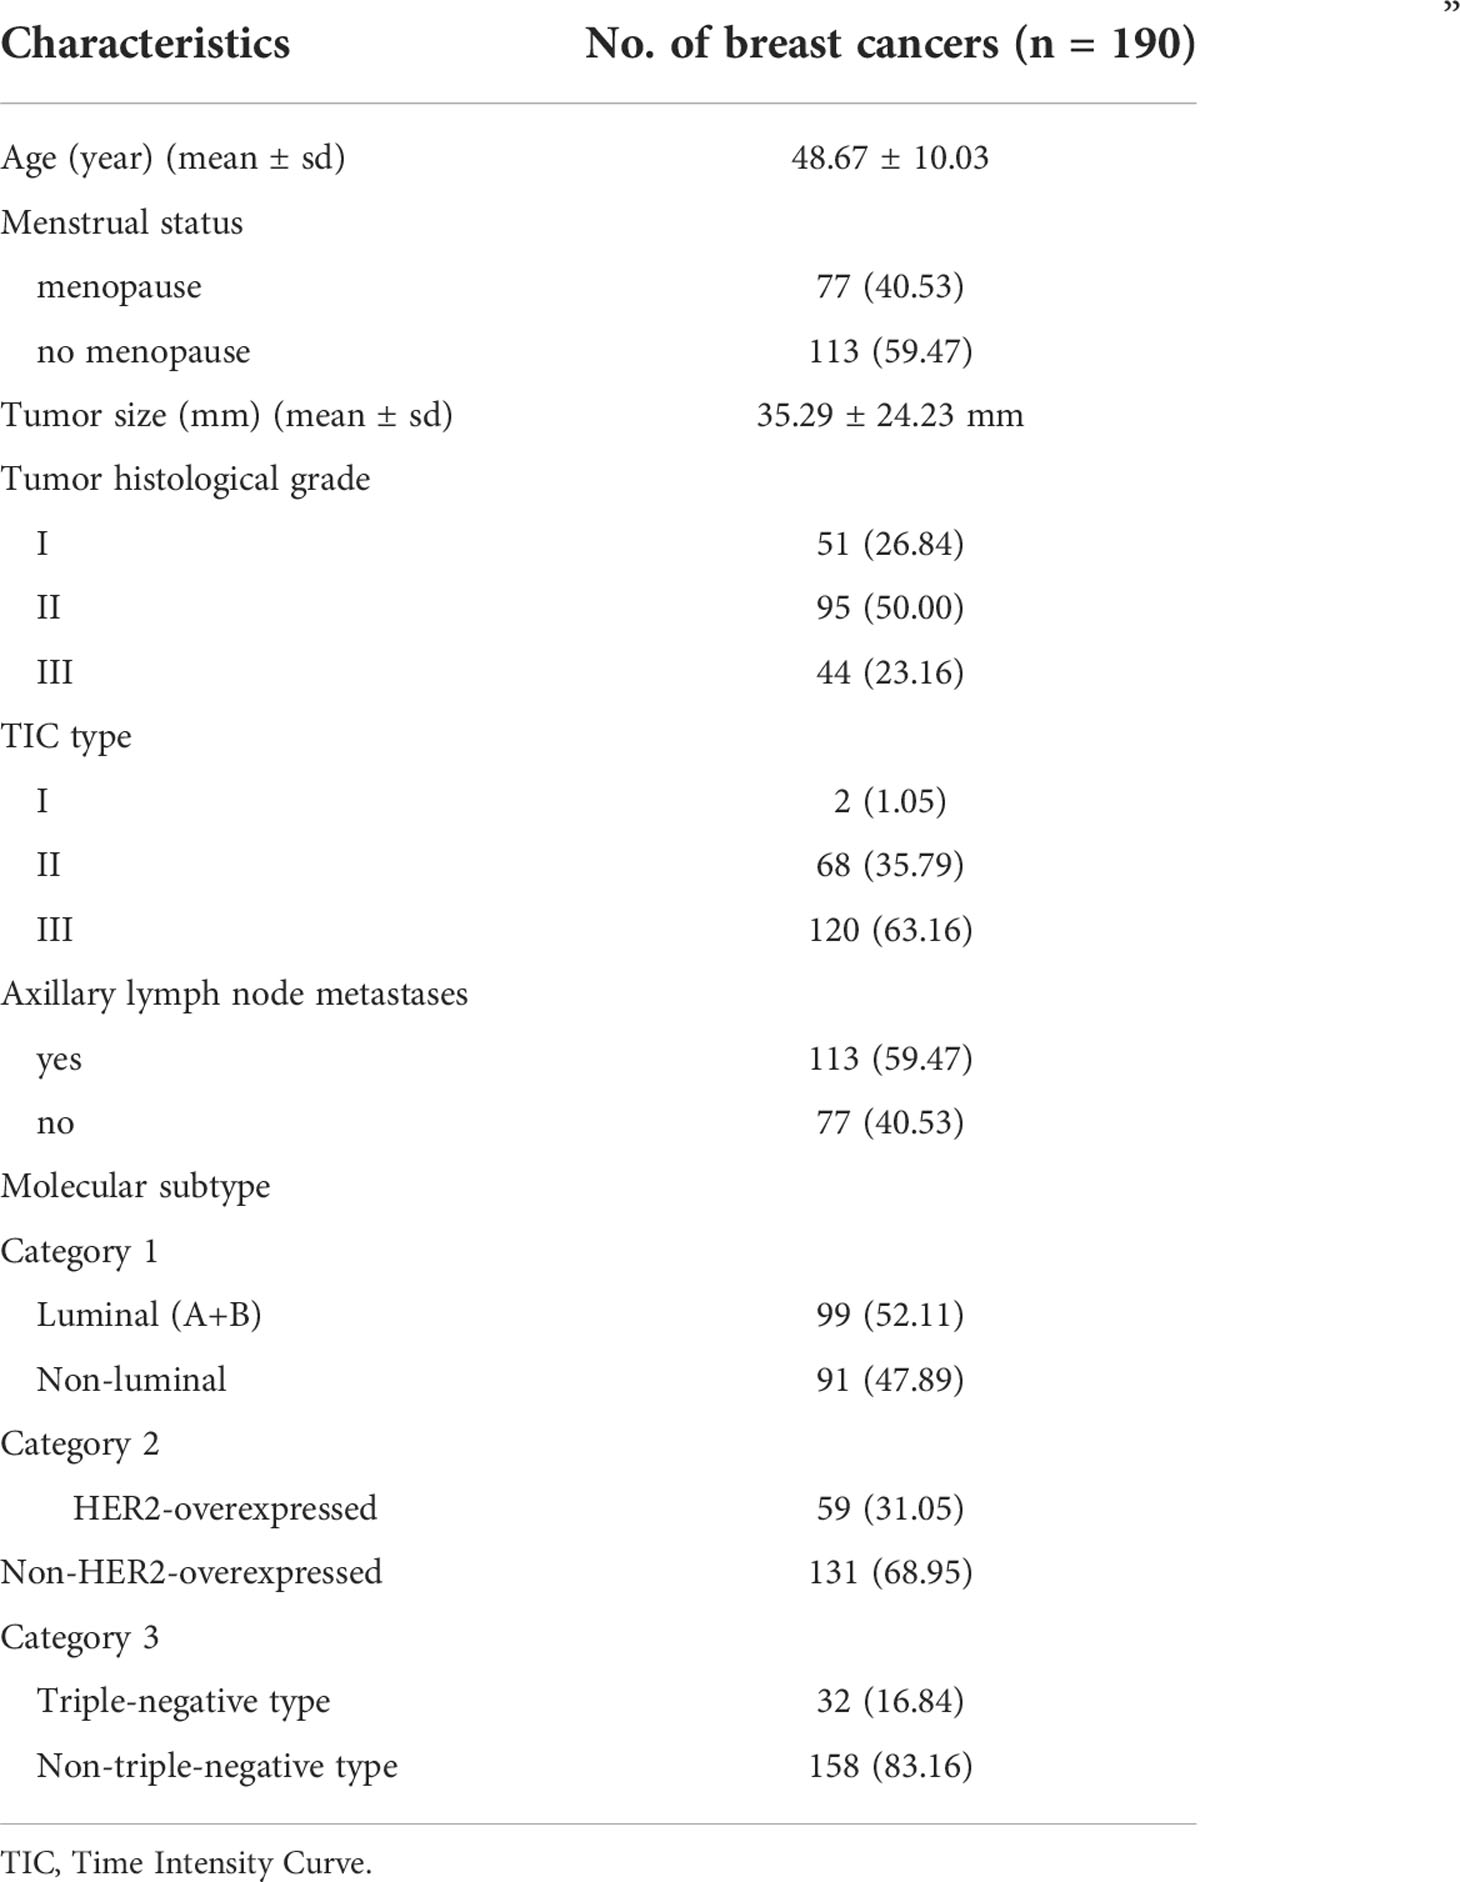
Table 1 Tumor characteristics.
Feature selection
Category 1: luminal (A+B) vs. non-luminal
The 190 patients were divided into Luminal and Non-Luminal groups in “Luminal vs. Non-luminal groups”. The general characteristics of the two groups of patients are shown in Supplemental Table 1. The Luminal type group includes 99 patients (ages 24 to 77, with an average of 49.17 ± 10.36 years old), with 34 cases of Luminal A-type and 65 cases of Luminal B type. In the non-Luminal group, there were 91 cases (ages ranged from 29 to 89 years, with a mean of 48.54 ± 9.70 years).
Two independent samples t-tests and LASSO regression in R language were used to screen 1130 MRI radiomics features and five clinical features. Figure 4A showed a relatively stable model ability when the number of screened feature variables was 18, and the tuning parameter (λ) selection was 0.05847632. The eigenvalues vary with the value of different variables, as shown in Figure 4B. Finally, eighteen features with non-zero coefficients (13 wavelet transform features, five LOG features) were identified, and their coefficients were shown in Supplemental Figure 1.
1. log.sigma.1.0.mm.3D.firstorder.Maximum
2. log.sigma.3.0.mm.3D.glcm.Imc1
3. log.sigma.3.0.mm.3D.gldm.LargeDependenceEmphasis
4. log.sigma.3.0.mm.3D.glrlm.ShortRunEmphasis
5. log.sigma.5.0.mm.3D.firstorder.Maximum
6. wavelet.LLH.glcm.Correlation
7. wavelet.LLH.glcm.MCC
8. wavelet.LHL.firstorder.Mean
9. wavelet.LHH.glcm.JointAverage
10. wavelet.LHH.glcm.SumAverage
11. wavelet.LHH.gldm.SmallDependenceHighGrayLevelEmphasis
12. wavelet.LHH.gldm.SmallDependenceLowGrayLevelEmphasis
13. wavelet.LHH.glszm.SizeZoneNonUniformityNormalized
14. wavelet.HLH.glcm.ClusterProminence
15. wavelet.HLH.glszm.SizeZoneNonUniformityNormalized
16. wavelet.HHL.firstorder.Kurtosis
17. wavelet.HHL.firstorder.Maximum
18. wavelet.HHL.firstorder.Mean
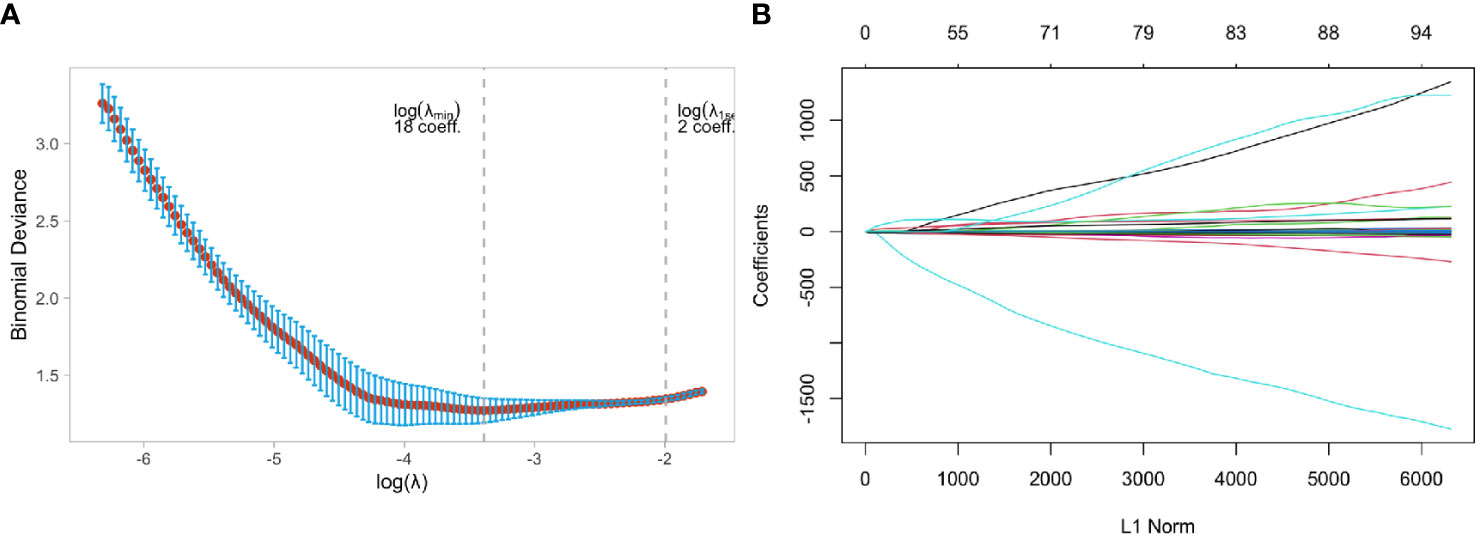
Figure 4 Feature selection using the least absolute shrinkage and selection operator (LASSO) binary logistic regression model in Luminal and Non-luminal group. (A) Tuning parameter selection in the LASSO model used 5-fold cross-validation via minimum criteria, (B) LASSO coefficient profiles of the baseline features.
Category 2: HER2-overexpressed vs. non-HER2-overexpressed
A total of 190 patients were divided into HER-2 overexpressed and Non-HER-2 overexpressed groups in the category “HER-2 overexpressed vs. Non-HER-2 overexpressed groups”. The general characteristics of the two groups of patients are shown in Supplemental Table 2. There were 59 cases in the HER2-overexpressed group (ages 29 to 75, mean age 48.47 ± 9.31 years old) and 131 cases in the non-HER2-overexpressed group (ages 24 to 89, mean age 48.75 ± 10.33 years old).
Figure 5A showed that the model ability is relatively stable when the number of selected feature variables was 11, and the tuning parameter (λ) selection was 0.07596331. The eigenvalues vary with the value of different variables, as shown in Figure 5B. Finally, eleven non-zero coefficient features (5 wavelet features, three morphological features, one texture feature, and two LOG features) were determined, and their coefficients were shown in Supplemental Figure 2.
1. original.shape.Maximum2DDiameterColumn
2. original.shape.Maximum2DDiameterSlice
3. original.shape.Sphericity
4. original.glcm.Imc2
5. log.sigma.3.0.mm.3D.glrlm.ShortRunEmphasis
6. log.sigma.5.0.mm.3D.firstorder.Maximum
7. wavelet.LLH.glcm.Correlation
8. wavelet.LHH.gldm.SmallDependenceHighGrayLevelEmphasis
9. wavelet.LHH.glszm.SizeZoneNonUniformityNormalized
10. wavelet.LLL.gldm.LargeDependenceHighGrayLevelEmphasis
11. wavelet.LLL.glrlm.LongRunHighGrayLevelEmphasis
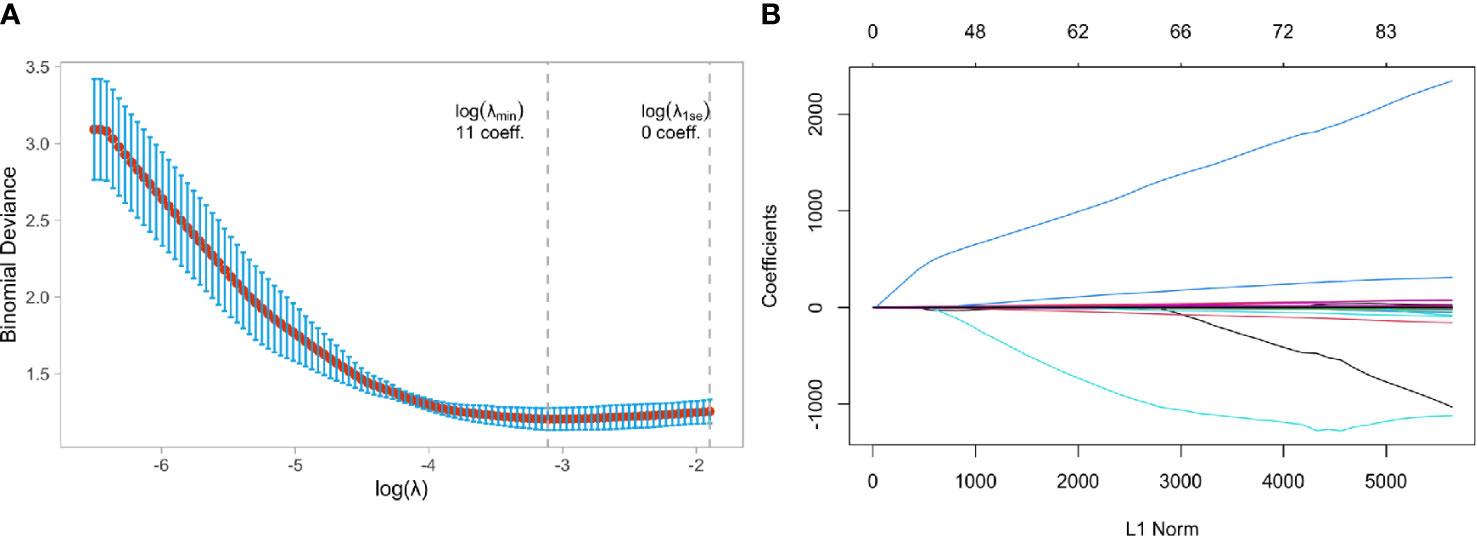
Figure 5 Feature selection using the least absolute shrinkage and selection operator (LASSO) binary logistic regression model in HER2-overexpressed and Non-HER2-overexpressed group. (A) Tuning parameter selection in the LASSO model used 5-fold cross-validation via minimum criteria, (B) LASSO coefficient profiles of the baseline features.
Category 3: triple-negative type vs. non-triple-negative type
In the category “Triple-negative vs. Non-triple-negative type”, 190 patients were split into triple-negative and non-triple-negative types. The general characteristics of the two groups of patients are shown in Supplemental Table 3. The triple-negative type group had 32 cases (range of 30 to 77 years old, mean age 48.91 ± 10.89 years), and the non-triple-negative type group had 158 cases (range of 24 to 77, mean age 48.62 ± 9.84 years).
Figure 6A showed that the model ability is relatively stable when the number of selected feature variables was 10 and the tuning parameter (λ) selection was 0.04567723. The eigenvalues vary with the value of different variables, as shown in Figure 6B. Finally, ten non-zero coefficient features (8 wavelet transform features, one clinical feature, and one LOG feature) were identified, and their coefficients were shown in Supplemental Figure 3.
1. NA.NA.Menstrual.status
2. log.sigma.1.0.mm.3D.gldm.SmallDependenceLowGrayLevelEmphasis
3. wavelet.LHL.firstorder.Mean
4. wavelet.LHH.firstorder.Kurtosis
5. wavelet.LHH.gldm.DependenceEntropy
6. wavelet.HLL.gldm.LargeDependenceHighGrayLevelEmphasis
7. wavelet.HLH.glcm.Contrast
8. wavelet.HLH.glszm.GrayLevelVariance
9. wavelet.HHL.glcm.Correlation
10. wavelet.LLL.gldm.LargeDependenceHighGrayLevelEmphasis
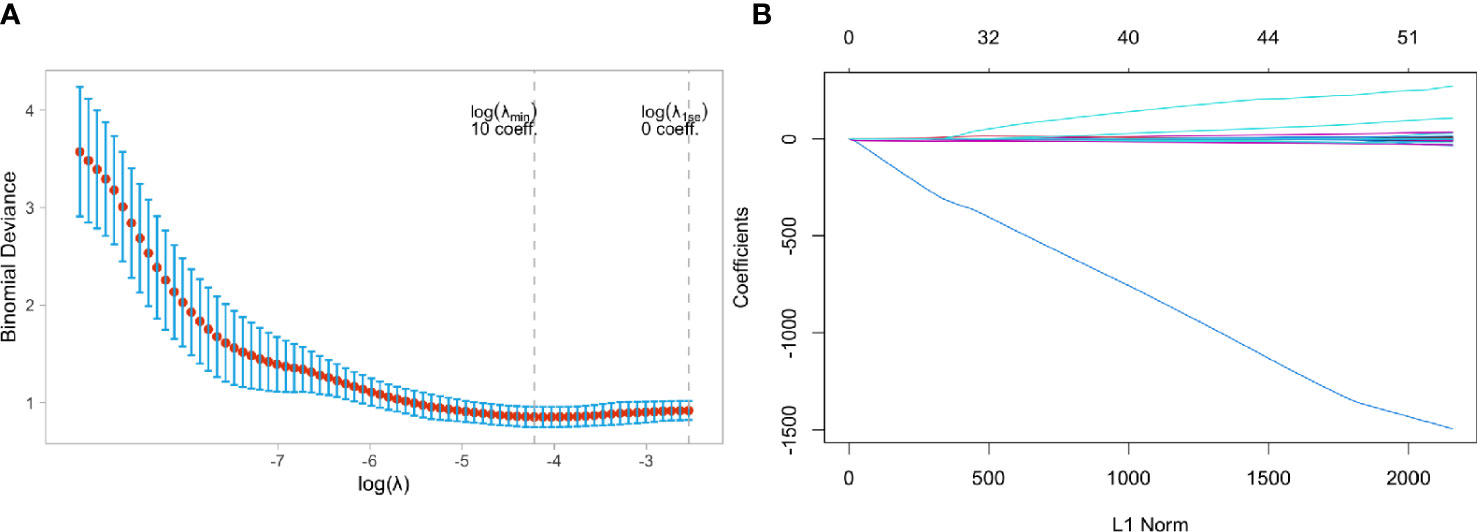
Figure 6 Feature selection using the least absolute shrinkage and selection operator (LASSO) binary logistic regression model in Triple negative and Non-Triple negative group. (A) Tuning parameter selection in the LASSO model used 5-fold cross-validation via minimum criteria, (B) LASSO coefficient profiles of the baseline features.
Model training and evaluation
Category 1: luminal (A+B) vs. non-luminal
Table 2 showed the prediction performance indicators of the five machine learning models that used the variables chosen by LASSO regression to predict category 1. In the testing cohort, the XGBoost model performed the best in terms of prediction, with an AUC of 0.8282 vs. 0.7126 (LR), 0.7708 (RF), 0.7139 (NB), and 0.7420 (SVM). In the testing cohort, the XGBoost model’s sensitivity and specificity were 0.7524 and 0.6542, respectively, compared to 0.5556 and 0.7241 for LR, 0.7931 and 0.4815 for RF,0.3333 and 0.8276 for NB, and 0.5926 and 0.7931 for SVM. Supplemental Table 4 ~Table 11 showed the average evaluation measures of the 5-fold cross-validation.
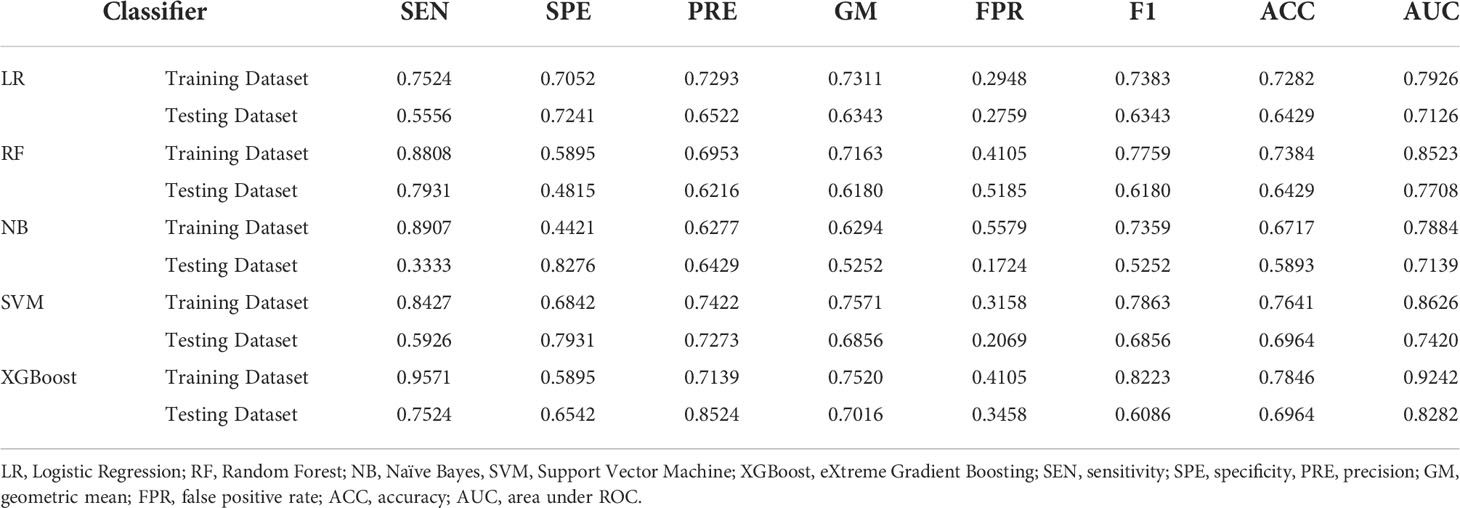
Table 2 Evaluation indicators of predictive performance of five models in Luminal group and Non-luminal group.
Category 2: HER2-overexpressed vs. non-HER2-overexpressed
Table 3 showed the prediction performance indicators of the five machine learning models that used Lasso regression to select variables to predict category 2. In the testing cohort,the RF model performed best for prediction, with an AUC of 0.8054 vs. 0.7029 (LR),0.7164 (NB), 0.7617 (SVM), and 0.7459 (XGBoost). In the testing cohort,the RF model’s sensitivity and specificity were 0.2941 and 0.9744, respectively, compared to 0.8462 and 0.3529 for LR, 0.8718 and 0.3529 for NB, 0.8974 and 0.4118 for SVM, and 0.7949 and 0.6471 for XGBoost. The average sensitivity, specificity, FPR, F1-Score, and geometric mean for the 5-fold cross-validation are shown in Supplemental Table 12~Table 19.
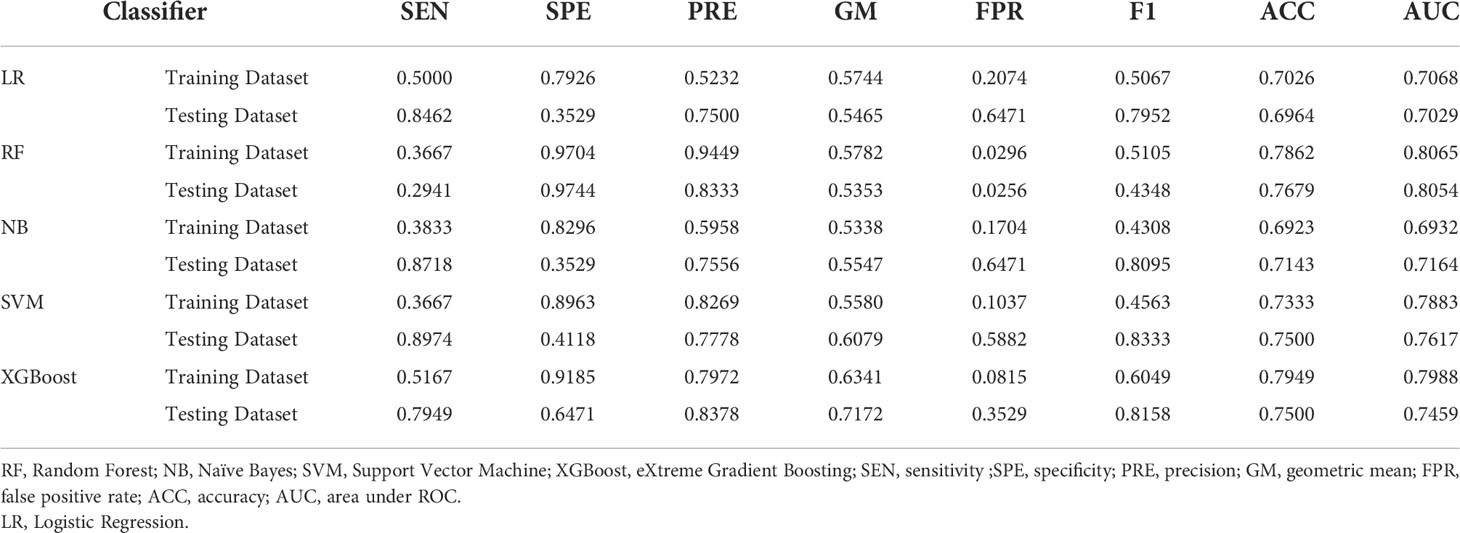
Table 3 Evaluation indicators of predictive performance of five models in HER2-overexpressed and Non-HER2-overexpressed groups.
Category 3: triple-negative type vs. non-triple-negative type
Table 4 showed the prediction performance indicators of the five machine learning models that used Lasso regression to select variables to predict category 3. In the testing cohort, the XGBoost model performed the best in terms of prediction, with an AUC of 0.9031 vs. 0.7069(LR), 0.7979(RF), 0.6809(NB), and 0.7778(SVM). In the testing cohort, the XGBoost model’s sensitivity and specificity were 0.9362 and 0.4444, respectively, compared to 0.9149 and 0.3333 for LR, 0.1111 and 1.0000 for RF, 0. 8723 and 0.3333 for NB, and 1.0000 and 0.2222 for SVM. The average sensitivity, specificity, FPR, F1-Score, and geometric mean for the 5-fold cross-validation are shown in Supplemental Table 20 ~ Table 27.
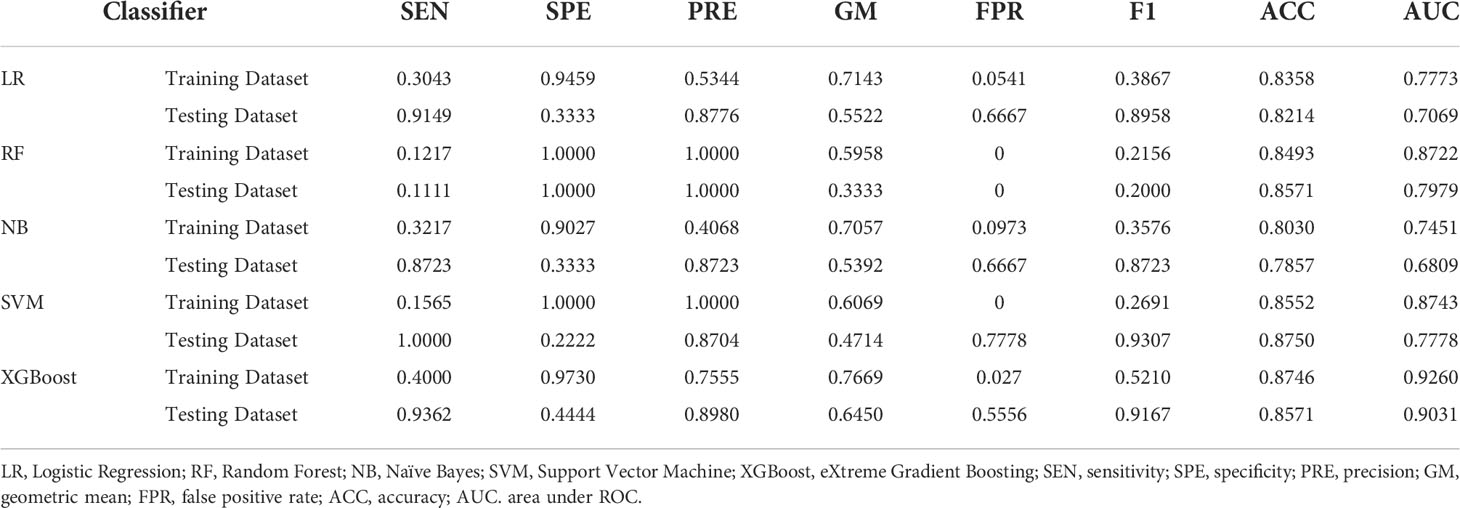
Table 4 Evaluation indicators of predictive performance of five models in Triple-negative group and Non-triple-negative group.
Discussion
Our research found that combining MRI radiomic variables, pathology variables, and clinical data could help predict invasive ductal breast cancer molecular subtypes. The XGBoost method outperformed the other five machine learning models in predicting luminal and triple-negative types. In the HER2-overexpressed type, the RF method had the best predictive performance. We believe that developing an MRI-based diagnosis prediction model can provide a unique idea for clinical non-invasive prediction of breast cancer molecular subtype classification and a benchmark for developing clinically precise and individualized treatment plans from our findings.
We extracted five categories features from DCE-MRI: shape-based features, first-order statistical features, texture features, wavelet features, and the laplacian of a gaussian filter. Wavelet features can be used to calculate image signal resolution on various temporal, spatial, and frequency scale planes (25). Texture analysis extracts and quantifies information such as regularity, roughness, and the grey level of lesions that cannot be distinguished by the naked eye, allowing for a more comprehensive and detailed reflection of the characteristics of lesions (26). Texture analysis plays a vital role in molecular typing and can effectively distinguish between HR-positive and HR-negative breast cancers (26). Three radiological features were extracted by Tagliafico et al. (27): energy, entropy, and difference. There were significant differences between breast and normal breast tissue in patients with dense breasts. This research shows that radiomics has much potential for detecting malignant features in breast lesions.
Three first-order statistical features (minimum value, average value, and maximum value) were selected in the luminal group. Two first-order statistical features (maximum and average) were selected in the HER2-overexpressed group. Two first-order statistical features (kurtosis and mean value) were selected in the triple-negative group in our study. Ming Fan et al. (28) found that luminal A had low kurtosis and skewness, the essential features in predictive models. This finding is in line with previous research suggesting that skewness can be used to predict breast cancer molecular subtypes (11). Kurtosis and skewness signatures have been identified as biomarkers of tumor heterogeneity (29), with high values indicating treatment failure (30) and low values indicating treatment response (31). These studies discovered differences in parenchymal background enhancement between normal and abnormal breasts. These differences could reflect the aggressiveness of breast tumors, which is one of the main characteristics of the HER2-overexpressed type. Triple-negative breast cancer cells are more disordered, loose, and prone to necrosis (32), and HER2-overexpressed breast cancer behaves more like triple-negative breast cancer, likely due to less aggressive tumors’ lower neovascularization (33). This study chose no related first-order features in the luminal and HER2-overexpressed groups. We believe this is related to the sample size and the grouping method. The kurtosis was chosen in the triple-negative group, which could be due to tumor heterogeneity.
Building predictive models and model selection are critical in radiomics to ensure reliability and stability (34–39). In both luminal and non-luminal groups, the XGBoost model outperforms the other five models. The model’s AUC in the validation cohort was 0.8282, indicating that it was more efficient at classification. The sensitivity was 0.7524, indicating that positive samples could be detected on average. In terms of prediction, previous research has shown that the XGBoost model outperforms other machine learning algorithms (40–43). Our findings were comparable to or better than previous retrospective radiomic studies on breast MRI (44, 45). Aside from that, the triple-negative and non-triple-negative groups had similar outcomes. Although some studies have found that logistic regression is effective in the radiomic diagnostic prediction model of triple-negative type breast cancer (22, 46), we believe this is due to differences in the number of patients in the sample and the MRI radiomic characteristics used in the studies. In our study, there were only 32 triple-negative patients.
In both the HER2-overexpressed and non-HER2-overexpressed groups, the RF model outperformed the other five models. The model’s AUC in the validation cohort was 0.8054, indicating it was more efficient at classification. The model’s specificity was 0.9744 indicating that it could, on average, distinguish negative samples. In contrast to the literature, Ma et al. (21) discovered that the RF model could distinguish HER2-expressed breast cancer by extracting radiological features from digital mammography images. Between the HER2-overexpressed and non-HER2-overexpressed groups, the AUC difference was 0.784. The AUC under the RF model was similar in our study than in Ma’s. The intrinsic differences between two-dimensional mammogram images and three-dimensional DCE-MRI images, we believe, are to blame. MRI can reveal details that digital mammography cannot, such as the location, size, morphology, surrounding tissue infiltration, intratumoral hemorrhage, necrosis, etc. Breast MRI was used by Braman et al. (23) to extract radiological features around and within the tumor, demonstrating that similar features can identify HER2-overexpressed breast cancer.
According to previous research, the incidence rates of luminal type, HER2-overexpressed type, and triple-negative breast cancer were 44.5% - 69.0%, 10% - 25%, and 10% - 20%, respectively (46). Our study’s incidence of these three types of breast cancer supports this theory. They are 52.78% for the luminal type, 32.41% for the HER2-overexpressed type, and 14.81% for the HER2-overexpressed type (triple-negative type). Our research is one of the few MRI diagnostic models for breast cancer that includes all three types of cancer and is based on many patient samples. Small sample sizes of around 100 were used in most radiomic studies of breast cancer, resulting in selection bias and affecting the results (47). For obtaining uniform results and building predictive models in radiomics, collecting methods, sample size, and imaging acquisition are critical. Second, we used commercially available image analysis software to create a three-dimensional image of the tumor (48), ensuring that more relevant variables were captured. It may be possible to conduct multicenter external validation studies to measure the predictive performance of radiomic machine learning models objectively. Most radiomics have been used in scientific research, but they are not widely used in clinics. Third, we identified key MRI parameters for predicting prognostic factors in various breast cancer subtypes, primarily molecular subtypes. The advancement of precision medicine in breast cancer will be aided by developing more detailed and precise assays for the important parameters discovered in our study.
In terms of clinical application, our findings show that additional information can be added before and after treatment, in addition to pathological correlations. Clinical biomarkers for prognosis prediction and treatment monitoring can be created by combining important MRI radiomic and pathology variables. They reflect microstructural tumor characteristics like tumor heterogeneity and angiogenesis, allowing for noninvasive intratumoral dynamics monitoring throughout treatment.
Texture heterogeneity was discovered by Trebeschi et al. (49) to be a noninvasive imaging biomarker for predicting immunotherapy responses that could be used in neoadjuvant and palliative settings. Our findings show that radiomics has the potential to improve patient stratification and treatment planning.
Lubner et al. (48) found that the results captured from two-dimensional and three-dimensional image features in untreated hepatic metastatic colorectal cancer were comparable. Our results were slightly better than those of the most recent study (20), which used two-dimensional images for feature selection, with an AUC of 0.83 vs. 0.80 in the lumina and non-luminal groups, and 0.81 vs. 0.65 in the HER2-overexpressed and non-HER2-overexpressed groups, suggesting that three-dimensional images may have advantages.
There are some limitations to our study. First, this study did not assess the reproducibility of segmentation for image analysis. To avoid problems with lesion selection, our study had two experienced radiologists evaluate MRI features blinded to the clinicopathologic findings. Second, for internal validation, the random split and analysis were repeated five times, and the average AUCs for each machine learning model in this study were calculated. The validity of this study is expected to improve with more random splits and analyses on internal and external data sets, such as 50 times. Third, we did not include other sequences due to the practical advantage of quick acquisition times (50–52). This study obtained a cross-section fat-suppressed T2 sequence, cross-sectional T1 sequence, cross-sectional DWI sequence, and cross-sectional Vibrant + enhancement sequence.
Recent research has found a strong link between quantitative MRI parameters and breast cancer aggressiveness and subtypes in ultrafast and diffusion-weighted MRI (50–52). A multi-center clinical prospective study with larger patient samples and more MRI sequence features extracted currently underway. We are excited to learn more about the results of this long-term study and we look forward to enrolling more patients and observing such results in our next phase of clinical research.
Conclusion
Our research found promising results from a radiomic machine learning analysis that combined pathology variables, clinical information, and radiomic variables on MRI to achieve noninvasive and objective diagnostic factor prediction for different molecular subtypes of invasive ductal breast cancer. The RF model had the best predictive performance for distinguishing HER2-overexpressed types, while the XGBoost model showed the best predictive performance for distinguishing luminal and triple-negative types.
Data availability statement
The raw data supporting the conclusions of this article will be made available by the authors, without undue reservation.
Ethics statement
The studies involving human participants were reviewed and approved by the ethics committee of the First Affiliated Hospital of Guangzhou University of Chinese Medicine (ethics approval number: JY2021-270_04.3.2). Written informed consent for participation was not required for this study in accordance with the national legislation and the institutional requirements.
Author contributions
SX and YZ contributed the study design, FG and YW contribute the data acquisition, EM for the language polish, WS for the valuable comments on the article review. We thank LY and SK for the data analysis. We thank TT for helping contact all members of the team for early collaboration. All authors contributed to the article and approved the submitted version.
Acknowledgments
We thank Professor Gao Xuan for his writing guidance for this article.
Conflict of interest
The authors declare that the research was conducted in the absence of any commercial or financial relationships that could be construed as a potential conflict of interest.
Publisher’s note
All claims expressed in this article are solely those of the authors and do not necessarily represent those of their affiliated organizations, or those of the publisher, the editors and the reviewers. Any product that may be evaluated in this article, or claim that may be made by its manufacturer, is not guaranteed or endorsed by the publisher.
Supplementary material
The Supplementary Material for this article can be found online at: https://www.frontiersin.org/articles/10.3389/fonc.2022.964605/full#supplementary-material
References
1. Siegel RL, Miller KD, Jemal A. Cancer statistics, 2020. CA Cancer J Clin (2020) 70(1):7–30. doi: 10.3322/caac.21590
2. Xia C, Dong X, Li H, Cao M, Sun D, He S, et al. Cancer statistics in China and united states, 2022: profiles, trends, and determinants. Chin Med J (Engl) (2022) 135(5):584–90. doi: 10.1097/CM9.0000000000002108
3. Goldhirsch A, Wood WC, Coates AS, Gelber RD, Thürlimann B, Senn HJ, et al. Strategies for subtypes–dealing with the diversity of breast cancer: Highlights of the st. gallen international expert consensus on the primary therapy of early breast cancer 2011. Ann Oncol (2011) 22(8):1736–47. doi: 10.1093/annonc/mdr304
4. Lam SW, Jimenez CR, Boven E. Breast cancer classification by proteomic technologies: Current state of knowledge. Cancer Treat Rev (2014) 40(1):129–38. doi: 10.1016/j.ctrv.2013.06.006
5. Huber KE, Carey LA, Wazer DE. Breast cancer molecular subtypes in patients with locally advanced disease: impact on prognosis, patterns of recurrence, and response to therapy. Semin Radiat Oncol (2009) 19(4):204–10. doi: 10.1016/j.semradonc.2009.05.004
6. Çelebi F, Pilancı KN, Ordu Ç, Agacayak F, Alco G, llgun S, et al. The role of ultrasonographic findings to predict molecular subtype, histologic grade, and hormone receptor status of breast cancer. Diagn Interv Radiol (2015) 21(6):448–53. doi: 10.5152/dir.2015.14515
7. Wu M, Ma J. Association between imaging characteristics and different molecular subtypes of breast cancer. Acad Radiol (2017) 24(4):426–34. doi: 10.1016/j.acra.2016.11.012
8. Pinker K, Shitano F, Sala E, Do RK, Young RJ, Wibmer AG, et al. Background, current role, and potential applications of radiogenomics. J Magn Reson Imaging (2018) 47(3):604–20. doi: 10.1002/jmri.25870
9. Gallivanone F, Panzeri MM, Canevari C, Losio C, Gianolli L, De Cobelli F, et al. Biomarkers from in vivo molecular imaging of breast cancer: Pretreatment 18F-FDG PET predicts patient prognosis, and pretreatment DWI-MR predicts response to neoadjuvant chemotherapy. MAGMA (2017) 30(4):359–73. doi: 10.1007/s10334-017-0610-7
10. Sutton EJ, Oh JH, Dashevsky BZ, Veeraraghavan H, Apte AP, Thakur SB, et al. Breast cancer subtype intertumor heterogeneity: MRI-based features predict results of a genomic assay. J Magn Reson Imaging (2015) 42(5):1398–406. doi: 10.1002/jmri.24890
11. Sutton EJ, Dashevsky BZ, Oh JH, Veeraraghavan H, Apte AP, Thakur SB, et al. Breast cancer molecular subtype classifier that incorporates MRI features. J Magn Reson Imaging (2016) 44(1):122–9. doi: 10.1002/jmri.25119
12. Hylton N. Dynamic contrast-enhanced magnetic resonance imaging as an imaging biomarker. J Clin Oncol (2006) 24(20):3293–8. doi: 10.1200/JCO.2006.06.8080
13. Bhooshan N, Giger ML, Jansen SA, Li H, Lan L, Newstead GM. Cancerous breast lesions on dynamic contrast-enhanced MR images: Computerized characterization for image-based prognostic markers. Radiology (2010) 254(3):680–90. doi: 10.1148/radiol.09090838
14. Bhooshan N, Giger M, Edwards D, Yuan Y, Jansen S, Li H, et al. Computerized three-class classification of MRI-based prognostic markers for breast cancer. Phys Med Biol (2011) 56(18):5995–6008. doi: 10.1088/0031-9155/56/18/014
15. Braman NM, Etesami M, Prasanna P, Dubchuk C, Gilmore H, Tiwari P, et al. Intratumoral and peritumoral radiomics for the pretreatment prediction of pathological complete response to neoadjuvant chemotherapy based on breast DCE-MRI. Breast Cancer Res (2017) 19(1):57. doi: 10.1186/s13058-017-0846-1
16. Wu J, Gong G, Cui Y, Li R. Intratumor partitioning and texture analysis of dynamic contrast-enhanced (DCE)-MRI identifies relevant tumor subregions to predict pathological response of breast cancer to neoadjuvant chemotherapy. J Magn Reson Imaging (2016) 44(5):1107–15. doi: 10.1002/jmri.25279
17. Fan M, Wu G, Cheng H, Zhang J, Shao G, Li L. Radiomic analysis of DCE-MRI for prediction of response to neoadjuvant chemotherapy in breast cancer patients. Eur J Radiol (2017) 94:140–7. doi: 10.1016/j.ejrad.2017.06.019
18. Zhu Y, Li H, Guo W, Drukker K, Lan L, Giger ML, et al. Deciphering genomic underpinnings of quantitative MRI-based radiomic phenotypes of invasive breast carcinoma. Sci Rep (2015) 5:17787. doi: 10.1038/srep17787
19. Li H, Zhu Y, Burnside ES, Drukker K, Hoadley KA, Fan C, et al. MR imaging radiomics signatures for predicting the risk of breast cancer recurrence as given by research versions of MammaPrint, oncotype DX, and PAM50 gene assays. Radiology (2016) 281(2):382–91. doi: 10.1148/radiol.2016152110
20. Lee JY, Lee KS, Seo BK, Cho KR, Woo OH, Song SE, et al. Radiomic machine learning for predicting prognostic biomarkers and molecular subtypes of breast cancer using tumor heterogeneity and angiogenesis properties on MRI. Eur Radiol (2022) 32(1):650–60. doi: 10.1007/s00330-021-08146-8
21. Ma W, Zhao Y, Ji Y, Guo X, Jian X, Liu P, et al. Breast cancer molecular subtype prediction by mammographic radiomic features. Acad Radiol (2019) 26(2):196–201. doi: 10.1016/j.acra.2018.01.023
22. Monti S, Aiello M, Incoronato M, Grimaldi AM, Moscarino M, Mirabelli P, et al. DCE-MRI pharmacokinetic-based phenotyping of invasive ductal carcinoma: A radiomic study for prediction of histological outcomes. Contrast Media Mol Imaging (2018) 2018:5076269. doi: 10.1155/2018/5076269
23. Braman N, Prasanna P, Whitney J, Singh S, Beig N, Etesami M, et al. Association of peritumoral radiomics with tumor biology and pathologic response to preoperative targeted therapy for HER2 (ERBB2)-positive breast cancer. JAMA Netw Open (2019) 2(4):e192561. doi: 10.1001/jamanetworkopen.2019.2561
24. Goldhirsch A, Winer EP, Coates AS, Gelber RD, Piccart-Gebhart M, Thürlimann B, et al. Personalizing the treatment of women with early breast cancer: highlights of the St gallen international expert consensus on the primary therapy of early breast cancer 2013. Ann Oncol (2013) 24(9):2206–23. doi: 10.1093/annonc/mdt303
25. Mahrooghy M, Ashraf AB, Daye D, McDonald ES, Rosen M, Mies C, et al. Pharmacokinetic tumor heterogeneity as a prognostic biomarker for classifying breast cancer recurrence risk. IEEE Trans BioMed Eng (2015) 62(6):1585–94. doi: 10.1109/TBME.2015.2395812
26. Waugh SA, Purdie CA, Jordan LB, Vinnicombe S, Lerski RA, Martin P, et al. Magnetic resonance imaging texture analysis classification of primary breast cancer. Eur Radiol (2016) 26(2):322–30. doi: 10.1007/s00330-015-3845-6
27. Tagliafico AS, Valdora F, Mariscotti G, Durando M, Nori J, LaForgia D, et al. An exploratory radiomics analysis on digital breast tomosynthesis in women with mammographically negative dense breasts. Breast (2018) 40:92–6. doi: 10.1016/j.breast.2018.04.016
28. Fan M, Li H, Wang S, Zheng B, Zhang J, Li L. Radiomic analysis reveals DCE-MRI features for prediction of molecular subtypes of breast cancer. PloS One (2017) 12(2):e0171683. doi: 10.1371/journal.pone.0171683
29. Just N. Improving tumour heterogeneity MRI assessment with histograms. Br J Cancer (2014) 111(12):2205–13. doi: 10.1038/bjc.2014.512
30. King AD, Chow KK, Yu KH, Mo FK, Yeung DK, Yuan J, et al. Head and neck squamous cell carcinoma: diagnostic performance of diffusion-weighted MR imaging for the prediction of treatment response. Radiology (2013) 266(2):531–8. doi: 10.1148/radiol.12120167
31. Foroutan P, Kreahling JM, Morse DL, Grove O, Lloyd MC, Reed D, et al. Diffusion MRI and novel texture analysis in osteosarcoma xenotransplants predicts response to anti-checkpoint therapy. PLoS One (2013) 8(12):e82875. doi: 10.1371/journal.pone.0082875
32. Haupt B, Ro JY, Schwartz MR. Basal-like breast carcinoma: a phenotypically distinct entity. Arch Pathol Lab Med (2010) 134(1):130–3. doi: 10.5858/134.1.130
33. El Khouli RH, Macura KJ, Kamel IR, Jacobs MA, Bluemke DA. 3-T dynamic contrast-enhanced MRI of the breast: pharmacokinetic parameters versus conventional kinetic curve analysis. AJR Am J Roentgenol (2011) 197(6):1498–505. doi: 10.2214/AJR.10.4665
34. Papanikolaou N, Matos C, Koh DM. How to develop a meaningful radiomic signature for clinical use in oncologic patients. Cancer Imaging (2020) 20(1):33. doi: 10.1186/s40644-020-00311-4
35. Choy G, Khalilzadeh O, Michalski M, Do S, Samir AE, Pianykh OS, et al. Current applications and future impact of machine learning in radiology. Radiology (2018) 288(2):318–28. doi: 10.1148/radiol.2018171820
36. Park EK, Lee KS, Seo BK, Cho KR, Woo OH, Son GS, et al. Machine learning approaches to radiogenomics of breast cancer using low-dose perfusion computed tomography: Predicting prognostic biomarkers and molecular subtypes. Sci Rep (2019) 9(1):17847. doi: 10.1038/s41598-019-54371-z
37. Eun NL, Kang D, Son EJ, Park JS, Youk JH, Kim JA, et al. Texture analysis with 3.0-T MRI for association of response to neoadjuvant chemotherapy in breast cancer. Radiology (2020) 294(1):31–41. doi: 10.1148/radiol.2019182718
38. Parmar C, Grossmann P, Bussink J, Lambin P, Aerts HJWL. Machine learning methods for quantitative radiomic biomarkers. Sci Rep (2015) 5:13087. doi: 10.1038/srep13087
39. Zhang B, He X, Ouyang F, et al. Radiomic machine-learning classifiers for prognostic biomarkers of advanced nasopharyngeal carcinoma. Cancer Lett (2017) 403:21–7. doi: 10.1016/j.canlet.2017.06.004
40. Waljee AK, Higgins PD. Machine learning in medicine: a primer for physicians. Am J Gastroenterol (2010) 105(6):1224–6. doi: 10.1038/ajg.2010.173
41. Ayodele TO. Types of machine learning algorithms, New Advances in Machine Learning. Rijeka, Croatia: InTech Europe Press (2010) p. 24–25.
42. Denison DD, Hansen MH, Holmes CC, Mallick B. Editors. Nonlinear estimation and classification. Illinois: Springer Press (2001) p. 1–5.
43. Chen T, Guestrin C. XGBoost: A scalable tree boosting system, in: The 22nd ACM SIGKDD International Conference, New York. (2016) p. 785–94.
44. Leithner D, Horvat JV, Marino MA, Bernard-Davila B, Jochelson MS, Ochoa- Albiztegui RE, et al. Radiomic signatures with contrast-enhanced magnetic resonance imaging for the assessment of breast cancer receptor status and molecular subtypes: initial results. Breast Cancer Res (2019) 21(1):106. doi: 10.1186/s13058-019-1187-z
45. Li W, Yu K, Feng C, Zhao D. Molecular subtypes recognition of breast cancer in dynamic contrast-enhanced breast magnetic resonance imaging phenotypes from radiomics data. Comput Math Methods Med (2019) 2019:6978650. doi: 10.1155/2019/6978650
46. Perou CM, Sørlie T, Eisen MB, vandeRijn M, Jeffrey SS, Rees CA, et al. Molecular portraits of human breast tumours. Nature (2000) 406(6797):747–52. doi: 10.1038/35021093
47. Ye DM, Wang HT, Yu T. The application of radiomics in breast MRI: A review. Technol Cancer Res Treat (2020) 19:1533033820916191. doi: 10.1177/1533033820916191
48. Lubner MG, Stabo N, Lubner SJ, del Rio AM, Song C, Halberg RB, et al. CT textural analysis of hepatic metastatic colorectal cancer: Pre-treatment tumor heterogeneity correlates with pathology and clinical outcomes. Abdom Imaging (2015) 40(7):2331–7. doi: 10.1007/s00261-015-0438-4
49. Trebeschi S, Drago SG, Birkbak NJ, Kurilova I, Cč lin AM, Delli Pizzi A, et al. Predicting response to cancer immunotherapy using noninvasive radiomic biomarkers. Ann Oncol (2019) 30(6):998–1004. doi: 10.1093/annonc/mdz108
50. Onishi N, Sadinski M, Hughes MC, Ko ES, Gibbs P, Gallagher KM, et al. Ultrafast dynamic contrast-enhanced breast MRI may generate prognostic imaging markers of breast cancer. Breast Cancer Res (2020) 22(1):58. doi: 10.1186/s13058-020-01292-9
51. Shin SU, Cho N, Kim SY, Lee SH, Chang JM, Moon WK. Time-to-enhancement at ultrafast breast DCE-MRI: potential imaging biomarker of tumour aggressiveness. Eur Radiol (2020) 30(7):4058–68. doi: 10.1007/s00330-020-06693-0
Keywords: molecular subtypes, MRI, radiomics, breast cancer, three-dimension, machine learning
Citation: Sheng W, Xia S, Wang Y, Yan L, Ke S, Mellisa E, Gong F, Zheng Y and Tang T (2022) Invasive ductal breast cancer molecular subtype prediction by MRI radiomic and clinical features based on machine learning. Front. Oncol. 12:964605. doi: 10.3389/fonc.2022.964605
Received: 08 June 2022; Accepted: 11 August 2022;
Published: 12 September 2022.
Edited by:
Daniele Generali, University of Trieste, ItalyReviewed by:
Tapas Si, Bankura Unnayani Institute of Engineering, IndiaZhenggui Du, Sichuan University, China
Copyright © 2022 Sheng, Xia, Wang, Yan, Ke, Mellisa, Gong, Zheng and Tang. This is an open-access article distributed under the terms of the Creative Commons Attribution License (CC BY). The use, distribution or reproduction in other forums is permitted, provided the original author(s) and the copyright owner(s) are credited and that the original publication in this journal is cited, in accordance with accepted academic practice. No use, distribution or reproduction is permitted which does not comply with these terms.
*Correspondence: Yun Zheng, enlraWtpQHllYWgubmV0; Tiansheng Tang, dHRzMjAyMTA4MTlAMTYzLmNvbQ==
†These authors have contributed equally to this work