 Jingxiang Shi
 Sifan Liu
 Jisen Cao
 Shigang Shan
 Jinjuan Zhang1,4*
94% of researchers rate our articles as excellent or good
Learn more about the work of our research integrity team to safeguard the quality of each article we publish.
Find out more
ORIGINAL RESEARCH article
Front. Oncol. , 04 October 2022
Sec. Gastrointestinal Cancers: Colorectal Cancer
Volume 12 - 2022 | https://doi.org/10.3389/fonc.2022.962381
This article is part of the Research Topic Methods in Gastrointestinal Cancers View all 51 articles
Background: The prediction models for primary duodenal adenocarcinoma (PDA) are deficient. This study aimed to determine the predictive value of the lymph node ratio (LNR) in PDA patients and to establish and validate nomograms for predicting overall survival (OS) and cancer-specific survival (CSS) for PDAs after surgical resection.
Methods: We extracted the demographics and clinicopathological information of PDA patients between 2004 and 2018 from the Surveillance, Epidemiology and End Results database. After screening cases, we randomly divided the enrolled patients into training and validation groups. X-tile software was used to obtain the best cut-off value for the LNR. Univariate and multivariate Cox analyses were used in the training group to screen out significant variables to develop nomograms. The predictive accuracy of the nomograms was evaluated by the concordance index (C-index), calibration curves, area under the receiver operating characteristic curve (AUC) and decision curve analysis (DCA). Finally, four risk groups were created based on quartiles of the model scores.
Results: A total of 978 patients were included in this study. The best cut-off value for the LNR was 0.47. LNR was a negative predictive factor for both OS and CSS. Age, sex, grade, chemotherapy and LNR were used to construct the OS nomogram, while age, grade, chemotherapy, the number of lymph nodes removed and LNR were incorporated into the CSS nomogram. The C-index, calibration curves and AUC of the training and validation sets revealed their good predictability. DCA showed that the predictive value of the nomograms was superior to that of the American Joint Committee on Cancer (AJCC) TNM staging system (8th edition). In addition, risk stratification demonstrated that patients with higher risk correlated with poor survival.
Conclusions: The LNR was an adverse prognostic determinant for PDAs. The nomograms provided an accurate and applicable tool to evaluate the prognosis of PDA patients after surgery.
Primary duodenal adenocarcinoma (PDA), which arises from duodenal mucosal glandular epithelial cells, is a rare malignant tumour (1). According to epidemiological investigation, its incidence is no more than 0.5 in 100,000, accounting for only 0.5% of all gastrointestinal tumours (2, 3). The majority of PDAs occur in the second portion of the duodenum, followed by the first portion (4). Due to the adjacency of anatomical position and the same surgical approach, cancers from the head of pancreas, the distal common bile duct, the ampulla of Vater and the descending portion of the duodenum called “periampullary carcinoma” have often been studied together (5). However, the biological features and prognosis of these tumours are different. Therefore, it is necessary to study PDA as a unique entity.
Surgical resection is the main curative treatment for PDAs (6). Pancreaticoduodenectomy or segmental resection is performed in most cases (7). One meta-analysis demonstrated that surgery might greatly improve survival compared with nonsurgery (5-year overall survival rate, 43.4% vs 2.5%) (8). Poultsides et al. (9) pointed out that the 5-year overall survival (OS) rate after resection of PDA was 48%. Another study indicated that the 5-year cancer-specific survival (CSS) rate after surgery was 43% (3). However, due to the low incidence of this disease and the small sample size of clinical research, there are few studies on prediction models for PDA patients after surgery.
The lymph node ratio (LNR), which refers to the proportion of positive lymph nodes in the total examined nodes, has shown its importance for the prognostic prediction of several malignancies in recent years. Zhou et al. (10) pointed out that the LNR was an important prognostic factor for non-small-cell lung cancer. Macedo et al. (11) indicated that the LNR was a better prognostic tool than the TNM system in colorectal cancer. Our previous study demonstrated that it was an important predictor of poor survival in pancreatic neuroendocrine tumours (12). However, there are no published reports about nomograms for predicting the survival of PDA patients combined with LNR data.
In this study, based on data from the Surveillance, Epidemiology, and End Results (SEER) database, we identified the effect of the LNR on the prognosis of patients with PDA. We further established and validated nomograms to predict 1-, 3-, and 5-year OS and CSS rates for PDAs after surgery.
The SEER database is a population-based database supported by the National Cancer Institute in the USA and contains a large amount of evidence-based medical data (13). We used SEER*Stat software (version 8.3.9.2) to extract data from the SEER database. The Incidence SEER Research Plus Data, 18 Registries, Nov 2020 Sub (2000–2018) dataset was selected for analysis (username for log in: 15881-Nov2020). Patients diagnosed with PDA between 2004 and 2018 were confirmed retrospectively. The selection parameters in the software were as follows: Site and Morphology, “Primary Site – labelled” (C17.0-Duodenum) and “ICD-O-3 Hist/behav” (8140/3, 8143/3, 8144/3, 8210/3, 8211/3, 8220/3, 8221/3, 8255/3, 8260/3-8263/3, 8310/3, 8323/3, 8480/3, 8481/3, 8574/3, 8576/3). The extracted demographic variables included age, sex, patient ID, year of diagnosis, race and marital status. The corresponding clinicopathological variables were as follows: histologic type, grade, diagnostic confirmation, American Joint Committee on Cancer (AJCC) TNM staging system, T stage, N stage, M stage, tumour size, surgery at the primary site, scope of regional lymph node surgery, radiation recode, chemotherapy recode, regional nodes examined, positive regional nodes, survival months, SEER cause-specific death classification, vital status recode, first malignant primary indicator and sequence number.
The exclusion criteria were as follows: 1) patients who did not undergo surgery; 2) patients who did not have regional lymph nodes removed during surgery; 3) patients who had multiple primary tumours; and 4) missing or unknown clinical information.
We treated age as a continuous variable and other factors as categorical variables. Patients who were single, separated, divorced or widowed were regarded as unmarried. Tumour grade was defined as Grade I (well differentiated), Grade II (moderately differentiated), Grade III (poorly differentiated) and Grade IV (undifferentiated or anaplastic) according to the SEER tumour grade system. The TNM staging system was adjusted based on the eighth edition of AJCC. OS was defined as the time from the date of diagnosis to the date of death by any cause or last follow-up, and CSS was defined as the time from the date of diagnosis to the date of death caused by PDA (12).
The enrolled patients were randomly assigned to a training set and a validation set at a ratio of 7:3. For the training cohort, the “survival” package in R software was used for univariate and multivariate Cox regression analysis to screen significant variables (14). After that, the “rms” package was used to construct nomograms based on the results of multivariate analysis (14). The validation cohort was treated as an external validation of the nomograms.
We calculated the concordance index (C-index) and the area under the receiver operating characteristic curve (AUC) of the training and validation groups to evaluate the discrimination ability of the nomograms (15). Calibration curves were plotted to assess the calibration ability (16). In addition, we used decision curve analysis (DCA) to evaluate the clinical usefulness of the nomograms (17). Furthermore, DCA was performed to compare the AJCC staging system (8th edition), LNR and the nomograms.
Statistical analyses were performed as described in our previous study (12). Continuous variables were reported as the mean with standard deviation. Categorical variables were presented as frequencies and percentages. X-tile software was used to determine the optimal cut-off value of the LNR (18). Survival curves (for both OS and CSS) were generated using the Kaplan–Meier method, and the differences in groups were analysed using the log-rank test. Variables with P < 0.2 in univariate analysis were considered for generating multivariate analysis. Factors with P < 0.05 in multivariate analysis were entered into the nomograms. Corresponding 95% confidence intervals (CIs) and hazard ratios (HRs) were calculated. We used Pearson’s correlation to detect collinearity among the variables. A correlation coefficient < 0.7 between two variables was regarded as no multicollinearity (19). P < 0.05 was defined as statistically significant. All statistical tests were performed using R statistical software (version 4.1.2, https://www.r-project.org, Vienna, Austria).
From 2004 to 2018, a total of 978 eligible patients from the SEER database were included in this study. Among them, 685 cases were randomly allocated to the training group, while 293 cases were allocated to the validation group. The study procedure is shown in Figure 1. The demographic and clinicopathological characteristics of the enrolled patients are summarized in Table 1. For the overall group, the median age was 65 years, and the median follow-up time was 38 months (range, 1-179 months). By the end of the last follow-up, 326 patients (47.6%) had died from PDA, and 56 patients (8.2%) had died from other causes in the training set. For the validation set, the numbers were 138 (47.1%) and 26 (8.9%), respectively. The 1-, 3-, and 5-year OS rates for the training group and the validation group were 75.8%, 55.3%, 47.9% and 76.8%, 53.6%, 47.4%. The corresponding 1-, 3-, and 5-year CSS rates for the two groups were 79.1%, 61.0%, 54.5% and 80.9%, 60.8%, 55.3%, respectively. There were no significant differences between the two groups. The best cut-off value for the LNR was 0.47. Thus, we divided the total patients into three groups (LNR1: 0, LNR2: ≤ 0.47 and LNR3: > 0.47). Patients with a lower LNR were associated with better OS and CSS (Figures 2A, B).
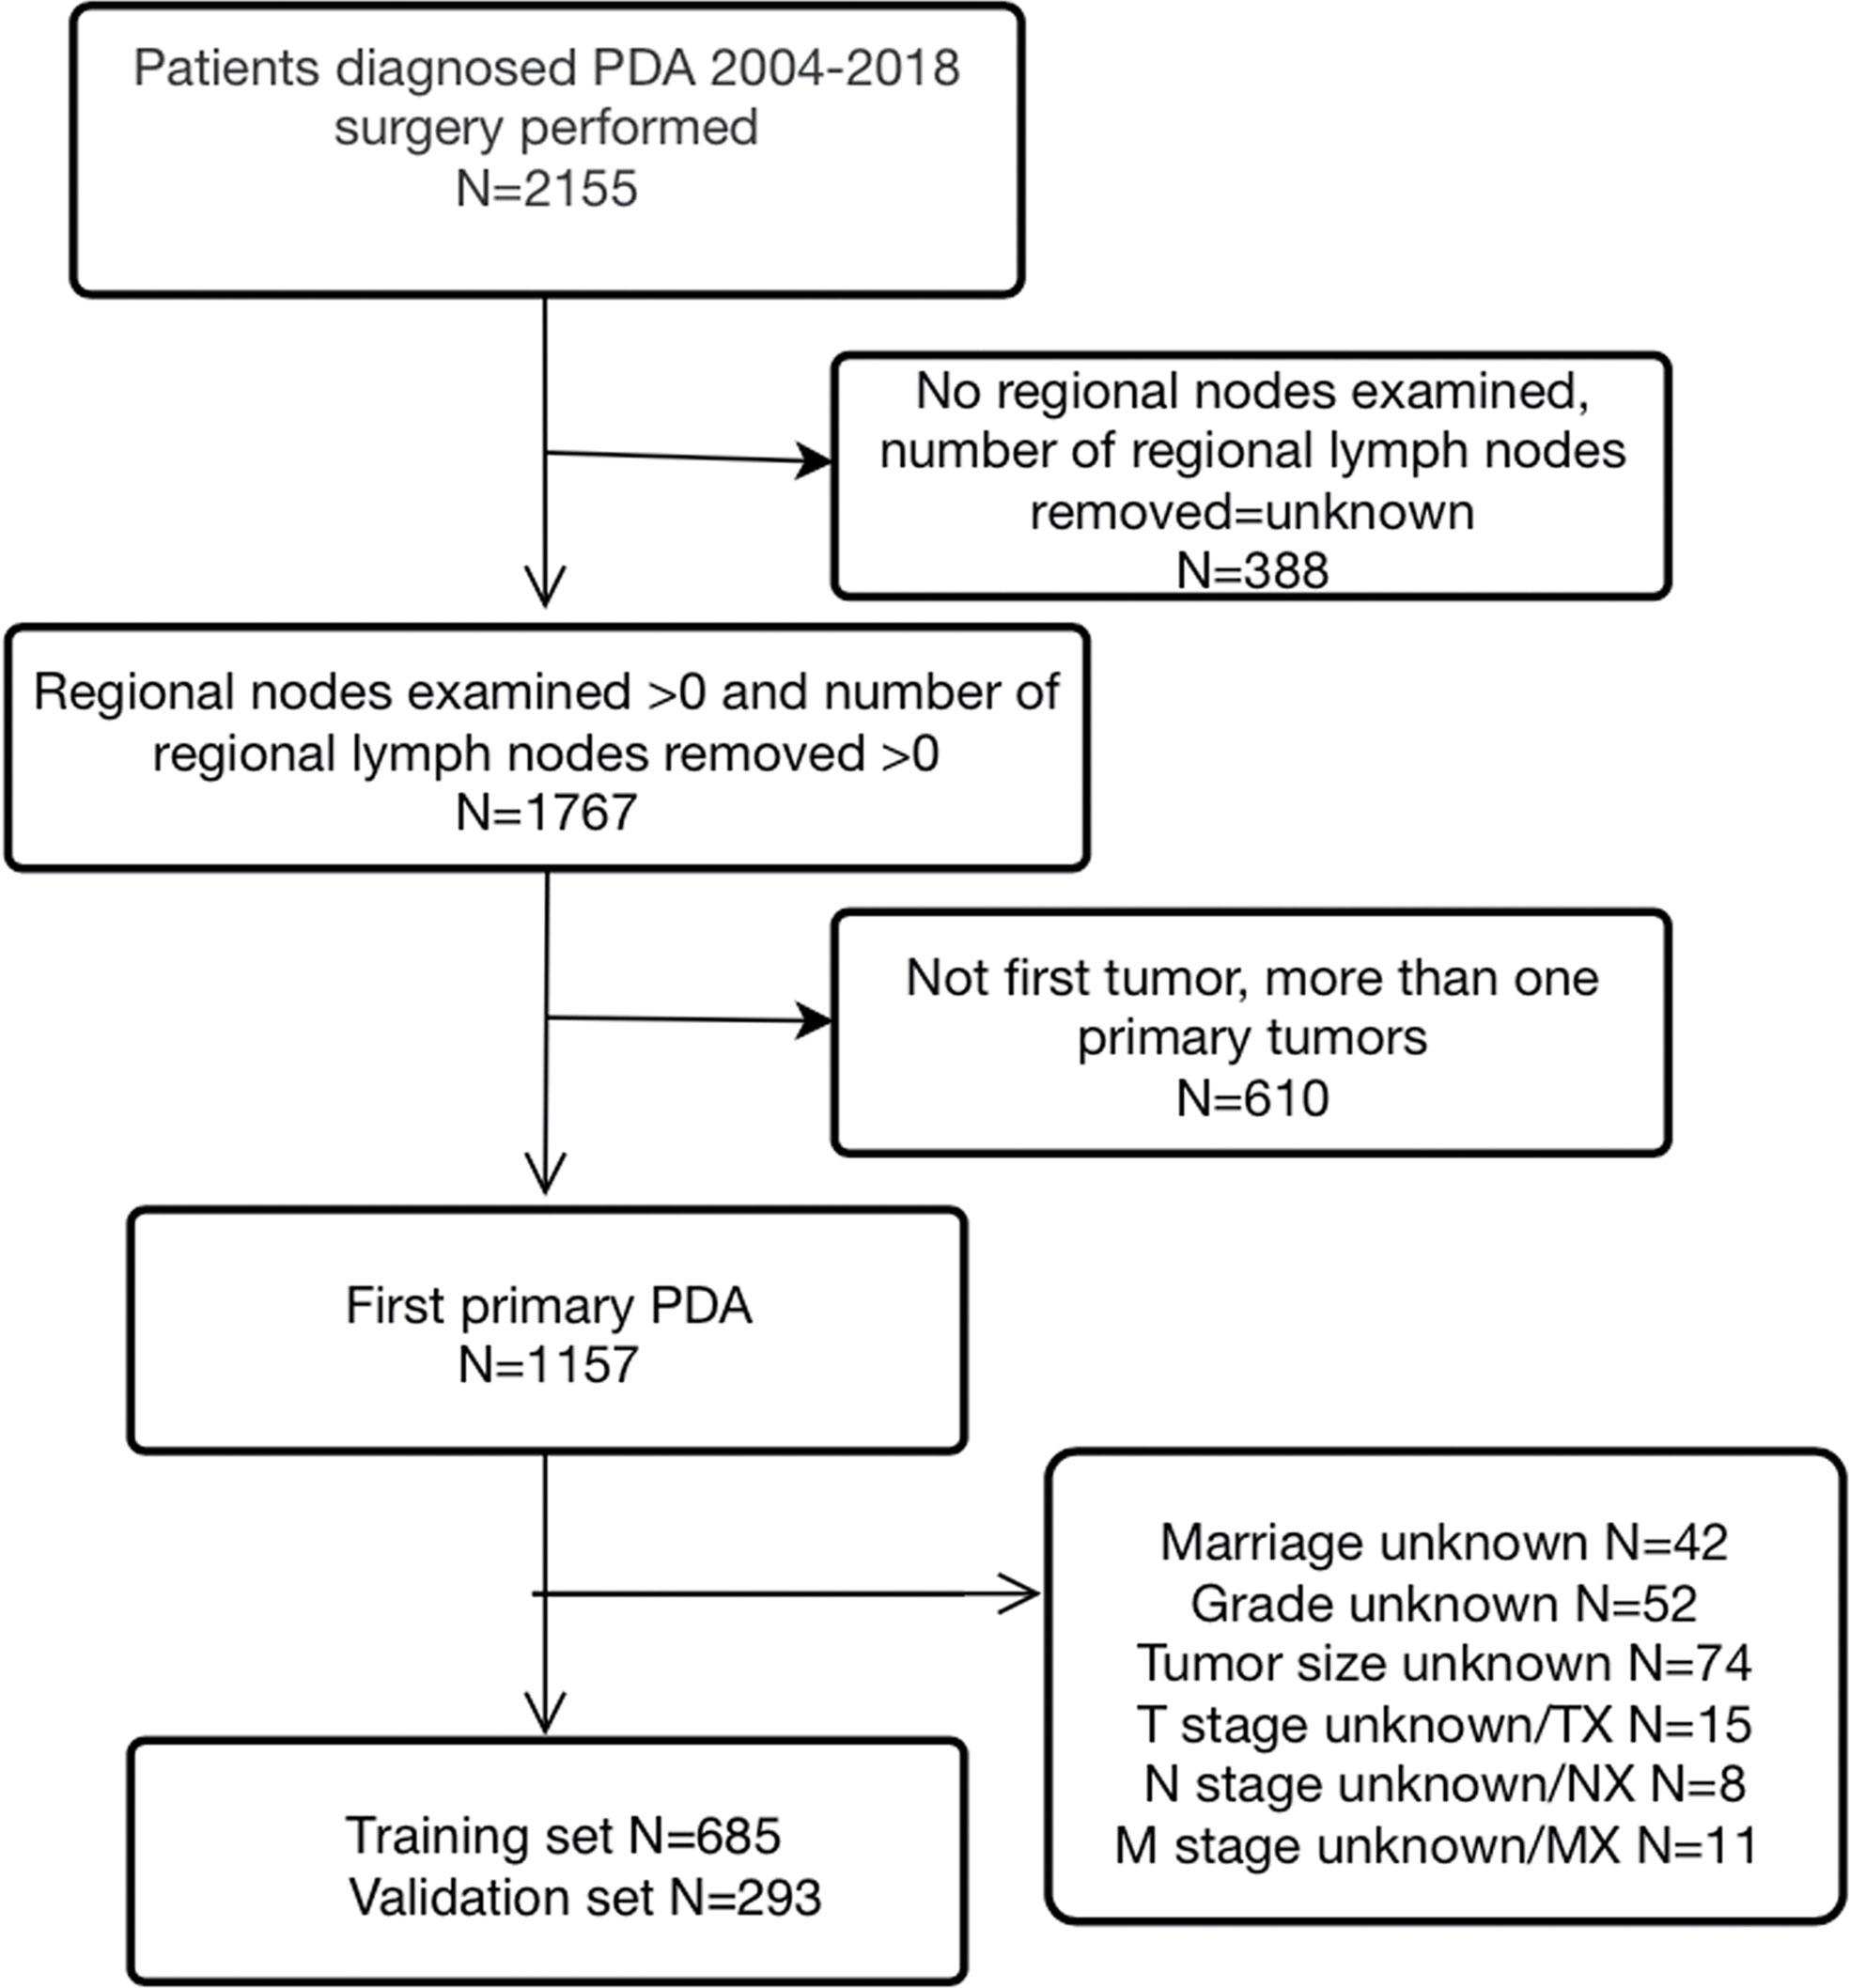
Figure 1 The flow chart of included patients.
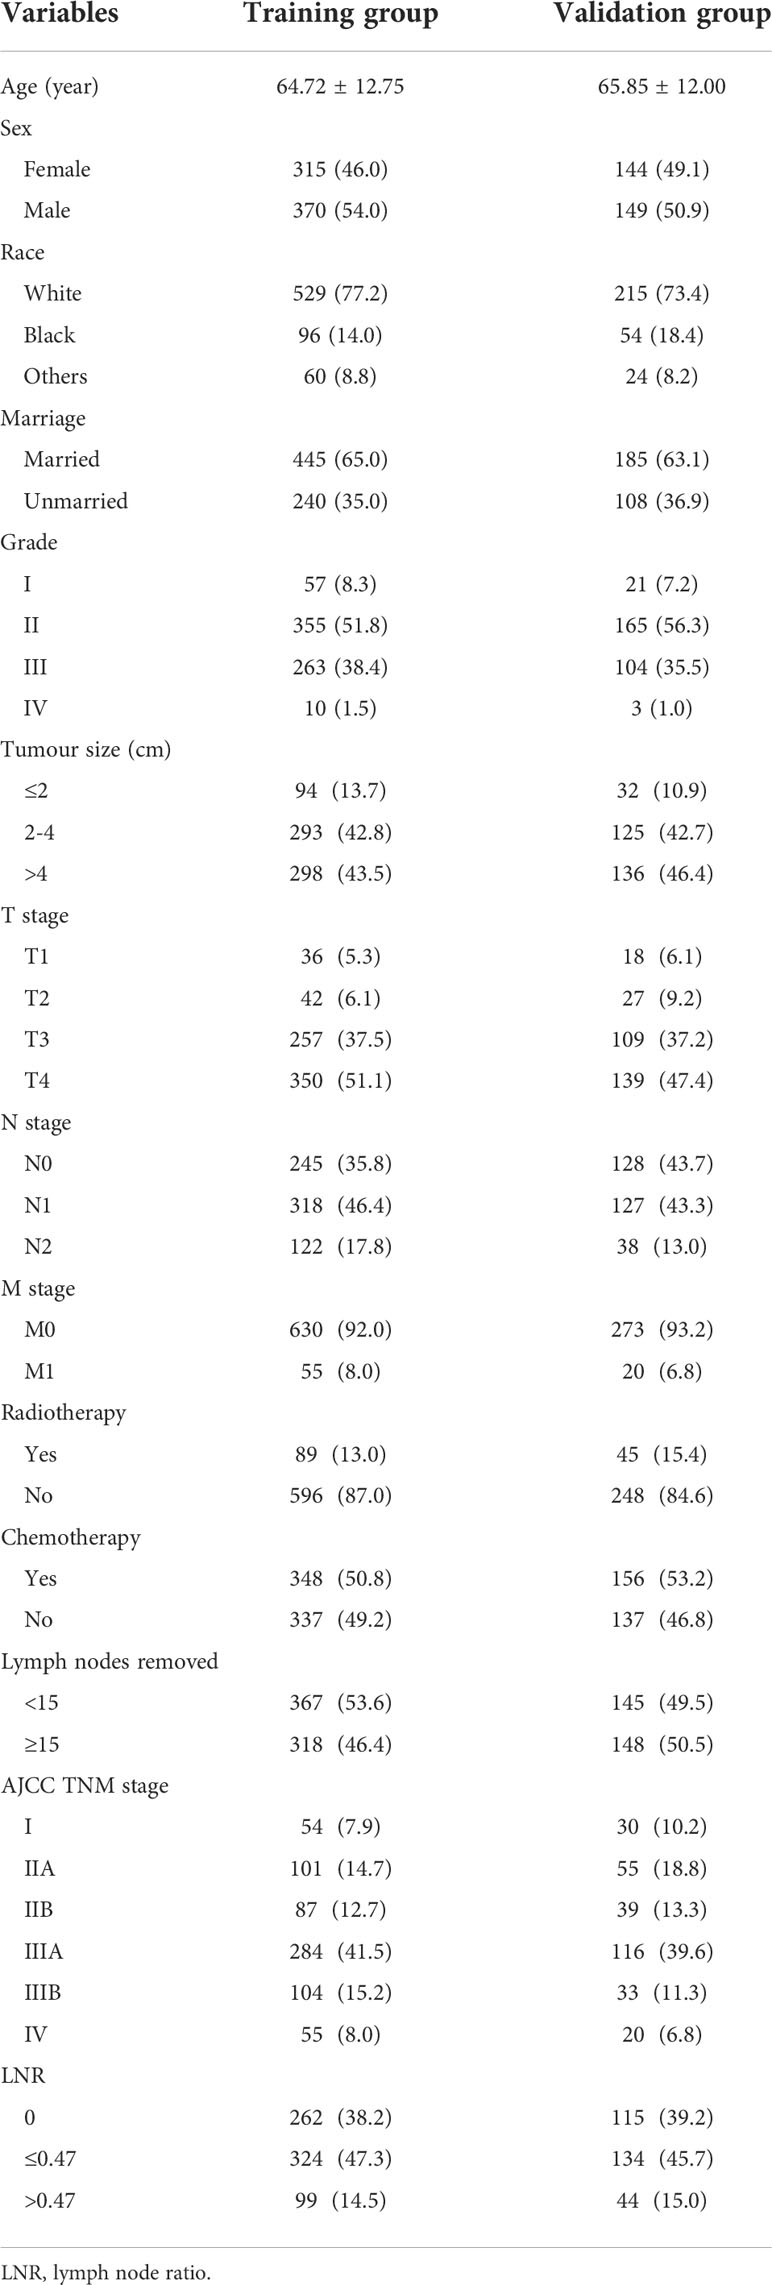
Table 1 Patient demographics and clinicopathological characteristics.
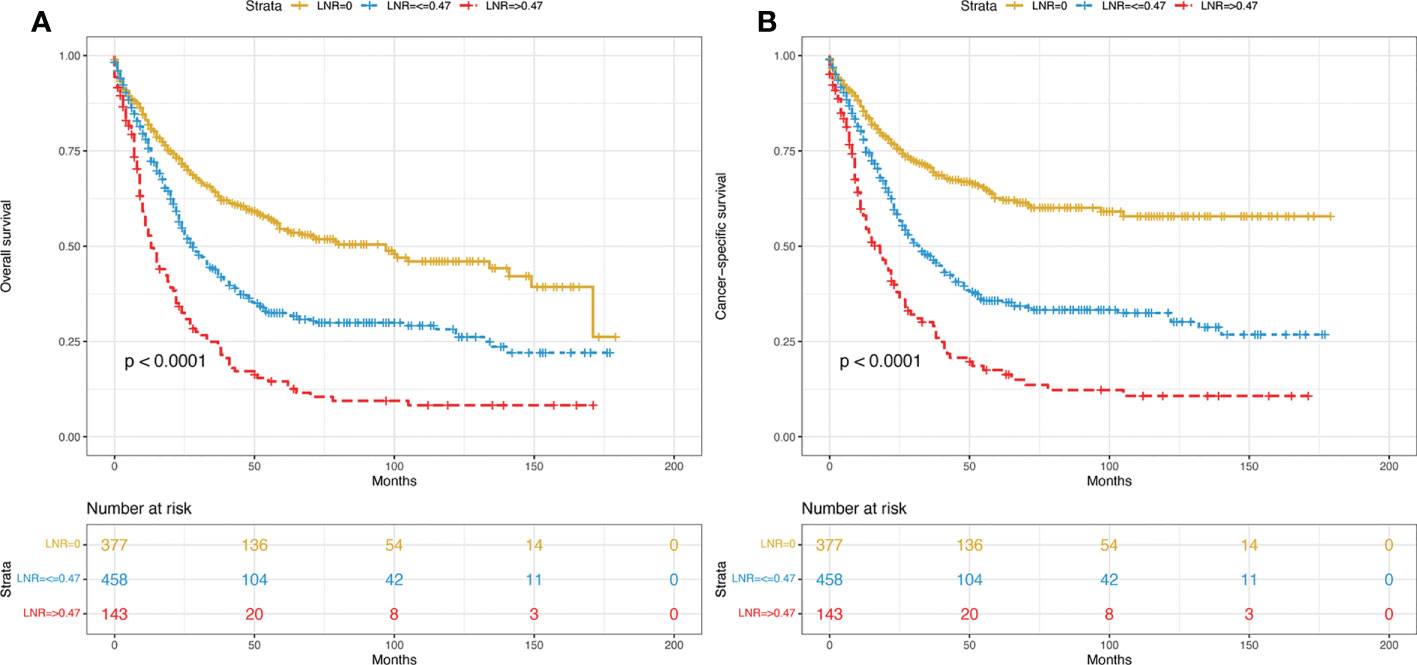
Figure 2 Kaplan–Meier curves of OS (A) and CSS (B) for all included patients stratified by LNR. OS, overall survival; CSS, cancer-specific survival; LNR, lymph node ratio.
For the training cohort, the following variables were included in the univariate analysis: age, sex, race, marital status, grade, tumour size, T stage, N stage, M stage, radiotherapy, chemotherapy, the number of lymph nodes removed and LNR. The factors with significant differences were incorporated into the multivariate Cox regression analysis. The multivariate analyses identified that age, sex, grade, chemotherapy and LNR were significantly associated with OS and that age, grade, chemotherapy, the number of lymph nodes removed and LNR were significantly associated with CSS (Tables 2, 3). Therefore, nomograms for predicting the 1-, 3-, and 5-year OS and CSS rates were established based on these variables (Figures 3A, B). Each variable was given a score on the points scale. The survival probability of a patient can be easily calculated by adding the scores of each selected factor. There was no collinearity among the screened variables for the overall dataset, the training or the validation sets (Supplementary Figure S1).
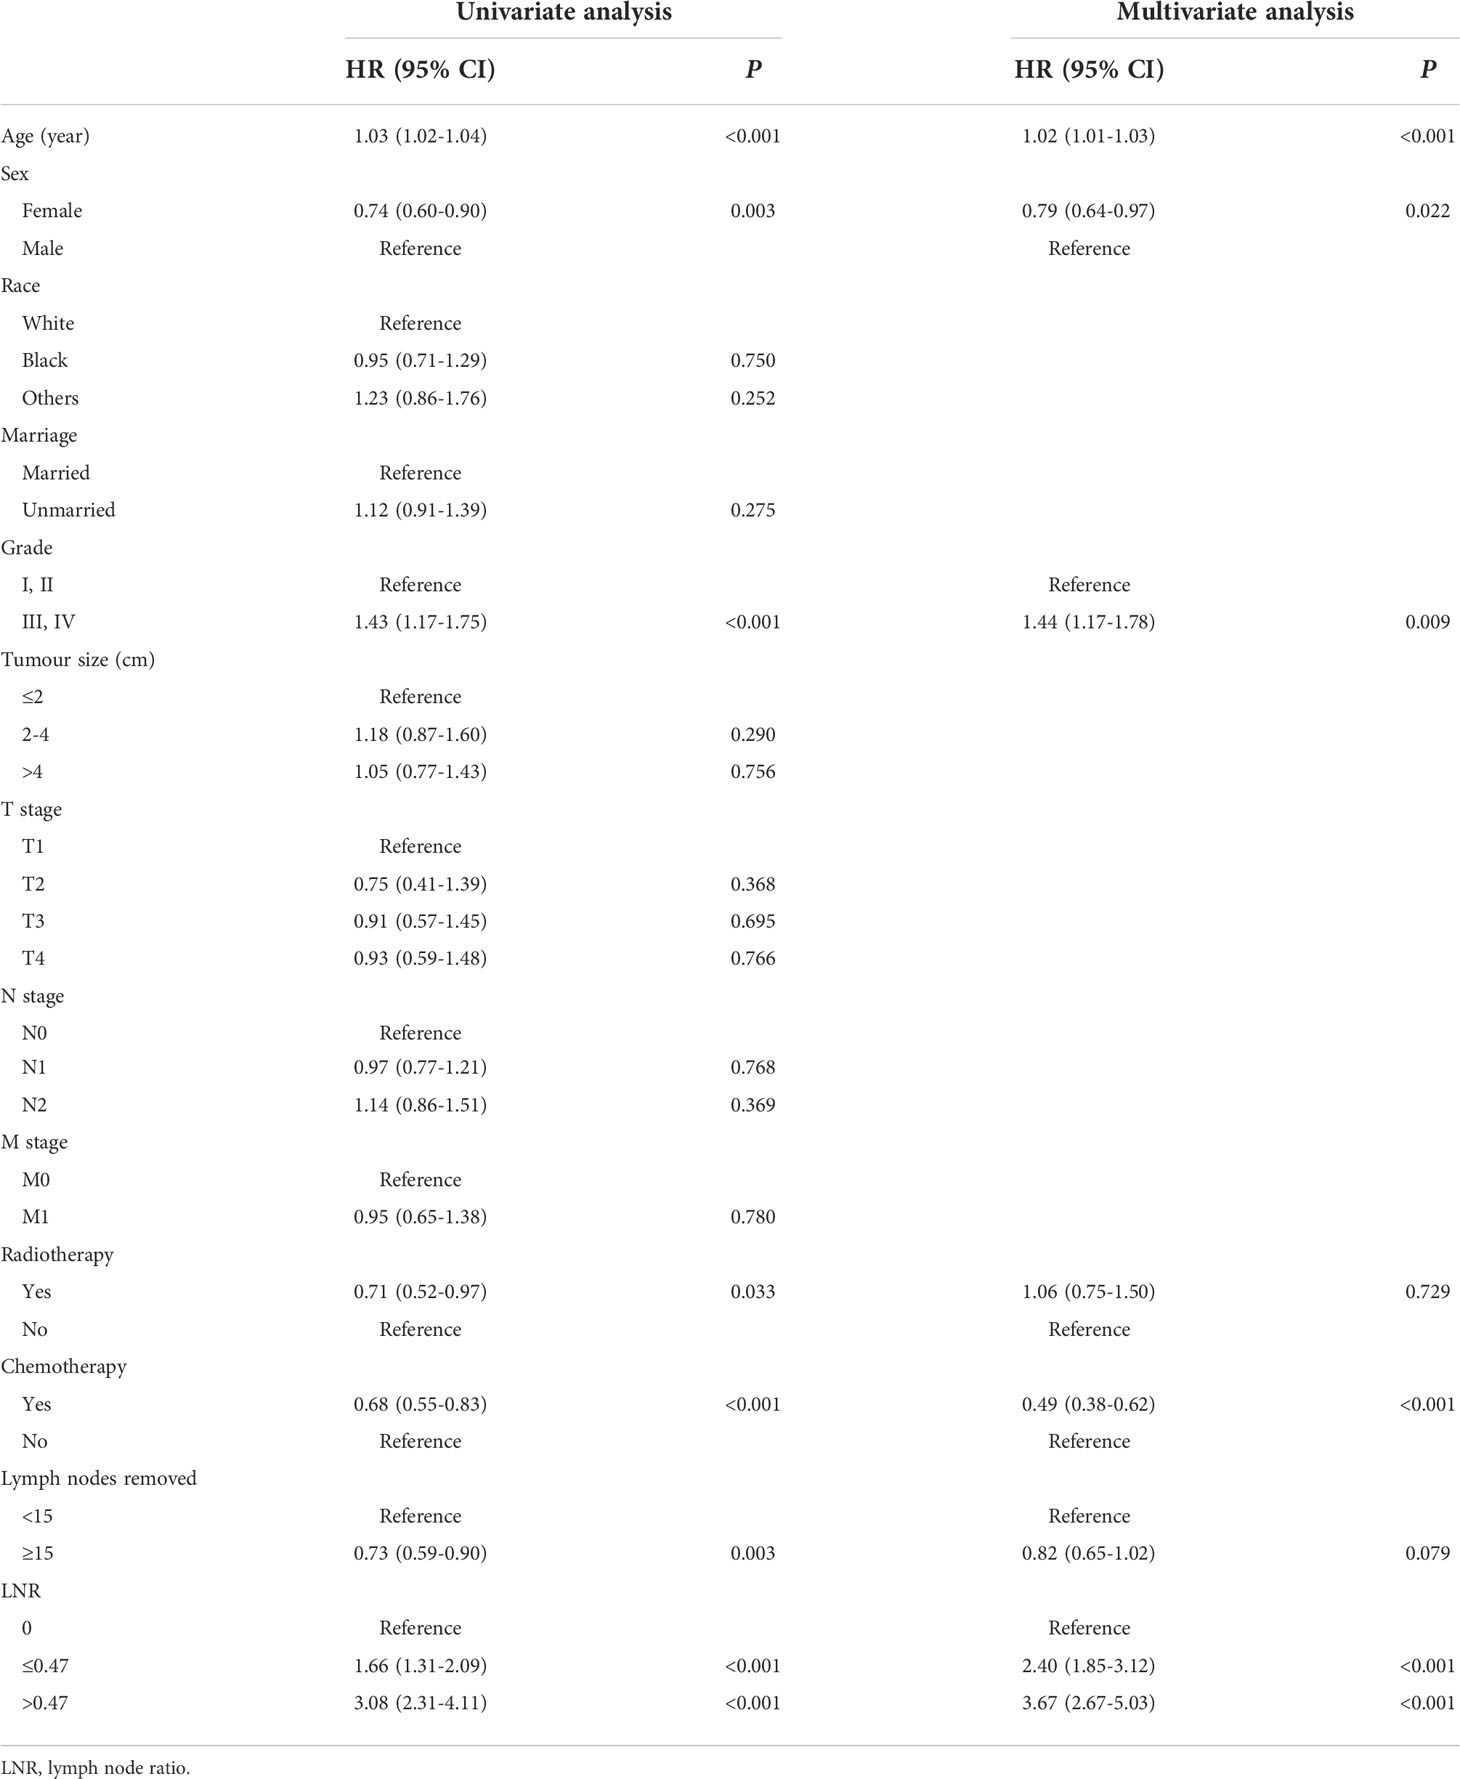
Table 2 Univariate and multivariate analysis of overall survival (OS) in the training set.
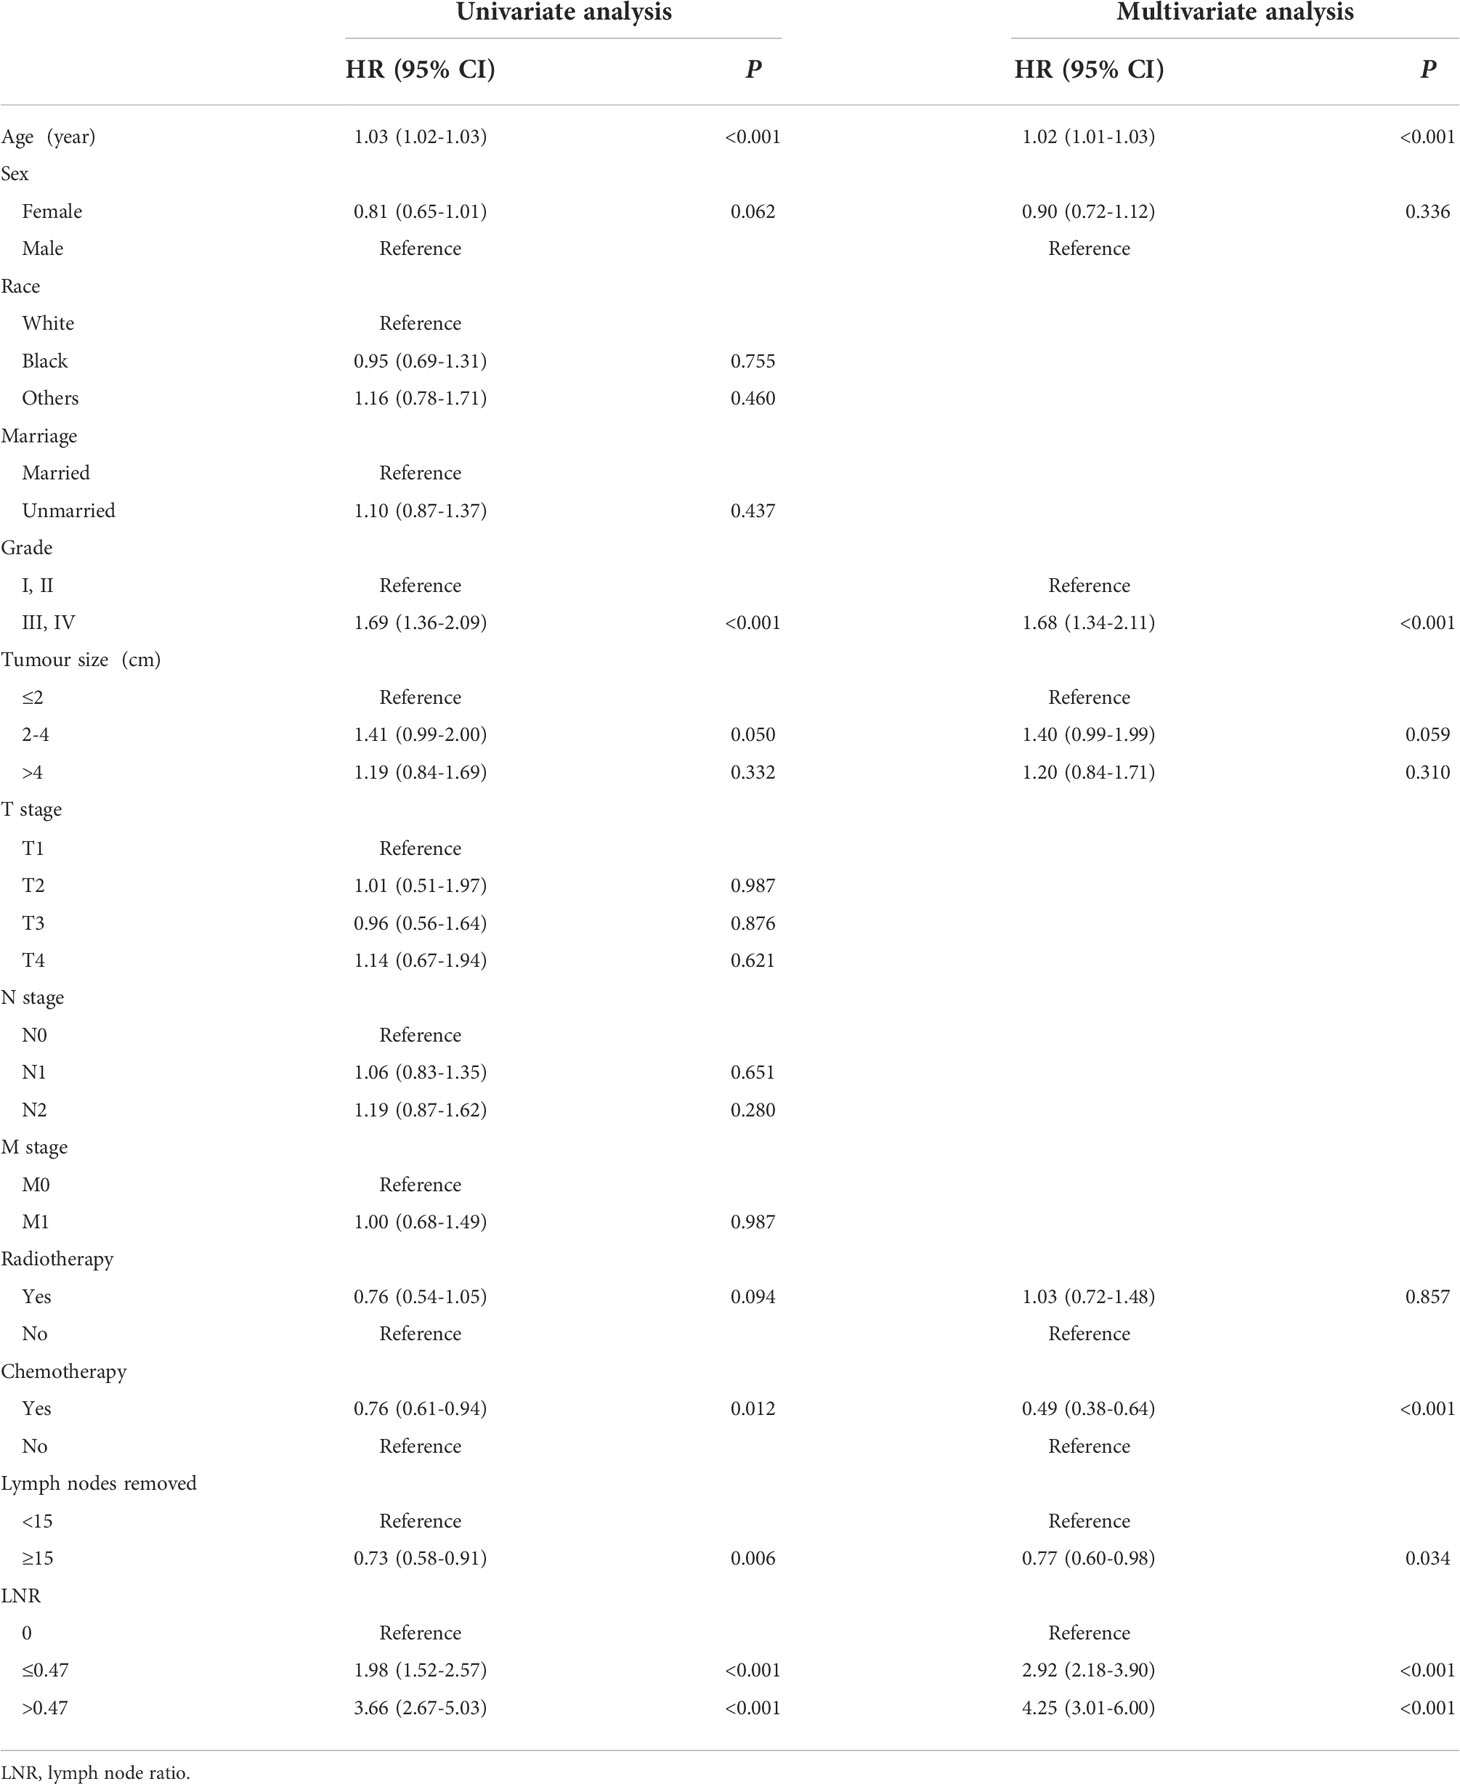
Table 3 Univariate and multivariate analysis of cancer-specific survival (CSS) in the training set.
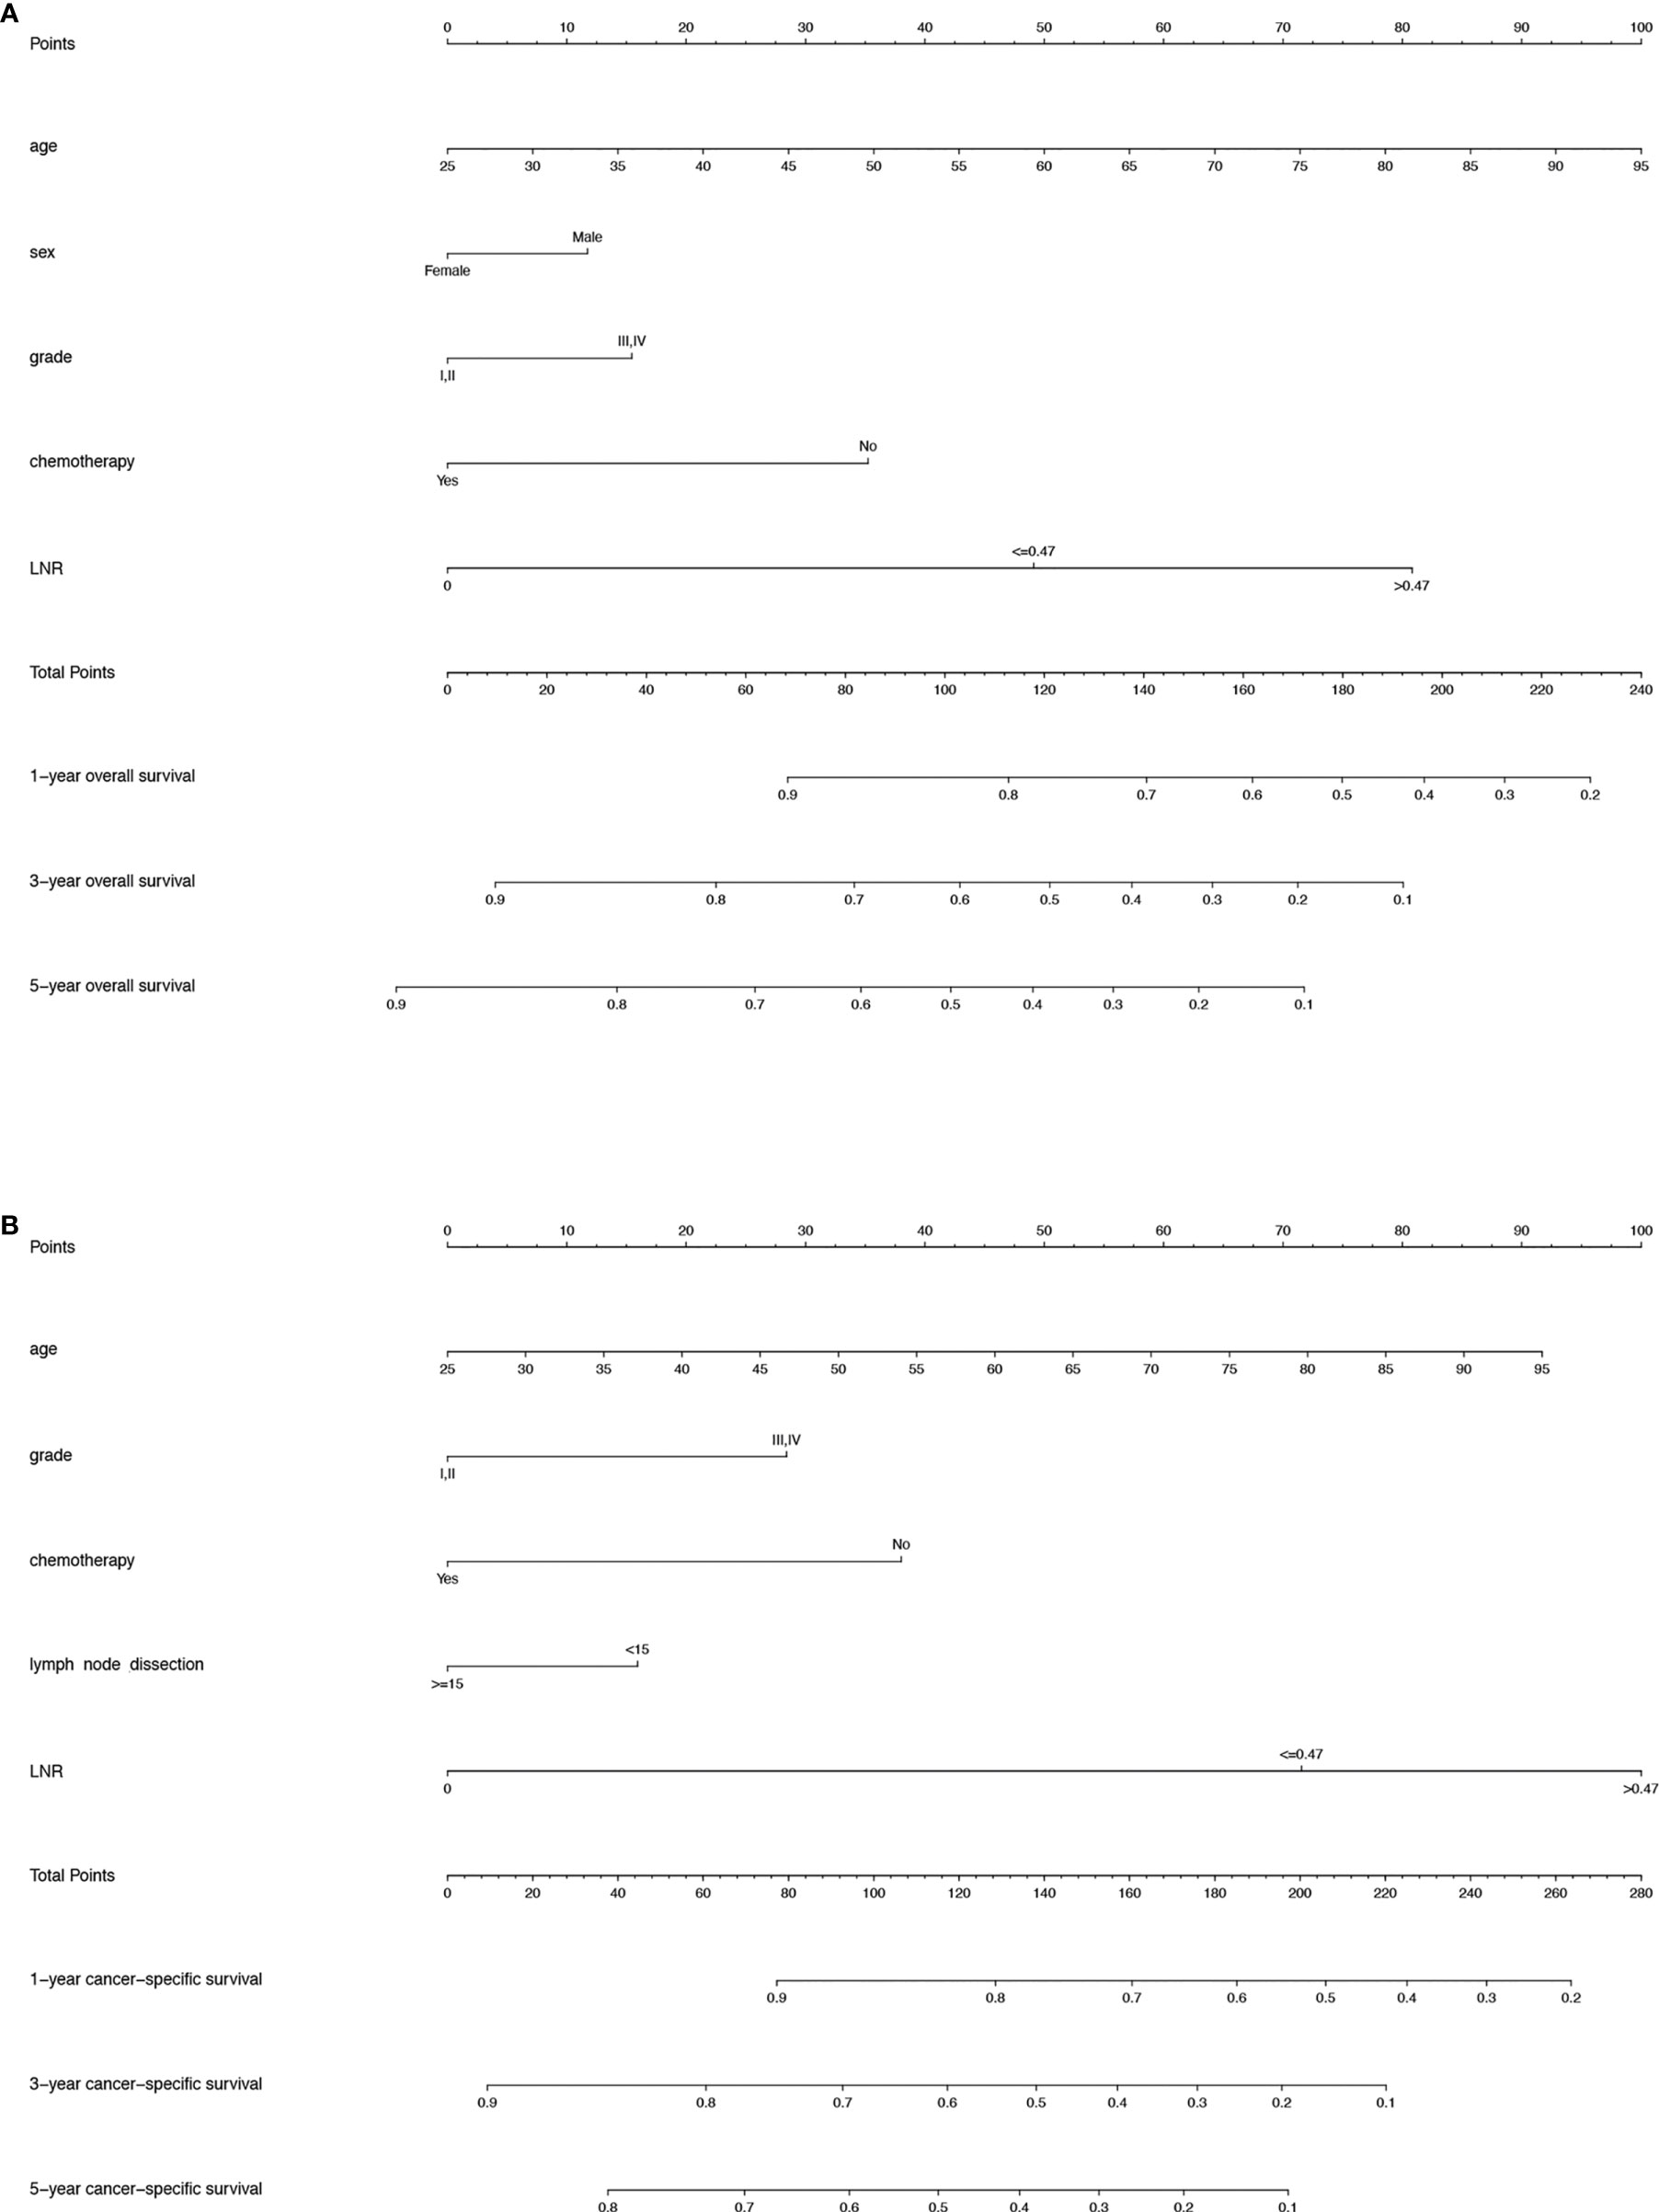
Figure 3 (A) Nomogram predicting the 1-, 3- and 5-year OS rates for PDA patients after surgery. (B) Nomogram predicting the 1-, 3- and 5-year CSS rates for PDA patients after surgery. OS, overall survival; PDA, primary duodenal adenocarcinoma; CSS, cancer-specific survival.
We performed internal and external verification of the two nomograms. In the internal validation, the C-index for OS prediction was 0.697 (95% CI, 0.670 to 0.724), while for CSS, it was 0.700 (95% CI, 0.671 to 0.729). In the external validation, the C-index for OS prediction was 0.669 (95% CI, 0.629 to 0.709), while for CSS, it was 0.674 (95% CI, 0.626 to 0.722). The calibration curves of the OS nomogram showed high consistency between the predicted and observed survival probability in both the training (Figure 4A) and validation (Figure 4E) cohorts. Similarly, the calibration plots of the CSS nomogram were close to the standard curves in the two sets (Figures 5A, E). The AUC values for predicting 1-, 3-, and 5-year OS rates were 0.767, 0.717 and 0.704 in the training group (Supplementary Figure S2A) and 0.705, 0.722 and 0.715 in the validation group (Supplementary Figure S2B). With regard to the 1-, 3-, and 5-year CSS rates, the AUC values were 0.762, 0.733 and 0.703 in the training group (Supplementary Figure S2C) and 0.764, 0.715 and 0.706 in the validation group (Supplementary Figure S2D). For both the training and validation sets, the DCA curves for OS (Figures 4B–D, F–H) and CSS (Figures 5B-D, F-H) indicated that our nomograms exhibited optimal net benefit with a wider range of threshold probability compared to the AJCC staging system (8th edition), and LNR had good prediction ability regarding patient prognosis.
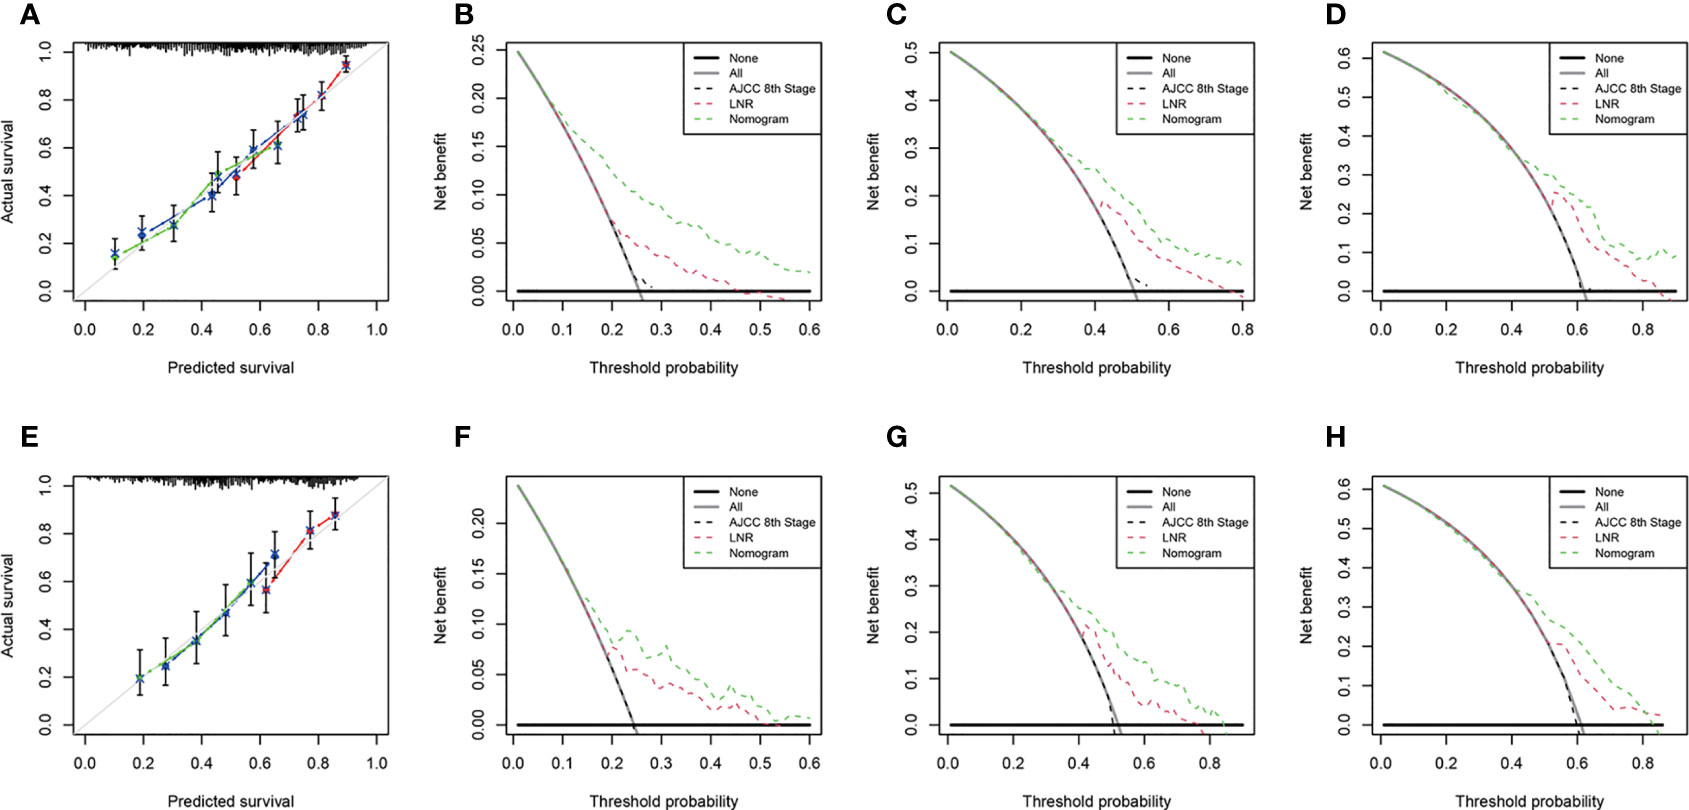
Figure 4 Calibration curves for OS prediction in the training cohort (A) and the validation cohort (E). Decision curve analysis of the AJCC 8th edition staging system, nomogram and LNR for the 1- (B), 3- (C) and 5-year (D) OS rates of PDA patients from the training cohort. Decision curve analysis of the AJCC 8th edition staging system, nomogram and LNR for the 1- (F), 3- (G) and 5-year (H) OS rates of PDA patients from the validation cohort. OS, overall survival; LNR, lymph node ratio; PDA, primary duodenal adenocarcinoma. For calibration curves, red, blue and green lines represent 1, 3, and 5 years, respectively.
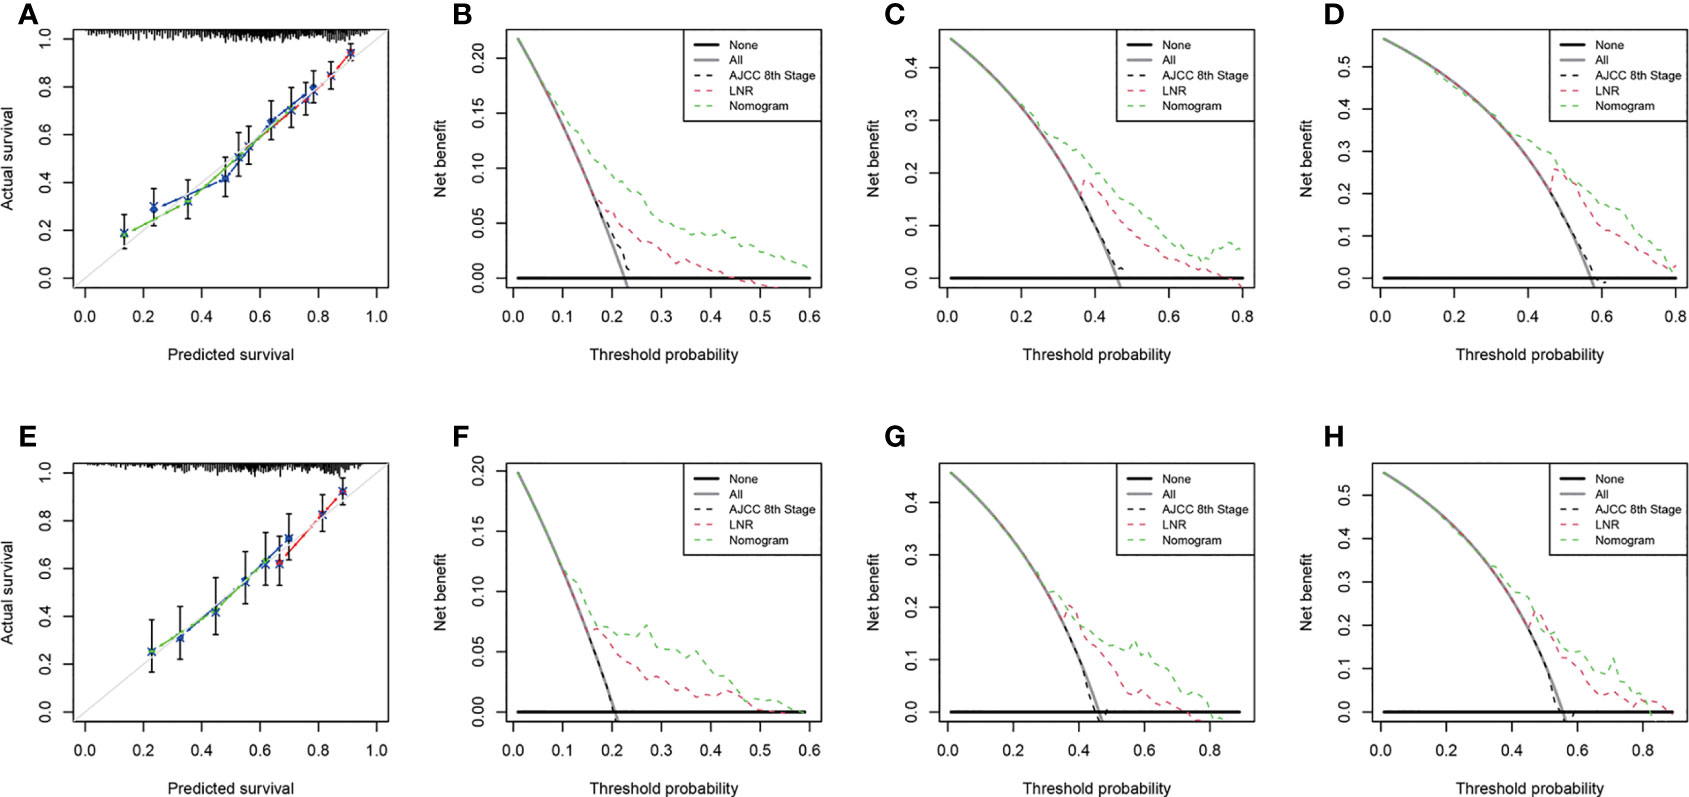
Figure 5 Calibration curves for CSS prediction in the training cohort (A) and the validation cohort (E). Decision curve analysis of the AJCC 8th edition staging system, nomogram and LNR for the 1- (B), 3- (C) and 5-year (D) CSS rates of PDA patients from the training cohort. Decision curve analysis of the AJCC 8th edition staging system, nomogram and LNR for the 1- (F), 3- (G) and 5-year (H) CSS rates of PDA patients from the validation cohort. CSS, cancer-specific survival; LNR, lymph node ratio; PDA, primary duodenal adenocarcinoma. For calibration curves, red, blue and green lines represent 1, 3, and 5 years, respectively.
Finally, we performed risk stratification for PDA patients based on the two established nomograms. They were categorized into four groups according to the scores for OS (Min-89.9, 89.9-111.4, 111.4-136.9, 136.9-Max) or the scores for CSS (Min-100.2, 100.2-126.3, 126.3-159.7, 159.7-Max). The Kaplan–Meier survival curves showed that statistically significant differences in OS (Figures 6A, B) and CSS (Figures 6C, D) were observed among the four different risk groups in both the training and validation sets.
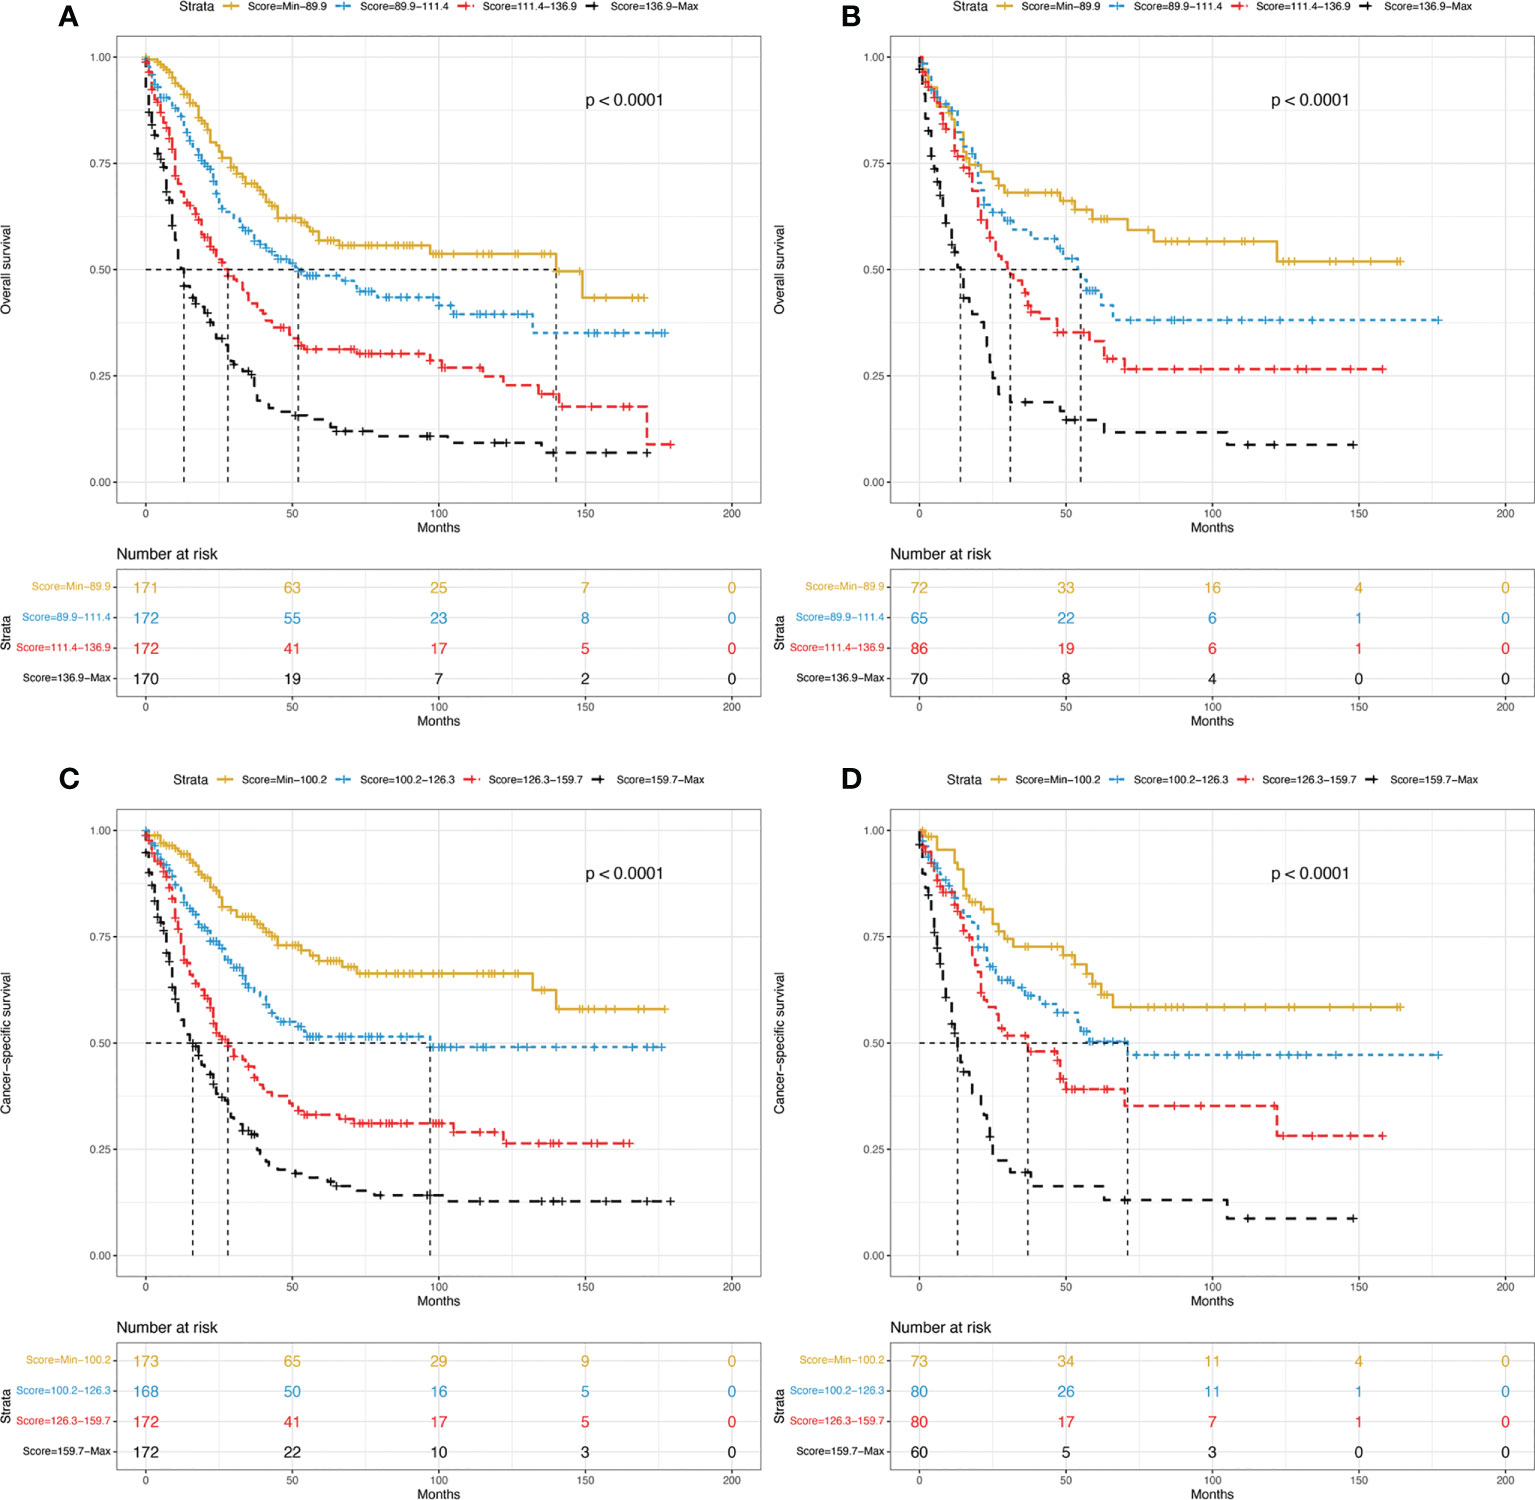
Figure 6 Kaplan–Meier curves of OS for the training group (A) and validation group (B) stratified by different risk scores. Kaplan–Meier curves of CSS for the training group (C) and validation group (D) stratified by different risk scores. OS, overall survival; CSS, cancer-specific survival.
PDA is a rare gastrointestinal malignancy. Patients are usually diagnosed at an advanced stage due to a lack of specific symptoms, which leads to adverse prognoses (3). Considering the low prevalence of this disease and the limited number of clinical studies, there is no consensus on prognostic factors. Therefore, we used a large dataset collected by the SEER program to identify the factors affecting the survival of PDA patients after surgery. Furthermore, we developed nomograms to predict OS and CSS for these patients. Given the significance of LNR, we analysed it separately and integrated it into the nomograms according to the multivariate Cox regression analysis. The relatively high C-indices and values of AUC in the training and validation sets demonstrated that the nomograms displayed good ability in predicting OS and CSS. The calibration curves showed excellent agreement between the predicted and actual survival, which further ensured their accuracy and reliability.
It is well established that lymph node status (yes/no presence of metastatic node) is an important prognostic determinant in PDA patients after operation. Sakamoto et al. (20) suggested that lymph node metastasis was a negative predictive factor for OS. Meijer et al. (21) reported that lymph node involvement correlated with poor survival. However, lymph node status ignores the different prognoses of lymph node-positive cases, which may lead to confusion in such patients. To overcome this limitation, LNR emerged as a substitute for lymph node status. Its effect on survival has been confirmed by many neoplasms, such as gastric, pancreatic, and ampullary cancer (22–24). With respect to PDA, Jensen et al. (25) pointed out that LNR > 0.2 was associated with increased mortality. Tran et al. (26) indicated that the LNR was an important predictor of lower OS. Liang et al. (27) identified that LNR > 0.4 was associated with decreased survival. Another study showed that patients with high LNR levels had shorter OS (9). Our study, in accordance with previous reports, demonstrated that LNR was an adverse independent prognostic factor for both OS and CSS. Furthermore, LNR may eliminate the variation in dissection techniques by different surgeons and the variation in specimen examination by different pathologists and is more accurate than lymph node status for prognosis prediction.
Apart from LNR, the proposed nomograms contain several other predictors, such as age, sex, grade, chemotherapy and the number of lymph nodes removed. Our research identified that older age was strongly associated with worse survival, as shown in other reports (3, 4, 28). Similar to the conclusion of Wang et al. (29), the mortality rate of women was lower than that of men. Moreover, histologic grade, which reflects the biological characteristics of tumour tissue, was also an important prognostic factor for PDA patients in our study. This was consistent with previous reports (3, 28, 30, 31). Ecker et al. (32) indicated that PDA patients with lymph node positivity after surgery could gain survival benefits from adjuvant chemotherapy. A similar effect was observed in our research. In addition, this study demonstrated that the number of lymph nodes examined ≥ 15 was associated with improved survival, which was also in accordance with the results of some investigations (20, 33, 34). The possible reason is that the number of lymph nodes removed affects not only the accuracy of N staging but also the therapeutic effect of lymphadenectomy to eradicate potentially hidden lesions in lymph nodes (20).
In the present study, we constructed and validated nomograms to predict 1-, 3-, and 5-year OS and CSS for PDA patients after surgery. The nomograms have the following advantages. First, their prediction ability was superior to that of the AJCC TNM staging system (8th edition). This is because our nomograms integrated not only clinicopathological variables but also demographic variables, which were more accurate than the TNM staging system. DCA curves confirmed this. Second, the variables used in the nomograms are easily obtained in clinical work. Therefore, by using the variable scores, clinicians may precisely assess the risk factors for patients and develop subsequent individualized treatment. A clear risk stratification of patients in different stages was demonstrated by survival curves. Third, the SEER database is a large and open database. Its information comes from 18 states in the US. Thus, the extracted data were rich, detailed and multicentric. Our results should be more applicable to the general population than studies from a single centre.
However, this study has several limitations. First, our nomograms were constructed based on the SEER database. SEER only includes information from American patients, which may not represent patients from all over the world. Second, some important parameters, such as surgical margin status, vascular invasion, chemotherapy regimens and radiation dose/technology, were unavailable in the SEER dataset. This may have an impact on some results.
In conclusion, this study demonstrated that the LNR is an independent risk indicator for PDAs. Based on the SEER database, we constructed nomograms to predict OS and CSS for PDAs after surgery. These nomograms could assist clinicians in making individualized predictions of patient survival and providing improved treatment suggestions.
The original contributions presented in the study are included in the article/Supplementary Material. Further inquiries can be directed to the corresponding authors.
All authors helped to perform the research; JS: performed the literature search and wrote the manuscript. SL and JC: performed data collection. SL and SS: contributed to statistical analysis. JZ and YW: contributed to revising the manuscript and study supervision. All authors contributed to the article and approved the submitted version.
This work was supported by the Tianjin Health Bureau under Grant (No. 2014KR04) and the Key Research Project of Tianjin Health and Family Planning Commission (No. 15KG114).
The authors sincerely thank the Surveillance, Epidemiology, and End Results (SEER) program for providing high-quality open resources for researchers.
The authors declare that the research was conducted in the absence of any commercial or financial relationships that could be construed as a potential conflict of interest.
All claims expressed in this article are solely those of the authors and do not necessarily represent those of their affiliated organizations, or those of the publisher, the editors and the reviewers. Any product that may be evaluated in this article, or claim that may be made by its manufacturer, is not guaranteed or endorsed by the publisher.
The Supplementary Material for this article can be found online at: https://www.frontiersin.org/articles/10.3389/fonc.2022.962381/full#supplementary-material
1. Li TY, Chen QC, Zhao H, Zhang YF, Zhao JJ, Cai JQ. Prognostic factors for overall survival in patients with primary duodenal adenocarcinoma. Ann Palliat Med (2021) 10:2781–90. doi: 10.21037/apm-20-1280
2. Jiang QL, Huang XH, Chen YT, Zhang JW, Wang CF. Prognostic factors and clinical characteristics of patients with primary duodenal adenocarcinoma: A single-center experience from China. BioMed Res Int (2016) 2016:6491049. doi: 10.1155/2016/6491049
3. Zhu Z, Zhong F. Comparative analysis of outcomes and clinicopathological characteristics of duodenal adenocarcinoma: A SEER analysis. Cancer Invest (2020) 38:543–8. doi: 10.1080/07357907.2020.1824260
4. Zhang S, Cui Y, Zhong B, Xiao W, Gong X, Chao K, et al. Clinicopathological characteristics and survival analysis of primary duodenal cancers: A 14-year experience in a tertiary centre in south China. Int J Colorectal Dis (2011) 26:219–26. doi: 10.1007/s00384-010-1063-x
5. He C, Mao Y, Wang J, Duan F, Lin X, Li S. Nomograms predict long-term survival for patients with periampullary adenocarcinoma after pancreatoduodenectomy. BMC Cancer (2018) 18:327. doi: 10.1186/s12885-018-4240-x
6. Sun H, Liu Y, Lv L, Li J, Liao X, Gong W. Prognostic factors and clinical characteristics of duodenal adenocarcinoma with survival: A retrospective study. Front Oncol (2021) 11:795891. doi: 10.3389/fonc.2021.795891
7. Solaini L, Jamieson NB, Metcalfe M, Abu Hilal M, Soonawalla Z, Davidson BR, et al. Outcome after surgical resection for duodenal adenocarcinoma in the UK. Br J Surg (2015) 102:676–81. doi: 10.1002/bjs.9791
8. Li D, Si X, Wan T, Zhou Y. Outcomes of surgical resection for primary duodenal adenocarcinoma: A systematic review. Asian J Surg (2019) 42:46–52. doi: 10.1016/j.asjsur.2018.04.005
9. Poultsides GA, Huang LC, Cameron JL, Tuli R, Lan L, Hruban RH, et al. Duodenal adenocarcinoma: clinicopathologic analysis and implications for treatment. Ann Surg Oncol (2012) 19:1928–35. doi: 10.1245/s10434-011-2168-3
10. Zhou J, Lin Z, Lyu M, Chen N, Liao H, Wang Z, et al. Prognostic value of lymph node ratio in non-small-cell lung cancer: A meta-analysis. Jpn J Clin Oncol (2020) 50:44–57. doi: 10.1093/jjco/hyz120
11. Macedo F, Sequeira H, Ladeira K, Bonito N, Viana C, Martins S. Metastatic lymph node ratio as a better prognostic tool than the TNM system in colorectal cancer. Future Oncol (2021) 17:1519–32. doi: 10.2217/fon-2020-0993
12. Shi J, Liu S, Cao J, Shan S, Ren C, Zhang J, et al. Prognostic nomogram based on the metastatic lymph node ratio for T1-4N0-1M0 pancreatic neuroendocrine tumors after surgery. Front Oncol (2022) 12:899759. doi: 10.3389/fonc.2022.899759
13. Wang N, Yang J, Lyu J, Liu Q, He H, Liu J, et al. A convenient clinical nomogram for predicting the cancer-specific survival of individual patients with small-intestine adenocarcinoma. BMC Cancer (2020) 20:505. doi: 10.1186/s12885-020-06971-6
14. Li H, He Y, Huang L, Luo H, Zhu X. The nomogram model predicting overall survival and guiding clinical decision in patients with glioblastoma based on the SEER database. Front Oncol (2020) 10:1051. doi: 10.3389/fonc.2020.01051
15. Huang H, Fang W, Lin Y, Zheng Z, Wang Z, Chen X, et al. Predictive model for overall survival and cancer-specific survival in patients with esophageal adenocarcinoma. J Oncol (2021) 2021:4138575. doi: 10.1155/2021/4138575
16. Liu Q, Li W, Xie M, Yang M, Xu M, Yang L, et al. Development and validation of a SEER-based prognostic nomogram for cervical cancer patients below the age of 45 years. Bosn J Basic Med Sci (2021) 21:620–31. doi: 10.17305/bjbms.2020.5271
17. Fitzgerald M, Saville BR, Lewis RJ. Decision curve analysis. JAMA (2015) 313:409–10. doi: 10.1001/jama.2015.37
18. Camp RL, Dolled-Filhart M, Rimm DL. X-Tile: a new bio-informatics tool for biomarker assessment and outcome-based cut-point optimization. Clin Cancer Res (2004) 10:7252–9. doi: 10.1158/1078-0432.CCR-04-0713
19. Schober P, Boer C, Schwarte LA. Correlation coefficients: Appropriate use and interpretation. Anesth Analg (2018) 126:1763–8. doi: 10.1213/ANE.0000000000002864
20. Sakamoto T, Saiura A, Ono Y, Mise Y, Inoue Y, Ishizawa T, et al. Optimal lymphadenectomy for duodenal adenocarcinoma: Does the number alone matter? Ann Surg Oncol (2017) 24:3368–75. doi: 10.1245/s10434-017-6044-7
21. Meijer LL, Alberga AJ, de Bakker JK, van der Vliet HJ, Le Large TYS, van Grieken NCT, et al. Outcomes and treatment options for duodenal adenocarcinoma: A systematic review and meta-analysis. Ann Surg Oncol (2018) 25:2681–92. doi: 10.1245/s10434-018-6567-6
22. Nakamura S, Kanda M, Ito S, Mochizuki Y, Teramoto H, Ishigure K, et al. Accurate risk stratification of patients with node-positive gastric cancer by lymph node ratio. World J Surg (2020) 44:4184–92. doi: 10.1007/s00268-020-05739-0
23. Peng JS, Morris-Stiff G, Ali NS, Wey J, Chalikonda S, El-Hayek KM, et al. Neoadjuvant chemoradiation is associated with decreased lymph node ratio in borderline resectable pancreatic cancer: A propensity score matched analysis. Hepatobiliary Pancreat Dis Int (2021) 20:74–9. doi: 10.1016/j.hbpd.2020.08.001
24. Lino-Silva LS, Gómez-Álvarez MA, Salcedo-Hernández RA, Padilla-Rosciano AE, López-Basave HN. Prognostic importance of lymph node ratio after resection of ampullary carcinomas. J Gastrointest Oncol (2018) 9:1144–9. doi: 10.21037/jgo.2018.07.04
25. Jensen KK, Storkholm JH, Chen I, Burgdorf SK, Hansen CP. Long-term results after resection of primary duodenal adenocarcinoma: A retrospective cohort study. Int J Surg (2022) 100:106599. doi: 10.1016/j.ijsu.2022.106599
26. Tran TB, Qadan M, Dua MM, Norton JA, Poultsides GA, Visser BC. Prognostic relevance of lymph node ratio and total lymph node count for small bowel adenocarcinoma. Surgery (2015) 158:486–93. doi: 10.1016/j.surg.2015.03.048
27. Liang TJ, Wang BW, Liu SI, Chou NH, Tsai CC, Chen IS, et al. Number of involved lymph nodes is important in the prediction of prognosis for primary duodenal adenocarcinoma. J Chin Med Assoc (2012) 75:573–80. doi: 10.1016/j.jcma.2012.08.002
28. Jiang S, Zhao R, Li Y, Han X, Liu Z, Ge W, et al. Prognosis and nomogram for predicting postoperative survival of duodenal adenocarcinoma: A retrospective study in China and the SEER database. Sci Rep (2018) 8:7940. doi: 10.1038/s41598-018-26145-6
29. Wang N, Bu Q, Liu Q, Yang J, He H, Liu J, et al. Effect of marital status on duodenal adenocarcinoma survival: A surveillance epidemiology and end results population analysis. Oncol Lett (2019) 18:1904–14. doi: 10.3892/ol.2019.10475
30. Malleo G, Tonsi A, Marchegiani G, Casarotto A, Paiella S, Butturini G, et al. Postoperative morbidity is an additional prognostic factor after potentially curative pancreaticoduodenectomy for primary duodenal adenocarcinoma. Langenbecks Arch Surg (2013) 398:287–94. doi: 10.1007/s00423-012-0978-9
31. Kato Y, Takahashi S, Kinoshita T, Shibasaki H, Gotohda N, Konishi M. Surgical procedure depending on the depth of tumor invasion in duodenal cancer. Jpn J Clin Oncol (2014) 44:224–31. doi: 10.1093/jjco/hyt213
32. Ecker BL, McMillan MT, Datta J, Mamtani R, Giantonio BJ, Dempsey DT, et al. Efficacy of adjuvant chemotherapy for small bowel adenocarcinoma: A propensity score-matched analysis. Cancer (2016) 122:693–701. doi: 10.1002/cncr.29840
33. Cloyd JM, Norton JA, Visser BC, Poultsides GA. Does the extent of resection impact survival for duodenal adenocarcinoma? Analysis of 1,611 cases. Ann Surg Oncol (2015) 22:573–80. doi: 10.1245/s10434-014-4020-z
Keywords: lymph node ratio, nomogram, primary duodenal adenocarcinoma, overall survival, cancer-specific survival
Citation: Shi J, Liu S, Cao J, Shan S, Zhang J and Wang Y (2022) Development and validation of lymph node ratio-based nomograms for primary duodenal adenocarcinoma after surgery. Front. Oncol. 12:962381. doi: 10.3389/fonc.2022.962381
Received: 06 June 2022; Accepted: 20 September 2022;
Published: 04 October 2022.
Edited by:
Zhendong Jin, Second Military Medical University, ChinaReviewed by:
Shiva Basnet, Southern University of Science and Technology, ChinaCopyright © 2022 Shi, Liu, Cao, Shan, Zhang and Wang. This is an open-access article distributed under the terms of the Creative Commons Attribution License (CC BY). The use, distribution or reproduction in other forums is permitted, provided the original author(s) and the copyright owner(s) are credited and that the original publication in this journal is cited, in accordance with accepted academic practice. No use, distribution or reproduction is permitted which does not comply with these terms.
*Correspondence: Yijun Wang, d2FuZ3lpanVuX2NhcmxAMTYzLmNvbQ==; Jinjuan Zhang, MTU1MjIyNDI4ODZAMTYzLmNvbQ==
Disclaimer: All claims expressed in this article are solely those of the authors and do not necessarily represent those of their affiliated organizations, or those of the publisher, the editors and the reviewers. Any product that may be evaluated in this article or claim that may be made by its manufacturer is not guaranteed or endorsed by the publisher.
Research integrity at Frontiers
Learn more about the work of our research integrity team to safeguard the quality of each article we publish.