 Hongyan Li1,2†
 Fan Hu
 Zairong Gao
95% of researchers rate our articles as excellent or good
Learn more about the work of our research integrity team to safeguard the quality of each article we publish.
Find out more
ORIGINAL RESEARCH article
Front. Oncol. , 28 July 2022
Sec. Hematologic Malignancies
Volume 12 - 2022 | https://doi.org/10.3389/fonc.2022.943151
This article is part of the Research Topic The Role of Imaging in Hematologic Malignancies View all 6 articles
Purpose: We investigated the utility of a new baseline PET parameter expressing lesion dissemination and metabolic parameters for predicting progression-free survival (PFS) and pathologic grade in follicular lymphoma (FL).
Methods: The baseline 18F-FDG PET/CT images of 126 patients with grade 1–3A FL were retrospectively analyzed. A novel PET/CT parameter characterizing lesion dissemination, the distance between two lesions that were furthest apart (Dmax), was calculated. The total metabolic tumor volume and total lesion glycolysis (TLG) were computed by using 41% of the maximum standardized uptake value (SUVmax) thresholding method.
Results: The 5-year PFS rate was 51.9% for all patients. In the multivariate analysis, high Dmax [P = 0.046; hazard ratio (HR) = 2.877], high TLG (P = 0.004; HR = 3.612), and elevated serum lactate dehydrogenase (P = 0.041; HR = 2.287) were independent predictors of PFS. A scoring system for prognostic stratification was established based on these three adverse factors, and the patients were classified into three risk categories: low risk (zero to one factor, n = 75), intermediate risk (two adverse factors, n = 29), and high risk (three adverse factors, n = 22). Patients in the high-risk group had a shorter 3-year PFS (21.7%) than those in the low- and intermediate-risk groups (90.6 and 44.6%, respectively) (P < 0.001). The C-index of our scoring system for PFS (0.785) was superior to the predictive capability of the Follicular Lymphoma International Prognostic Index (FLIPI), FLIPI2, and PRIMA-Prognostic Index (C-index: 0.628–0.701). The receiver operating characteristic curves and decision curve analysis demonstrated that the scoring system had better differentiation and clinical utility than these existing indices. In addition, the median SUVmax was significantly higher in grade 3A (36 cases) than in grades 1 and 2 FL (90 cases) (median: 13.63 vs. 11.45, P = 0.013), but a substantial overlap existed (range: 2.25–39.62 vs. 3.17–39.80).
Conclusion: TLG and Dmax represent two complementary aspects of the disease, capturing the tumor burden and lesion dissemination. TLG and Dmax are promising metrics for identifying patients at a high risk of progression or relapse. Additionally, SUVmax seems to have some value for distinguishing grade 3A from low-grade FL but cannot substitute for biopsy.
Follicular lymphoma (FL) is one of most frequent subtypes of non-Hodgkin lymphoma (NHL) in the United States and Western Europe, accounting for around 22% of all NHLs. In China, the incidence of FL is lower than in Western countries, constituting 2.5–6.6% of all NHL cases (1, 2). The World Health Organization (WHO) classifies FL into grades 1 and 2, 3A, and 3B (3). Grades 1 and 2 are considered as indolent (slow-growing), whereas grade 3B has an aggressive course and is managed as diffuse large B-cell lymphoma (DLBCL) (4, 5). However, the optimal treatment for grade 3A FL is controversial (6, 7). Grade 3A FL has been suggested to be on the same continuum as grades 1 and 2 (8), and the contrasting findings revealed that gene expression profiling demonstrates a close relationship between FL 3A and 3B, but distinct from grades 1 and 2 (9). Prognostic models based on histologic grade and other factors have indicated that grade 3A is associated with a poor prognosis (10, 11). However, histologic grade (grades 1 and 2 versus grade 3A) arguably does not predict the disease outcome (12, 13). Nonetheless, FL grade plays an important role in treatment choice. An accurate assessment of histologic grade is challenging because of the heterogeneity of the disease and high inter-reader variability (14).
Although the survival of FL patients has markedly improved since the introduction of rituximab combined with chemotherapy, 20% of patients experience disease recurrence within 2 years, with a 5-year overall survival (OS) of just 50% (15, 16). The most common prognostic indices in current use, including the Follicular Lymphoma International Prognostic Index (FLIPI) (17) and FLIPI2 (18), cannot accurately identify patients who are at a high risk of progression or relapse (11, 19). PRIMA-Prognostic Index (PRIMA-PI) (20), a simplified scoring system including β2-MG (β2-microglobulin) and bone marrow involvement, has recently been proposed for patients treated with immunochemotherapy, but its development time is short, and the accuracy of bone marrow biopsy is still insufficient (21), so its application value still needs further validation.
18F‐fluorodeoxyglucose positron emission tomography/computed tomography (18F-FDG PET/CT) is recommended for FL staging and treatment response monitoring (22, 23). Total metabolic tumor volume (TMTV) and total lesion glycolysis (TLG) are new PET/CT metabolic parameters reflecting whole-body tumor burden that are becoming increasingly important for the prognostic assessment of lymphomas (24, 25). High baseline TMTV or TLG is associated with a significantly shorter progression-free survival (PFS) or OS in FL patients and has improved risk stratification (26–29). However, these metabolic parameters do not provide information on the spatial distribution of lesions throughout the body. The distance between two lesions that are the furthest apart (Dmax) has been recommended as a novel PET metric for describing tumor dissemination in DLBCL patients. A high Dmax has been linked to an unfavorable prognosis and was shown to complement the prognostic performance of TMTV in advanced-stage DLBCL (30). We conjecture that the prognostic value of the metabolic parameters in FL might be improved by combining with the feature characterizing lesion dissemination.
Given the challenges of histological grading of FL, Major et al. (31) have focused on whether PET/CT can be used as an adjunct to biopsy grading of FL. The results showed that the maximum standardized uptake (SUVmax), TMTV, and TLG were capable of differentiating grade 3A from low-grade (grade 1/2) FL, although this was based on a small number of cases, especially in the grade 3A group (11 patients).
Hence, the purpose of this study was to explore whether the new metric reflecting tumor dissemination and metabolic parameters derived from the baseline 18F-FDG PET/CT can be used to predict prognosis and histologic grade in patients with grades 1–3A FL.
This study was approved by the institutional ethics board, and written informed consent was waived because of the retrospective nature.
We carried out a retrospective review of 126 FL patients undergoing 18F-FDG PET/CT scanning before treatment between February 2013 and December 2020. The inclusion criteria were as follows: (1) age >18 years and (2) histologic diagnosis of grades 1–3A FL according to the WHO classification (3). The exclusion criteria were as follows: (1) patients with other malignant tumors, (2) elevated fasting blood glucose level (≥200 mg/dl), and (3) histologically confirmed grade IIIB FL or concurrent DLBCL.
PET/CT scanning was performed using the Discovery VCT system (GE Healthcare, Milwaukee, WI, USA). Whole-body PET/CT scans (from the skull base to the upper thighs) were performed approximately 60 min after an intravenous injection of 3.7–4.4 MBq/kg 18F-FDG. CT data were used for attenuation correction, and corrected PET images were reconstructed using an ordered-subset expectation maximization iterative reconstruction algorithm. The CT and PET images were merged.
PET/CT image data in DICOM format were used for functional parameter measurements using the AW workstation (AW4.6; GE Healthcare). The images were analyzed by two experienced nuclear medicine physicians. The highest 18F-FDG uptake in lesions was regarded as the SUVmax of the patient. MTV was delineated using the 41% SUVmax threshold method as recommended by the European Association of Nuclear Medicine (32). TMTV was defined as the sum of MTVs of all lesions. TLG was calculated as the sum of the product of MTV and SUVmean of every individual lesion. Bone marrow involvement was considered in volume measurement only if there was focal uptake. Spleen was considered as involved if there was focal uptake or diffuse uptake higher than 150% of the liver background (26, 33). The site of the lesion’s SUVmax was regarded as the lesion’s position. Dmax was calculated as the distance between two lesions that were furthest apart (30, 34). If the patient had only one lesion, the Dmax value was denoted as 0 cm.
The R software (version 3.6.2, https://www.r-project.org) was used for statistical analysis. A P-value <0.05 was considered statistically significant. All continuous variables are reported as mean ± SD or median when appropriate, and categorical variables are expressed as numbers and percentages. Differences in continuous variables were evaluated with the independent t-test or Mann–Whitney U-test, and categorical data were compared with the χ2 test or Fisher’s exact test.
PFS was calculated as the time interval from initial diagnosis until disease relapse, progression, death, or the last follow-up. The X-tile software (version 3.6.1, Yale University, New Haven, CT, USA) was used to identify the optimal cutoff values for PET/CT parameters (35). The survival curves for PFS were plotted using the Kaplan–Meier method. Variables with P <0.05 in the univariate Cox analysis were included in the multivariate Cox regression model. A novel scoring system was established based on the number of risk factors for PFS. Harrell’s concordance index (C-index) was used to evaluate the performance of the model. A calibration plot comparing the relationship between the predicted and observed probabilities was used to assess the performance of the predictive model. The C-index, survival receiver operating characteristic (ROC) curves, and decision curve analysis (DCA) were used to compare the model’s predictive and discriminatory performance with that of FLIPI, FLIPI2, and PRIMA-PI.
To determine the optimal cutoff values of SUVmax and the platelet count for predicting the pathologic grade, ROC curves were plotted using MedCalc (Version 20.009). Multivariate logistic regression analysis was performed to identify factors that could predict the pathologic grade.
The baseline clinical characteristics of the 126 patients (median age: 53 years, range: 21–76 years) are shown in Table 1. There were 90 patients with low grade and 36 with grade 3A disease. The patients were treated with rituximab plus cyclophosphamide, doxorubicin, vincristine, and prednisone (R-CHOP; n = 76); rituximab plus bendamustine (n = 14); CHOP (n = 9); rituximab plus cyclophosphamide, doxorubicin liposome, vincristine, and prednisone (n = 5); rituximab plus cyclophosphamide, vincristine, and prednisone (n = 4); rituximab plus fludarabine (n = 3); rituximab plus lenalidomide (n = 2); rituximab alone (n = 2); radiotherapy only (n = 2); and by the watch-and-wait approach (n = 9). After a median follow-up of 41 months (range: 1–102 months), 27 patients had a progressive disease but were alive, 15 patients died of this disease, and 84 patients were in complete remission or had a stable disease. The 5-year PFS rate for all patients was 51.9%.
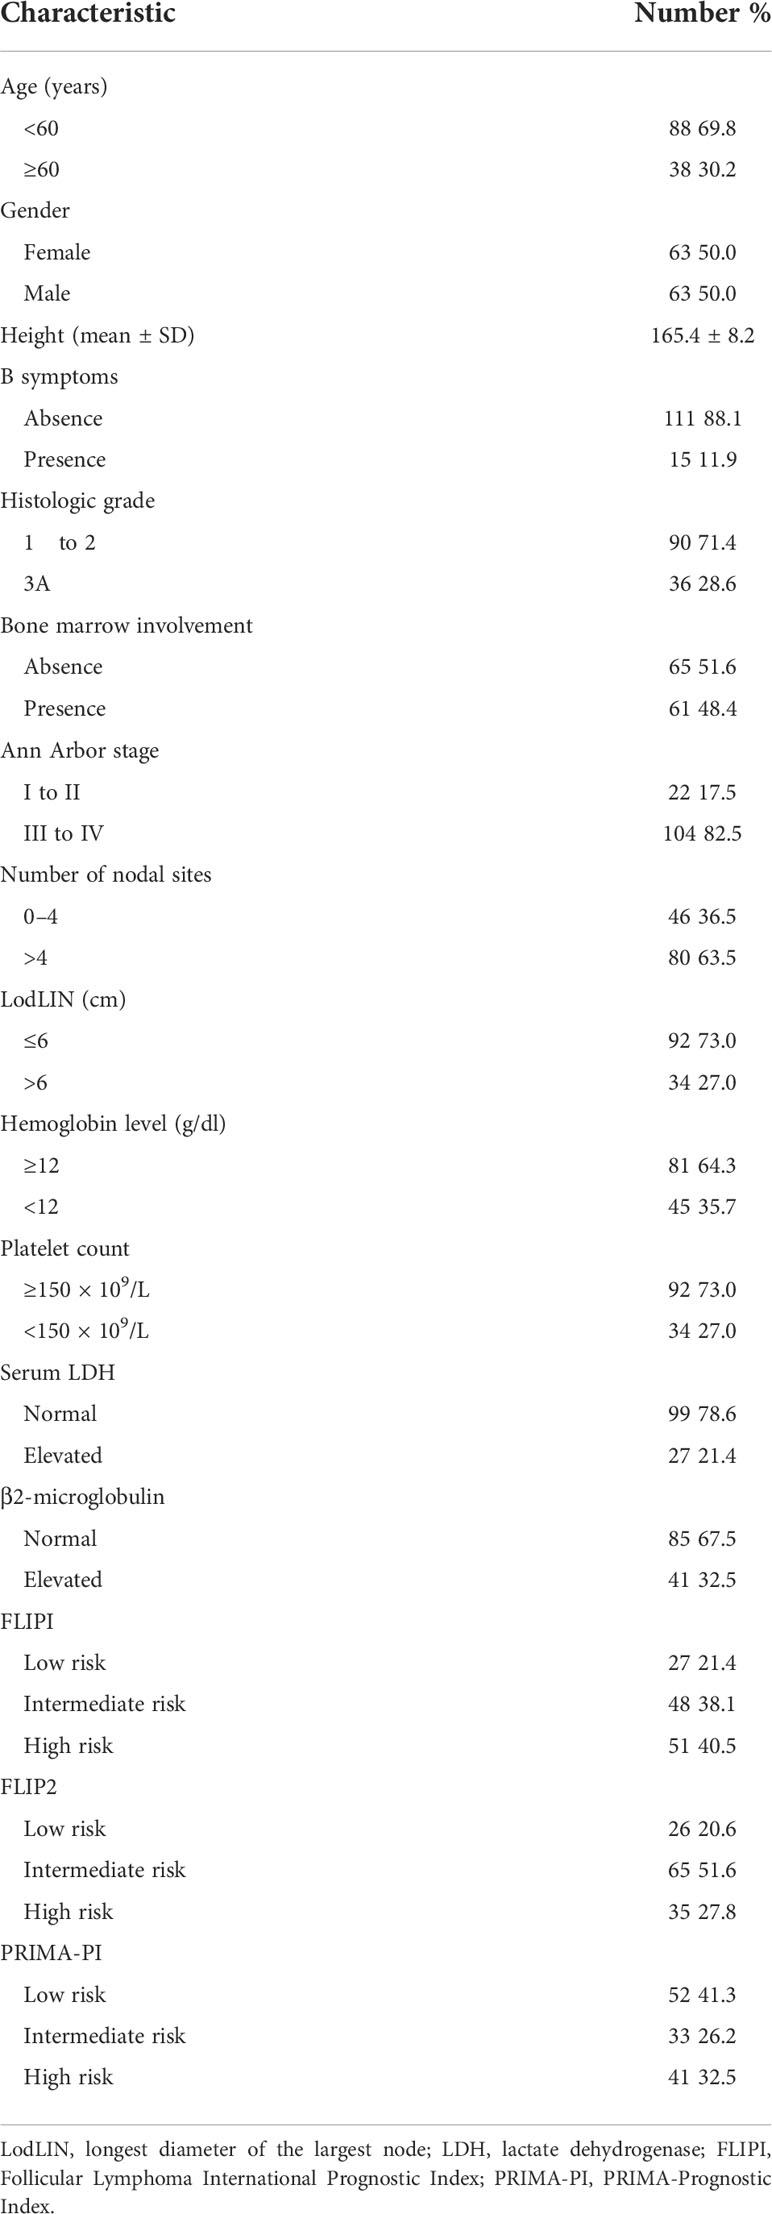
Table 1 Characteristics of follicular lymphoma patients.
The optimal cutoff values of SUVmax, TMTV, TLG, and Dmax for PFS were 17.60, 408.72 cm3, 1446.98, and 56.73 cm, respectively. The univariate analysis showed that increased LDH level, increased β2-MG level, Hb <12 g/dl, SUVmax >17.60, TMTV >408.72 cm3, TLG >1,446.98, and Dmax >56.73 cm were associated with a significantly shorter PFS. The Kaplan–Meier curves and the univariate analysis results are presented in Figure 1 and Table 2.
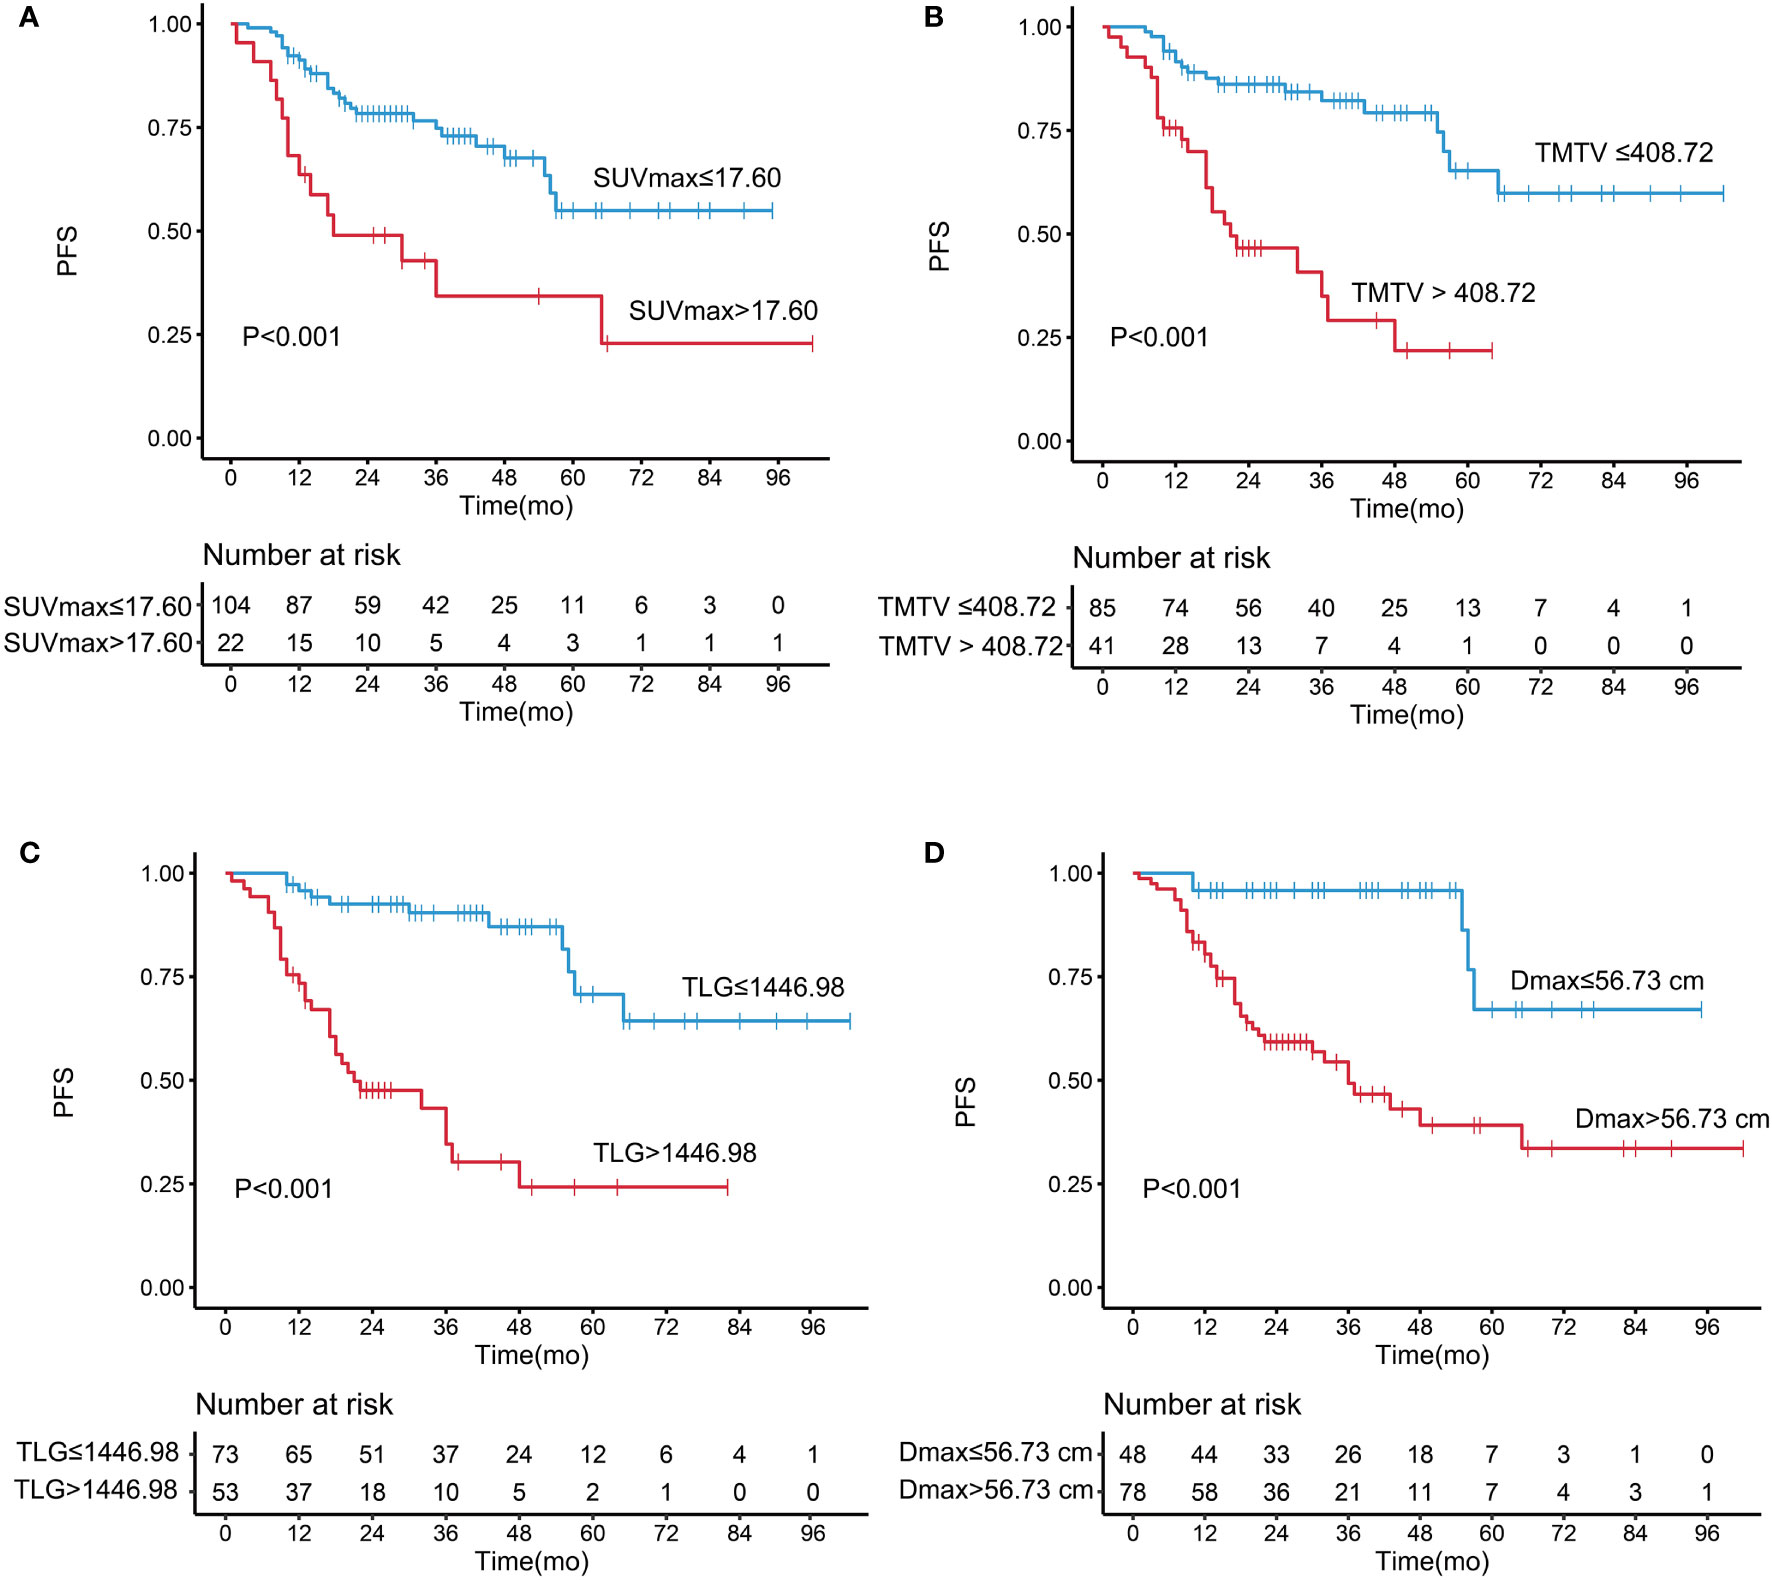
Figure 1 Kaplan–Meier analysis of progression-free survival according to (A) maximum standardized uptake value, (B) total metabolic tumor volume, (C) total lesion glycolysis, and (D) Dmax..
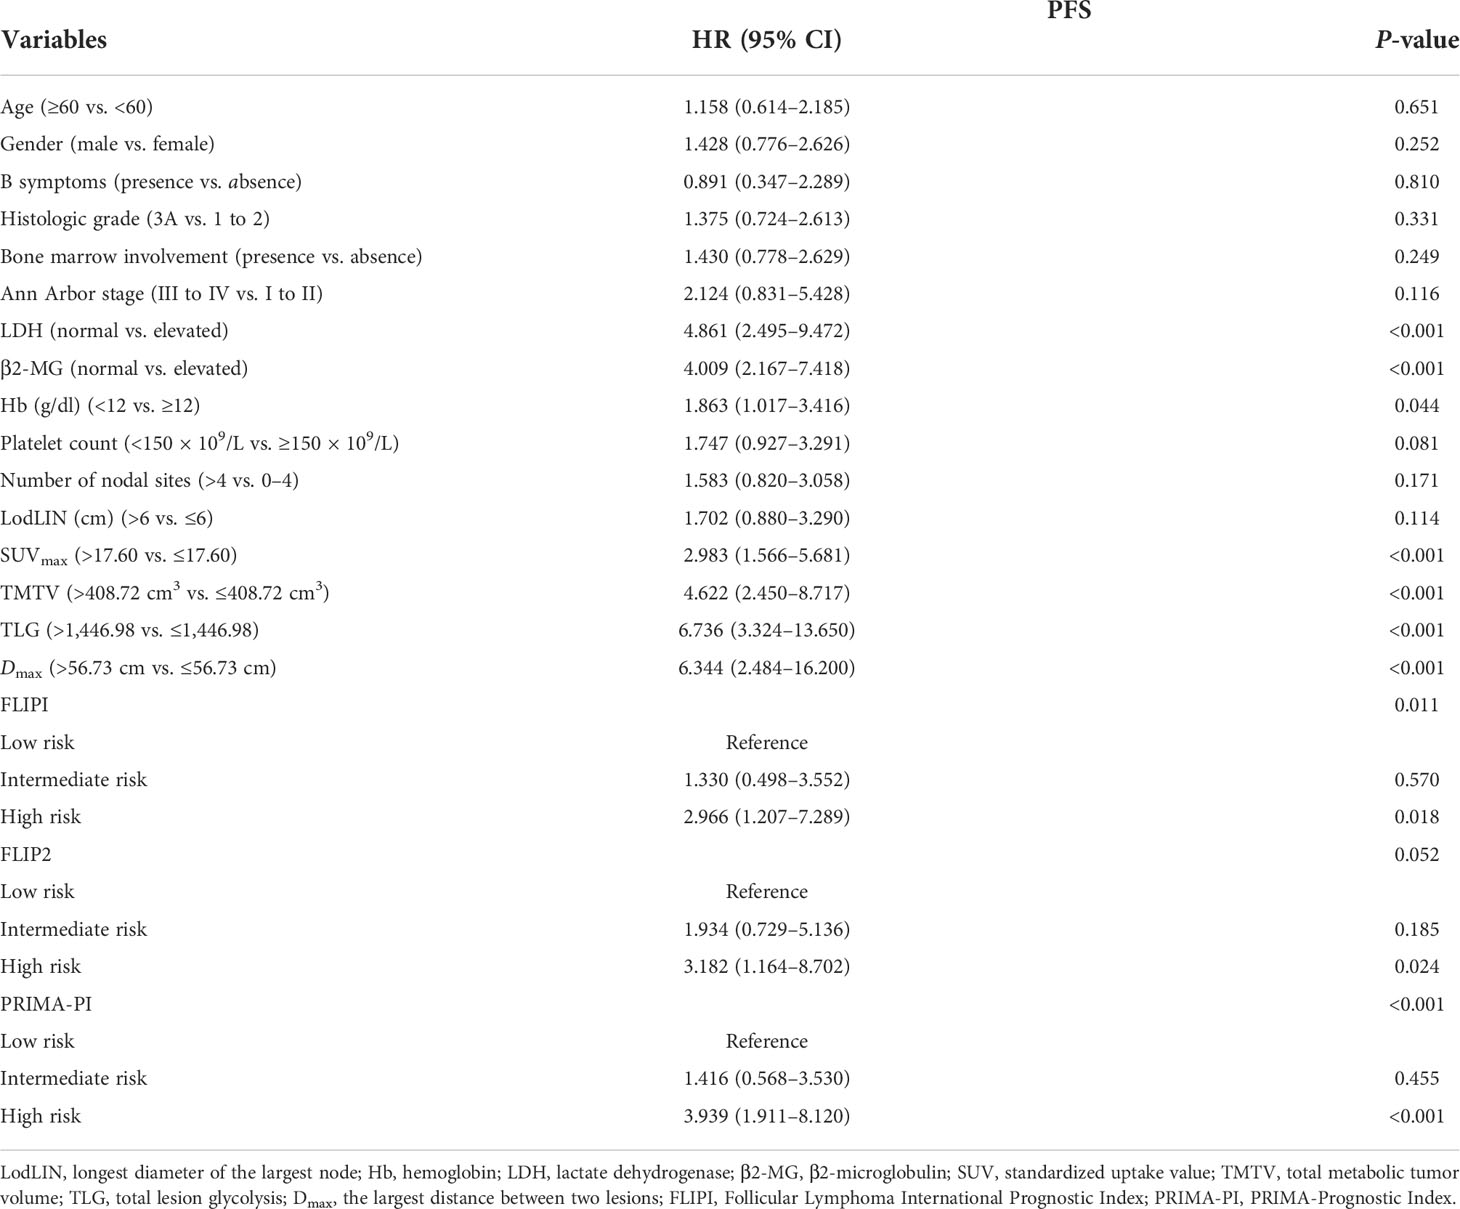
Table 2 Variables associated with progression-free survival (PFS) in the univariate analysis.
A high Dmax was associated with a significantly shorter PFS [hazard ratio (HR) = 6.344, 95% confidence interval (95% CI) = 2.484–16.200, P < 0.001]; the 5-year PFS was 67.1% in the low-Dmax group and 39.1% in the high-Dmax group. The univariate analysis showed that Ann Arbor stage had no significant effect on PFS (P = 0.116). In a subgroup analysis of patients with stage III/IV disease, Dmax remained a prognostic factor for PFS (P < 0.001). The results indicate that Dmax has a strong predictive power for PFS, which was better than that of Ann Arbor stage. In addition, there was no significant differences in height between the low- and high-Dmax groups.
The C-index of TLG was 0.737, which was higher than TMTV (C-index = 0.681; P = 0.076) and SUVmax (C-index = 0.614; P = 0.006). These three metabolic parameters were entered into the multivariate Cox regression model, respectively (Table 3). The independent risk factors for PFS were Dmax (HR = 3.511, P = 0.014), SUVmax (HR = 2.143, P = 0.030), and β2-MG (HR = 2.622, P = 0.017) in the SUVmax model; Dmax (HR = 3.798, P = 0.009) and LDH (HR = 2.223, P = 0.045) in the TMTV model; and Dmax (HR = 2.877, P = 0.046), TLG (HR = 3.612, P = 0.004), and LDH (HR = 2.287, P = 0.041) in the TLG model.
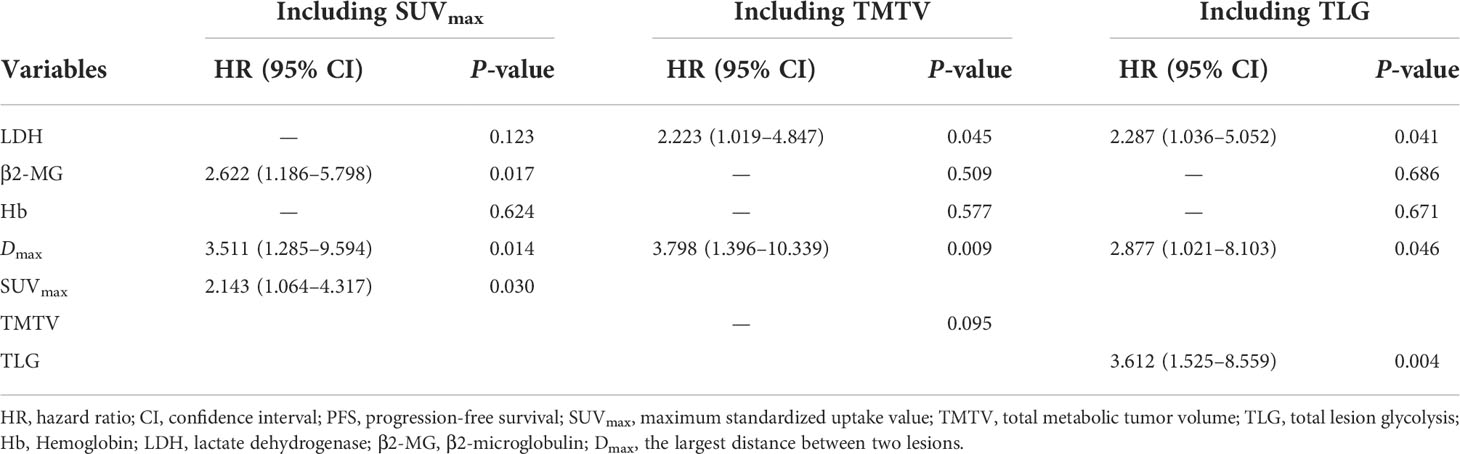
Table 3 Multivariate analysis of variables predictive of PFS.
According to the results of the univariate and multivariate analyses, Dmax, TLG, and LDH were used to construct a scoring system for prognostic stratification. A novel scoring system was established based on the number of risk factors, and the patients were classified into three risk categories: low risk (zero to one adverse factor, n = 75), intermediate risk (two adverse factors, n = 29), and high risk (three adverse factors, n = 22). Examples of the three subgroups using maximal intensity projection on PET/CT images are shown in Figure 2.
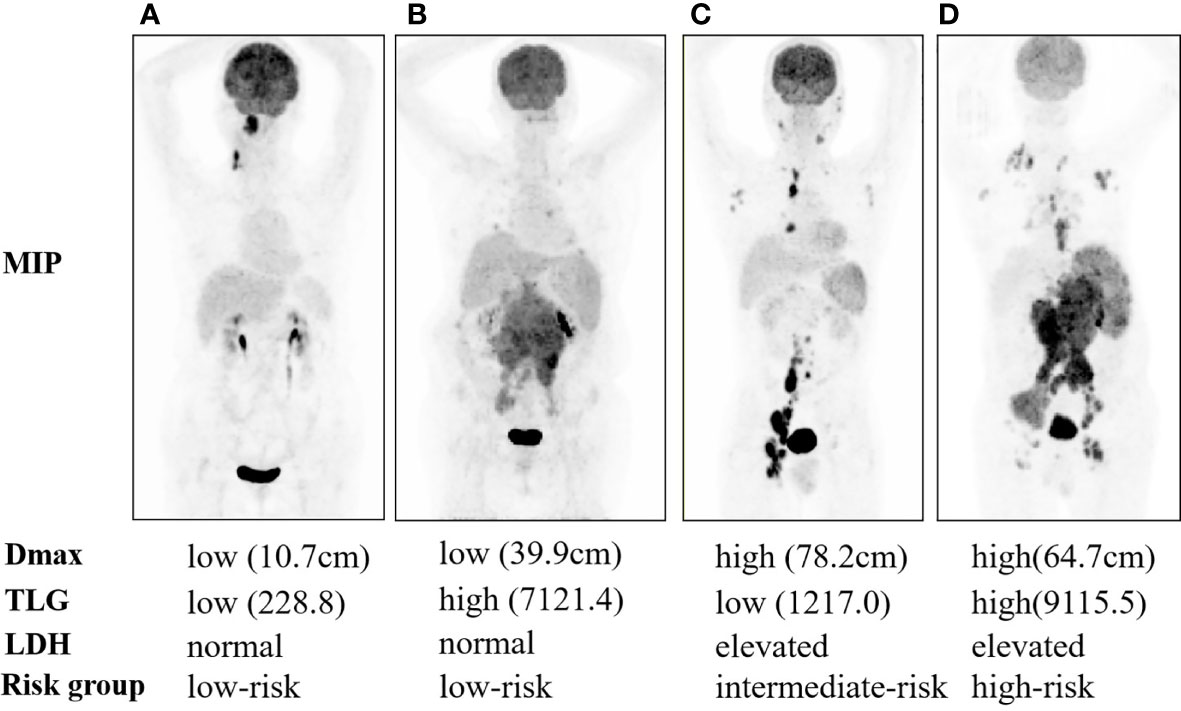
Figure 2 Maximal intensity projection of 1-3A follicular lymphoma patients with low risk (A, B), intermediate risk (C), and high risk (D).
Patients in the high-risk group had a shorter 3-year PFS (21.7%) than those in the low- and intermediate-risk groups (90.6 and 44.6%, respectively) (P < 0.001, Figure 3). The C-index for PFS of the scoring system was 0.785. The calibration plots for the 3- and 5-year PFS showed a good concordance between the predicted and the actual outcomes (Figure 4).
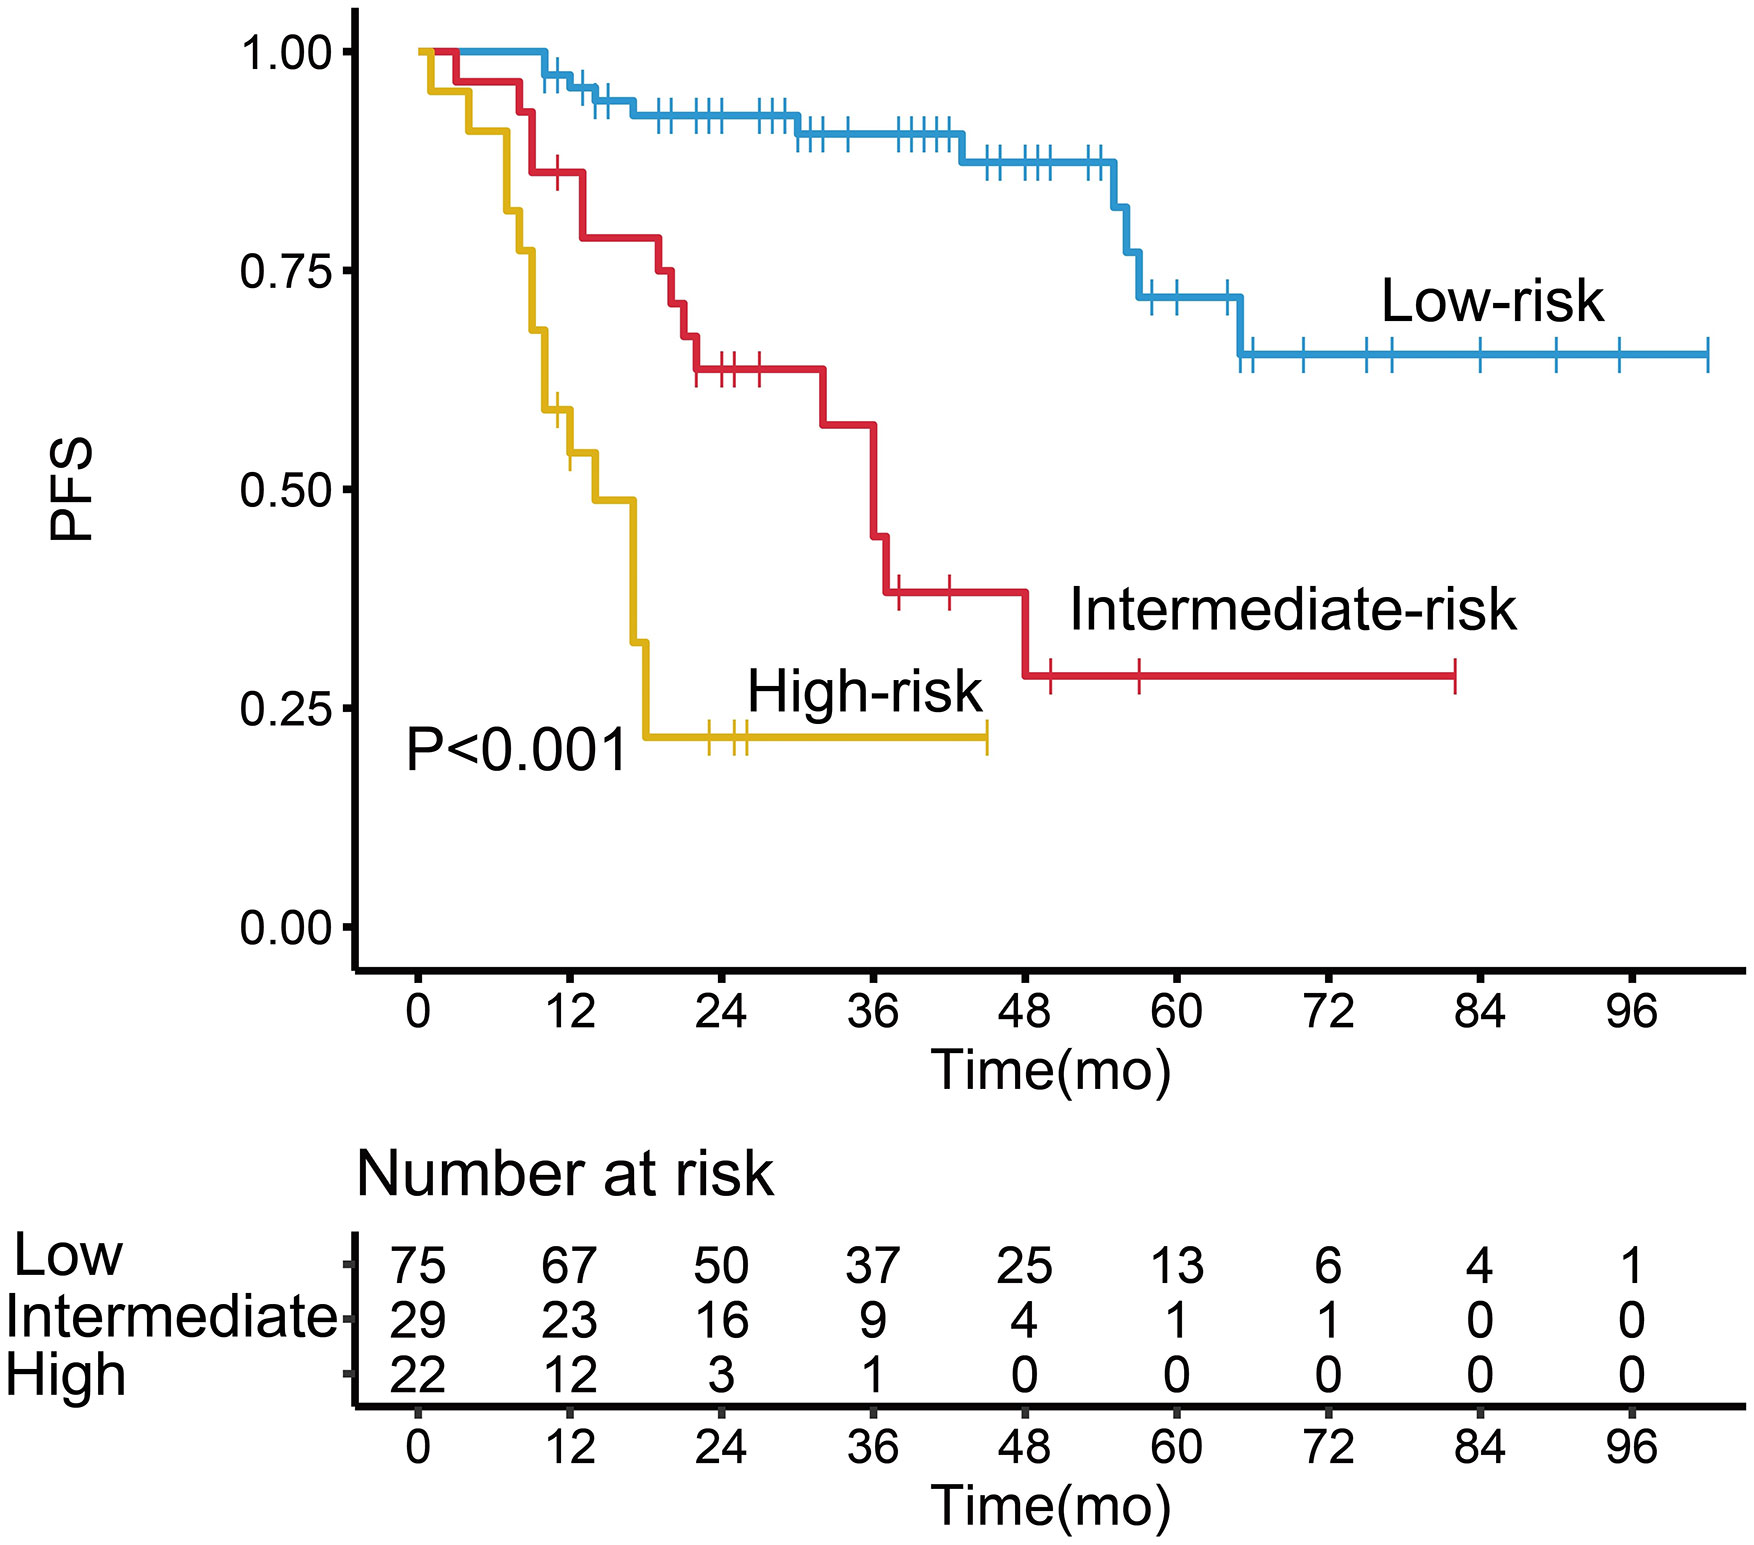
Figure 3 Kaplan–Meier survival analysis of progression-free survival in follicular lymphoma patients according to the potential grading system.
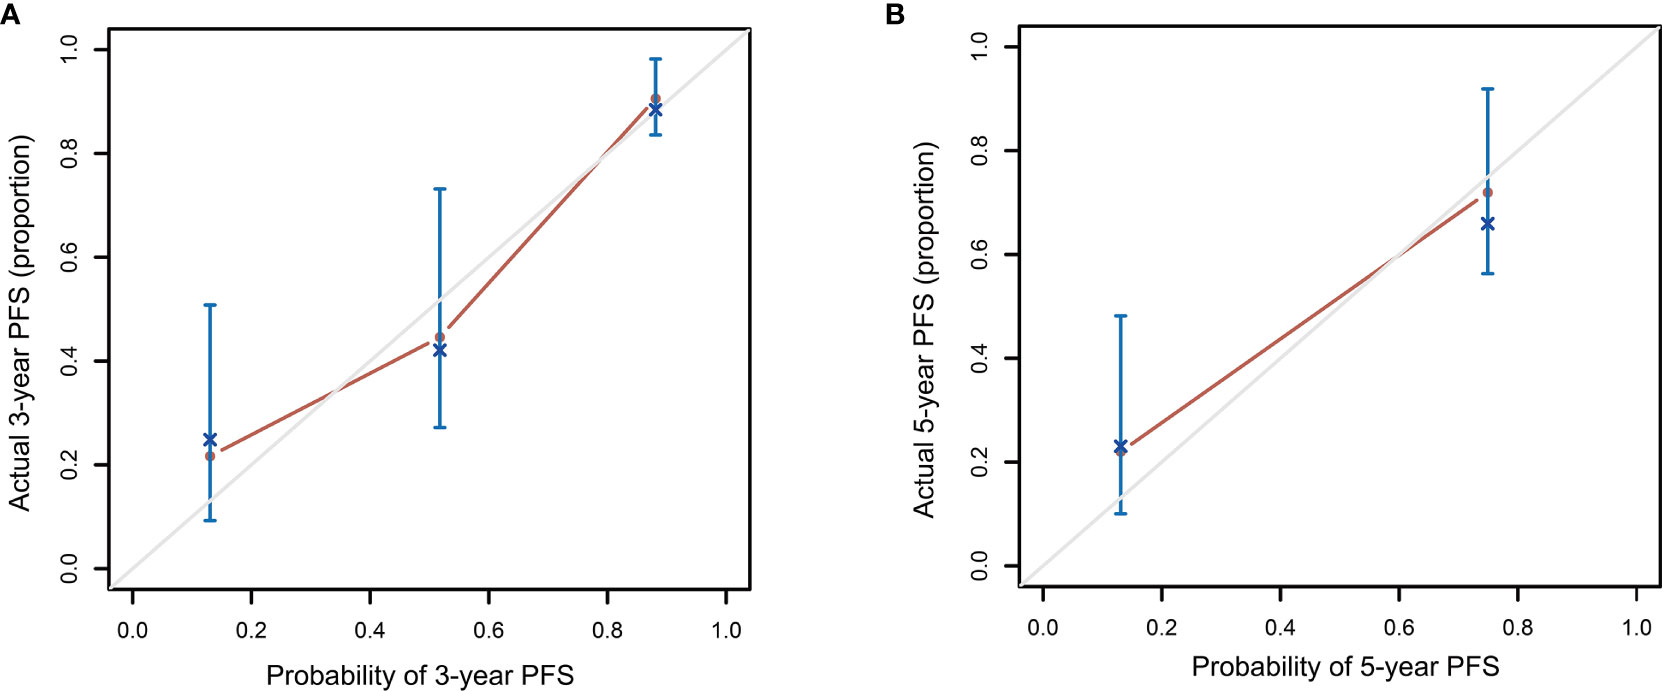
Figure 4 Calibration plot comparing the observed and predicted progression-free survival probabilities at 3 (A) and 5 (B) years.
FLIPI, FLIPI2, and PRIMA-PI showed a good performance in stratifying low- and high-risk patients according to PFS (Figure 5 and Table 2). However, the three indices did not effectively discriminate between the intermediate- and low-risk patient groups (P > 0.05), and FLIPI2 did not show a good performance for discriminating between the intermediate- and high-risk groups (P > 0.05).
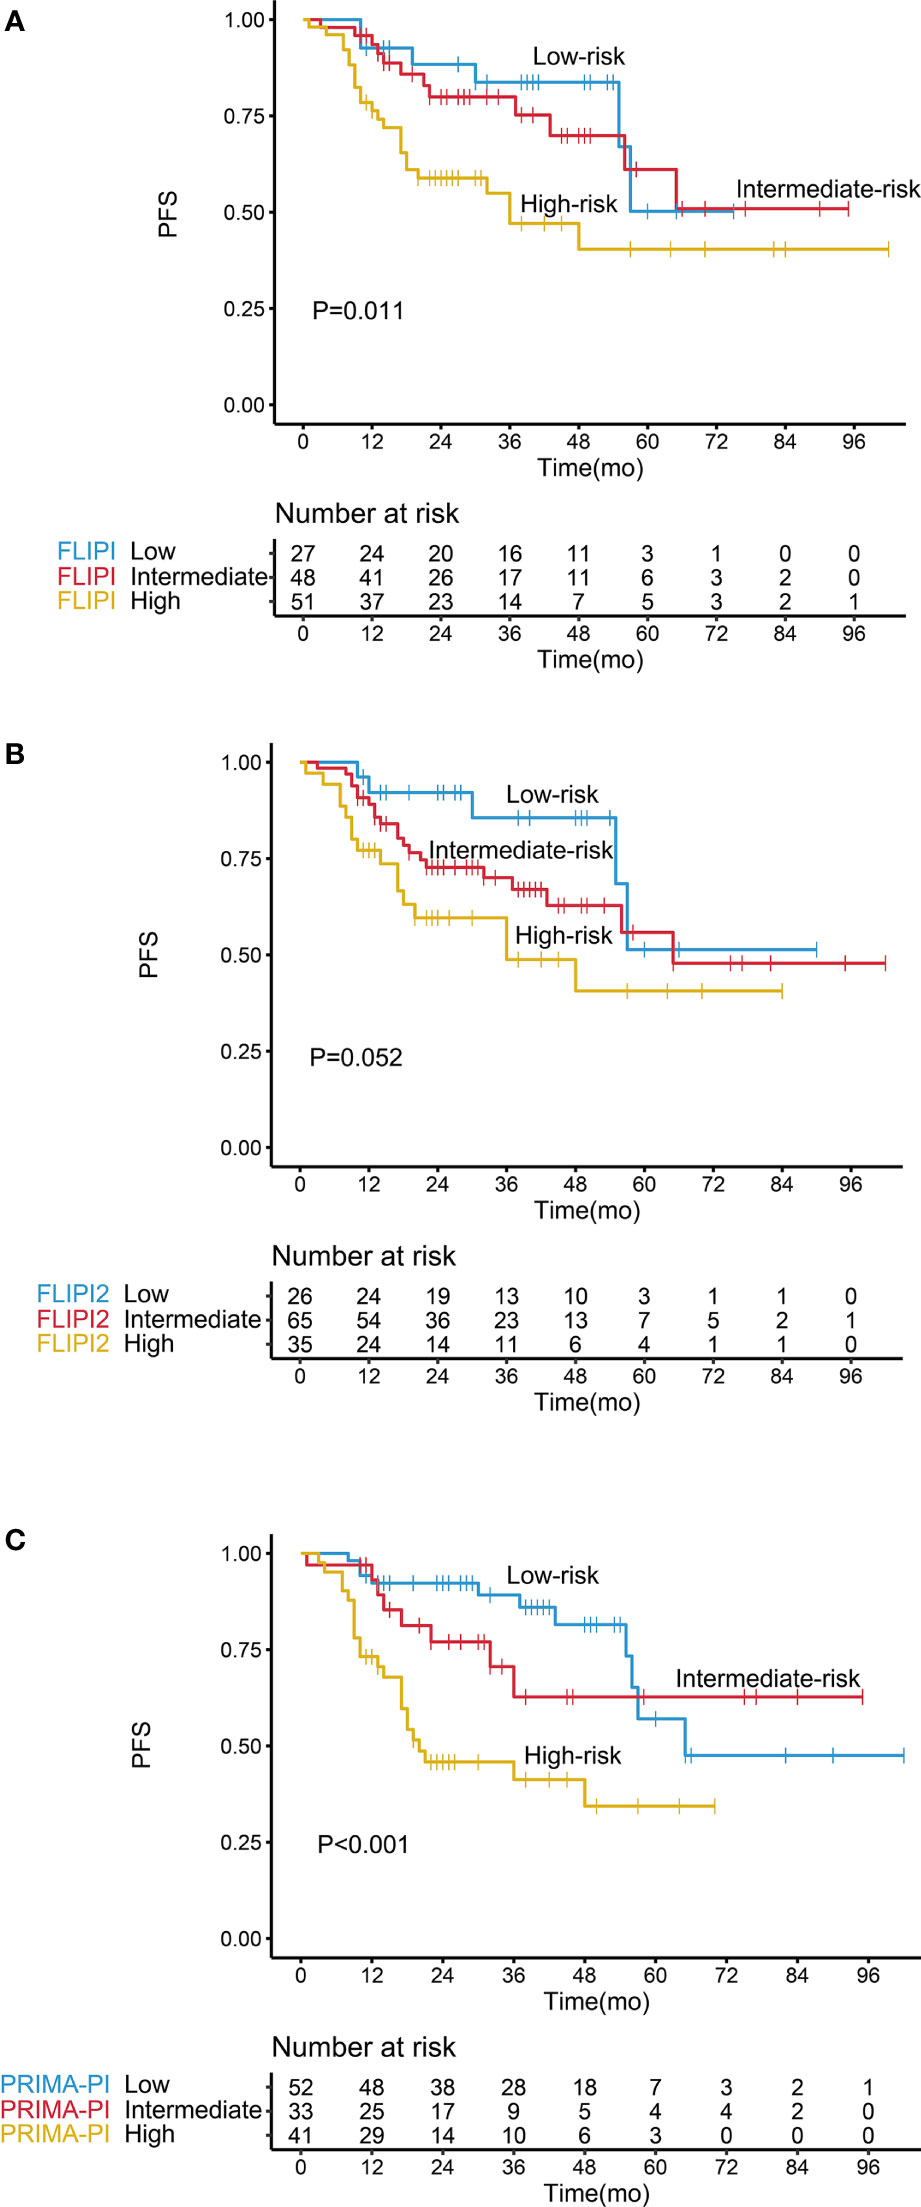
Figure 5 Kaplan–Meier survival analysis of progression-free survival in follicular lymphoma patients according to different prognostic models, including (A) FLIPI, (B) FLIPI2, and (C) PRIMA-PI.
The C-index of our scoring system for PFS was 0.785, which was significantly higher than that of FLIPI (0.650, P < 0.001), FLIPI2 (0.628, P < 0.001), and PRIMA-PI (0.701, P = 0.022) (Table 4). Similarly, the area under the curve (AUC) of our scoring system was higher than that of FLIPI, FLIPI2, and PRIMA-PI (Figures 6A, B). The DCA showed that our scoring system had better clinical utility than the three existing prognostic indices (Figures 6C, D).
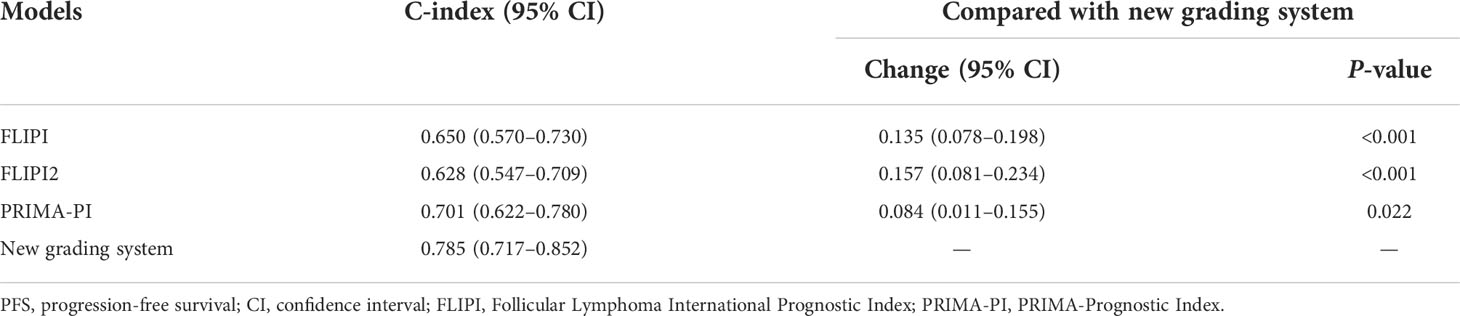
Table 4 Comparative analysis of model performance for PFS between the new grading system and existing prognostic indexes.
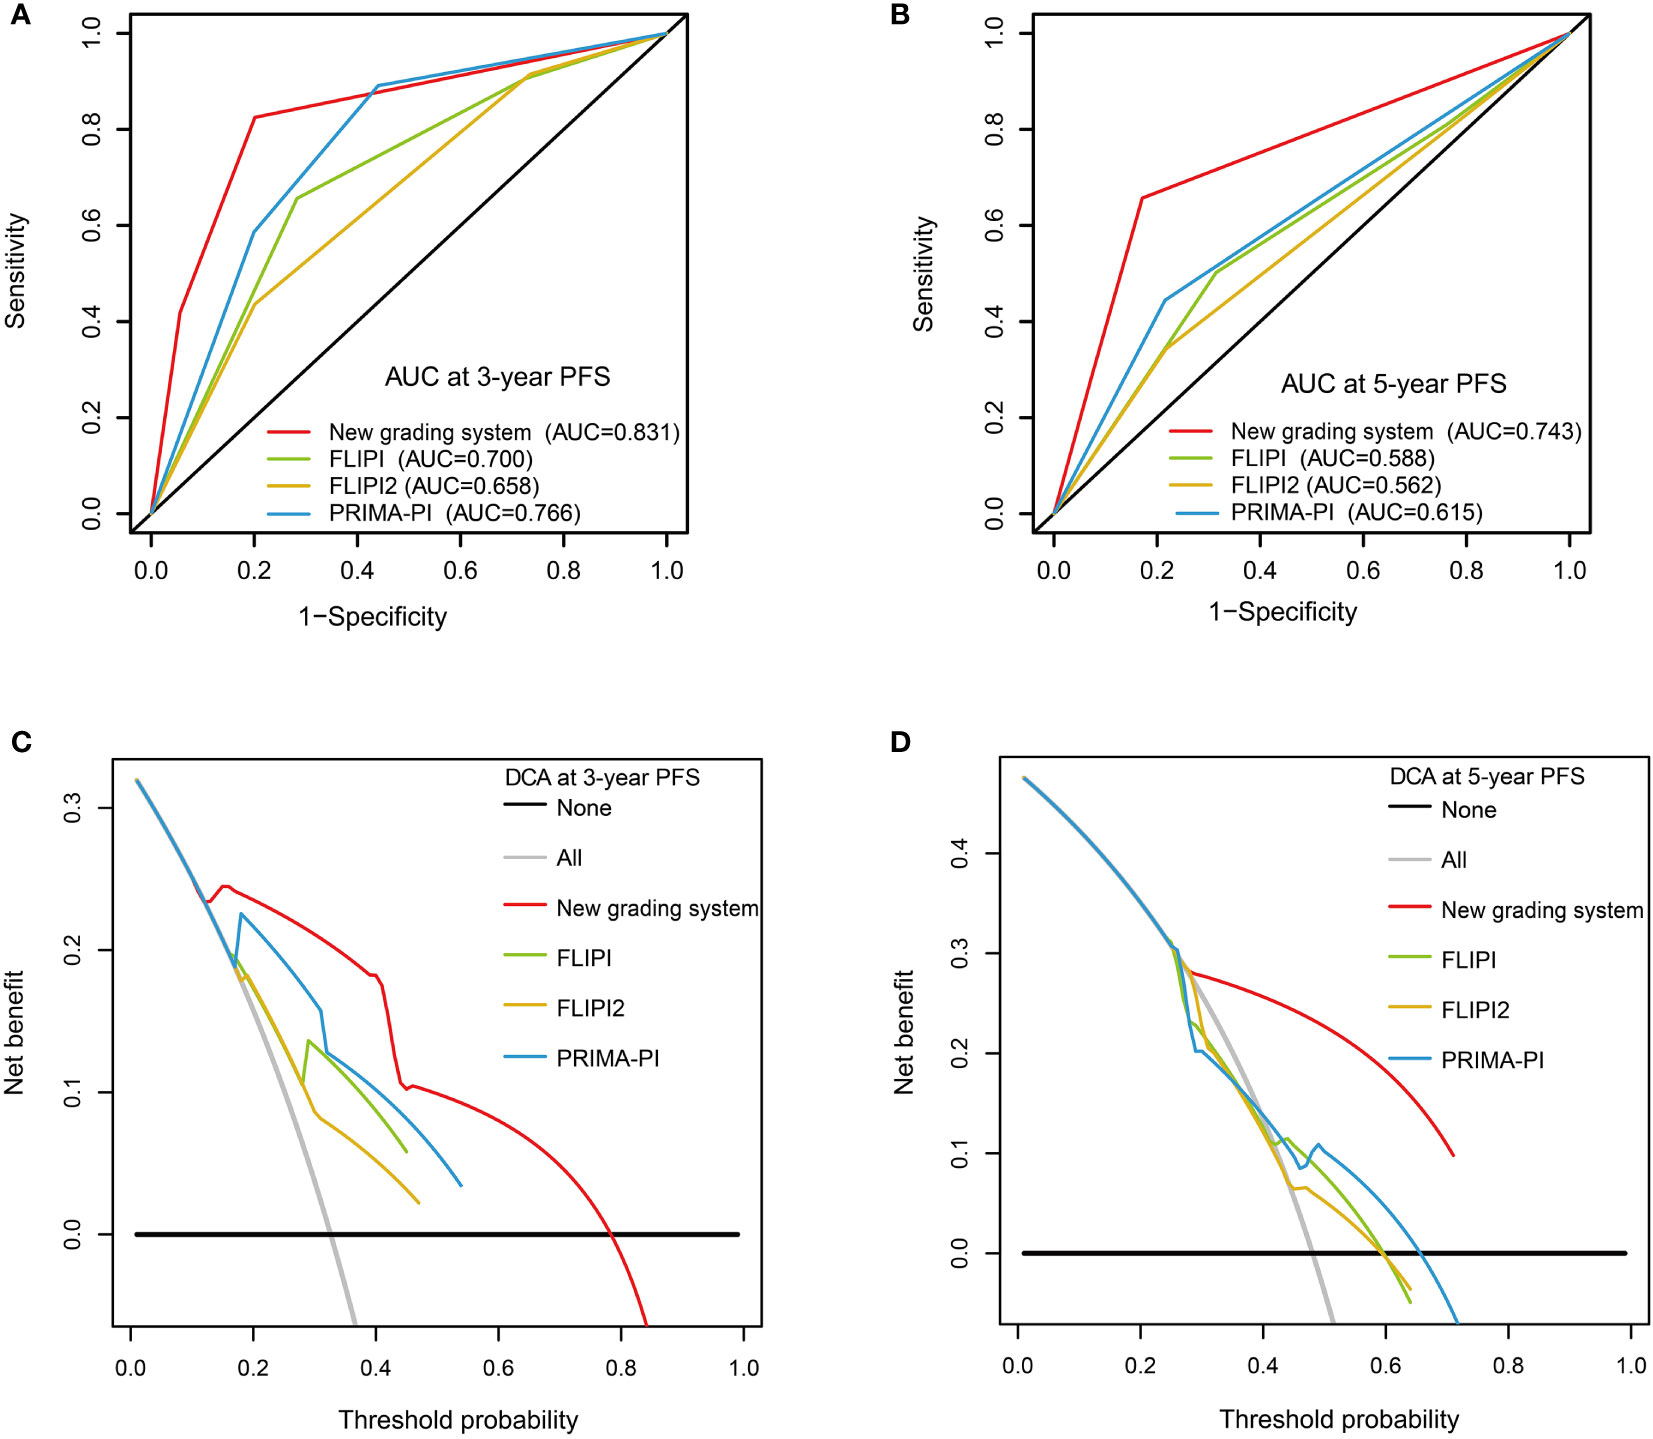
Figure 6 Receiver operating characteristic curves with the new grading system, FLIPI, FLIPI2, and PRIMA-PI for 3-year progression-free survival (PFS) (A) and 5-year PFS (B). Decision curve analysis with the new grading system, FLIPI, FLIPI2, and PRIMA-PI for 3-year PFS (C) and 5-year PFS (D).
In the whole cohort, 82.5% of patients (104/126) received immunochemotherapy. The multivariate Cox regression model for this population is summarized in Supplementary Table S1. These patients were divided into three risk subgroups according to our scoring system, and the Kaplan–Meier analysis showed that our model could discriminate among the three subgroups (Supplementary Figure S1). The C-index of the scoring system for PFS in the immunochemotherapy group was 0.774, which was higher than that of FLIPI (0.622), FLIPI2 (0.617), and PRIMA-PI (0.685).
The high-grade group showed a higher serum LDH level and a higher SUVmax than that in the low-grade group (P = 0.011, 0.013). Besides these, the low-grade group showed a higher platelet count than that in the high-grade group (P = 0.038) (Table 5 and Supplementary Figure S2). In contrast, no significant differences were found in TMTV, TLG, Dmax, and other clinical indexes (all P >0.05).
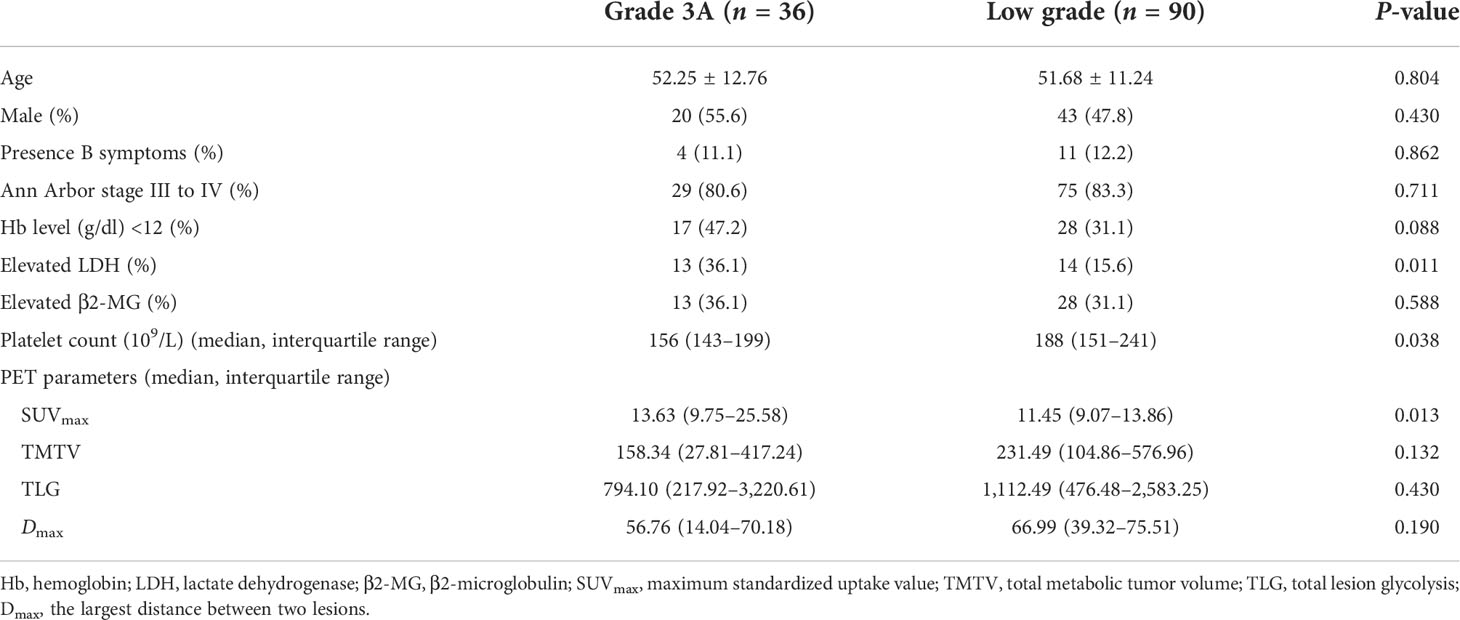
Table 5 Comparison of clinical features and PET/CT parameters between grade 3A and low-grade follicular lymphoma.
Although the median SUVmax was higher in grade 3A FL than that in grades 1 and 2 (median: 13.63 vs. 11.45). There was an extensive overlap in SUVmax between the high- and low-grade groups (range: 2.25–39.62 vs. 3.17–39.80). The ROC curve analysis showed that an SUVmax of 17.38 was the optimal cutoff value (AUC: 0.642, sensitivity: 41.7%, specificity: 91.1%, PPV: 65.2%, and NPV: 79.6%; P = 0.020). The optimal cutoff value of platelet count was 154 × 109/L (AUC: 0.619, sensitivity: 50.0%, specificity: 74.4%, PPV: 43.9%, and NPV: 78.8%; P = 0.035). The multivariate analysis identified SUVmax (P = 0.001) and platelet count (P = 0.017) as independent predictors of FL pathologic grade (Supplementary Table S2).
Identifying FL patients at a high risk of disease progression or recurrence and those with a high pathologic grade is essential for effective clinical management. Our study demonstrated that baseline 18F-FDG PET/CT values are useful for predicting PFS in FL. In the multivariate analysis, Dmax, TLG, and LDH were independent predictors of PFS. A novel scoring system for predicting PFS, which incorporated a new baseline PET parameter Dmax, reflecting lesion dissemination, along with the metabolic parameter TLG and serum LDH showed superior performance to FLIPI, FLIPI2, and PRIMA-PI. In addition, this study found that SUVmax was related to pathological grading, and PET/CT could be used as an auxiliary tool but cannot substitute for biopsy.
18F-FDG PET/CT provides important information about tumor burden. In the present study, baseline TLG was the most robust predictor of outcome in FL patients, whereas the predictive value of TMTV was limited. Consistent with our observations, a retrospective study found that TLG, rather than TMTV, was the independent prognostic factor for FL patient survival (27). A multicenter study reported that TMTV was a robust predictor of outcome in FL, and combining TMTV with FLIPI2 score showed a good performance in identifying patients at a high risk of early progression; however, these investigators did not explore TLG (26). Another study found that both TMTV and TLG were strong predictors of PFS and OS in FL (28). The discrepancy between these reports may be explained by the different cutoff values and thresholding methods used for TMTV or TLG, differences in the distribution of risk groups, and heterogeneity of the treatment strategies.
In this study, we used a new feature of PET/CT images, Dmax, to represent disease dissemination. Dmax is a three-dimensional feature, which is easily measured and not influenced by the patient’s height. Unlike radiomic features, which are difficult to interpret from a biological perspective, Dmax is a measure of the extent of the disease. Dmax had a strong predictive power for PFS, which was better than that of the Ann Arbor stage, even among patients with advanced-stage FL. In line with our results, a high Dmax predicted a shorter PFS and OS in DLBCL patients (30, 34). It has also been reported that a high Dmax is a poor prognostic factor of HL (36). Unlike TMTV or TLG, which are derived from lesion contours, Dmax is calculated as the distance between two lesions that were furthest apart. Most importantly, the measurements of Dmax appeared to have good reproducibility and is thus broadly applicable.
Given the limitations of FLIPI and FLIPI2, other prognostic models for survival have been developed based on genomic or imaging data (19, 26, 29, 37, 38). In a multicenter study, TMTV and FLIPI2—which predicted markedly different PFS—were combined into a joint score (26). A prognostic model was developed for the same cohort that integrated baseline TMTV and end-of-induction PET (29). In the present study, we extracted two features from baseline PET/CT images—tumor burden and dissemination—representing two distinct and complementary aspects of the disease. We established a novel scoring system for predicting PFS based on Dmax, TLG, and LDH, which had a higher predictive accuracy than FLIPI, FLIPI2, and PRIMA-PI. Currently, most patients requiring treatment receive immunochemotherapy, which results in long-lasting remission and improved OS (5). Our prognostic scoring system was applicable and showed excellent performance in this population receiving immunochemotherapy. These results suggest that current prognostic indices can be further refined using tumor burden parameters and disease dissemination features obtained from PET/CT images. Due to the limited number of cases in this study, further research is needed to validate our results.
FDG uptake was shown to be higher in aggressive as compared to indolent NHL (39, 40). A widely varied SUVmax between low-grade and grade 3A FL was observed in many studies (31, 39). In a previous study, the cutoff value of SUVmax was 10.4, with 64% sensitivity and 74% specificity. In addition, TMTV and TLG had a comparable performance to SUVmax in making this distinction, with similar sensitivity and specificity values (31). However, TMTV and TLG could not discriminate low-grade from grade 3A FL in our study. The discrepancy between these findings and ours may be attributable to the differences in sample size and individual variability. The median SUVmax was significantly higher in the high-grade group than in the low-grade group (P = 0.013), but an extensive overlap existed, and there was a relatively low sensitivity for differentiating the grades of FL. Inevitably, some discordance in PET appearance may exist between the site of maximal FDG uptake and the actual site of tissue sampling. The histopathologic grading of different lesions in the same patients may be contrasting, resulting in an inconsistency between grading and clinical behavior. In addition, with the progression of the disease, some low-grade FL may be transformed into aggressive lymphoma (41, 42). The feasibility of using an absolute SUVmax cutoff value for grading FL is challenging. PET/CT may be a useful adjunct, but not a replacement for biopsy, to distinguish grade 3A from low-grade FL.
Platelet count was shown to be an independent prognostic indicator of outcome in peripheral T cell lymphoma and DLBCL (43, 44). However, platelet count was not a predictor of PFS in FL in the present study. The relationship between the platelet count and pathologic grade has been seldom discussed. We found that a low platelet count was an independent predictor of grade 3A FL. However, the underlying mechanism between the platelet count and the pathologic grade in FL needs further research.
Our study had some limitations. Firstly, this was a retrospective study with a relatively small sample size. Secondly, our predictive model was only for PFS. External validation in a larger population at multiple institutions is required.
TLG and Dmax obtained from PET/CT data represent two complementary aspects of the disease, capturing the whole-body tumor burden and lesion dissemination. TLG, Dmax, and serum LDH were independent prognostic factors of PFS. We established a novel scoring system for predicting PFS based on TLG, Dmax, and LDH, which showed a superior performance and clinical benefit compared to existing indices (FLIPI, FLIPI2, and PRIMA-PI).
Additionally, our results suggest that PET/CT may be a useful adjunct, but not a replacement, for biopsy in distinguishing grade 3A from low-grade FL.
The raw data supporting the conclusions of this article will be made available by the authors, without undue reservation.
The studies involving human participants were reviewed and approved by the Union Hospital, Tongji Medical College, Huazhong University of Science and Technology. Written informed consent for participation was not required for this study in accordance with the national legislation and the institutional requirements.
HL: conceptualization, software, formal analysis, and writing—original draft preparation. MW: data curation, methodology, and writing—original draft preparation. YZ: visualization and investigation. FH: methodology and visualization. KW: software and validation. CW: data curation and validation. ZG: conceptualization, methodology, writing—review and editing, and supervision. All authors contributed to the article and approved the submitted version.
This work was supported in part by the National Natural Science Foundation of China (No. 81771866).
The authors declare that the research was conducted in the absence of any commercial or financial relationships that could be construed as a potential conflict of interest.
All claims expressed in this article are solely those of the authors and do not necessarily represent those of their affiliated organizations, or those of the publisher, the editors and the reviewers. Any product that may be evaluated in this article, or claim that may be made by its manufacturer, is not guaranteed or endorsed by the publisher.
The Supplementary Material for this article can be found online at: https://www.frontiersin.org/articles/10.3389/fonc.2022.943151/full#supplementary-material.
1. Al-Hamadani M, Habermann TM, Cerhan JR, Macon WR, Maurer MJ, Go RS. Non-Hodgkin lymphoma subtype distribution, geodemographic patterns, and survival in the US: a longitudinal analysis of the national cancer data base from 1998 to 2011. Am J Hematol (2015) 90(9):790–5. doi: 10.1002/ajh.24086
2. Zhou Y, Qin Y, He X, Liu P, Yang J, Zhou L, et al. Long-term survival and prognostic analysis of advanced stage follicular lymphoma in the rituximab era: A China single-center retrospective study. Asia Pac J Clin Oncol (2021) 17(3):289–99. doi: 10.1111/ajco.13463
3. Swerdlow SH, Campo E, Pileri SA, Harris NL, Stein H, Siebert R, et al. The 2016 revision of the world health organization classification of lymphoid neoplasms. Blood (2016) 127(20):2375–90. doi: 10.1182/blood-2016-01-643569
4. Horn H, Schmelter C, Leich E, Salaverria I, Katzenberger T, Ott MM, et al. Follicular lymphoma grade 3B is a distinct neoplasm according to cytogenetic and immunohistochemical profiles. Haematologica (2011) 96(9):1327–34. doi: 10.3324/haematol.2011.042531
5. Freedman A, Jacobsen E. Follicular lymphoma: 2020 update on diagnosis and management. Am J Hematol (2020) 95(3):316–27. doi: 10.1002/ajh.25696
6. Vaidyanathan G, Czuczman MS. Follicular lymphoma grade 3: review and updates. Clin Lymphoma Myeloma Leuk (2014) 14(6):431–5. doi: 10.1016/j.clml.2014.04.008
7. Shah NN, Szabo A, Saba R, Strelec L, Kodali D, Vaughn JL, et al. Multicenter analysis of advanced stage grade 3A follicular lymphoma outcomes by frontline treatment regimen. Clin Lymphoma Myeloma Leuk (2019) 19(2):95–102. doi: 10.1016/j.clml.2018.11.010
8. Piccaluga PP, Califano A, Klein U, Agostinelli C, Bellosillo B, Gimeno E, et al. Gene expression analysis provides a potential rationale for revising the histological grading of follicular lymphomas. Haematologica (2008) 93(7):1033–8. doi: 10.3324/haematol.12754
9. Horn H, Kohler C, Witzig R, Kreuz M, Leich E, Klapper W, et al. Gene expression profiling reveals a close relationship between follicular lymphoma grade 3A and 3B, but distinct profiles of follicular lymphoma grade 1 and 2. Haematologica (2018) 103(7):1182–90. doi: 10.3324/haematol.2017.181024
10. Mihaljevic B, Jelicic J, Andjelic B, Antic D, Markovic O, Petkovic I, et al. FCG (FLIPI, charlson comorbidity index, and histological grade) score is superior to FLIPI in advanced follicular lymphoma. Int J Hematol (2016) 104(6):692–9. doi: 10.1007/s12185-016-2099-7
11. Mir F, Mattiello F, Grigg A, Herold M, Hiddemann W, Marcus R, et al. Follicular lymphoma evaluation index (FLEX): A new clinical prognostic model that is superior to existing risk scores for predicting progression-free survival and early treatment failure after frontline immunochemotherapy. Am J Hematol (2020) 95(12):1503–10. doi: 10.1002/ajh.25973
12. Xue T, Yu B-H, Yan W-H, Jiang X-N, Tian T, Zhou X-Y, et al. Prognostic significance of histologic grade and ki-67 proliferation index in follicular lymphoma. Hematol Oncol (2020) 38(5):665–72. doi: 10.1002/hon.2778
13. Mercadal S, Pomares H, Sancho JM, Climent F, Garcia O, Encuentra M, et al. Clinico-biological features, treatment and survival of 457 patients with histological grades 3A and 1-2 follicular lymphoma mostly treated with immunochemotherapy. Br J Haematol (2016) 172(3):470–3. doi: 10.1111/bjh.13502
14. Koch K, Hoster E, Ziepert M, Unterhalt M, Ott G, Rosenwald A, et al. Clinical, pathological and genetic features of follicular lymphoma grade 3A: a joint analysis of the German low-grade and high-grade lymphoma study groups GLSG and DSHNHL. Ann Oncol (2016) 27(7):1323–9. doi: 10.1093/annonc/mdw185
15. Luminari S, Biasoli I, Versari A, Rattotti S, Bottelli C, Rusconi C, et al. The prognostic role of post-induction FDG-PET in patients with follicular lymphoma: a subset analysis from the FOLL05 trial of the fondazione italiana linfomi (FIL). Ann Oncol (2014) 25(2):442–7. doi: 10.1093/annonc/mdt562
16. Casulo C, Byrtek M, Dawson KL, Zhou X, Farber CM, Flowers CR, et al. Early relapse of follicular lymphoma after rituximab plus cyclophosphamide, doxorubicin, vincristine, and prednisone defines patients at high risk for death: An analysis from the national LymphoCare study. J Clin Oncol (2015) 33(23):2516–22. doi: 10.1200/JCO.2014.59.7534
17. Solal-Céligny P, Roy P, Colombat P, White J, Armitage JO, Arranz-Saez R, et al. Follicular lymphoma international prognostic index. Blood (2004) 104(5):1258–65. doi: 10.1182/blood-2003-12-4434
18. Federico M, Bellei M, Marcheselli L, Luminari S, Lopez-Guillermo A, Vitolo U, et al. Follicular lymphoma international prognostic index 2: a new prognostic index for follicular lymphoma developed by the international follicular lymphoma prognostic factor project. J Clin Oncol (2009) 27(27):4555–62. doi: 10.1200/JCO.2008.21.3991
19. Jurinovic V, Kridel R, Staiger AM, Szczepanowski M, Horn H, Dreyling MH, et al. Clinicogenetic risk models predict early progression of follicular lymphoma after first-line immunochemotherapy. Blood (2016) 128(8):1112–20. doi: 10.1182/blood-2016-05-717355
20. Bachy E, Maurer MJ, Habermann TM, Gelas-Dore B, Maucort-Boulch D, Estell JA, et al. A simplified scoring system in de novo follicular lymphoma treated initially with immunochemotherapy. Blood (2018) 132(1):49–58. doi: 10.1182/blood-2017-11-816405
21. Nakajima R, Moskowitz AJ, Michaud L, Mauguen A, Batlevi CL, Dogan A, et al. Baseline FDG-PET/CT detects bone marrow involvement in follicular lymphoma and provides relevant prognostic information. Blood Adv (2020) 4(8):1812–23. doi: 10.1182/bloodadvances.2020001579
22. Metser U, Hussey D, Murphy G. Impact of (18)F-FDG PET/CT on the staging and management of follicular lymphoma. Br J Radiol (2014) 87(1042):20140360. doi: 10.1259/bjr.20140360
23. Annunziata S, Cuccaro A, Tisi MC, Hohaus S, Rufini V. FDG-PET/CT at the end of immuno-chemotherapy in follicular lymphoma: the prognostic role of the ratio between target lesion and liver SUV (rPET). Ann Nucl Med (2018) 32(5):372–7. doi: 10.1007/s12149-018-1243-2
24. Feng X, Wen X, Li L, Sun Z, Li X, Zhang L, et al. Baseline total metabolic tumor volume and total lesion glycolysis measured on 18F-FDG PET-CT predict outcomes in T-cell lymphoblastic lymphoma. Cancer Res Treat (2021) 53(3):837–46. doi: 10.4143/crt.2020.123
25. Frood R, Burton C, Tsoumpas C, Frangi AF, Gleeson F, Patel C, et al. Baseline PET/CT imaging parameters for prediction of treatment outcome in Hodgkin and diffuse large b cell lymphoma: a systematic review. Eur J Nucl Med Mol Imaging (2021) 48(10):3198–220. doi: 10.1007/s00259-021-05233-2
26. Meignan M, Cottereau AS, Versari A, Chartier L, Dupuis J, Boussetta S, et al. Baseline metabolic tumor volume predicts outcome in high-Tumor-Burden follicular lymphoma: A pooled analysis of three multicenter studies. J Clin Oncol (2016) 34(30):3618–26. doi: 10.1200/JCO.2016.66.9440
27. Zhou Y, Zhao Z, Li J, Zhang B, Sang S, Wu Y, et al. Prognostic values of baseline, interim and end-of therapy f-FDG PET/CT in patients with follicular lymphoma. Cancer Manag Res (2019) 11:6871–85. doi: 10.2147/CMAR.S216445
28. Liang J-H, Zhang Y-P, Xia J, Ding C-Y, Wu W, Wang L, et al. Prognostic value of baseline and interim total metabolic tumor volume and total lesion glycolysis measured on 18F-FDG PET-CT in patients with follicular lymphoma. Cancer Res Treat (2019) 51(4):1479–87. doi: 10.4143/crt.2018.649
29. Cottereau AS, Versari A, Luminari S, Dupuis J, Chartier L, Casasnovas R-O, et al. Prognostic model for high-tumor-burden follicular lymphoma integrating baseline and end-induction PET: a LYSA/FIL study. Blood (2018) 131(22):2449–53. doi: 10.1182/blood-2017-11-816298
30. Cottereau A-S, Nioche C, Dirand A-S, Clerc J, Morschhauser F, Casasnovas O, et al. F-FDG PET dissemination features in diffuse Large b-cell lymphoma are predictive of outcome. J Nucl Med (2020) 61(1):40–5. doi: 10.2967/jnumed.119.229450
31. Major A, Hammes A, Schmidt MQ, Morgan R, Abbott D, Kamdar M. Evaluating novel PET-CT functional parameters TLG and TMTV in differentiating low-grade versus grade 3A follicular lymphoma. Clin Lymphoma Myeloma Leuk (2020) 20(1):39–46. doi: 10.1016/j.clml.2019.09.609
32. Boellaard R, O'Doherty MJ, Weber WA, Mottaghy FM, Lonsdale MN, Stroobants SG, et al. FDG PET and PET/CT: EANM procedure guidelines for tumour PET imaging: version 1.0. Eur J Nucl Med Mol Imaging (2010) 37(1):181–200. doi: 10.1007/s00259-009-1297-4
33. Mehta-Shah N, Ito K, Bantilan K, Moskowitz AJ, Sauter C, Horwitz SM, et al. Baseline and interim functional imaging with PET effectively risk stratifies patients with peripheral T-cell lymphoma. Blood Adv (2019) 3(2):187–97. doi: 10.1182/bloodadvances.2018024075
34. Eertink JJ, van de Brug T, Wiegers SE, Zwezerijnen GJC, Pfaehler EAG, Lugtenburg PJ, et al. (18)F-FDG PET baseline radiomics features improve the prediction of treatment outcome in diffuse large b-cell lymphoma. Eur J Nucl Med Mol Imaging (2022) 49(3):932–42. doi: 10.1007/s00259-021-05480-3
35. Camp RL, Dolled-Filhart M, Rimm DL. X-Tile: a new bio-informatics tool for biomarker assessment and outcome-based cut-point optimization. Clin Cancer Res (2004) 10(21):7252–9. doi: 10.1158/1078-0432.CCR-04-0713
36. Zhou Y, Zhu Y, Chen Z, Li J, Sang S, Deng S. Radiomic features of (18)F-FDG PET in Hodgkin lymphoma are predictive of outcomes. Contrast media Mol Imaging (2021) 2021:6347404. doi: 10.1155/2021/6347404
37. Pastore A, Jurinovic V, Kridel R, Hoster E, Staiger AM, Szczepanowski M, et al. Integration of gene mutations in risk prognostication for patients receiving first-line immunochemotherapy for follicular lymphoma: a retrospective analysis of a prospective clinical trial and validation in a population-based registry. Lancet Oncol (2015) 16(9):1111–22. doi: 10.1016/S1470-2045(15)00169-2
38. Huet S, Tesson B, Jais J-P, Feldman AL, Magnano L, Thomas E, et al. A gene-expression profiling score for prediction of outcome in patients with follicular lymphoma: a retrospective training and validation analysis in three international cohorts. Lancet Oncol (2018) 19(4):549–61. doi: 10.1016/S1470-2045(18)30102-5
39. Schöder H, Noy A, Gönen M, Weng L, Green D, Erdi YE, et al. Intensity of 18fluorodeoxyglucose uptake in positron emission tomography distinguishes between indolent and aggressive non-hodgkin's lymphoma. J Clin Oncol (2005) 23(21):4643–51. doi: 10.1200/JCO.2005.12.072
40. Alobthani G, Romanov V, Isohashi K, Matsunaga K, Watabe T, Kato H, et al. Value of f-FDG PET/CT in discrimination between indolent and aggressive non-hodgkin's lymphoma: A study of 328 patients. Hell J Nucl Med (2018) 21(1)::7–14. doi: 10.1967/s002449910701
41. Montoto S, Fitzgibbon J. Transformation of indolent b-cell lymphomas. J Clin Oncol (2011) 29(14):1827–34. doi: 10.1200/JCO.2010.32.7577
42. Fischer T, Zing NPC, Chiattone CS, Federico M, Luminari S. Transformed follicular lymphoma. Ann Hematol (2018) 97(1):17–29. doi: 10.1007/s00277-017-3151-2
43. Choi M, Lee J-O, Jung J, Lee JY, Lee E, Lee H, et al. Prognostic value of platelet count in patients with peripheral T cell lymphoma. Acta Haematol-basel (2019) 141(3):176–86. doi: 10.1159/000495337
Keywords: follicular lymphoma, 18F-FDG PET/CT, prognosis, pathologic grade, TLG
Citation: Li H, Wang M, Zhang Y, Hu F, Wang K, Wang C and Gao Z (2022) Prediction of prognosis and pathologic grade in follicular lymphoma using 18F-FDG PET/CT. Front. Oncol. 12:943151. doi: 10.3389/fonc.2022.943151
Received: 13 May 2022; Accepted: 06 July 2022;
Published: 28 July 2022.
Edited by:
Muhammad Bilal Abid, Medical College of Wisconsin, United StatesReviewed by:
Angelo Castello, IRCCS Ca ‘Granda Foundation Maggiore Policlinico Hospital, ItalyCopyright © 2022 Li, Wang, Zhang, Hu, Wang, Wang and Gao. This is an open-access article distributed under the terms of the Creative Commons Attribution License (CC BY). The use, distribution or reproduction in other forums is permitted, provided the original author(s) and the copyright owner(s) are credited and that the original publication in this journal is cited, in accordance with accepted academic practice. No use, distribution or reproduction is permitted which does not comply with these terms.
*Correspondence: Zairong Gao, Z2FvYm9ubkAxNjMuY29t
†These authors have contributed equally to this work
Disclaimer: All claims expressed in this article are solely those of the authors and do not necessarily represent those of their affiliated organizations, or those of the publisher, the editors and the reviewers. Any product that may be evaluated in this article or claim that may be made by its manufacturer is not guaranteed or endorsed by the publisher.
Research integrity at Frontiers
Learn more about the work of our research integrity team to safeguard the quality of each article we publish.