 Bingjie Guan
 Xinmin Huang2†
 Huang Xia
 Guoxian Guan
95% of researchers rate our articles as excellent or good
Learn more about the work of our research integrity team to safeguard the quality of each article we publish.
Find out more
ORIGINAL RESEARCH article
Front. Oncol. , 03 October 2022
Sec. Cancer Imaging and Image-directed Interventions
Volume 12 - 2022 | https://doi.org/10.3389/fonc.2022.941786
This article is part of the Research Topic Application of Radiomics in Understanding Tumor Biological Behaviors and Treatment Response View all 17 articles
Background: The aim of this study is to explore the most effective inflammation, magnetic resonance imaging (MRI), and nutrition markers for survival and pathology complete response (pCR) in patients with locally advanced rectal cancer (LARC).
Methods: A total of 278 patients with LARC undergoing neoadjuvant chemoradiotherapy (NCRT) and radical surgery from 2016 to 2019 were included. The X-tile method was used to select the optimal cutoff points for the mesorectal package area (MPA), advanced lung cancer inflammation index (ALI), prognostic nutritional index (PNI), systemic immune-inflammation index (SII), neutrophil-to-lymphocyte ratio (NLR), platelet-to-lymphocyte ratio (PLR), and monocyte-to-lymphocyte ratio (MLR) scores. Cox regression analysis was used to identify risk factors of disease-free survival (DFS). To discover pCR risk factors, logistic regression analysis was employed. A predictive nomogram for DFS was constructed.
Results: According to the least absolute shrinkage and selection operator analysis, the MPA was the only significant predictor for the DFS in patients with LARC. Kaplan-Meier (K-M) analysis demonstrated that groups with higher MPA, PNI, SII, NLR, MLR, and ALI score had improved DFS (all P < 0.05). Receiver operating characteristic (ROC) analysis revealed that the MPA and PNI could accurately predict the pCR in patients with LARC after NCRT. The MPA score and NLR score were found to be independent predictors of DFS after NCRT using Cox regression analysis. Logistical regression analysis demonstrated that the MPA score, PNI score, and pre-NCRT cN stage were all independent predictors of pCR in patients with LARC after NCRT. Recursive partitioning analysis and time-independent ROC curve analysis demonstrated that MPA score was the most important predictor of pCR and prognosis in patients with LARC after NCRT.
Conclusions: MPA was identified as the most effective marker for MRI, and the prognostic value was further confirmed by time–ROC analysis. More intense adjuvant treatment could be considered for lower–MPA score patients with LARC after NCRT. Obesity in the pelvis encourages the understanding of the prognosis prediction of patients with LARC after NCRT.
The neoadjuvant chemoradiotherapy (NCRT) has been the standard treatment for locally advanced rectal cancer (LARC). The NCRT benefited from a higher likelihood of tumor shrinking and downstaging, enhanced tumor resectability, and better local tumor control (1–3). NCRT could contribute to pathological complete response (pCR) in 15%–27% of patients with LARC and 20%–30% near pCR in patients with LARC (4). Patients with pCR or near pCR could adopt the “watch and wait” strategy or local excision to reduce surgery-related morbidity and increase organ preservation when compared to the total mesorectal excision (TME) surgery (5–7). However, more than 30% of patients with LARC were resistant to NCRT and experiencing NCRT adverse effects (8, 9). Currently, it is still challenging to reliably estimate treatment outcomes for patients with LARC after NCRT.
The rates of obesity have risen in the recent years, and obesity contributes to a variety of chronic morbidities (10). Numerous studies have shown that obesity is associated with the occurrence and progression of colorectal cancer (11–13). However, the influence of obesity on NCRT response of LARC remains controversial (14–17). Body mass index (BMI) is the most common tool for assessing obesity, although Asians typically have normal BMI levels and abdominal obesity, which could lead to an inaccuracy evaluation. Instead of the BMI, the NCRT response may be related to the pelvic fat. Investigating pelvic fat may provide an answer to the question of whether obesity affects the NCRT responsiveness. High-resolution pelvic or rectal magnetic resonance imaging (MRI) may accurately quantify the fat in the pelvis and rectal mesorectal thickness to predict the NCRT response. Several studies found that obesity was contributing to the inflammatory response, which influenced tumor development, prognosis, and therapy response (18–20). The inflammatory indexes in the peripheral blood, NLR, MLR, PLR, and SII have been used as markers of predicting efficacy and toxicity of NCRT in patients with LARC in our previous study (21). To explore the relationship among the obesity, inflammatory response and NCRT response were important.
To address the gap in the literature, the present study aimed to explore the most effective marker of MRI measurements, systematic inflammatory, and nutrition in patients with LARC in terms of survival outcome and NCRT response.
In this study, we retrospectively analyzed 278 patients with LARC after NCRT who underwent pelvic MRI before NCRT in our hospital and radical resection between 2016 and 2019. The patient inclusion criteria and exclusion criteria were reported in our previous study (8, 22). The evaluation of the tumor staging was according to the American Joint Committee on Cancer (AJCC) (23). The TME was following the NCRT regimen, which has been described in our previous study. According to the National Comprehensive Cancer Network (NCCN) guidelines, the patients received postoperative adjuvant chemotherapy for 6 months about 1 month after surgery (24). All laboratory results and pelvic MRI images were collected within 1 week before NCRT. The last cutoff date for follow-up was 31 December 2021.
Two chemotherapeutic regimens with dosages were given as follows: (1) Capox: oxaliplatin at 130 mg/m2 intravenously guttae, day 1; capecitabine at 825 mg/m2 twice daily oral, days 1–14; every 3 weeks, for two cycles during concurrent radiotherapy; another two cycles were performed during the interval from the end of radiation to surgery; (2) capecitabine alone: capecitabine at 825 mg/m2 twice daily oral, during the whole period of radiotherapy; another one cycle increased dosages to 1,250 mg/m2 was performed in 2 weeks during the waiting period.
The gross tumor volume (GTV) was calculated on the basis of clinical information, including digital rectal examination, endoscopy ultrasound, and abdominopelvic MRI. The clinical target volume (CTV) included all mesorectum, presacral soft tissue, obturator, and internal iliac lymphatic drainage regions. The planning target volume (PTV) was defined as the GTV or CTV with uniform margins of 10 mm. The neoadjuvant radiotherapy regimens consisted of three-dimensional conformal radiotherapy (3D-CRT) and intensity-modulated radiation therapy (IMRT). A dose of 50.4 Gy was delivered to PTV-GTV with 3D-CRT in 28 fractions, whereas 50 Gy was delivered with IMRT in 25 fractions. In addition, 45 Gy was delivered to PTV-CTV in 25 fractions for both types of regimens (24).
The pathological tumor regression grade (TRG) (23) was used as the evaluation criterion of tumor response to NCRT. No residual tumor cells in the resected specimen, including the primary site and lymph nodes, were regarded as pathological complete response (pCR). Venous blood samples were obtained within 1 week before NCRT. The following formulae were employed to determine the systematic inflammatory markers: The systemic immune-inflammation index (SII) = platelet count × neutrophil count/lymphocyte count, neutrophil-to-lymphocyte ratio (NLR) = neutrophil count/lymphocyte count, platelet-to-lymphocyte ratio (PLR) = platelet count/lymphocyte count and monocyte-to-lymphocyte ratio (MLR) = monocyte count/lymphocyte count. Advanced lung cancer inflammation index (ALI) = BMI (kg/m2) × albumin (g/L)/NLR, prognostic nutritional index (PNI) = serum albumin (g/L) + 5 × lymphocyte count (109/L).
MRI was performed using either a 1.5-T General Electric (450 W, software version 25) or a 3-T Phillips (Achieva, software version 3.2.3.5) system. Large field-of-view FT2-weighted axial images with a slice thickness of 5 mm were downloaded from the PACS system and analyzed with publicly available software (3D Slicer©, Version 4.11; Bethesda, MD) (25) that was supported by National Institutes of Health. The measuring procedure is shown in Figure 1, as described by McKechnie et al. (26).
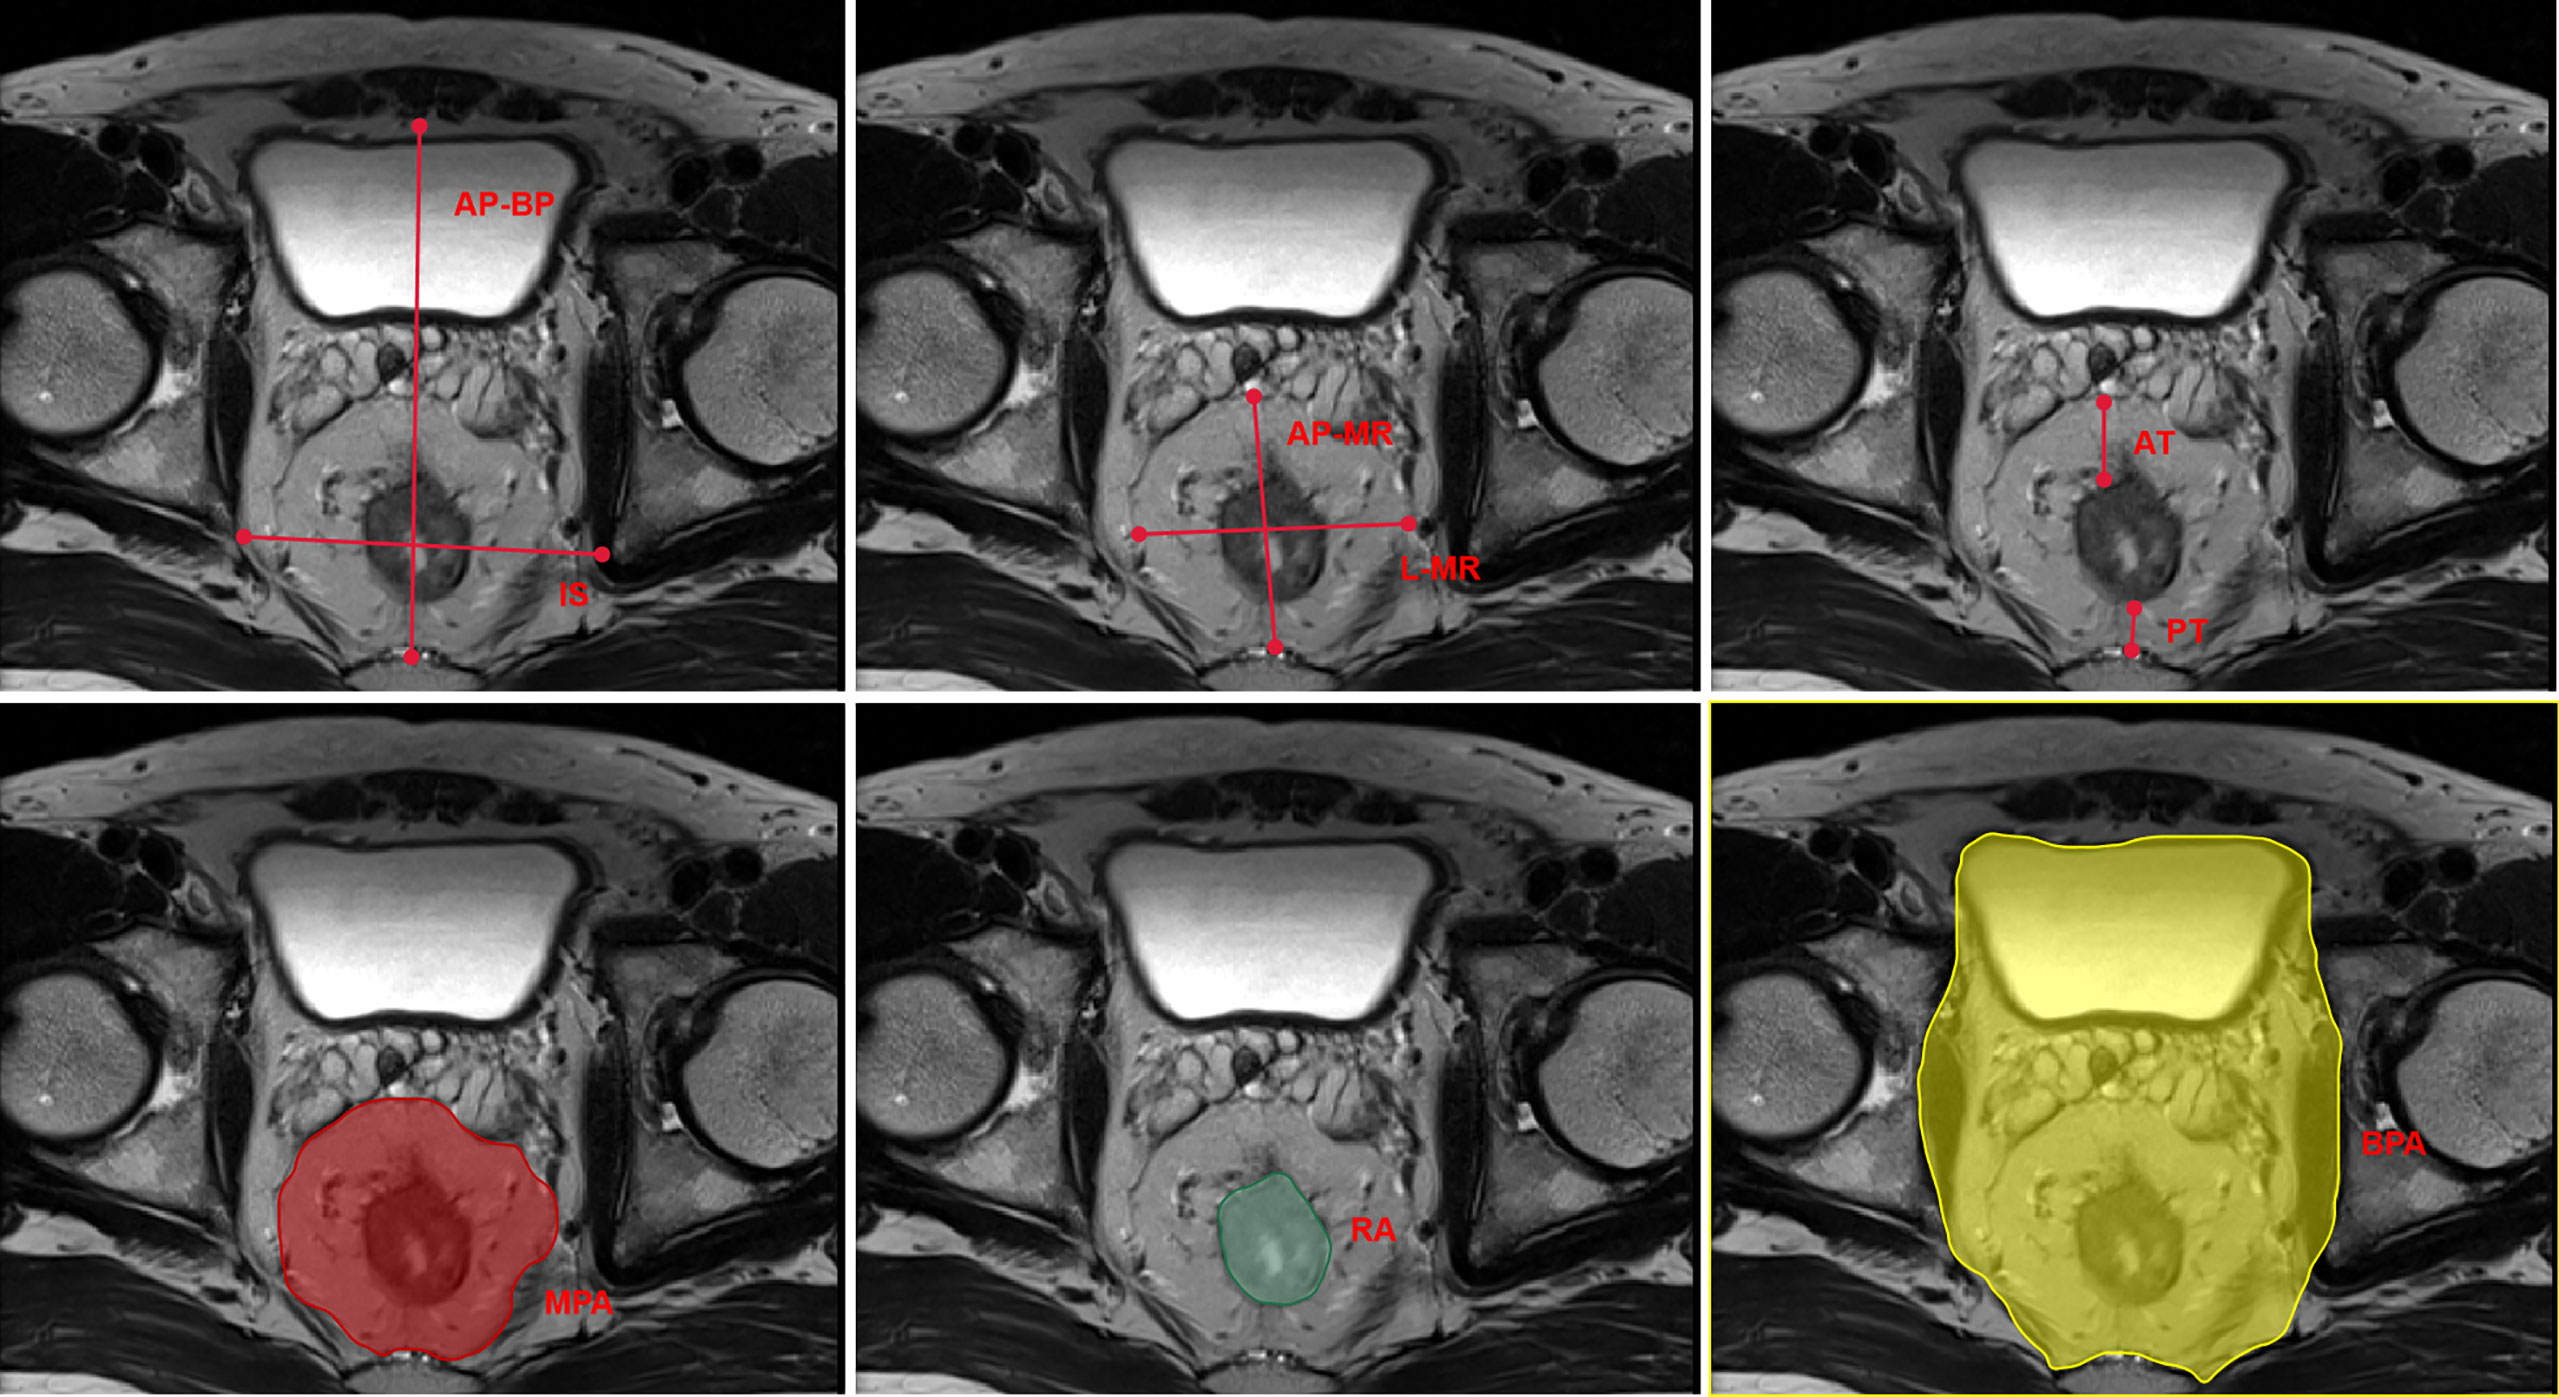
Figure 1 Schematic plot of the pelvic MRI measurements. MRI, magnetic resonance imaging; IS, interspinous distance; AP-BP, anterior–posterior bony pelvis span; L-MR, lateral mesorectal span; AP-MR, anterior–posterior mesorectal span; AT, anterior mesorectal thickness; PT, posterior mesorectal thickness; MPA, mesorectalpackage area; RA, rectal area; BPA, bony pelvis area.
The Statistic Package for Social Science (SPSS, version 23.0) and R software packages version 4.0.1 were used to perform the statistical analyses. The X-tile program (http://www.tissuearray.org/rimmlab/) was used to calculate and determine the best cutoff points for the SII, NLR, PLR, MLR, ALI, and PNI counts (27). The Kaplan–Meier method and log-rank test were performed to evaluate the survival outcomes. The risk factors for overall survival (OS) and disease-free survival (DFS) were calculated by the Cox proportional hazards model. On the basis of the Cox regression model analysis, a nomogram was developed by using the R project. Time-dependent receiver operating characteristic (ROC) curves were used to evaluate the performance of the biomarkers. Least absolute shrinkage and selection operator (LASSO) Cox regression model was applied to determine the ideal coefficient for each prognostic feature and estimate the likelihood deviance (28, 29). Recursive partitioning analysis (RPA) was used to construct a decision tree that divides patients into different homogeneous risk groups by using the R project (30). Statistical significance was defined as P < 0.05.
A total of 278 patients with LARC after NCRT were eligible for this analysis. There were 181 (181 of 278, 65.1%) male patients, with a mean age of 53.97 ± 10.11 years. Tables 1, 2 list the baseline clinicopathological characteristics of the patients.
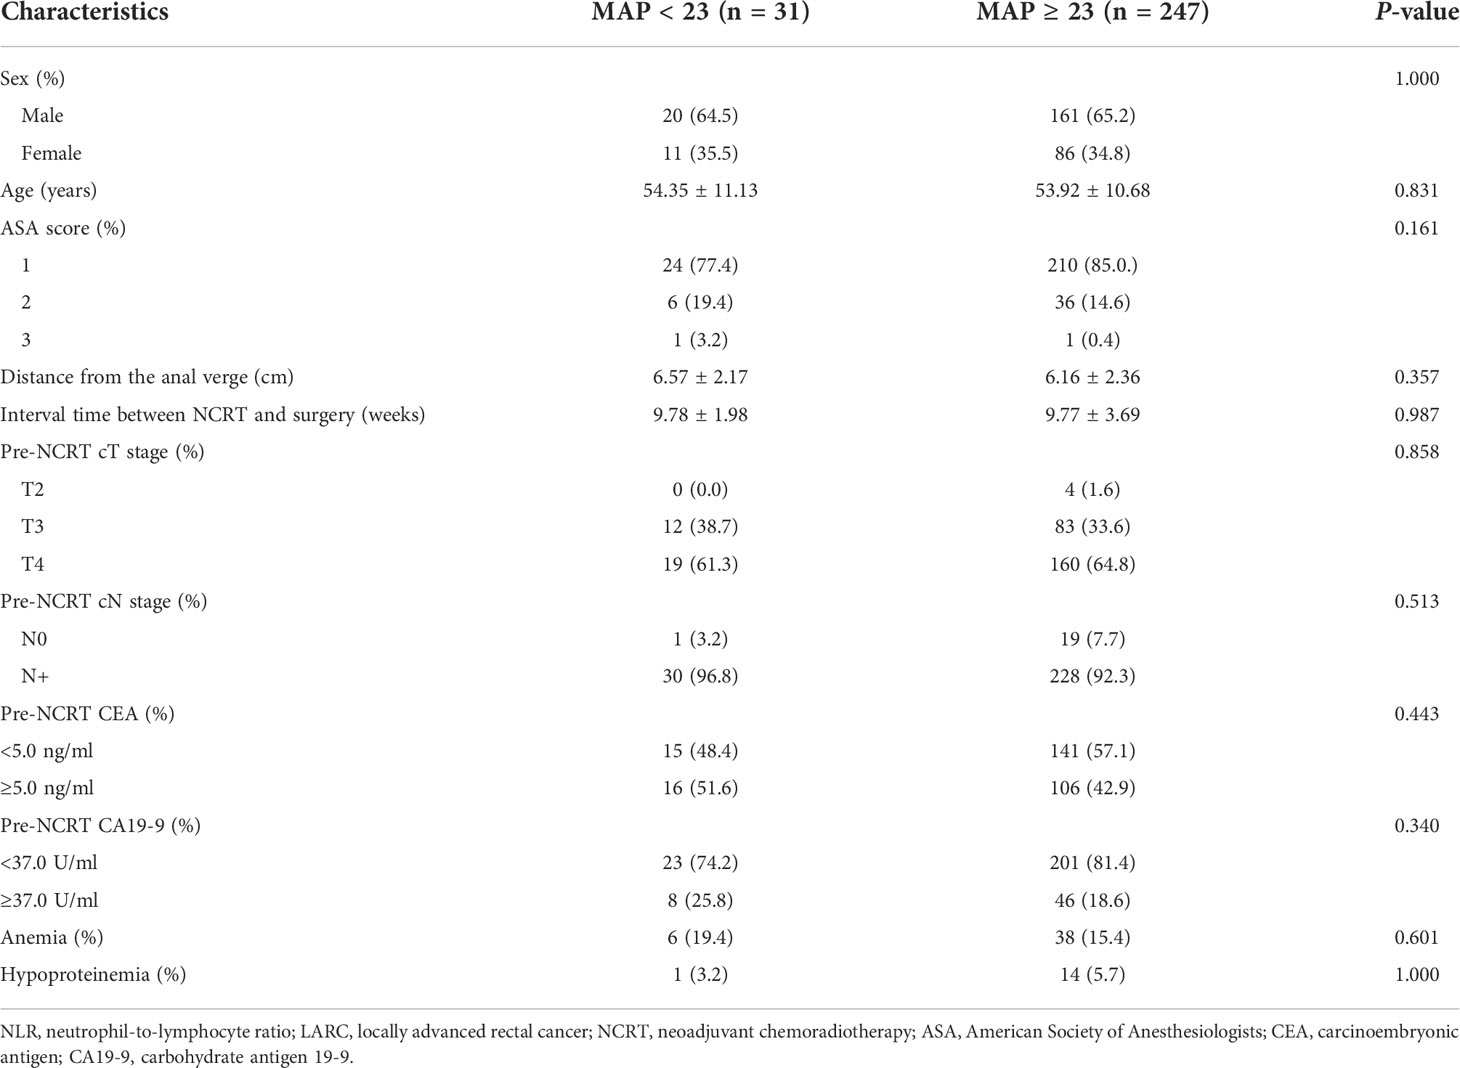
Table 1 Baseline characteristics in patients with LARC after NCRT stratified by MAP.
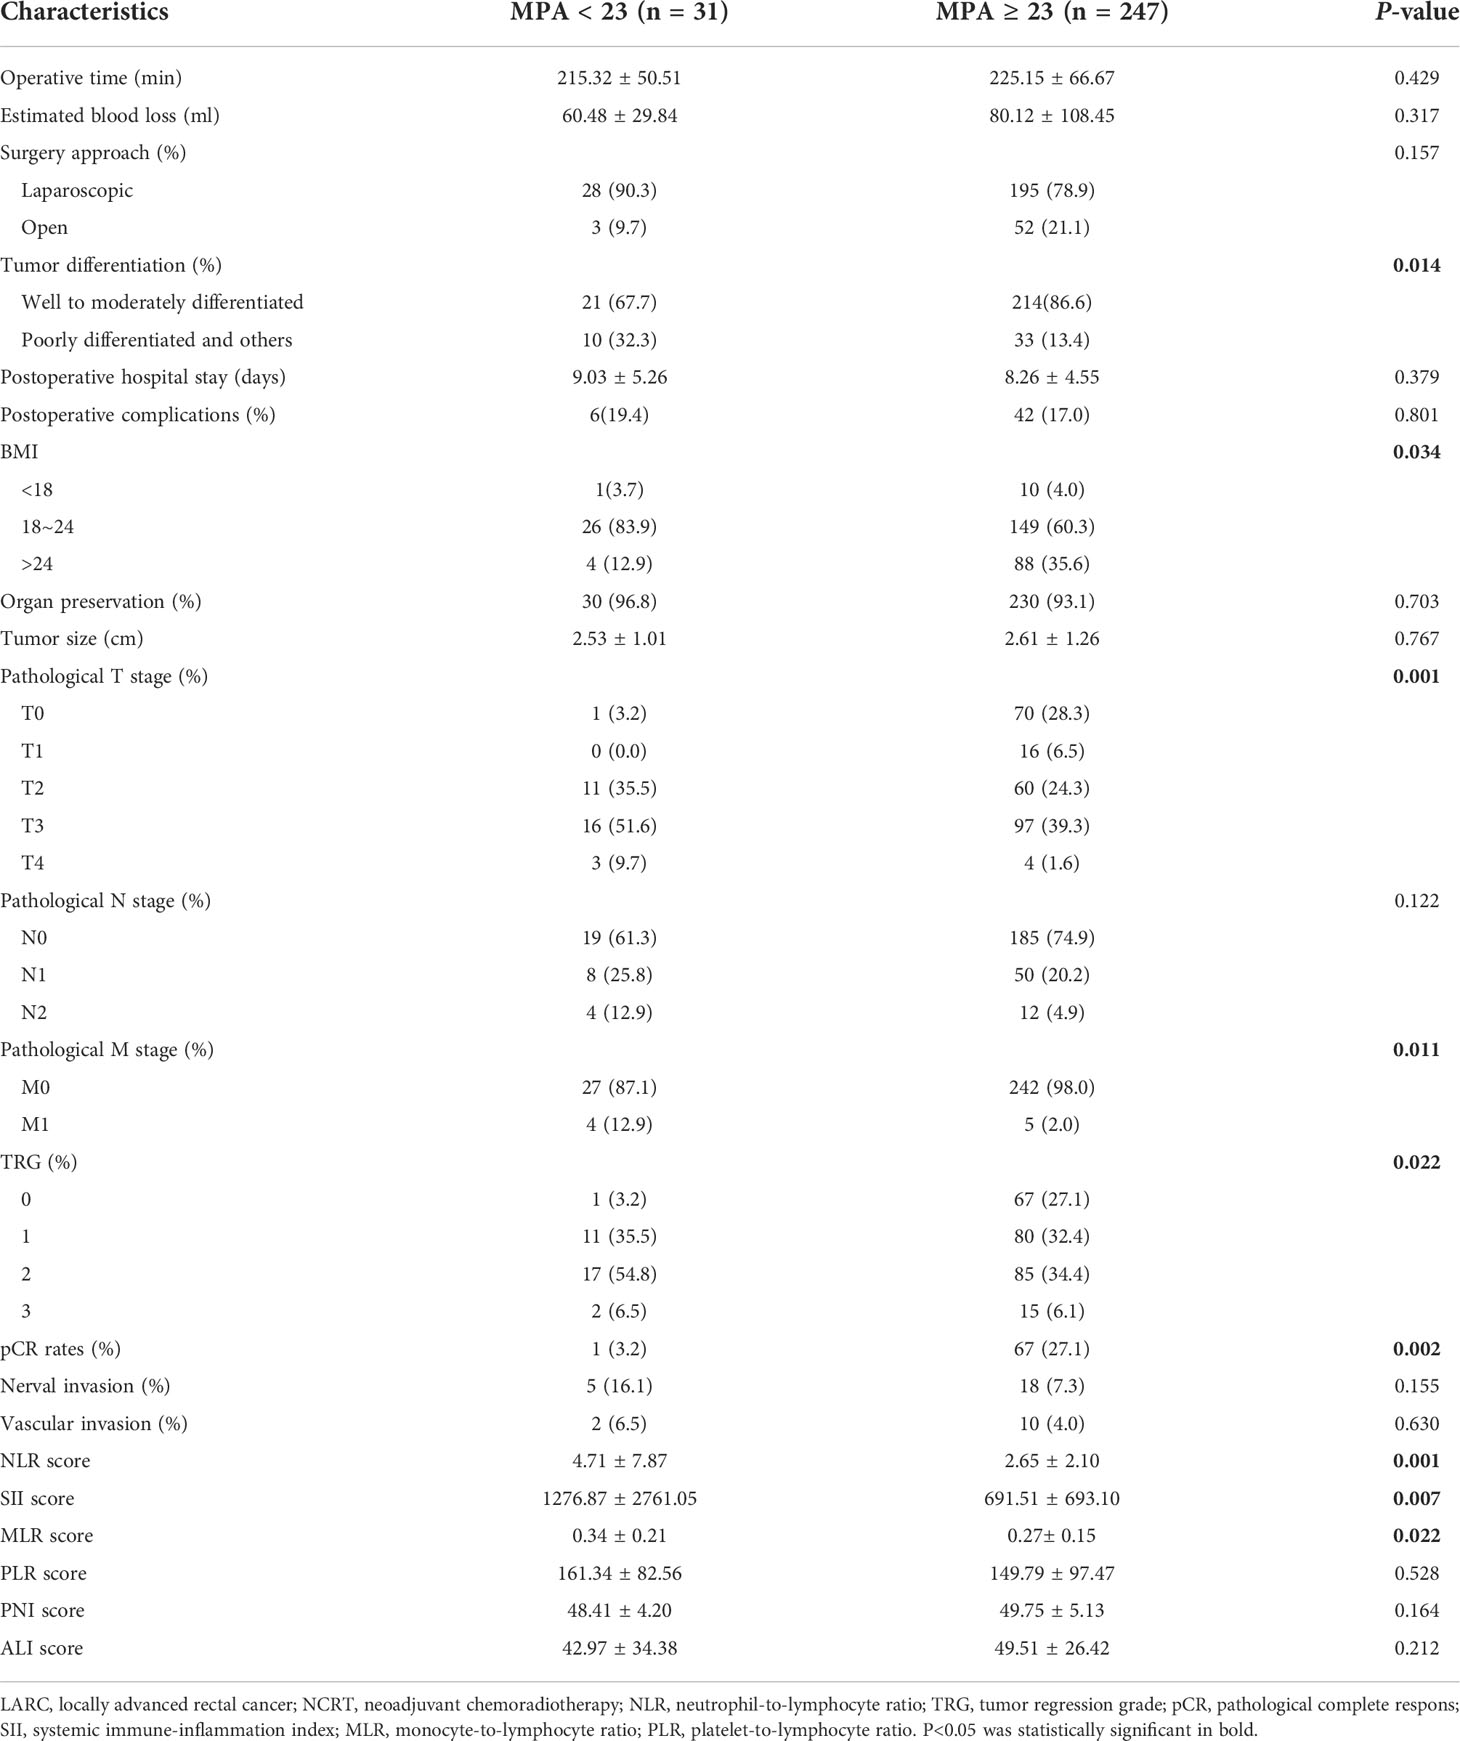
Table 2 Operative and postoperative outcomes in patients with LARC after NCRT stratified by MPA.
LASSO analysis was used to explore significant predictors in MRI measurement markers for DFS in the patients with LARC after NCRT. The result demonstrated that the mesorectal package area (MPA) was the only factor that mattered (Figures 2A, B). Furthermore, the X-tile plot was employed to select the optimal cutoff point for the MPA, with the outcome revealing the cutoff values of 23 for MPA (Supplementary Figure 1). In addition, the best optimal cut-off point for the MPA was enrolled in the next analysis. The result demonstrated that a high value of the MPA had better prognosis in the patients with LARC (DFS, P < 0.01, Figure 3G; OS, P = 0.05, Figure 4G).
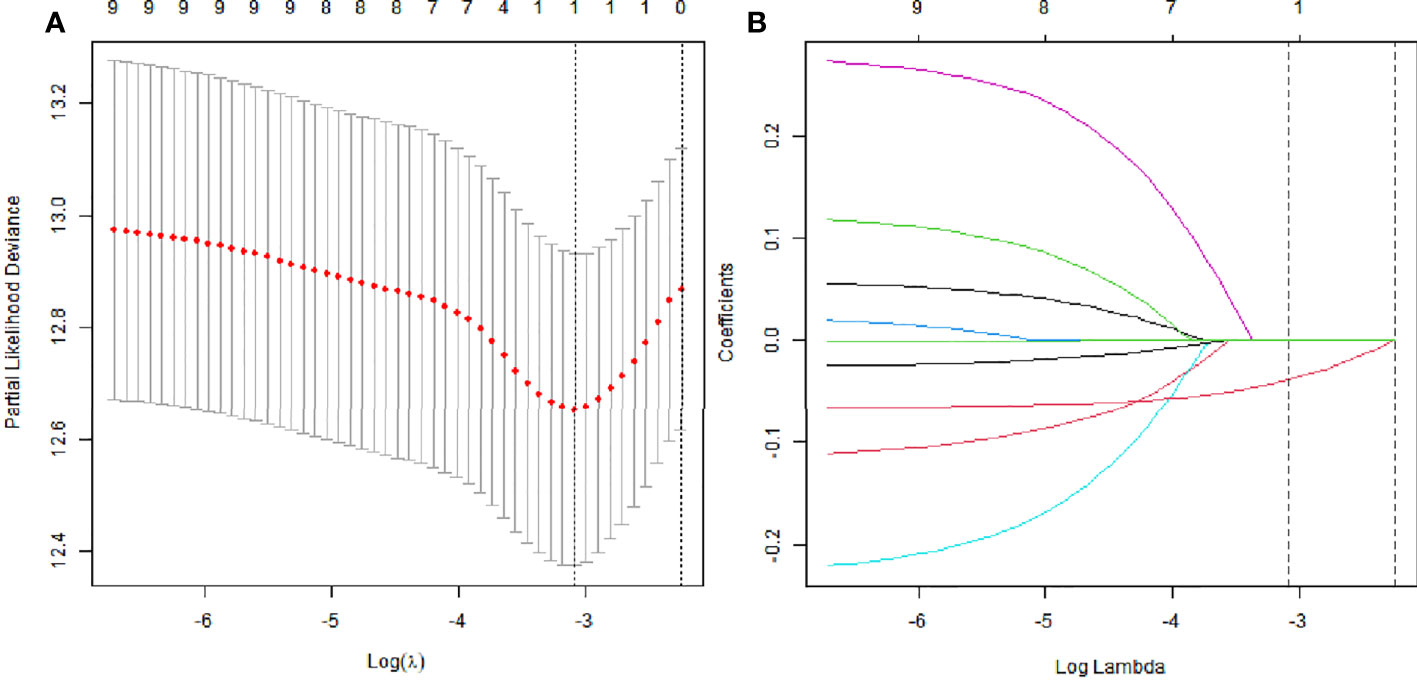
Figure 2 The least absolute shrinkage and selection operator (LASSO) analysis and risk score system were constructed. (A) The area under the ROC curve (AUC) was estimated with a cross-validation technique, and the largest lambda value was chosen when the cross-validation error was within one standard error of the minimum. (B) LASSO coefficient profiles of the eight factors.
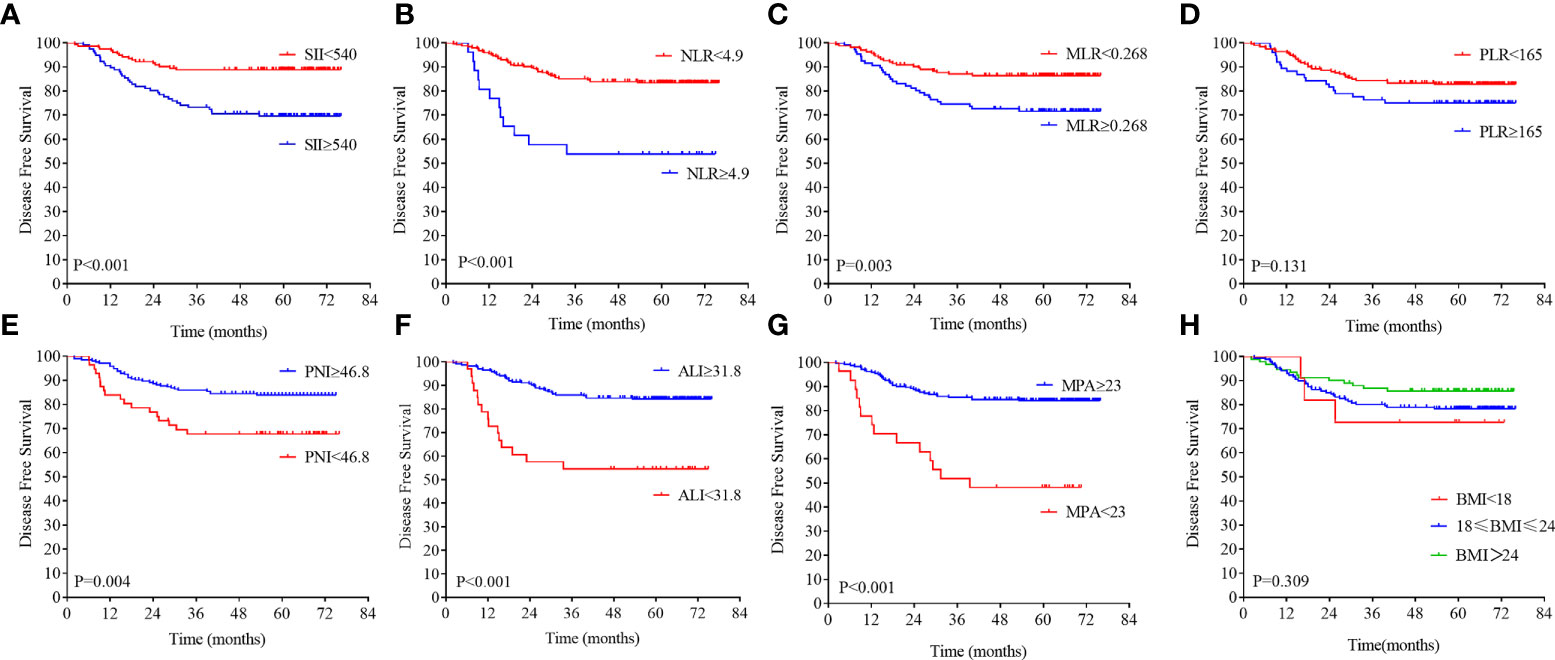
Figure 3 Kaplan–Meier analysis of the NLR, SII, PLR, MLR, PNI, ALI, MPA, and BMI level. The disease-free survival for the optimal cutoff point of the SII (A), NLR (B), MLR (C), PLR (D), PNI (E), ALI (F), MPA (G), and BMI level (H).
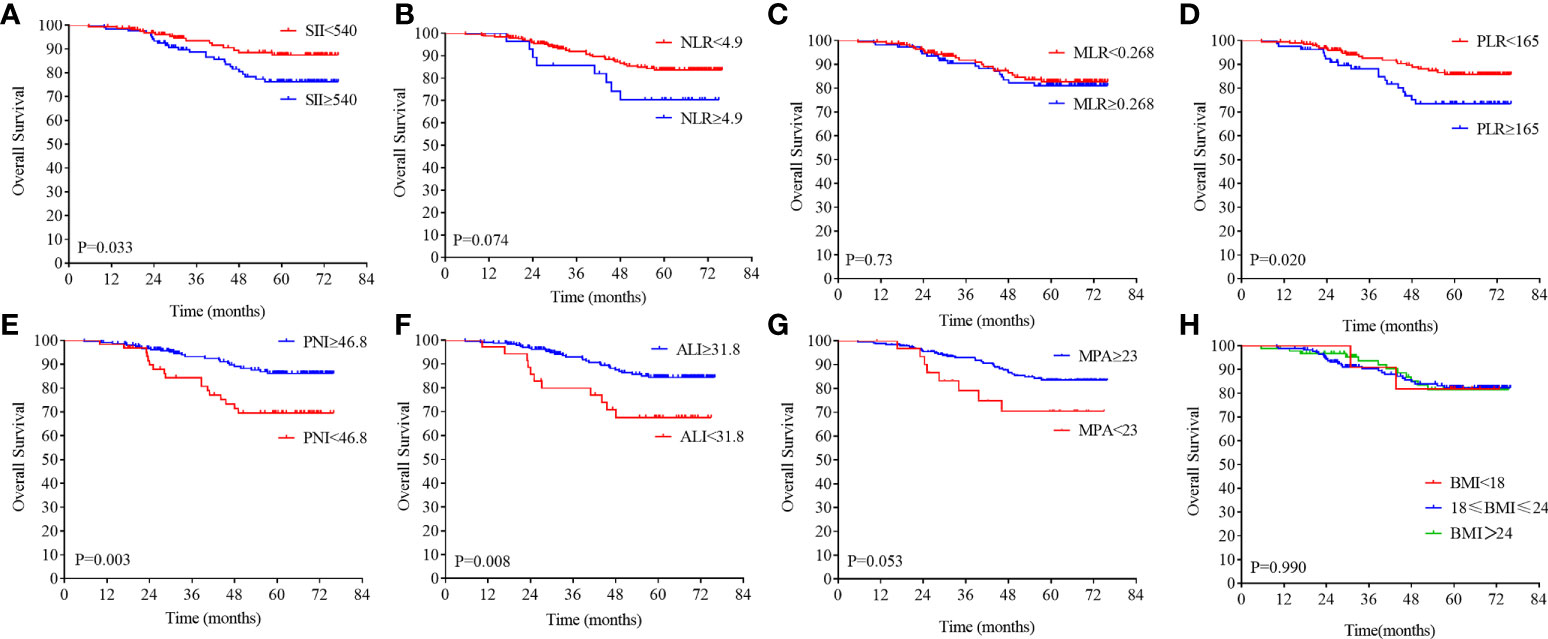
Figure 4 Kaplan–Meier analysis of the NLR, SII, PLR, MLR, PNI, ALI, MPA, and BMI level. The overall survival for the optimal cutoff point of the SII (A), NLR (B). MLR (C), PLR (D), PNI (E), ALI (F), MPA (G), BMI (H).
On the basis of the DFS, the X-tile plots were constructed and identified 540, 4.9, 0.268, 165, 46.8, and 31.8 as the cutoff values for SII, NLR, MLR, PLR, PNI, and ALI, respectively. Then, we divided the entire cohort into low and high subgroups. As shown in Figure 3, higher PNI and ALI scores were associated with better DFS in patients with LARC. DFS rates were significantly greater in the high PNI and ALI score group at 3 years, at 85.9% and 85.9%, respectively, than in the low PNI and ALI score group, at 67.7% and 54.5%, respectively (all P = 0.01; Figures 3E, F). Moreover, a high score of the SII, NLR, PLR, and MLR was correlated with worse DFS in patients with LARC compared with the low SII, NLR, PLR, and MLR score group, as shown in Figures 3A–D. The DFS rates at 3 years for the high SII, NLR, PLR, and MLR group were 73.2%, 53.8%, 76.3%, and 74.5%, respectively, significantly lower than 88.8%, 77.6%, 85.1%, and 87.1% in the low SII, NLR, PLR, and MLR groups, respectively (P < 0.01, P < 0.01, P = 0.13, and P < 0.01, respectively). Noticeably, the high PNI and ALI score groups had better OS compared with the low score group, as shown in Figures 4E, F (all P < 0.01). In addition, low SII and PLR score group had significantly better OS than the high score group (SII: P = 0.03, Figure 4A; PLR: P = 0.02, Figure 4D). There was no statistical difference between the low NLR and MLR score groups and the high NLR and MLR score groups (NLR: P = 0.07, Figure 4B; MLR: P = 0.73, Figure 4C). Moreover, the BMI level was not associated with the DFS and OS in the patients with LARC (DFS: P = 0.31, Figure 3H; OS: P = 0.99, Figure 4H).
The correlations between pathological complete response (pCR) and MRI, inflammatory and nutritional biomarkers were further explored. The ROC analysis was performed to verify the predicting ability of the biomarkers. The MPA and PNI scores had powerful ability to predict the pCR in the patients with LARC [PNI: area under the ROC curve (AUC) = 0.62, P < 0.01, Figure 5E; MPA: AUC = 0.70, P < 0.01, Figure 5G]. However, the other biomarkers could not predict the pCR in the patients with LARC after NCRT (NLR: AUC = 0.53, P = 0.51, Figure 5A; MLR: AUC = 0.57, P = 0.10, Figure 5B; PLR: AUC = 0.56, P = 0.12, Figure 5C; SII: AUC = 0.53, P = 0.45, Figure 5D; ALI: AUC = 0.54, P = 0.32, Figure 5F; BMI: AUC = 0.50, P = 0.94, Figure 5H).
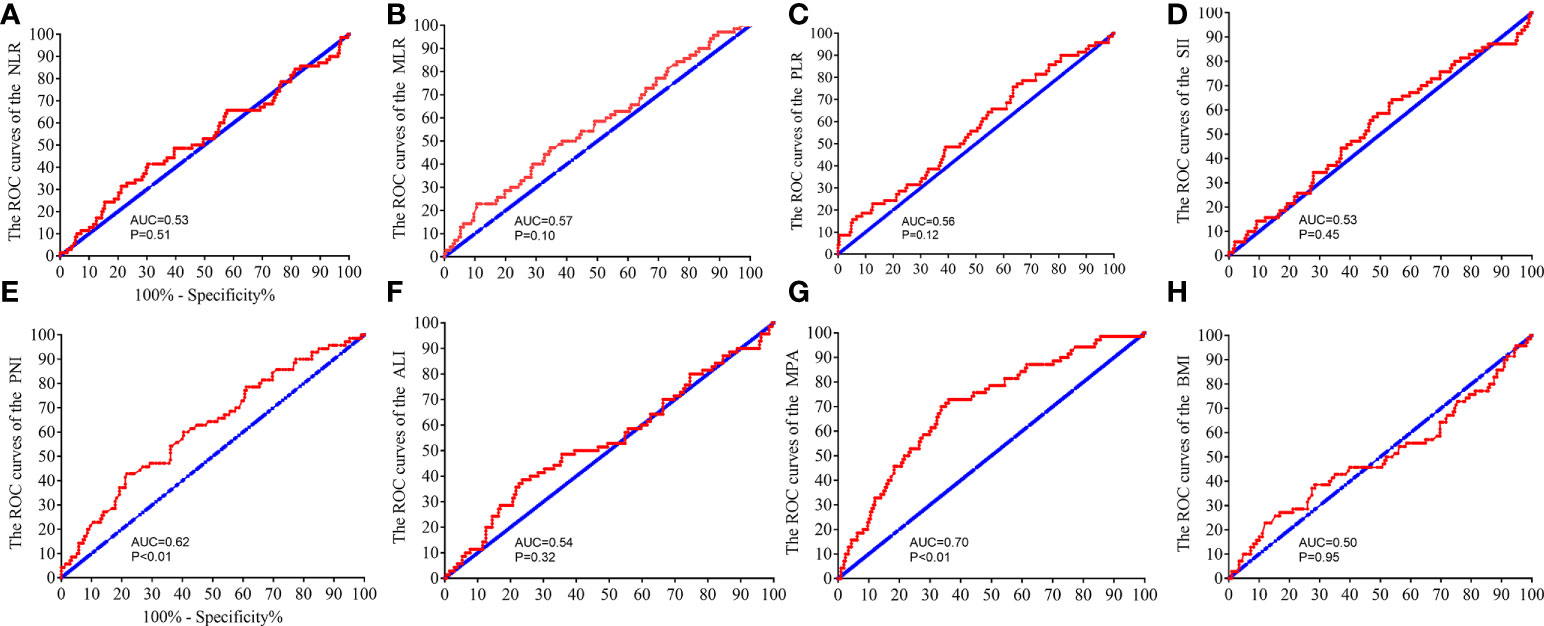
Figure 5 Receiver operating characteristic (ROC) analysis to evaluate the predictive efficiency of the NLR, SII, PLR, MLR, PNI, ALI, MPA, and BMI level in patients with LARC for NCRT response. The ROC analysis for NLR (A), MLR (B), PLR (C), SII (D), PNI (E), ALI (F), MPA (G), and BMI level (H).
On the basis of the optimal cutoff value, these patients were dichotomized into the low-MPA group (n = 31, 11.1%) and the high-ALI group (n = 247, 88.9%). No significant differences were found between the groups regarding baseline characteristics, such as sex, age, American Society of Anaesthesiologists (ASA) score, preoperative carcinoembryonic antigen (CEA) level, preoperative CA19-9 level, distance from the anal verge, interval time between NCRT and surgery, pre-NCRT cT stage, pre-NCRT cN stage, hypoproteinemia, estimated blood loss, operative time, postoperative hospital stay, organ preservation, tumor size, BMI level, and anemia (all P > 0.05, Tables 1, 2). As expected, a lower MAP level was associated with poorly tumor differentiation, higher pathology TNM stage, higher AJCC TRG stage, higher NLR score, higher MLR score, and higher SII score (all P < 0.05).
To explore the prognostic impact of the biomarkers on DFS in patients with LARC, we performed a Cox regression model analysis. On univariate analysis, pathological T stage (P < 0.001), pathological N stage (P < 0.001), AJCC TRG grade (P = 0.001), pre-NCRT CEA level (P = 0.017), MPA score (P < 0.001), NLR score (P < 0.001), MLR score (P < 0.001), PNI score (P = 0.005), ALI score (P = 0.001), nerval invasion (P = 0.006), and tumor differentiation (P = 0.002) were independently associated with DFS in patients with LARC after NCRT and TME (Table 3). Results from the multivariate Cox regression model demonstrated that MPA score [hazard ratio (HR) = 0.954; 95% confidence interval (CI), 0.921–0.988; P = 0.009] and NLR level (HR = 1.058; 95% CI, 1.004–1.115; P = 0.034) were independent predictors of DFS after NCRT (Table 3).
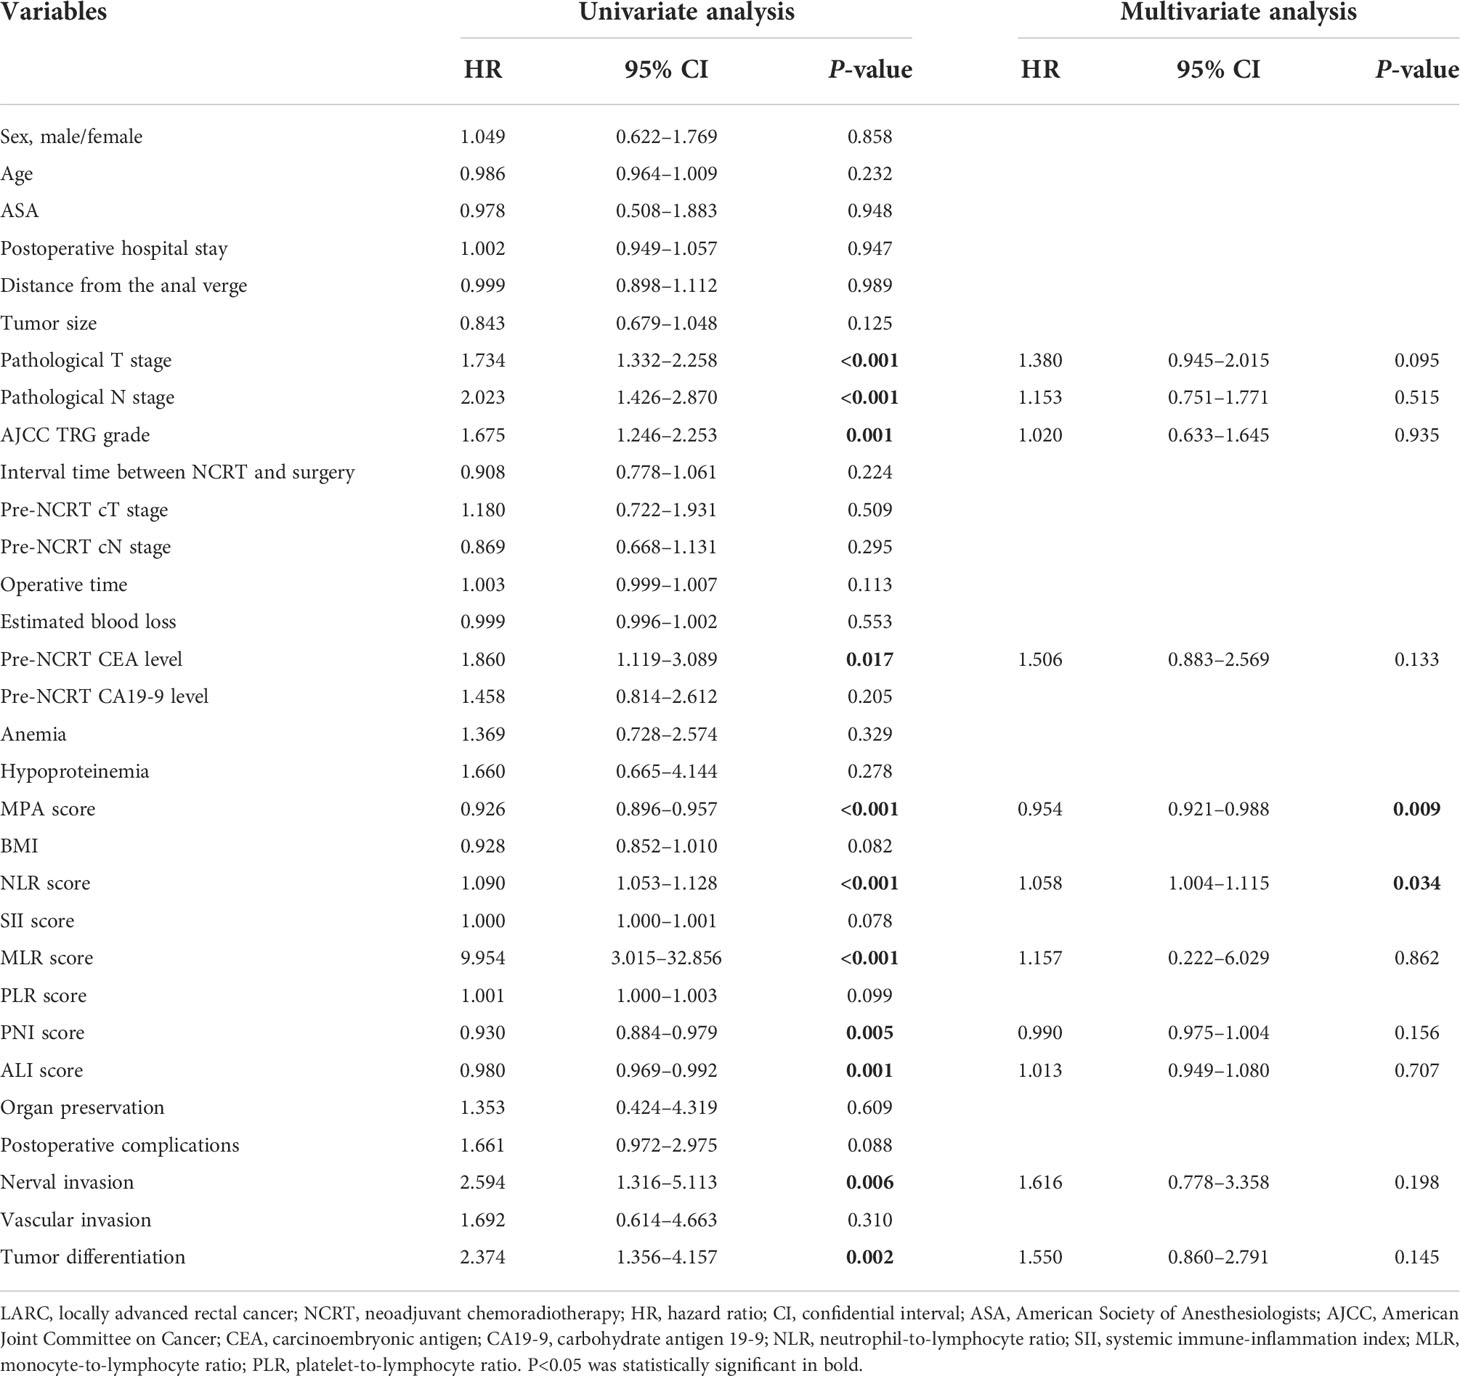
Table 3 Cox regression analysis of predictive factors for disease-free survival in patients with LARC after NCRT (n = 278).
The score of the biomarkers in the pCR group and non-pCR group was compared by the T-test, as shown in Figure 6A. The result demonstrated that the MPA and PNI scores were significantly higher in the pCR group compared with that in the non-pCR group (MPA: pCR, 37.98 ± 9.02, vs. non-pCR, 31.86 ± 8.62, P < 0.01; PNI: pCR, 51.31 ± 5.33, vs. non-pCR, 49.05 ± 4.84, P < 0.01). However, another biomarkers score was no significant association with the pCR or non-pCR group (NLR: pCR, 2.89 ± 2.94, vs. non-pCR, 2.88 ± 3.45, P = 0.94; SII: pCR, 783.12 ± 1,090.10, vs. non-pCR, 748.26 ± 1,150.48, P = 0.81; PLR: pCR, 141.4 ± 98.22, vs. non-pCR, 154.22 ± 95.11, P = 0.35; MLR: pCR, 0.25 ± 0.12, vs. non-pCR, 0.29 ± 0.17, P = 0.07; ALI: pCR, 52.46 ± 30.4, vs. non-pCR, 47.59 ± 26.36, P = 0.30). To explore the impact of the biomarkers on pCR in patients with LARC, we performed a logistical regression model analysis. On univariate analysis, pre-NCRT cT stage (P = 0.023), MPA score (P < 0.001), pre-NCRT cN stage (P = 0.006), and PNI score (P = 0.002) were independently associated with pCR in patients with LARC (Table 4). The multivariate logistical regression model demonstrated that MPA score (OR = 0.926; 95% CI, 0.895–0.958; P < 0.001), PNI score (OR = 0.925; 95% CI, 0.871–0.983; P = 0.011), and pre-NCRT cN stage (OR = 1.634; 95% CI, 1.177–2.269; P = 0.034) were independent predictors of pCR after NCRT (Table 4).
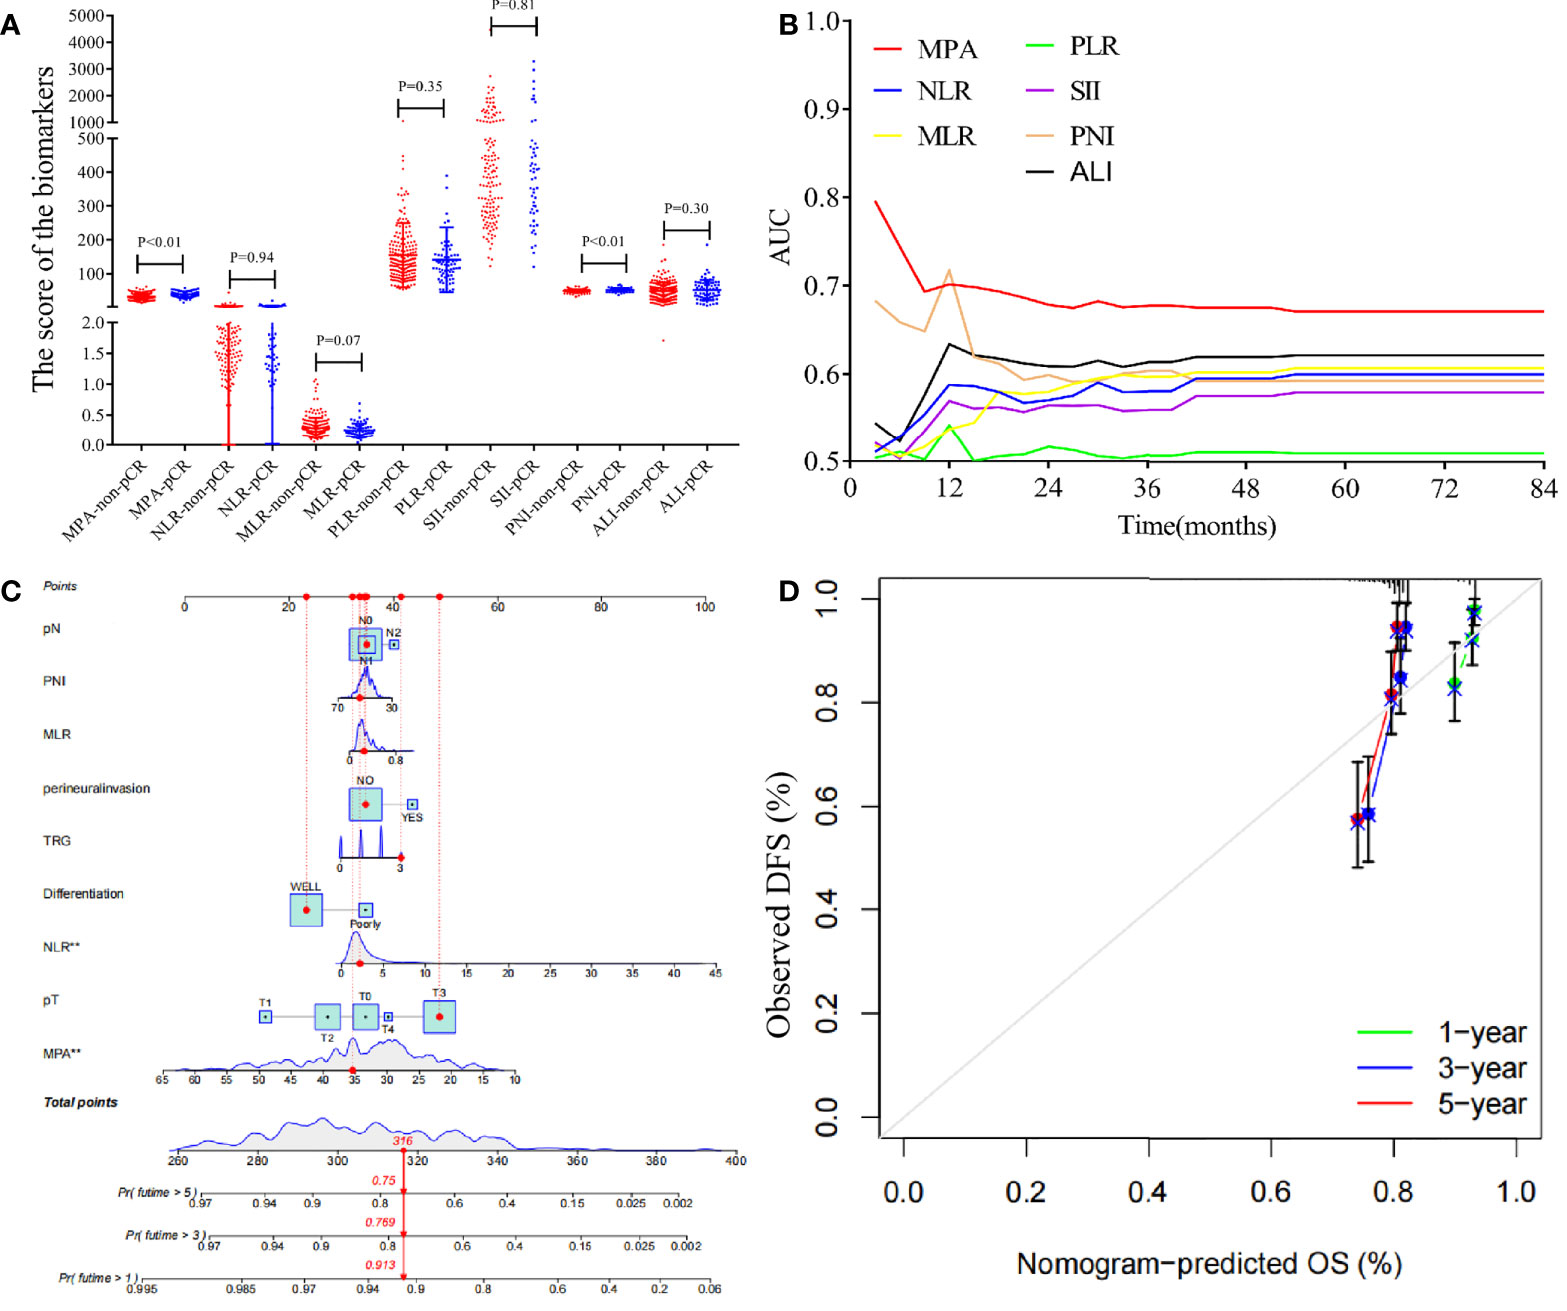
Figure 6 Analysis the biomarkers in the patients with LARC and construction a nomogram model for the disease-free survival. (A) The biomarkers value in the pCR group and non-pCR group (MPA: pCR, 37.98 ± 9.02, vs. non-pCR, 31.86 ± 8.62, P < 0.01; NLR: pCR, 2.89 ± 2.94, vs. non-pCR, 2.88 ± 3.45, P = 0.94; SII: pCR, 783.12 ± 1,090.10, vs. non-pCR, 748.26 ± 1,150.48, P = 0.81; PLR: pCR, 141.4 ± 98.22, vs. non-pCR, 154.22 ± 95.11, P = 0.35; MLR: pCR, 0.25 ± 0.12, vs. non-pCR, 0.29 ± 0.17, P = 0.07; PNI: pCR, 51.31 ± 5.33, vs. non-pCR, 49.05 ± 4.84, P < 0.01; ALI: pCR, 52.46 ± 30.4, vs. non-pCR, 47.59 ± 26.36, P = 0.30). (B) Time-dependent AUC curves of the NLR, SII, PLR, MLR, PNI, ALI, and MPA, for the prediction of disease-free survival. (C) Nomogram developed for prediction of disease-free survival. (D) Calibration curves for 1-, 3-, and 5-year DFS for the nomogram in patients with LARC after NCRT.
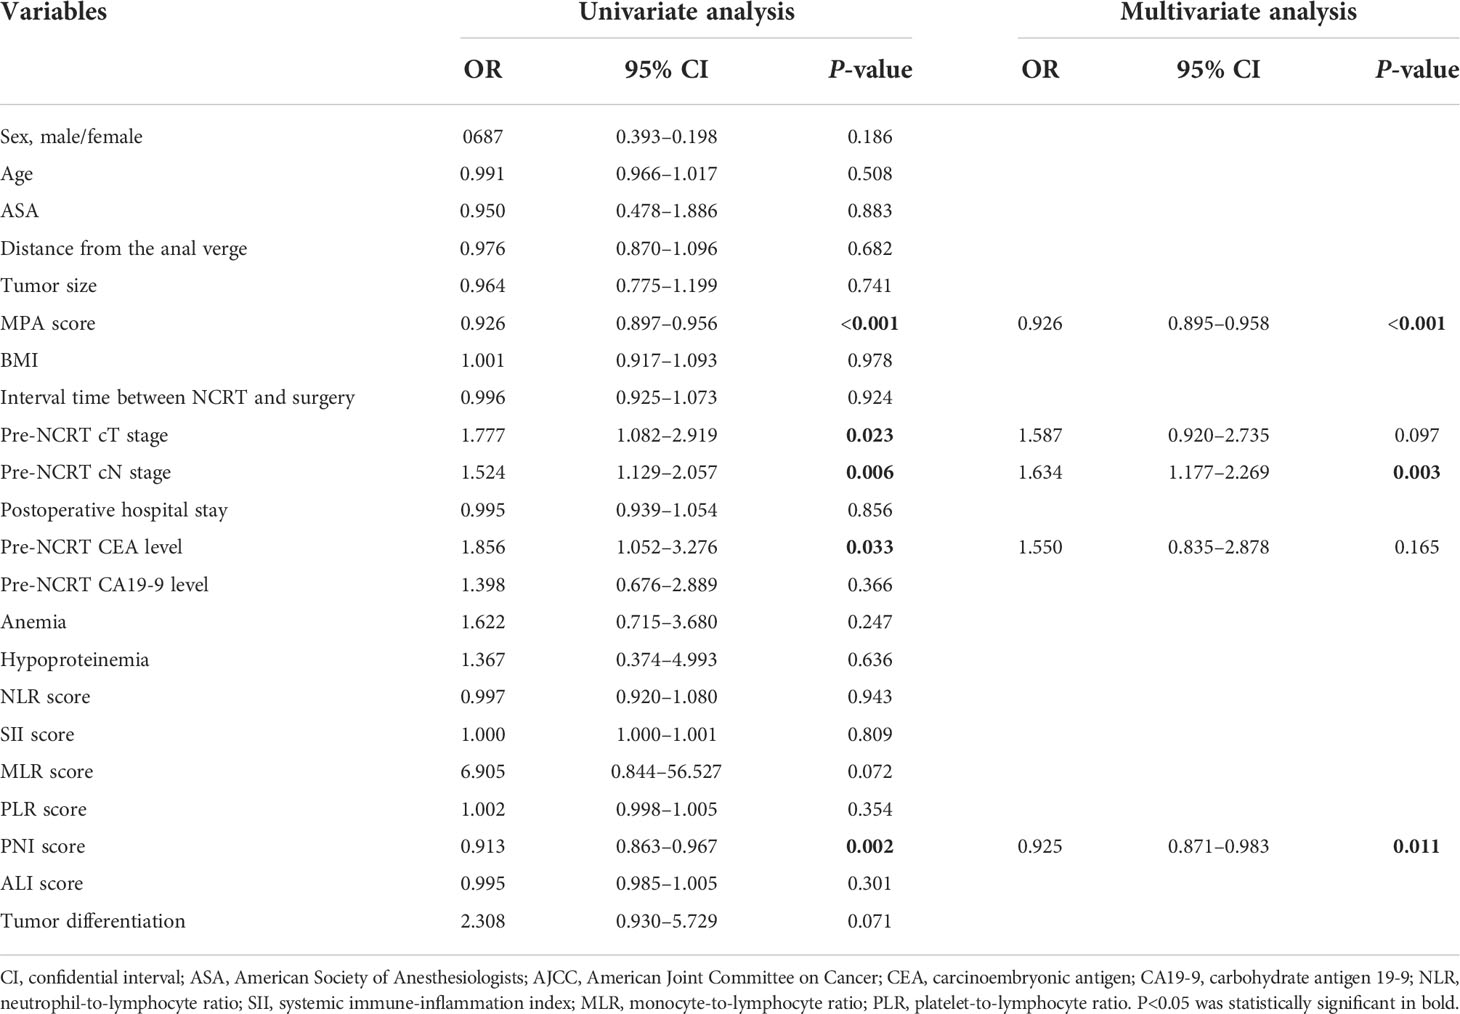
Table 4 Logistic regression analysis of predictive factors for pCR in patients with LARC after NCRT (n = 278).
The time-dependent ROC curves of the biomarkers showed that all the AUCs were relatively stable after surgery during the observation period. However, the AUC of the MPA tended to be higher than the other biomarkers at all times tested (Figure 6B). Based on the above important factors of logistics regression, a nomogram was constructed to predict DFS in LARC patients (Figure 6C). The 3-year DFS predictive probabilities were obtained by drawing a straight line after summing up the score of each variable (Figures 6D). Patients with a higher total score tended to have lower DFS rate.
On the basis of the results of the multivariate logistical regression analysis, RPA was performed, and patients with LARC after NCRT were divided into different pCR rate groups (Figure 7). The independent risk factors included in the RPA were MPA score, PNI score, and pre-NCRT CEA level. On the basis of the above three factors, the patients were divided into four groups. The model showed that the MPA score was the most important factor affecting pCR. When the MPA score is under 33, the pCR rate remains at 14.8%. In contrast, the MPA score of more than 33, the pCR rate was 37.7%. Moreover, we found the similar result that the PNI score is more than 46, resulting in the pCR rates of 42.7%. In addition, on the basis of the pre-NCRT CEA level, the patients with LARC were divided into two groups. Finally, the pCR rates in the low-risk group patients were 51.7%, whereas the pCR rates in the high-risk group patients were 17.7%, and the difference was significant (p < 0.001).
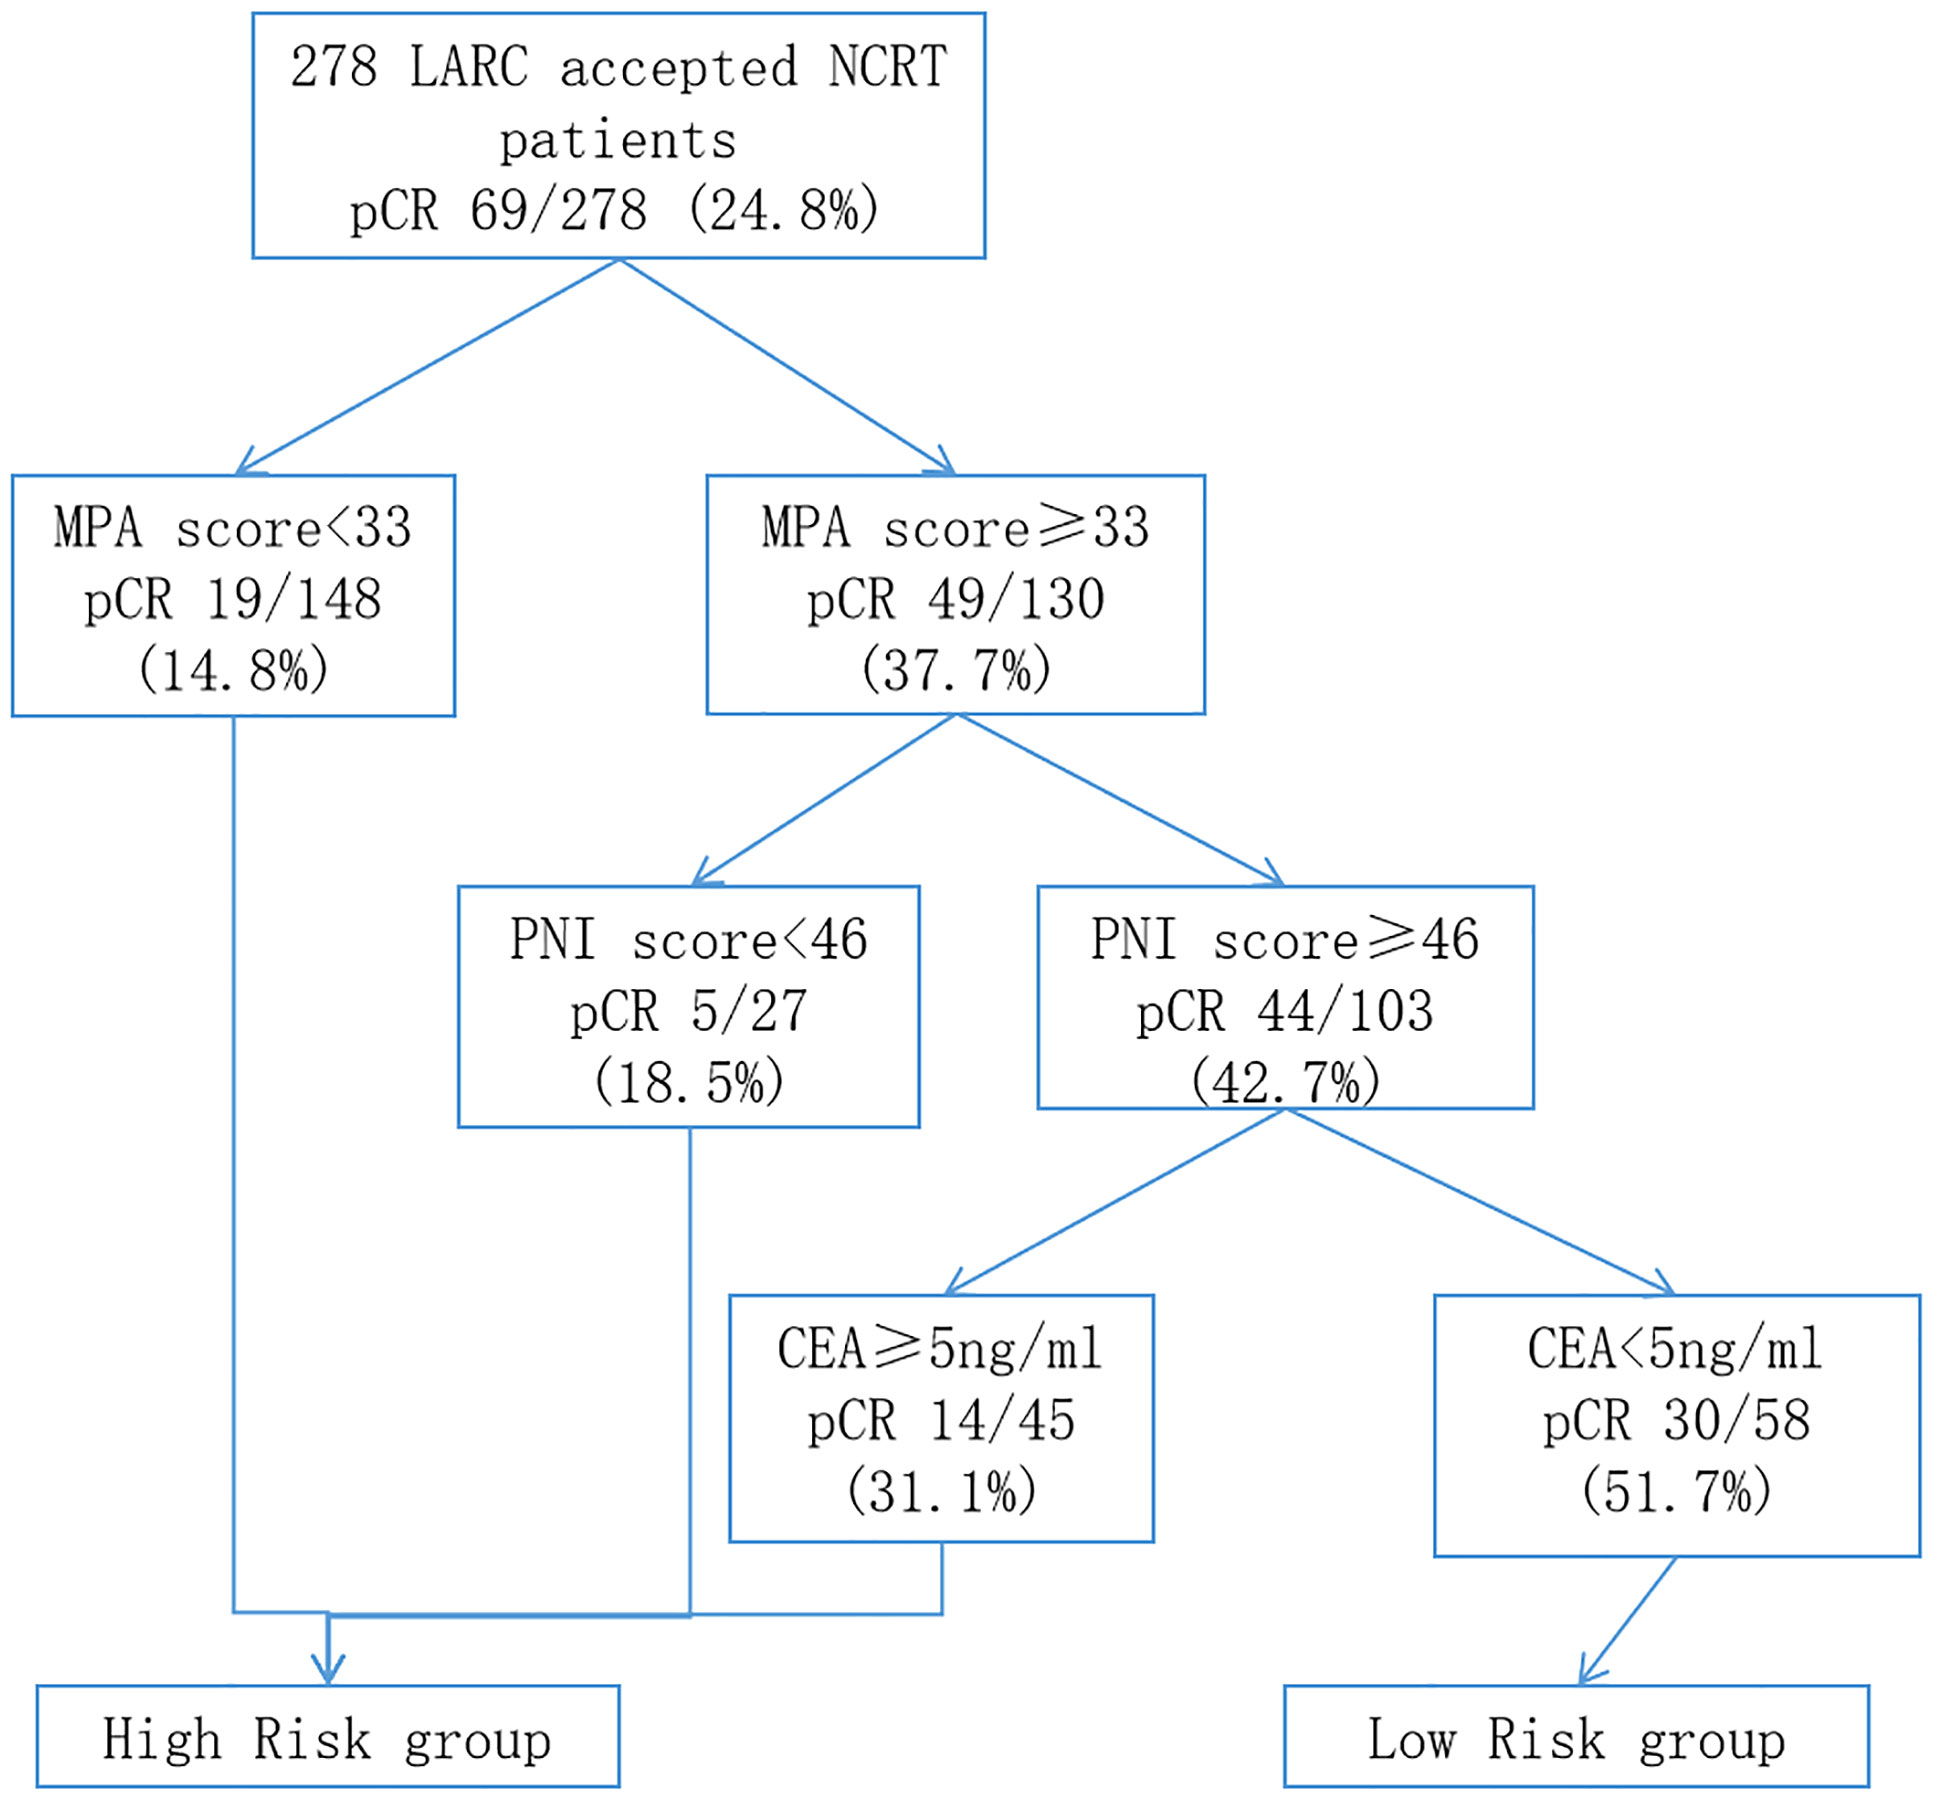
Figure 7 Classification tree identifying the groups at high- and low-risk for pCR of patients with LARC after NCRT. pCR, pathology complete response; LARC, locally advanced rectal cancer; NCRT, neo-chemoradiotherapy.
The occurrence rate of obesity is increasing in the worldwide especially in China (31, 32). Recently, many studies reported that obesity contributed to developing multiple cancers and a worse prognosis (18, 33). Controversially, several studies revealed that patients with obesity had greater NCRT response when they had rectal cancer (34, 35). To assess obesity, a number of measurements are available, including BMI, waistline, and visceral adipose tissue. The above measurements are aimed to determining body fat. However, the NCRT range of irradiation for patients with LARC was limited to the pelvic and rectal. Thus, whether the body fat can instead of the pelvic and rectal fat is yet uncertain. The current study aims to evaluate the pelvic and rectal fat to predict NCRT response and prognosis in patients with LARC.
There was not standard for correctly assessing pelvic and rectal fat until now. McKechnie et al. (26) reported a better way to evaluate pelvic and rectal fat using MRI to measure the area of the fat in the pelvic. Moreover, radiomics shows multiple advantages in evaluating NCRT response in LARC (36–38). According to the NCCN and ESMO guidelines, high-resolution pelvic or rectal MRI could be an efficient routine imaging tool for evaluating clinical tumor stage and NCRT response. In the present study, we analyzed the pelvic parameters combined with radiomics, and on the basis of the LASSO analysis, the MPA was selected as the effective biomarker to predict the prognosis.
MPA includes the mesorectal and rectal thicknesses, and the rectal thickness is usually steady, so the mesorectal thickness determined the MPA score. Posterior mesorectal thickness is an important factor influencing operative complexity in rectal surgery (26, 39). Patients with the hypertrophy mesorectal might obscure anatomic dissection planes or limit access to the pelvis, potentially increasing the technical challenge of rectal surgery particularly for the patients with LARC after NCRT (40). The MPA score is connected with the BMI level and may represent pelvic obesity in the current study. Investigating the impact of the MPA score in patients with LARC may shed light on the involvement of obesity in the pelvis. On the basis of the MPA high- and low score groups, we found that the high MPA score group was associated with a low pathology TNM stage and high rates of the pCR. However, the BMI level could not distinguish the above results well. The result revealed that, rather than BMI, the pelvic obesity may contribute to the NCRT response. Moreover, the Cox regression and logistical regression also identified that the MPA score was crucial in predicting NCRT response and prognosis in patients with LARC.
Several studies found that nutrition and inflammation are related to tumor development and progression (41, 42). Obesity and albumin have been recognized as essential parameters for evaluating the nutritional status of patients with cancer (43). At present, obesity is associated with inflammatory response and affects the efficiency and toxicity of chemotherapy and radiotherapy in patients with cancer (44–46). The inflammatory indexes in the peripheral blood, NLR, MLR, PLR, and SII have been used as markers of predicting efficacy and toxicity of NCRT in patients with LARC in our previous study (21). Furthermore, mounting evidence suggested that obesity was contributing to the inflammatory response, which influenced tumor development, prognosis, and therapy response (18–20). As a result, we hypothesize that the pelvic fat increases the inflammatory response to affect the NCRT response. To further explore the relationship between the pelvic obesity and inflammatory response, we analyze the relationship between the MPA score and NLR, PLR, MLR, SII, PNI, and ALI. The result showed that the MPA score was associated with the NLR, PLR, and MLR score. There were more pieces of evidence that pelvic fat was related with the inflammatory response. PNI is a novel index to reflect the nutritional and inflammatory status of patients, and its clinical efficacy as a predictive factor in different malignancies has been established (47, 48). In the present study, we found that both the PNI and MPA scores were effective at predicting NCRT response in patients with LARC. However, only MPA was associated with NCRT response in logistic regression analysis. This could imply that pelvic fat modulates inflammatory response to elicit NCRT response.
To predict the pCR rates of the patients with LARC after NCRT, the RPA was performed to classify patients with LARC into different risk groups. RPA was a useful statistical method for predicting patient risk in a number of cancers, including colorectal cancer, nasopharyngeal cancer, cervical cancer, and breast cancer, which could assist clinicians to determine the best medication regimen (30, 47–49). However, few studies used the RPA to forecast the NCRT response in patients with LARC. In the present study, the MPA score, PNI score, and pre-NCRT CEA level play an important role in dividing the patients into the different risk groups. Among the affecting criteria, the MPA score has the most significant influence. On the basis of the MPA score, we distinguished over half of the patients with LARC in the first step and then selected 20% of patients as the low-risk patients, who may accept a greater pCR rates than the high-risk group, based on the PNI score and pre-NCRT CEA level. The results mentioned provide fresh treatment options for patients with LARC after NCRT.
Several limitations warrant discussion. First, the present study was subjected to potential selection bias due to the retrospective design. In addition, limitations in statistical methods resulted in imbalanced grouping of the groups. Second, peripheral blood cell analysis results might be affected by factors, such as blood circulation capacity, infection, and nutritional status. Third, the impact of gene profiling and tumor microenvironment inflammation was not assessed, owing to the lack of complete medical records. Despite these limitations, we believe that this study adds to the understanding of the impact of pelvic obesity on the oncological outcomes in patients with LARC after NCRT.
In conclusion, a higher MPA score was associated with poorer DFS and OS in patients with LARC after NCRT. In addition, MPA score was identified to be the most reliable marker, and the prognostic value was further confirmed by time–ROC analysis. Finally, an RPA was constructed to predict the DFS outcomes. Patients in the high-risk group who have LARC after NCRT may benefit from more intensive adjuvant therapy. Larger-scale prospective clinical trials are warranted to support the above findings.
The raw data supporting the conclusions of this article will be made available by the authors, without undue reservation.
Written informed consent was obtained from the individual(s) for the publication of any potentially identifiable images or data included in this article.
All authors made a significant contribution to the present study, whether that is in the conception, study design, execution, acquisition of data, analysis and interpretation, or in all these areas; took part in drafting, revising, or critically reviewing the article; gave final approval of the version to be published; have agreed on the journal to which the article has been submitted; and agree to be accountable for all aspects of the work.
This study was sponsored by Fujian provincial health technology project (2021CXA011 and 2021CXB009); National Foundation of China (No. 82172800); Science Foundation of the Fujian Province (No. 2019J01161); Special Financial Foundation of Fujian Provincial (No. 2020B019); Joint Funds for the innovation of science and Technology, Fujian Province (2020Y9125); and the Talent programs granted from The First Affiliated Hospital of Fujian Medical University (YJRC3600).
The authors thank all the staff in the Fujian Medical University Union Hospital, Fuzhou, Fujian Province, People’s Republic of China.
The authors declare that the research was conducted in the absence of any commercial or financial relationships that could be construed as a potential conflict of interest.
All claims expressed in this article are solely those of the authors and do not necessarily represent those of their affiliated organizations, or those of the publisher, the editors and the reviewers. Any product that may be evaluated in this article, or claim that may be made by its manufacturer, is not guaranteed or endorsed by the publisher.
The Supplementary Material for this article can be found online at: https://www.frontiersin.org/articles/10.3389/fonc.2022.941786/full#supplementary-material
1. Roh MS, Colangelo LH, O’Connell MJ, Yothers G, Deutsch M, Allegra CJ, et al. Preoperative multimodality therapy improves disease-free survival in patients with carcinoma of the rectum: NSABP r-03. J Clin Oncol (2009) 27:5124–30. doi: 10.1200/JCO.2009.22.0467
2. Sauer R, Liersch T, Merkel S, Fietkau R, Hohenberger W, Hess C, et al. Preoperative versus postoperative chemoradiotherapy for locally advanced rectal cancer: Results of the German CAO/ARO/AIO-94 randomized phase III trial after a median follow-up of 11 years. J Clin Oncol (2012) 30:1926–33. doi: 10.1200/JCO.2011.40.1836
3. van Gijn W, Marijnen CA, Nagtegaal ID, Kranenbarg EM, Putter H, Wiggers T, et al. Preoperative radiotherapy combined with total mesorectal excision for resectable rectal cancer: 12-year follow-up of the multicentre, randomised controlled TME trial. Lancet Oncol (2011) 12:575–82. doi: 10.1016/S1470-2045(11)70097-3
4. Maas M, Nelemans PJ, Valentini V, Das P, Rödel C, Kuo LJ, et al. Long-term outcome in patients with a pathological complete response after chemoradiation for rectal cancer: a pooled analysis of individual patient data. Lancet Oncol (2010) 11:835–44. doi: 10.1016/S1470-2045(10)70172-8
5. Habr-Gama A, Perez RO, Proscurshim I, Campos FG, Nadalin W, Kiss D, et al. Patterns of failure and survival for nonoperative treatment of stage c0 distal rectal cancer following neoadjuvant chemoradiation therapy. J Gastrointest Surg (2006) 10:1319–28; discussion 1328-9. doi: 10.1016/j.gassur.2006.09.005
6. Renehan AG, Malcomson L, Emsley R, Gollins S, Maw A, Myint AS, et al. Watch-and-wait approach versus surgical resection after chemoradiotherapy for patients with rectal cancer (the OnCoRe project): A propensity-score matched cohort analysis. Lancet Oncol (2016) 17:174–83. doi: 10.1016/S1470-2045(15)00467-2
7. Maas M, Beets-Tan RG, Lambregts DM, Lammering G, Nelemans PJ, Engelen SM, et al. Wait-and-see policy for clinical complete responders after chemoradiation for rectal cancer. J Clin Oncol (2011) 29:4633–40. doi: 10.1200/JCO.2011.37.7176
8. Zhang Y, Sun Y, Xu Z, Chi P, Lu X. Is neoadjuvant chemoradiotherapy always necessary for mid/high local advanced rectal cancer: A comparative analysis after propensity score matching. Eur J Surg Oncol (2017) 43:1440–6. doi: 10.1016/j.ejso.2017.04.007
9. Zhang Y, Yan L, Wu Y, Xu M, Liu X, Guan G. Worse treatment response to neoadjuvant chemoradiotherapy in young patients with locally advanced rectal cancer. BMC Cancer (2020) 20:854. doi: 10.1186/s12885-020-07359-2
10. Calle EE, Rodriguez C, Walker-Thurmond K, Thun MJ. Overweight, obesity, and mortality from cancer in a prospectively studied cohort of U.S. adults. N Engl J Med (2003) 348:1625–38. doi: 10.1056/NEJMoa021423
11. Renehan AG, Tyson M, Egger M, Heller RF, Zwahlen M. Body-mass index and incidence of cancer: A systematic review and meta-analysis of prospective observational studies. Lancet (2008) 371:569–78. doi: 10.1016/S0140-6736(08)60269-X
12. Moghaddam AA, Woodward M, Huxley R. Obesity and risk of colorectal cancer: a meta-analysis of 31 studies with 70,000 events. Cancer Epidemiol Biomarkers Prev (2007) 16:2533–47. doi: 10.1158/1055-9965.EPI-07-0708
13. Ma Y, Yang Y, Wang F, Zhang P, Shi C, Zou Y, et al. Obesity and risk of colorectal cancer: A systematic review of prospective studies. PloS One (2013) 8:e53916. doi: 10.1371/journal.pone.0053916
14. Kang J, Baek SE, Kim T, Hur H, Min BS, Lim JS, et al. Impact of fat obesity on laparoscopic total mesorectal excision: More reliable indicator than body mass index. Int J Colorectal Dis (2012) 27:497–505. doi: 10.1007/s00384-011-1333-2
15. Ballian N, Yamane B, Leverson G, Harms B, Heise CP, Foley EF, et al. Body mass index does not affect postoperative morbidity and oncologic outcomes of total mesorectal excision for rectal adenocarcinoma. Ann Surg Oncol (2010) 17:1606–13. doi: 10.1245/s10434-010-0908-4
16. Seishima R, Okabayashi K, Hasegawa H, Sugiyama D, Ishii Y, Tsuruta M, et al. Obesity was associated with a decreased postoperative recurrence of rectal cancer in a Japanese population. Surg Today (2014) 44:2324–31. doi: 10.1007/s00595-014-0899-z
17. Meyerhardt JA, Tepper JE, Niedzwiecki D, Hollis DR, McCollum AD, Brady D, et al. Impact of body mass index on outcomes and treatment-related toxicity in patients with stage II and III rectal cancer: Findings from intergroup trial 0114. J Clin Oncol (2004) 22:648–57. doi: 10.1200/JCO.2004.07.121
18. Zhang X, Liu Y, Shao H, Zheng X. Obesity paradox in lung cancer prognosis: Evolving biological insights and clinical implications. J Thorac Oncol (2017) 12:1478–88. doi: 10.1016/j.jtho.2017.07.022
19. Gallo M, Adinolfi V, Barucca V, Prinzi N, Renzelli V, Barrea L, et al. Expected and paradoxical effects of obesity on cancer treatment response. Rev Endocr Metab Disord (2021) 22:681–702. doi: 10.1007/s11154-020-09597-y
20. Yang Z, Wei X, Pan Y, Min Z, Xu J, Yu B. Colon cancer combined with obesity indicates improved survival- research on relevant mechanism. Aging (Albany NY) (2020) 12:23778–94. doi: 10.18632/aging.103972
21. Zhang Y, Liu X, Xu M, Chen K, Li S, Guan G. Prognostic value of pretreatment systemic inflammatory markers in patients with locally advanced rectal cancer following neoadjuvant chemoradiotherapy. Sci Rep (2020) 10:8017. doi: 10.1038/s41598-020-64684-z
22. Sun Y, Zhang Y, Wu X, Lin H, Lu X, Huang Y, et al. Prognostic significance of neoadjuvant rectal score in locally advanced rectal cancer after neoadjuvant chemoradiotherapy and construction of a prediction model. J Surg Oncol (2018) 117:737–44. doi: 10.1002/jso.24907
23. Ryan R, Gibbons D, Hyland JM, Treanor D, White A, Mulcahy HE, et al. Pathological response following long-course neoadjuvant chemoradiotherapy for locally advanced rectal cancer. Histopathology (2005) 47:141–6. doi: 10.1111/j.1365-2559.2005.02176.x
24. Benson AB, Venook AP, Al-Hawary MM, Cederquist L, Chen YJ, Ciombor KK, et al. Rectal cancer, version 2.2018, NCCN clinical practice guidelines in oncology. J Natl Compr Canc Netw (2018) 16:874–901. doi: 10.6004/jnccn.2018.0061
25. Parmar C, Rios Velazquez E, Leijenaar R, Jermoumi M, Carvalho S, Mak RH, et al. Robust radiomics feature quantification using semiautomatic volumetric segmentation. PloS One (2014) 9:e102107. doi: 10.1371/journal.pone.0102107
26. McKechnie T, Ramji K, Kruse C, Jaffer H, Rebello R, Amin N, et al. Posterior mesorectal thickness as a predictor of increased operative time in rectal cancer surgery: A retrospective cohort study. Surg Endosc (2022) 36:3520–32. doi: 10.1007/s00464-021-08674-w
27. Camp RL, Dolled-Filhart M, Rimm DL. X-Tile: a new bio-informatics tool for biomarker assessment and outcome-based cut-point optimization. Clin Cancer Res (2004) 10:7252–9. doi: 10.1158/1078-0432.CCR-04-0713
28. Zhang Y, Wang Y, Liu X, Chen B, Zhuang J, Li S, et al. Worse prognosis in young patients with locally advanced rectal cancer following neoadjuvant chemoradiotherapy: A comparative study. Med (Baltimore) (2020) 99:e21304. doi: 10.1097/MD.0000000000021304
29. Zhang Y, Xu M, Sun Y, Chen Y, Chi P, Xu Z, et al. Identification of LncRNAs associated with FOLFOX chemoresistance in mCRC and construction of a predictive model. Front Cell Dev Biol (2020) 8:609832. doi: 10.3389/fcell.2020.609832
30. Wang Y, Zhang Y, Lin H, Xu M, Zhou X, Zhuang J, et al. Risk factors for lymph node metastasis in rectal neuroendocrine tumors: A recursive partitioning analysis based on multicenter data. J Surg Oncol (2021) 124:1098–105. doi: 10.1002/jso.26615
31. Kadam I, Neupane S, Wei J, Fullington LA, Li T, An R, et al. A systematic review of diet quality index and obesity among Chinese adults. Nutrients (2021) 13(10):3555. doi: 10.3390/nu13103555
32. Zheng R, Li M, Xu M, Lu J, Wang T, Dai M, et al. Chinese Adults are more susceptible to effects of overall obesity and fat distribution on cardiometabolic risk factors. J Clin Endocrinol Metab (2021) 106:e2775–2775e2788. doi: 10.1210/clinem/dgab049
33. Cacho-Díaz B, Spínola-Maroño H, Reynoso N, González-Aguilar A, Mohar-Betancourt A. Role of overweight, obesity, and comorbidities in the prognosis of patients with breast cancer with brain metastases. Clin Breast Cancer (2019) 19:e394–394e398. doi: 10.1016/j.clbc.2018.12.018
34. Sun Y, Xu Z, Lin H, Lu X, Huang Y, Huang S, et al. Impact of body mass index on treatment outcome of neoadjuvant chemoradiotherapy in locally advanced rectal cancer. Eur J Surg Oncol (2017) 43:1828–34. doi: 10.1016/j.ejso.2017.07.022
35. Sun Y, Chi P. Impact of body mass index on surgical and oncological outcomes in laparoscopic total mesorectal excision for locally advanced rectal cancer after neoadjuvant 5-Fluorouracil-Based chemoradiotherapy. Gastroenterol Res Pract (2017) 2017:1509140. doi: 10.1155/2017/1509140
36. Liu Z, Zhang XY, Shi YJ, Wang L, Zhu HT, Tang Z, et al. Radiomics analysis for evaluation of pathological complete response to neoadjuvant chemoradiotherapy in locally advanced rectal cancer. Clin Cancer Res (2017) 23:7253–62. doi: 10.1158/1078-0432.CCR-17-1038
37. Nie K, Shi L, Chen Q, Hu X, Jabbour SK, Yue N, et al. Rectal cancer: Assessment of neoadjuvant chemoradiation outcome based on radiomics of multiparametric MRI. Clin Cancer Res (2016) 22:5256–64. doi: 10.1158/1078-0432.CCR-15-2997
38. Cui Y, Yang X, Shi Z, Yang Z, Du X, Zhao Z, et al. Radiomics analysis of multiparametric MRI for prediction of pathological complete response to neoadjuvant chemoradiotherapy in locally advanced rectal cancer. Eur Radiol (2019) 29:1211–20. doi: 10.1007/s00330-018-5683-9
39. Kim YW, Cha SW, Pyo J, Kim NK, Min BS, Kim MJ, et al. Factors related to preoperative assessment of the circumferential resection margin and the extent of mesorectal invasion by magnetic resonance imaging in rectal cancer: A prospective comparison study. World J Surg (2009) 33:1952–60. doi: 10.1007/s00268-009-0126-z
40. Fang Y, Sheng C, Ding F, Zhao W, Guan G, Liu X. Adding consolidation capecitabine to neoadjuvant chemoradiotherapy for locally advanced rectal cancer: A propensity-matched comparative study. Front Surg (2021) 8:770767. doi: 10.3389/fsurg.2021.770767
41. Diakos CI, Charles KA, McMillan DC, Clarke SJ. Cancer-related inflammation and treatment effectiveness. Lancet Oncol (2014) 15:e493–503. doi: 10.1016/S1470-2045(14)70263-3
43. Mantzorou M, Koutelidakis A, Theocharis S, Giaginis C. Clinical value of nutritional status in cancer: What is its impact and how it affects disease progression and prognosis. Nutr Cancer (2017) 69:1151–76. doi: 10.1080/01635581.2017.1367947
44. Del Cornò M, Varì R, Scazzocchio B, Varano B, Masella R, Conti L. Dietary fatty acids at the crossroad between obesity and colorectal cancer: Fine regulators of adipose tissue homeostasis and immune response. Cells (2021) 10(7):1738. doi: 10.3390/cells10071738
45. Boi SK, Orlandella RM, Gibson JT, Turbitt WJ, Wald G, Thomas L, et al. Obesity diminishes response to PD-1-based immunotherapies in renal cancer. J Immunother Cancer (2020) 8(2):e000725. doi: 10.1136/jitc-2020-000725
46. Assumpção J, Pasquarelli-do-Nascimento G, Duarte M, Bonamino MH, Magalhães KG. The ambiguous role of obesity in oncology by promoting cancer but boosting antitumor immunotherapy. J BioMed Sci (2022) 29:12. doi: 10.1186/s12929-022-00796-0
47. Zhang Q, Chen J, Yu X, Ma J, Cai G, Yang Z, et al. Systemic treatment after whole-brain radiotherapy may improve survival in RPA class II/III breast cancer patients with brain metastasis. J Neurooncol (2013) 114:181–9. doi: 10.1007/s11060-013-1169-4
48. Xu M, Xie X, Cai L, Xie Y, Gao Q, Sun P. Risk factor assessment of lymph node metastasis in patients with FIGO stage IB1 cervical cancer. Front Oncol (2022) 12:809159. doi: 10.3389/fonc.2022.809159
Keywords: locally advanced rectal cancer (LARC), neoadjuvant chemoradiotherapy, inflammation biomarkers, mesorectal package area, prognosis, pathology complete response
Citation: Guan B, Huang X, Xia H, Guan G and Xu B (2022) Prognostic value of mesorectal package area in patients with locally advanced rectal cancer following neoadjuvant chemoradiotherapy: A retrospective cohort study. Front. Oncol. 12:941786. doi: 10.3389/fonc.2022.941786
Received: 11 May 2022; Accepted: 12 September 2022;
Published: 03 October 2022.
Edited by:
Sweet Ping Ng, University of Melbourne, AustraliaCopyright © 2022 Guan, Huang, Xia, Guan and Xu. This is an open-access article distributed under the terms of the Creative Commons Attribution License (CC BY). The use, distribution or reproduction in other forums is permitted, provided the original author(s) and the copyright owner(s) are credited and that the original publication in this journal is cited, in accordance with accepted academic practice. No use, distribution or reproduction is permitted which does not comply with these terms.
*Correspondence: Benhua Xu, YmVuaHVheHVAMTYzLmNvbQ==; Guoxian Guan, Zmp4aGdneEAxNjMuY29t
†These authors have contributed equally to this work
Disclaimer: All claims expressed in this article are solely those of the authors and do not necessarily represent those of their affiliated organizations, or those of the publisher, the editors and the reviewers. Any product that may be evaluated in this article or claim that may be made by its manufacturer is not guaranteed or endorsed by the publisher.
Research integrity at Frontiers
Learn more about the work of our research integrity team to safeguard the quality of each article we publish.