 Xin Liang
 Mengwen Liu
 Meng Li
 Li Zhang
- 1Medical Statistics Office, National Cancer Center/National Clinical Research Center for Cancer/Cancer Hospital, Chinese Academy of Medical Sciences and Peking Union Medical College, Beijing, China
- 2Department of Diagnostic Radiology, National Cancer Center/National Clinical Research Center for Cancer/Cancer Hospital, Chinese Academy of Medical Sciences and Peking Union Medical College, Beijing, China
Background: Establishing risk-based follow-up management strategies is crucial to the surveillance of subsolid pulmonary nodules (SSNs). However, the risk factors for SSN growth are not currently clear. This study aimed to perform a systematic review and meta-analysis to identify clinical and CT features correlated with SSN growth.
Methods: Relevant studies were retrieved from Web of Science, PubMed, Cochrane Library, and EMBASE. The correlations of clinical and CT features with SSN growth were pooled using a random-effects model or fixed-effects model depending on heterogeneity, which was examined by the Q test and I2 test. Pooled odds ratio (OR) or pooled standardized mean differences (SMD) based on univariate analyses were calculated to assess the correlation of clinical and CT features with SSN growth. Pooled ORs based on multivariate analyses were calculated to find out independent risk factors to SSN growth. Subgroup meta-analysis was performed based on nodule consistency (pure ground-glass nodule (pGGN) and part-solid nodule (PSN). Publication bias was examined using funnel plots.
Results: Nineteen original studies were included, consisting of 2444 patients and 3012 SSNs. The median/mean follow-up duration of these studies ranged from 24.2 months to 112 months. Significant correlations were observed between SSN growth and eighteen features. Male sex, history of lung cancer, nodule size > 10 mm, nodule consistency, and age > 65 years were identified as independent risk factors for SSN growth based on multivariate analyses results. Eight features, including male sex, smoking history, nodule size > 10 mm, larger nodule size, air bronchogram, higher mean CT attenuation, well-defined border, and lobulated margin were detected to be significantly correlated with pGGNs growth. Smoking history showed no significant correlation with pGGN growth based on the multivariate analysis results.
Conclusions: Eighteen clinical and CT features were identified to be correlated with SSN growth, among which male sex, history of lung cancer, nodule size > 10 mm, nodule consistency and age > 65 years were independent risk factors while history of lung cancer was not correlated with pGGN growth. These factors should be considered when making risk-based follow-up plans for SSN patients.
Introduction
Subsolid pulmonary nodules (SSNs) refer to both part-solid nodules (PSNs) and pure ground-glass nodules (pGGNs) (1), and they are defined as nodules that contain components higher than normal lung tissue but less opaque than consolidated bronchovascular margins (2). The widespread availability of high-resolution computed tomography (CT) and the promotion of low-dose chest CT (LDCT) screening programs have increased the detection rate of SSN. Especially because of the COVID-19 epidemic, people are actively undergoing CT scans, so the probability of finding SSNs in the lungs has greatly increased.
The majority (60%-90%) of persistent SSNs have a more indolent clinical course than solid nodules during 5 to 10 years of observation (3–6), and these nodules often represent precursors of invasive adenocarcinoma. A prospective study suggested that SSN growth often indicated a higher risk of invasive adenocarcinoma (7). For pGGNs, the transition to mixed GGNs (solid component within the ground-glass nodule by thin-section CT at a lung window setting) indicates more rapid growth (8). Moreover, it was reported in two studies that 2% and 13% of SSNs showed growth after 5 years of stability (6, 9). The complex growth characteristics and potential malignant properties of SSNs lead to challenges in clinical management. The current guidelines for SSNs take nodule growth as the basis to adjust the follow-up plan and recommend definitive therapy (10). Although there is no consensus on the duration and frequency of SSN follow-up in the guidelines, the 2017 Fleischner Society guidelines, the American College of Chest Physicians guideline (ACCP) and the National Comprehensive Cancer Network (NCCN) all recommend further evaluation and/or consideration of resection if solid component(s) or growth develops in SSNs (11, 12). Considering the risk of a missed diagnosis of lung cancer and worse prognosis, many patients with persistent SSN(s) may switch to more frequent CT surveillance or definitive treatment. This leads to more overexamination and overtreatment in clinical practice. If we can predict whether a nodule will grow, we can adopt different follow-up schemes for different patients to ease their anxiety and solve these problems.
CT surveillance is the sole effective approach for evaluating SSN growth at present. Although studies have revealed that long-term surveillance of SSN(s) with LDCT is a safe strategy, repeated CT scans over several years have nonnegligible consequences, such as anxiety, radiation exposure, false-positive results and unnecessary costs (13). Therefore, risk-based follow-up management for these patients is greatly desired. Several studies have shown that nodule size and history of lung cancer are important risk factors for SSN growth (14, 15). Other studies have shown that lobular margins and a bubble-like appearance are correlated with the growth of SSN (16). Due to the lack of large-sample data comparisons and analyses of clinical and CT features of SSN growth, we retrieved relevant studies up to December 2021 and carried out a meta-analysis, which aimed to clarify the risk factors correlated with SSN growth and provide information for establishing risk-based follow-up strategy for SSN(s) patients.
Methods
This meta-analysis was carried out in accordance with the Preferred Reporting Items for Systematic Reviews and Meta-Analyses guidelines (17, 18). The primary procedures are outlined in the following sections.
Literature Search
We performed a systematic literature search of Web of Science, PubMed, Cochrane Library and EMBASE up to December 31, 2021. The search terms “non-solid nodule”, “part-solid nodule”, “subsolid nodule” and their synonyms combined with “growth” or “follow-up” were used without language restriction, and medical subject headings (MeSH) were applied if available. The reference lists of the retrieved articles and review articles were manually searched for other relevant studies. Two authors (L.Z. and M.W.L.) independently performed the search and reviewed all identified publications for inclusion using predetermined criteria.
Inclusion Criteria
Studies were included when they met the following criteria: (a) studies published in English or Chinese; (b) the cases included in the studies were of SSNs; (c) clinical or CT features were analyzed in the studies; and (d) nodule growth was defined as the whole nodule growing by > 2 mm in diameter, the emergence of a solid component in a pGGN or the solid area growing by > 2 mm in diameter in a PSN. Reports of lectures, conference papers, and reviews were excluded.
Data Extraction and Quality Assessment
For each eligible study, two authors independently extracted the following data: (a) general information of the studies, (b) mean value and standard deviation of numerical clinical and CT features included in univariate analysis, (c) number of negative and positive cases for categorical clinical and CT features included in univariate analysis, and (d) odds ratio (OR) value with 95% confidence interval of clinical and CT features in multiple logistic regression model. The Newcastle–Ottawa Scale (NOS) was used to assess the methodological quality of the included studies (19).
Data Analysis
In the univariate analyses, pooled ORs and pooled standardized mean differences (SMDs) were used to detect the strength of each correlation between binary and continuous features and SSN growth, respectively. To facilitate the analyses, we converted ordered categorical variables in some studies into binary variables. Then, we used Pearson’s chi-square test or Fisher’s exact test to detect if there was a significant difference in the fourfold table for each study and pooled the corresponding ORs. We also estimated the means and standard deviations based on the corresponding medians, ranges and sample sizes for continuous variables whose means and standard deviations were absent (20). Then, we used Student’s t test to detect if there was a significant difference for each study and pooled the corresponding SMDs. In the multivariate analyses, pooled adjusted ORs obtained from multiple logistic regression models were used to assess the strength of each correlation of a CT or clinical feature with nodule growth. P-values < 0.05 was considered statistically significant. Statistical heterogeneity was determined using the Q test and I2 test (21). If P < 0.1 or I2 > 50%, the random-effects model (DerSimonian–Laird model) was used. Otherwise, the fixed-effects model (Mantel–Haenszel model/inverse variance model) was used. Subgroup meta-analysis was performed based on nodule consistency (pGGN and PSN). Publication bias was evaluated by Begg’s funnel plot. P-values ≥ 0.05 was considered to indicate that no publication bias existed (22). Statistical analyses were performed with R version 4.0.5 and the Meta package.
Results
Study Selection
Figure 1 provides an overview of the literature search and study selection process. Nineteen original studies (5, 6, 8, 9, 14–16, 23–34) were retrieved from 827 potential publications that assessed the relationship between SSN growth and CT or clinical features.
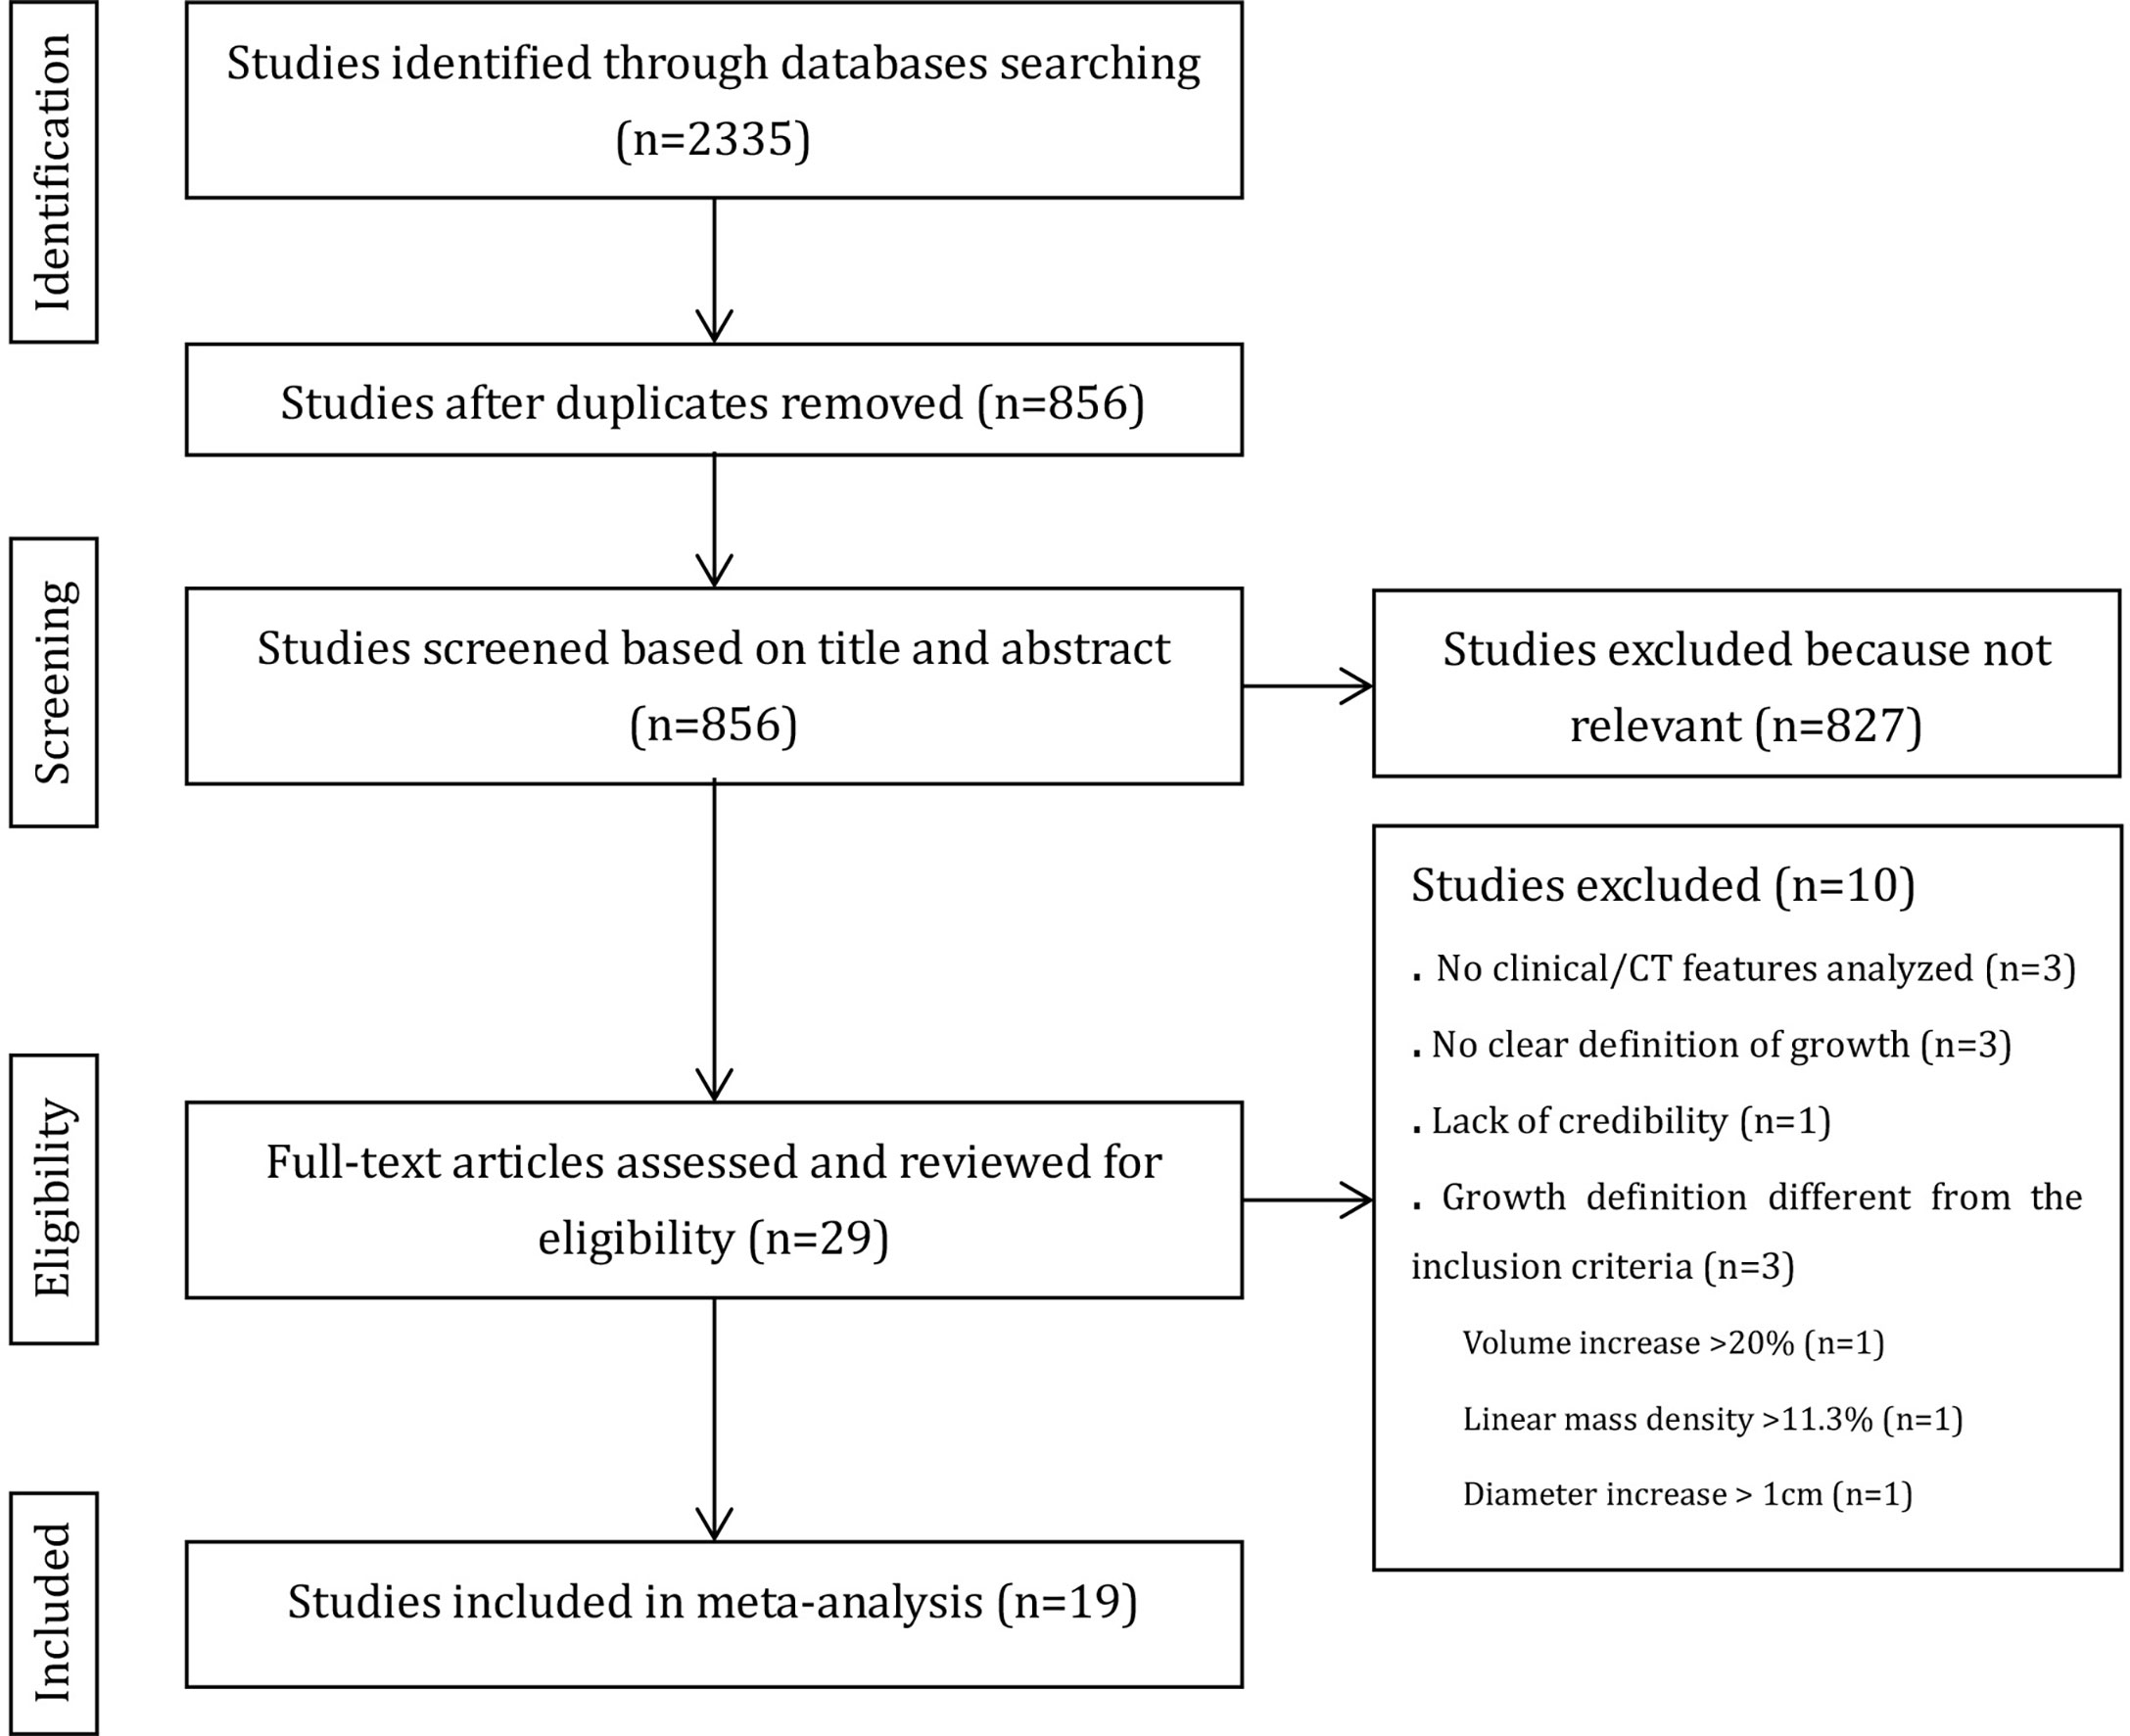
Figure 1 Flow chart shows summary of the literature review process.
Study Characteristics and Quality Assessment
All included studies were case–control studies. The group with nodule growth was the case group, and the group without nodule growth was the control group. Among the 19 included studies, 2 analyzed SSNs after 5 years of stability, 2 analyzed SSNs after 3 years of stability, and the remaining analyzed SSNs at baseline. The characteristics of the included studies are shown in Table 1. In total, 2444 patients with 3012 SSNs were included. The frequency of SSN growth ranged from 2.13% to 51.61% on a per-nodule basis.
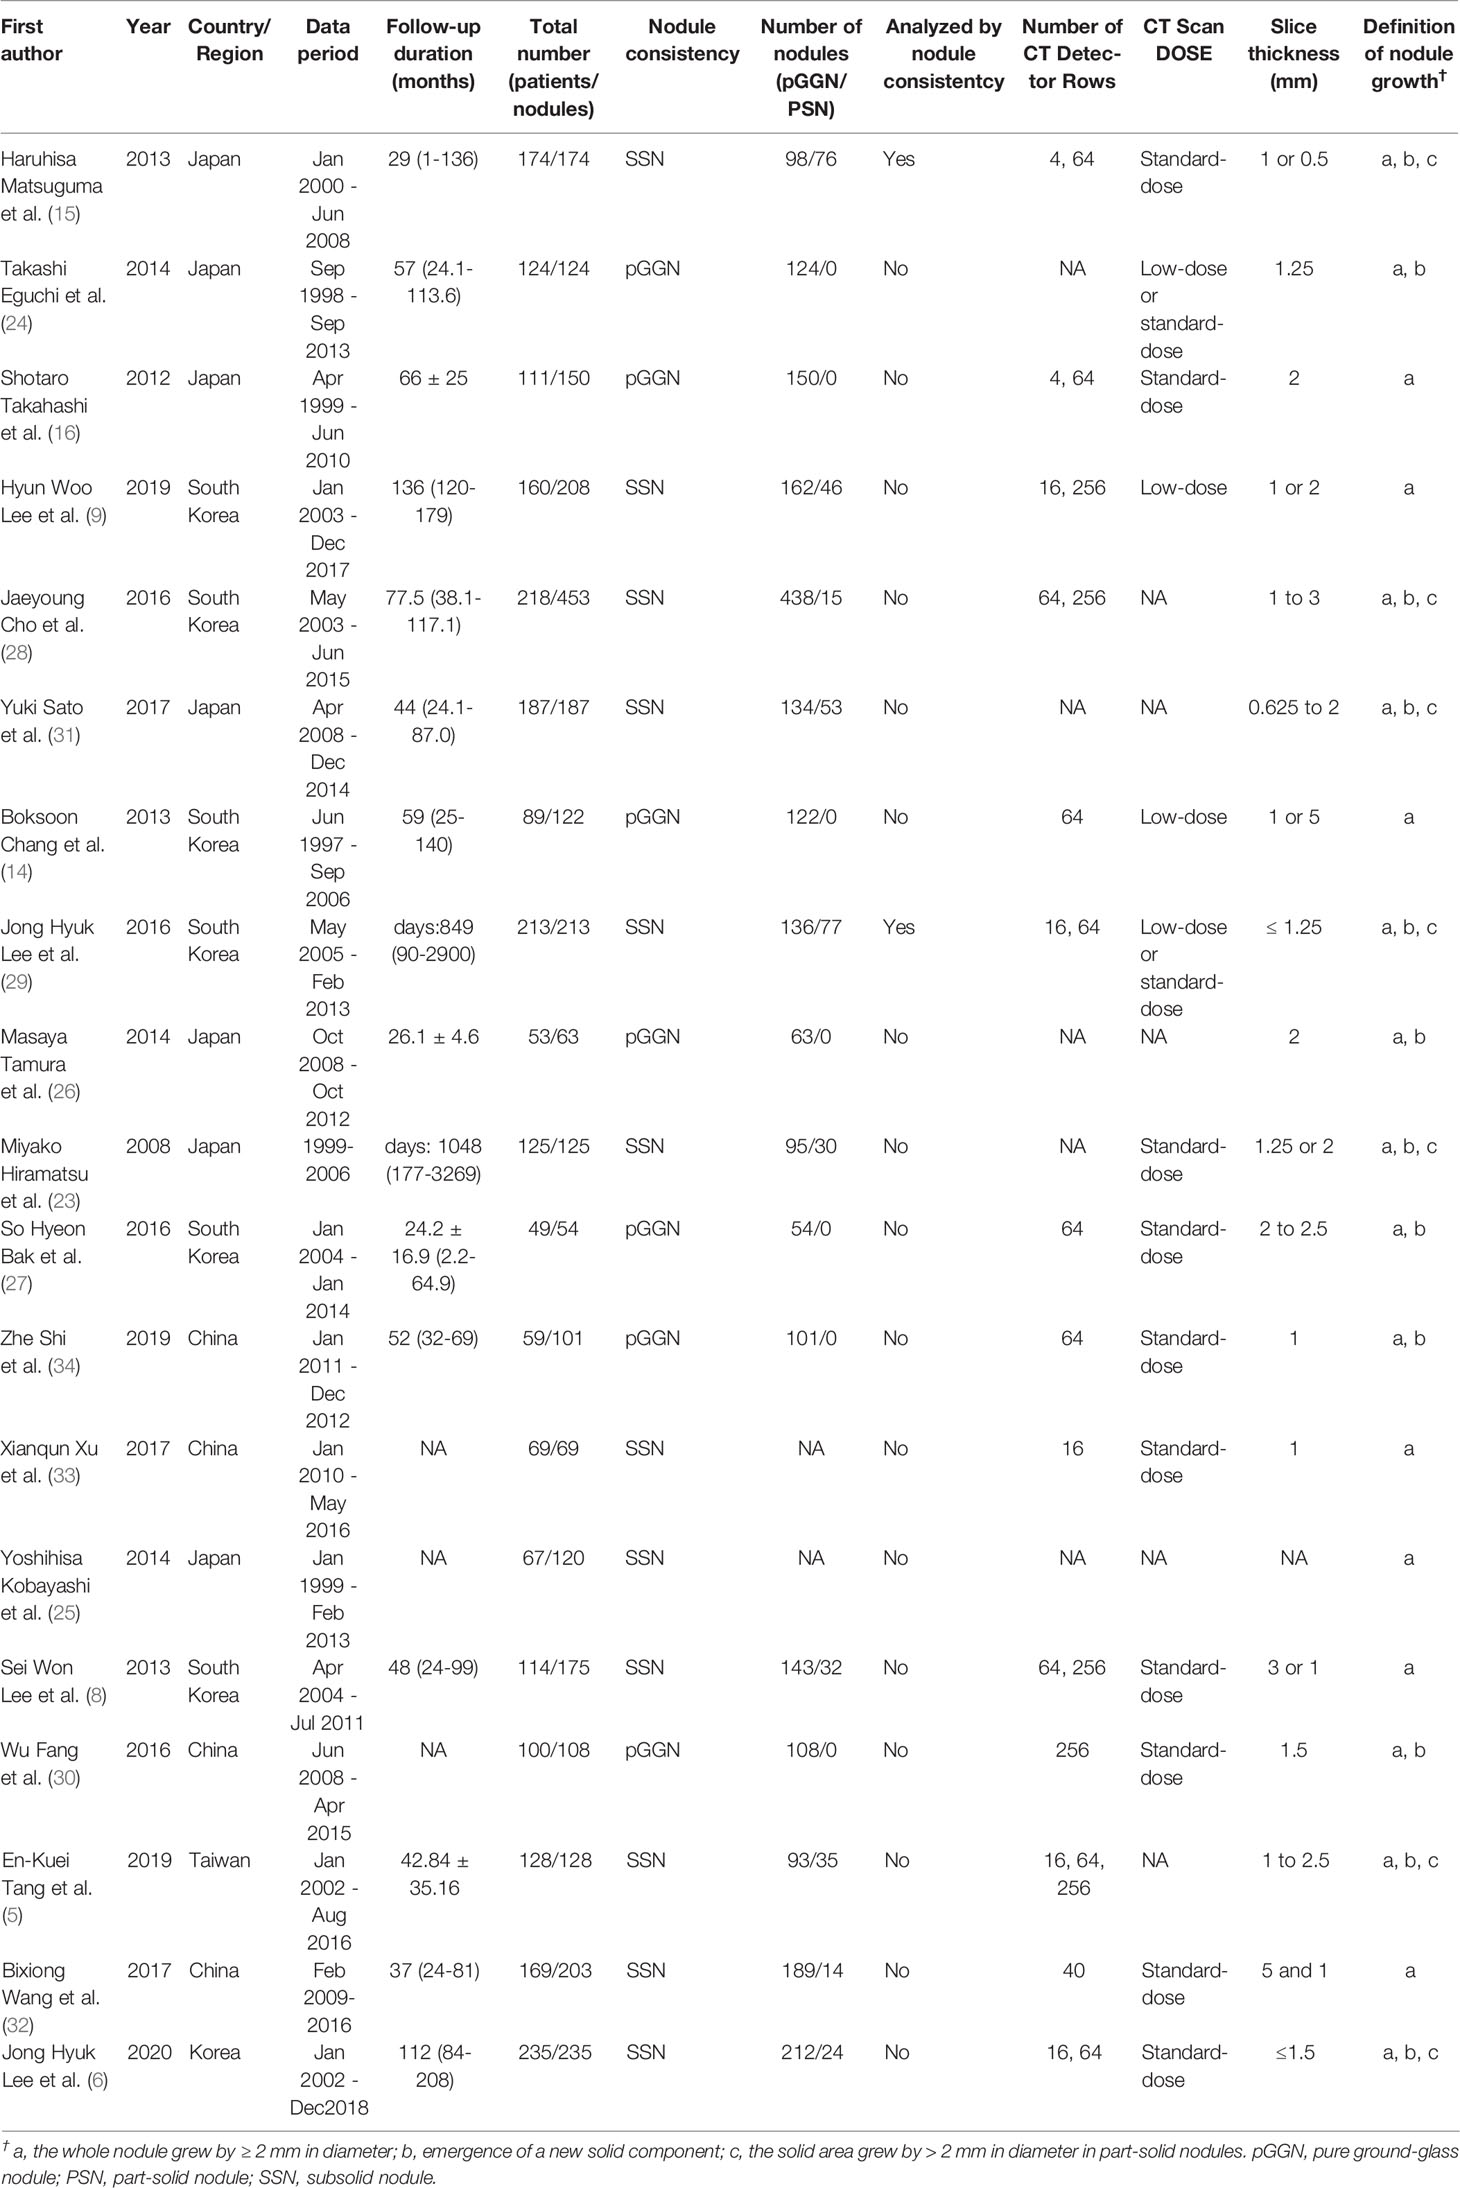
Table 1 Study characteristics.
According to the NOS, 14 studies (74%) were high quality (more than five stars), and the other 5 (26%) were low quality (Supplementary Appendix, Part 1, Table S1).
Categorization of Clinical and CT Features
Eighty-six descriptions were used to describe CT or clinical features in the 19 studies. One CT feature (emergence of a solid component) was removed because it is one of the criteria for SSN growth. After merging and subsuming similar descriptions that referred to the same CT findings as a single CT characteristic, 74 features remained. Among them, 11 features were investigated in both one single study for multivariate analysis and more than one study for univariate analysis, 47 features were only investigated in one single study, and 16 features were only investigated in more than one study. Finally, 27 clinical and CT features were included in the meta-analysis, and 58 clinical and CT features which investigated in only one study were extracted from their original studies (5, 8, 9, 16, 23, 24, 27, 28, 32–36) and summarized in Supplementary Appendix (Part 1, Table S2). Among the 27 features included in the meta-analysis, age was analyzed in three ways: as a continuous variable, a binary variables with a threshold of 65 years, and a binary variables with a threshold of 60 years; nodule size was analyzed in two ways: as a continuous variable, and a binary variable with a threshold of 10 mm. The process of categorizing the clinical and CT features is shown in Supplementary Appendix (Part 1, Table S3).
Features Correlated With SSN Growth
Twenty-seven clinical and CT features were included in the meta-analysis. Eighteen features, including male sex, history of lung cancer, smoking history, nodule size > 10 mm, larger nodule size, older age, nodule consistency, bubble-like appearance, air bronchogram, spiculated margin, higher mean CT attenuation, well-defined border, lesion below major fissure, larger volume, larger solid component, lobulated margin, higher STD CT attenuation and higher max CT attenuation, were detected to be significantly correlated with SSN growth, while 9 features, including multiple nodules, longer follow-up duration, age > 60 years, age > 65 years, emphysema, nodule shape, peripheral distribution, pleural/fissure retraction and larger mass, showed no significant correlation with SSN growth. Among the 27 CT and clinical features, 13 features, including male sex, number of nodules, history of lung cancer, smoking history, nodule > 10 mm, nodule size, age (years), follow-up duration, nodule consistency, bubble-like appearance, air bronchogram, spiculated margin and mean CT attenuation, were investigated in five or more studies. The pooled OR/SMD of these features are summarized in Table 2 and forest plots are shown in Supplementary Appendix (Part 1, Figure S1).
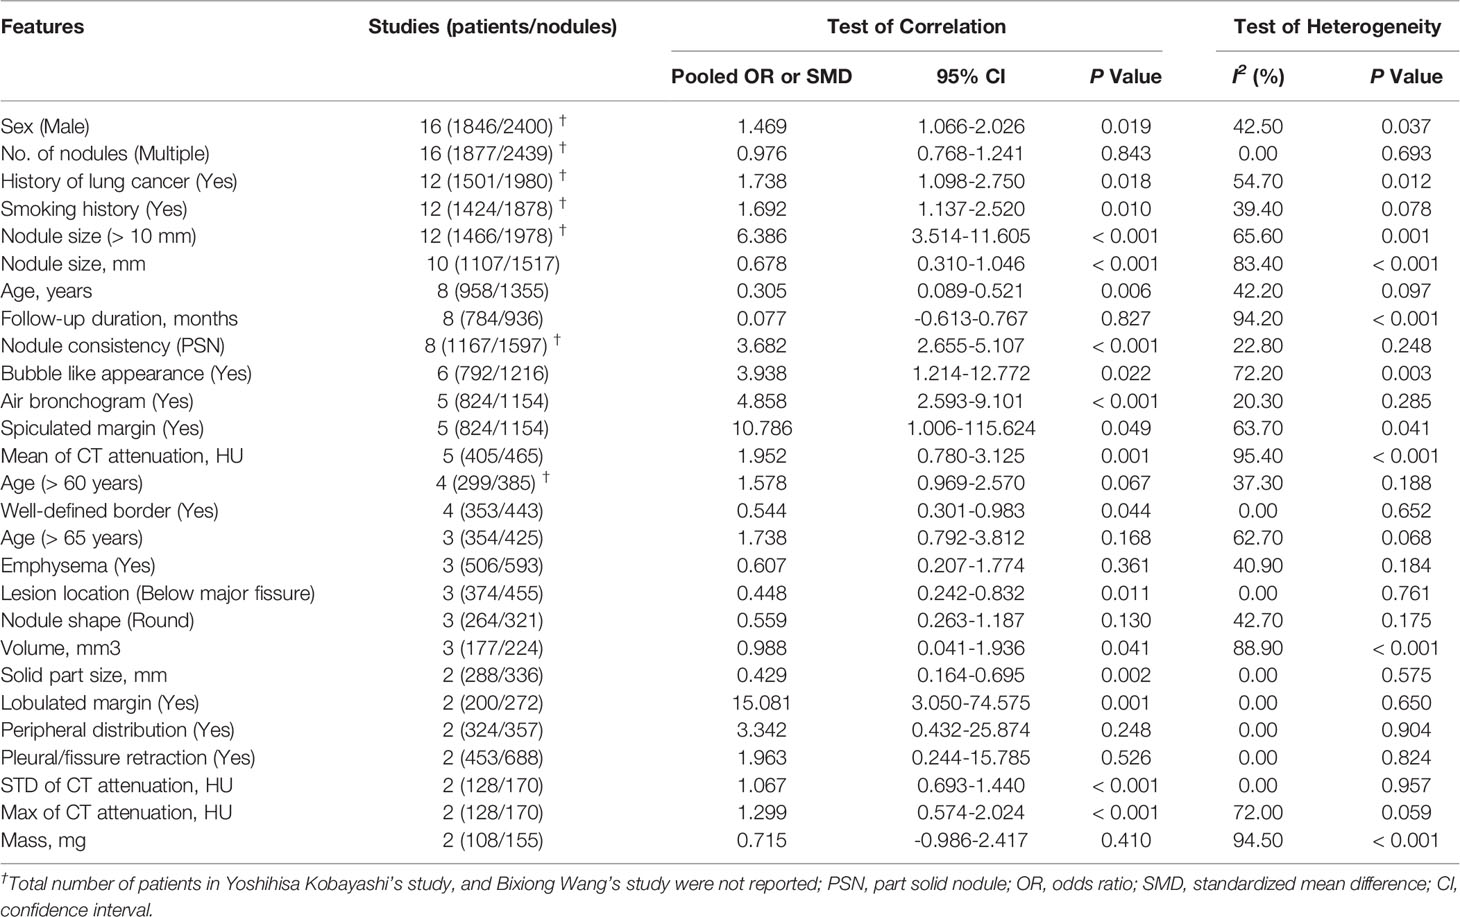
Table 2 Clinical and CT features included in the meta-analysis in SSN.
Independent Risk Factors for SSN Growth
Pooled ORs of six features, including sex, history of lung cancer, smoking history, nodule size > 10 mm, nodule consistency and age > 65 years, were calculated based on the multivariate analysis results. Forest plots of these six features are shown in Figure 2. Sex, history of lung cancer, nodule size > 10 mm, nodule consistency and age > 65 years were proven to be independent risk factors for SSN growth. Male patients showed a 2.351-fold higher probability of SSN growth (pooled OR 2.351, 95% CI 1.370-4.032, P = 0.002). Patients with a history of lung cancer had a 3.030-fold higher probability of SSN growth (pooled OR 3.030, 95% CI 1.933-4.749, P < 0.001). Patients with a nodule size > 10 mm had a 4.236-fold higher probability of SSN growth (pooled OR 4.236, 95% CI 1.488-12.059, P = 0.002). PSNs (nodule consistency) had a 2.951-fold higher probability of SSN growth (pooled OR 2.951, 95% CI 1.821-4.782, P < 0.001). Patients aged > 65 years had a 2.260-fold higher probability of SSN growth (pooled OR 2.260, 95% CI 1.308-3.903, P = 0.003). Smoking history showed no significant correlation with SSN growth based on the multivariate analysis results (pooled OR 1.941, 95% CI 0.935-4.029, P = 0.075).
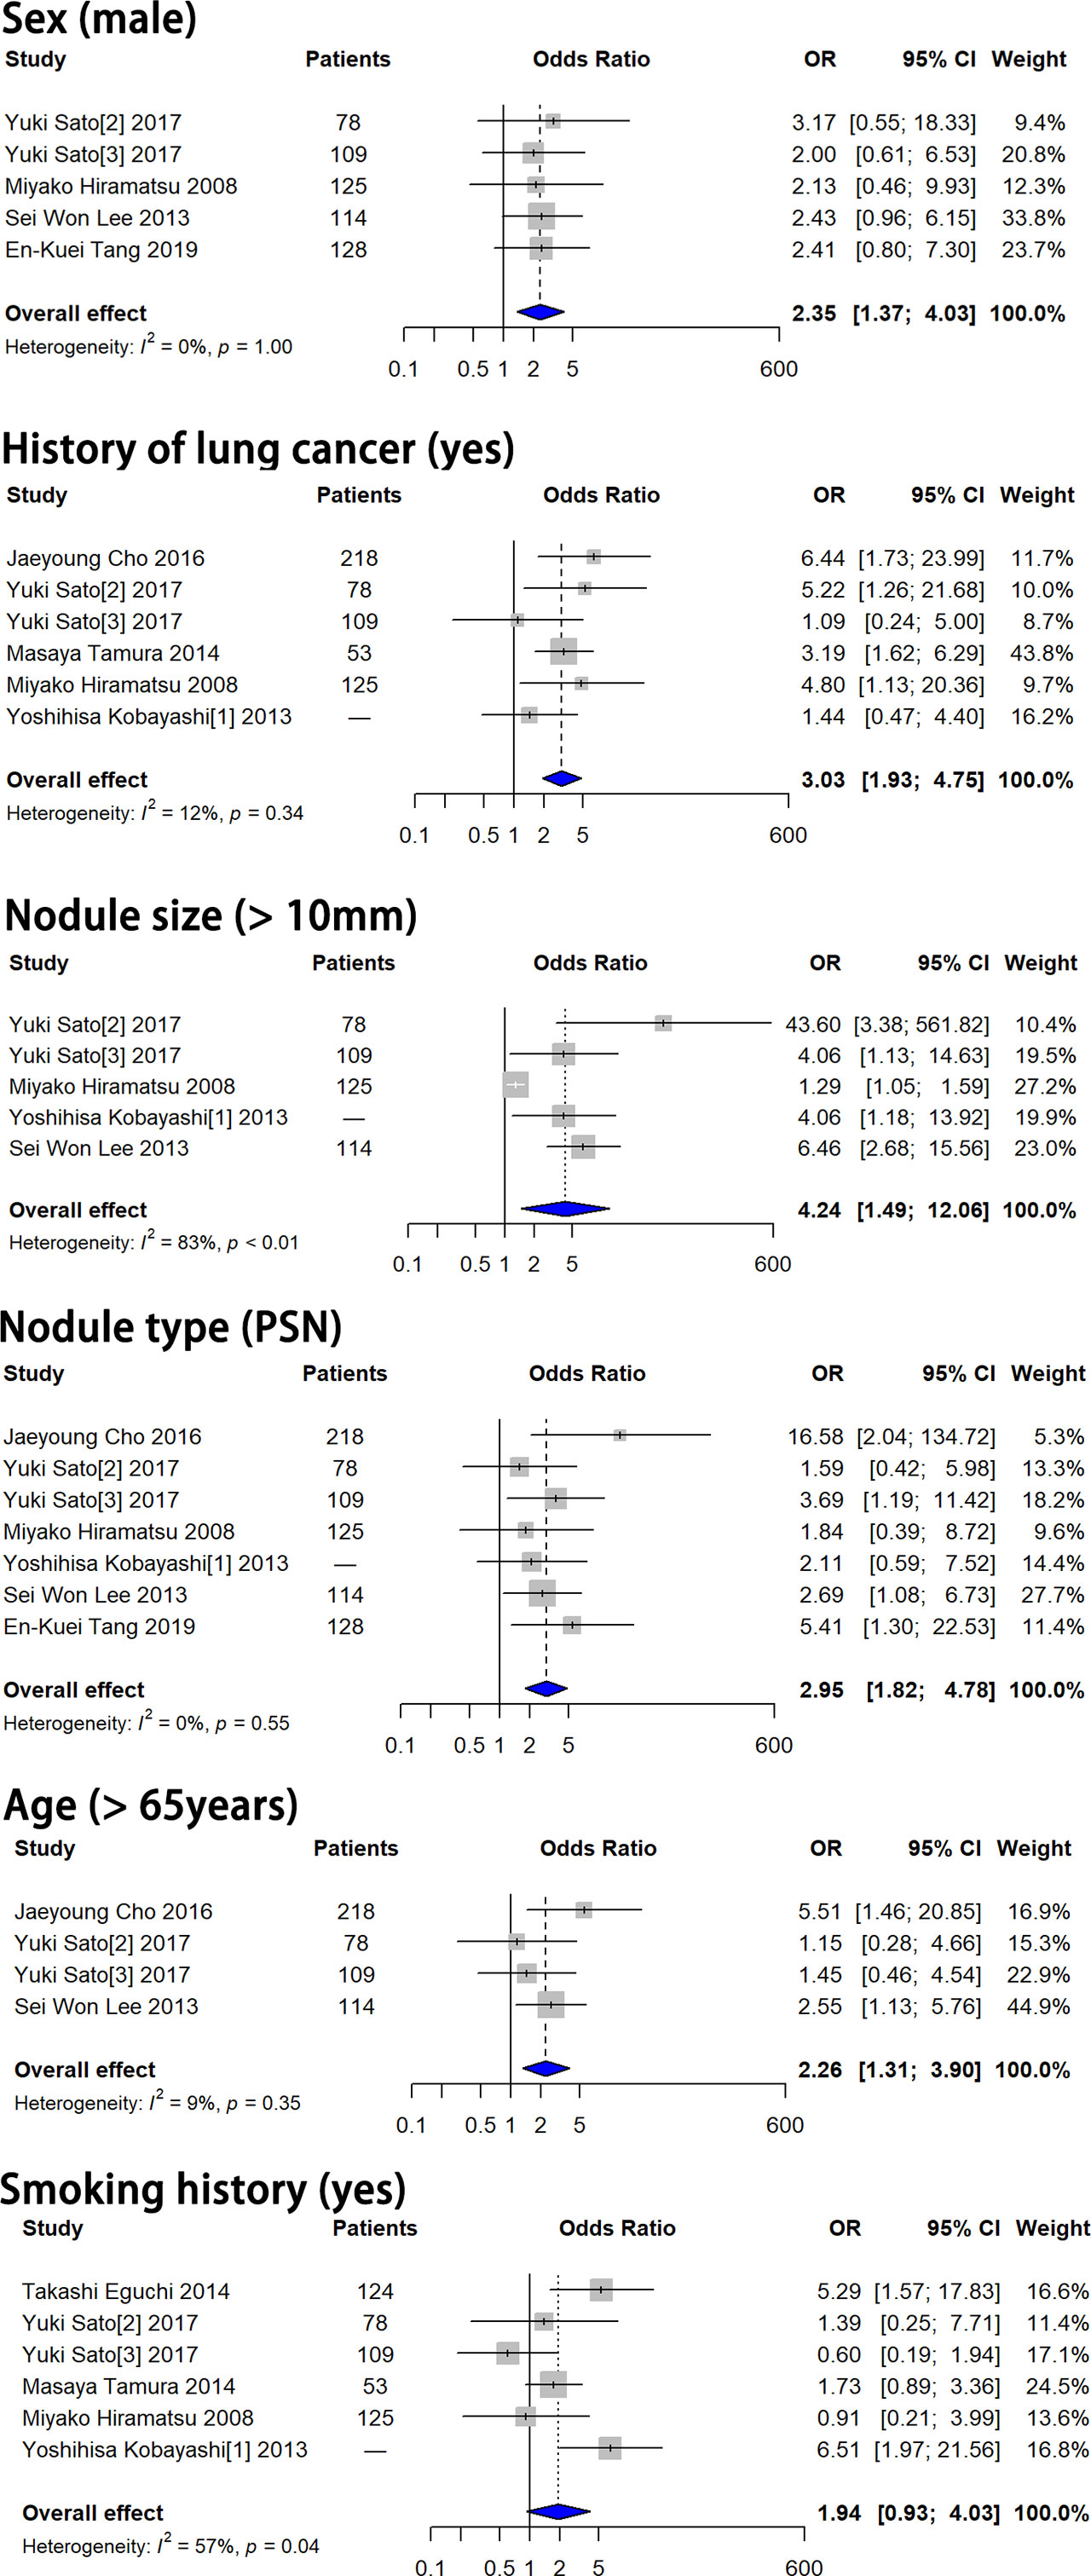
Figure 2 Forest plots showed that male sex, history of lung cancer, nodule size > 10 mm, PSN and age > 65 years were independent risk factors for SSN growth. Smoking history showed no significant correlation with SSN growth. OR, odds ratio; CI, confidence interval; PSN, part-solid nodule.
Subgroup Analyses on Nodule Consistency
The nodule consistency of the 19 original studies we included was pGGN in 7 studies and SSN in 12 studies. Among the 12 studies taking SSN as research objects, 2 studies analyzed the correlation between features and nodule growth by nodule consistency. In total, 9 studies analyzed the correlation between features and pGGN growth, and 2 studies analyzed the correlation between features and PSN. The number of studies on PSN is too few to perform a meta-analysis. Therefore, we just performed the meta-analysis on pGGN including a total of 16 features based on univariate analysis and 1 feature based on multivariate analysis.
Eight features, including male sex, smoking history, nodule size > 10 mm, larger nodule size, air bronchogram, higher mean CT attenuation, well-defined border, and lobulated margin were detected to be significantly correlated with pGGN growth (P = 0.03, 0.003, 0.047, 0.009, 0.001, 0.005, 0.044 and 0.001, respectively), while 8 features, including multiple nodules, history of lung cancer, age, longer follow-up duration, bubble-like appearance, nodule shape, volume and larger mass, showed no significant correlation with pGGN growth (P = 0.675, 0.366, 0.071, 0.796, 0.234, 0.130, 0.176 and 0.410, respectively) based on univariate analysis (Table 3; Supplementary Appendix, Part 1, Figure S2). Smoking history showed no significant correlation with pGGN growth based on the multivariate analysis results (P = 0.071, Figure 3).
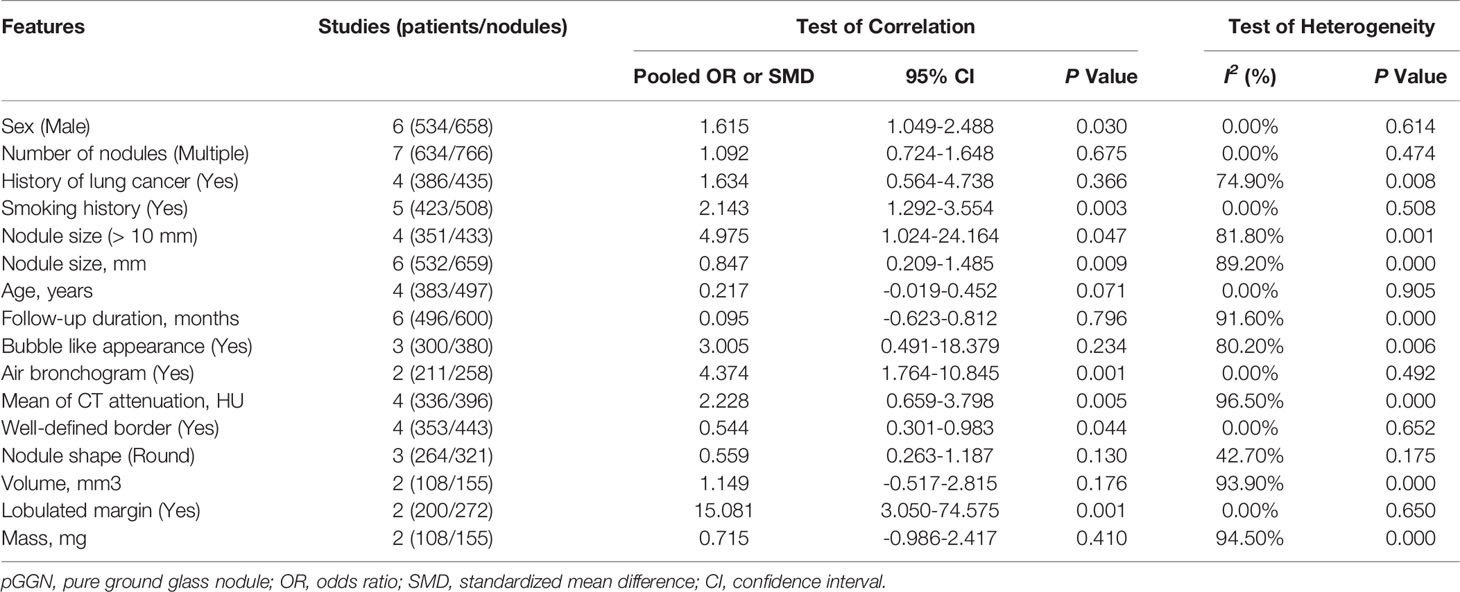
Table 3 Clinical and CT features included in the meta-analysis based on univariate analyses in pGGN.
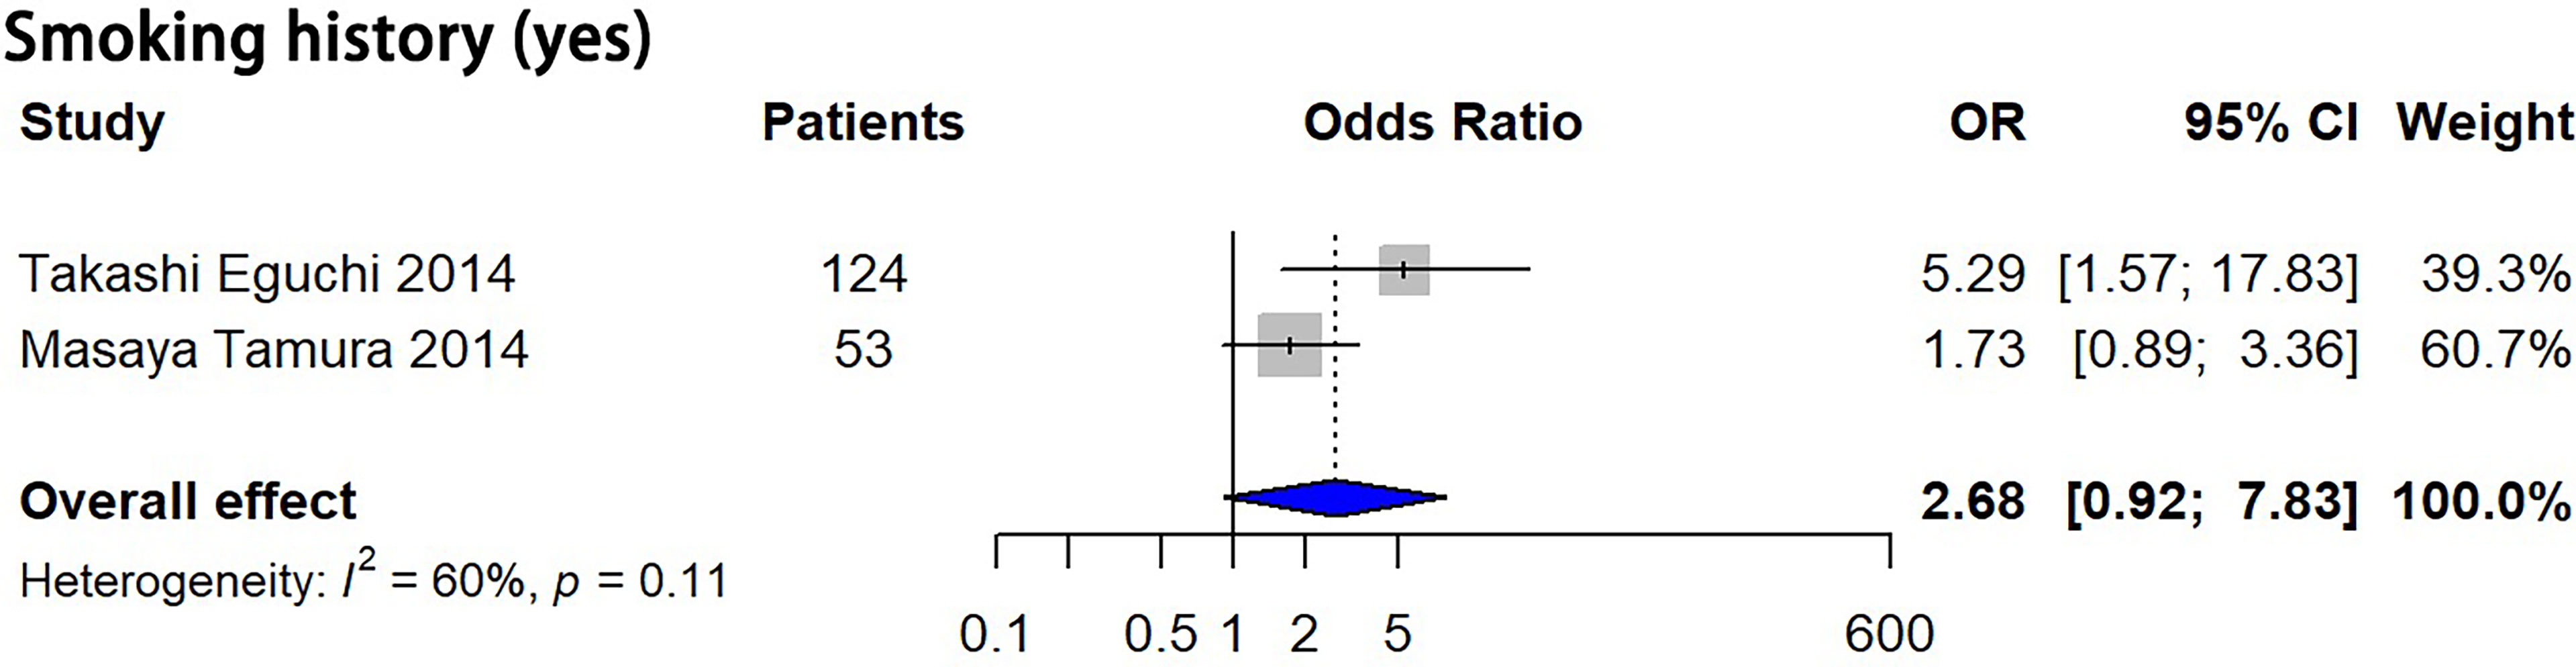
Figure 3 Forest plots showed no significant correlation between smoking history and pGGN growth based on multivariate analysis. OR, odds ratio; CI, confidence interval; pGGN, pure ground glass nodule.
Publication Bias
The funnel plots did not show significant publication bias for the CT and clinical features analyzed based on both the univariate analysis results and multivariate analysis results (P > 0.05). (Supplementary Appendix, Part 1, Figure S3 and Figure S4)
Discussion
In this systematic review and meta-analysis, 18 clinical and CT features were found to be significantly correlated with SSN growth, and 5 features including male sex, history of lung cancer, nodule size > 10 mm, nodule consistency and age > 65 years were identified to be independent risk factors for SSN growth. Eight features, including male sex, smoking history, nodule size > 10 mm, larger nodule size, air bronchogram, higher mean CT attenuation, well-defined border, and lobulated margin were associated with pGGN growth. Among the features associated with SSN growth, 11 features, including sex, history of lung cancer, smoking history, nodule size (> 10 mm), nodule size (mm), age (years), nodule consistency, bubble-like appearance, air bronchogram, spiculated margin and mean CT attenuation, were investigated in 5 or more studies, while the other 7 features were only investigated in 2 to 4 studies. Among the features associated with pGGN growth, 5 features including male sex, number of nodules, smoking history, nodule size (mm) and follow-up duration, were investigated in 5 studies or more studies, while the other 11 features were only investigated in 2 to 4 studies. The real clinical significance of the features investigated in less than 5 studies needs to be further studied due to the small number of studies included.
Studies have proven that PSNs are more aggressive than pGGNs (37, 38). In this meta-analysis, PSNs had a 2.95-fold higher probability of SSN growth than pGGNs, which is consistent with the previous studies. When we analyzed the characteristics of pGGN, we found that history of lung cancer, age, bubble like appearance, and volume, which are significantly correlated SSN growth, are not associated with pGGN growth. Although the including studies for these four features are very limited (only 2 to 4 studies), the results may imply that the features correlated with the growth of the pGGN and the PSN are different. Therefore, to predict the growth of SSN based on risk features, it should be identified whether the nodule is PSN or pGGN at first.
A history of lung cancer showed high correlation with SSN growth, and it forecasted a 3.498-fold higher probability of SSN growth. However, history of lung cancer was not associated with pGGN growth. Multiple studies suggest that lung cancer history is associated with SSN growth (15, 23, 28, 39), but a few studies found that lung cancer history was not associated with pGGN growth (24, 29). A prospective multicenter study concluded that history of lung cancer was not a factor for SSN growth, and 85.1% of nodules included in the study were pGGNs (7). The relationship between the history of lung cancer and the growth of pGGN and PSN needs further study. Shewale et al. (40) retrospectively reviewed 210 patients with GGNs and a history of lung cancer and demonstrated that patients with a lung adenocarcinoma history had a 6.85-fold higher likelihood for SSN growth than patients with other lung cancer subtypes. As we know, among non-small cell lung cancer, adenocarcinoma is a histological subtype prone to epidermal growth factor receptor (EGFR) mutation, and previous studies have shown that the growth of SSN(s) is closely related to gene mutation status. EGFR mutations have been found to be a promoter of GGN growth in both mice and humans (41, 42). This may be one of the reasons why SSNs are more likely to grow in patients with lung cancer, especially those with adenocarcinoma. The correlation between other tumor types and SSN growth needs to be elucidated.
Among the 5 independent risk factors for SSN growth, a nodule size > 10 mm showed the highest correlation with SSN growth, leading to a 4.236-fold higher probability of SSN growth than nodules ≤ 10 mm in size. Nodule size is an important factor in both SSN follow-up guidelines and pulmonary nodule malignancy prediction models. In the Fleischner society, ACCP and NCCN guidelines, the management of SSN(s) differs based on nodule size (11, 12, 43). Nodule size is also a risk factor used in the Mayo model, PanCan model and Vancouver model to estimate the malignancy risk of pulmonary nodules (11, 44). Several studies also use volume to describe the size of nodules. Han et al. (45) found that in lung cancer screening, semiautomatic volume measurements showed higher accuracy than diameter measurements. In this meta-analysis, three original studies were included, and a significant correlation between volume and nodule growth was found (pooled SMD 0.988, 95% CI 0.041-1.936, P = 0.041). However, considering the difficulties in identifying the SSN boundary for computer-aided measurements, using diameter to describe the size of the SSN is still a better choice.
In this meta-analysis, we also found another interesting result. The follow-up duration showed no significant correlation with either SSN growth or pGGN growth (P = 0.827 and 0.796 respectively). Kobayashi et al. (4) found the tendency to grow was clear within the first 3 years for SSNs. Lee et al. (6) followed SSNs that had been stable for initial 5 years and found that only 5 (2.1%) of nodules grew. The frequency of SSNs increasing in size after prolonged stability is quite small, which is consistent to our results. Based on the above, we speculate that the frequency of CT examination can be reduced for SSN followed up for more than 5 years.
Studies have reported that approximately 37%-70% of SSNs detected on CT screening are transient and resolve spontaneously or with antibiotic therapy within 3 months of the initial examination (46–48). Features associated with transient SSNs include younger age, male sex, peripheral eosinophilia, multiplicity, ill-defined margins, nonspiculated margins, and large solid components (47, 49). Some features, such as ill-defined margins, male sex and large solid components coincide with the features of SSNs growth which may lead to the determination of a transient nodule as a growing nodule. Therefore, we suggest that the prediction of SSN growth should be performed at least 3 months after the initial examination. SSN growth prediction is important not only to make follow-up plan but also to optimize surgical timing. Based on the included studies, we found that only 49.23% stable SSNs were invasive adenocarcinoma (IAC) while 81.01% growth SSNs were IAC, and growth SSNs showed a 4.32-fold higher probability of invasive adenocarcinoma than stable SSNs (Supplementary Appendix, Part 2). These results suggest that surgical resection after the growth of SSNs may be more appropriate than upon detection, which needs further study.
Our study had several limitations. First, the study subjects in the included studies were not completely homogenous. Among the 19 included studies, 2 analyzed SSNs after 5 years of stability, 2 analyzed SSNs after 3 years of stability, and the remaining analyzed SSNs at baseline. Fortunately, no significant differences in the included features were detected in publication bias tests. Second, most of the features had no multivariate analysis results in the original studies, and their specific role in SSN growth needs to be further studied. Third, compared with a large number of clinical and CT features, the number of studies included is so small that the meta-analysis of some features may lack credibility. Fourth, the number of studies on PSN is too few to perform a meta-analysis. Nevertheless, to the best of our knowledge, our meta-analysis is the only study to investigate the correlation of clinical and CT features with SSN growth, and this analysis included all available literature.
In conclusion, in this meta-analysis, eighteen clinical and CT features were detected to be significantly correlated with SSN growth, and 5 features including male sex, history of lung cancer, nodule size > 10 mm, nodule consistency and age > 65 years were identified to be independent risk factors for SSN growth. For pGGN, history of lung cancer, older age, bubble-like appearance, and larger volume were not risk factors for growth, although these factors were associated with SSN growth. A risk-based SSN follow-up strategy should consider these factors and nodule consistency, and separate strategies should be planned for each single nodule in patients with multiple SSNs.
Data Availability Statement
The original contributions presented in the study are included in the article/Supplementary Material. Further inquiries can be directed to the corresponding author.
Author Contributions
(I) Conception and design: All authors; (II) Administrative support: None; (III) Provision of study materials or patients: None; (IV) Collection and assembly of data: LZ, MWL, ML; (V) Data analysis and interpretation: All authors; (VI) Manuscript writing: All authors; (VII) Final approval of manuscript: All authors
Funding
This work was supported by National Natural Science Foundation of China (81701692); and Beijing Municipal Natural Science Foundation (7184238).
Conflict of Interest
The authors declare that the research was conducted in the absence of any commercial or financial relationships that could be construed as a potential conflict of interest.
Publisher’s Note
All claims expressed in this article are solely those of the authors and do not necessarily represent those of their affiliated organizations, or those of the publisher, the editors and the reviewers. Any product that may be evaluated in this article, or claim that may be made by its manufacturer, is not guaranteed or endorsed by the publisher.
Supplementary Material
The Supplementary Material for this article can be found online at: https://www.frontiersin.org/articles/10.3389/fonc.2022.929174/full#supplementary-material
References
1. Godoy MCB, Naidich DP. Subsolid Pulmonary Nodules and the Spectrum of Peripheral Adenocarcinomas of the Lung: Recommended Interim Guidelines for Assessment and Management. Radiology (2009) 253(3):606–22. doi: 10.1148/radiol.2533090179
2. Hansell DM, Bankier AA, MacMahon H, McLoud TC, Müller NL, Remy J. Fleischner Society: Glossary of Terms for Thoracic Imaging. Radiology (2008) 246(3):697–722. doi: 10.1148/radiol.2462070712
3. Hasegawa M, Sone S, Takashima S, Li F, Yang ZG, Maruyama Y, et al. Growth Rate of Small Lung Cancers Detected on Mass Ct Screening. Br J Radiol (2000) 73(876):1252–9. doi: 10.1259/bjr.73.876.11205667
4. Kobayashi Y, Fukui T, Ito S, Usami N, Hatooka S, Yatabe Y, et al. How Long Should Small Lung Lesions of Ground-Glass Opacity Be Followed? J Thorac Oncol (2013) 8(3):309–14. doi: 10.1097/JTO.0b013e31827e2435
5. Tang EK, Chen CS, Wu CC, Wu MT, Yang TL, Liang HL, et al. Natural History of Persistent Pulmonary Subsolid Nodules: Long-Term Observation of Different Interval Growth. Heart Lung Circ (2019) 28(11):1747–54. doi: 10.1016/j.hlc.2018.08.015
6. Lee JH, Lim WH, Hong JH, Nam JG, Hwang EJ, Kim H, et al. Growth and Clinical Impact of 6-Mm or Larger Subsolid Nodules After 5 Years of Stability at Chest Ct. Radiology (2020) 295(2):448–55. doi: 10.1148/radiol.2020191921
7. Kakinuma R, Noguchi M, Ashizawa K, Kuriyama K, Maeshima AM, Koizumi N, et al. Natural History of Pulmonary Subsolid Nodules: A Prospective Multicenter Study. J Thorac Oncol (2016) 11(7):1012–28. doi: 10.1016/j.jtho.2016.04.006
8. Lee SW, Leem CS, Kim TJ, Lee KW, Chung JH, Jheon S, et al. The Long-Term Course of Ground-Glass Opacities Detected on Thin-Section Computed Tomography. Respir Med (2013) 107(6):904–10. doi: 10.1016/j.rmed.2013.02.014
9. Lee HW, Jin KN, Lee JK, Kim DK, Chung HS, Heo EY, et al. Long-Term Follow-Up of Ground-Glass Nodules After 5 Years of Stability. J Thorac Oncol (2019) 14(8):1370–7. doi: 10.1016/j.jtho.2019.05.005
10. Loverdos K, Fotiadis A, Kontogianni C, Iliopoulou M, Gaga M. Lung Nodules: A Comprehensive Review on Current Approach and Management. Ann Thorac Med (2019) 14(4):226–38. doi: 10.4103/atm.ATM_110_19
11. MacMahon H, Naidich DP, Goo JM, Lee KS, Leung ANC, Mayo JR, et al. Guidelines for Management of Incidental Pulmonary Nodules Detected on Ct Images: From the Fleischner Society 2017. Radiology (2017) 284(1):228–43. doi: 10.1148/radiol.2017161659
12. Gould MK, Donington J, Lynch WR, Mazzone PJ, Midthun DE, Naidich DP, et al. Evaluation of Individuals With Pulmonary Nodules: When Is It Lung Cancer? Diagnosis and Management of Lung Cancer, 3rd Ed: American College of Chest Physicians Evidence-Based Clinical Practice Guidelines. Chest (2013) 143(5 Suppl):e93S–e120S. doi: 10.1378/chest.12-2351
13. Silva M, Prokop M, Jacobs C, Capretti G, Sverzellati N, Ciompi F, et al. Long-Term Active Surveillance of Screening Detected Subsolid Nodules Is a Safe Strategy to Reduce Overtreatment. J Thorac Oncol (2018) 13(10):1454–63. doi: 10.1016/j.jtho.2018.06.013
14. Chang B, Hwang JH, Choi YH, Chung MP, Kim H, Kwon OJ, et al. Natural History of Pure Ground-Glass Opacity Lung Nodules Detected by Low-Dose Ct Scan. Chest (2013) 143(1):172–8. doi: 10.1378/chest.11-2501
15. Matsuguma H, Mori K, Nakahara R, Suzuki H, Kasai T, Kamiyama Y, et al. Characteristics of Subsolid Pulmonary Nodules Showing Growth During Follow-Up With Ct Scanning. Chest (2013) 143(2):436–43. doi: 10.1378/chest.11-3306
16. Takahashi S, Tanaka N, Okimoto T, Tanaka T, Ueda K, Matsumoto T, et al. Long Term Follow-Up for Small Pure Ground-Glass Nodules: Implications of Determining an Optimum Follow-Up Period and High-Resolution Ct Findings to Predict the Growth of Nodules. Jpn J Radiol (2012) 30(3):206–17. doi: 10.1007/s11604-011-0033-8
17. Hutton B, Salanti G, Caldwell DM, Chaimani A, Schmid CH, Cameron C, et al. The Prisma Extension Statement for Reporting of Systematic Reviews Incorporating Network Meta-Analyses of Health Care Interventions: Checklist and Explanations. Ann Internal Med (2015) 162(11):777–84. doi: 10.7326/M14-2385
18. Moher D, Shamseer L, Clarke M, Ghersi D, Liberati A, Petticrew M, et al. Preferred Reporting Items for Systematic Review and Meta-Analysis Protocols (Prisma-P) 2015 Statement. Systematic Rev (2015) 4:1. doi: 10.1186/2046-4053-4-1
19. Wells GA, Shea B, O’Connell D, Peterson J, Welch V. The Newcastle–Ottawa Scale (Nos) for Assessing the Quality of Nonrandomized Studies in Meta-Analysis (2014) (2014). Available at: http://www.ohrica/programs/clinical_epidemiology/oxfordasp.
20. Hozo SP, Djulbegovic B, Hozo I. Estimating the Mean and Variance From the Median, Range, and the Size of a Sample. BMC Med Res Methodol (2005) 5(1 Supplement):13. doi: 10.1186/1471-2288-5-13
21. Higgins JP, Thompson SG. Quantifying Heterogeneity in a Meta-Analysis. Stat Med (2002) 21(11):1539–58. doi: 10.1002/sim.1186
22. Lau J, Ioannidis JPA, Terrin N, Schmid CH, Olkin I. The Case of the Misleading Funnel Plot. BMJ (online) (2006) 333(7568):597–600. doi: 10.1136/bmj.333.7568.597
23. Hiramatsu M, Inagaki T, Inagaki T, Matsui Y, Satoh Y, Okumura S, et al. Pulmonary Ground-Glass Opacity (Ggo) Lesions-Large Size and a History of Lung Cancer Are Risk Factors for Growth. J Thorac Oncol (2008) 3(11):1245–50. doi: 10.1097/JTO.0b013e318189f526
24. Eguchi T, Kondo R, Kawakami S, Matsushita M, Yoshizawa A, Hara D, et al. Computed Tomography Attenuation Predicts the Growth of Pure Ground-Glass Nodules. Lung Cancer (Amsterdam Netherlands) (2014) 84(3):242–7. doi: 10.1016/j.lungcan.2014.03.009
25. Kobayashi Y, Sakao Y, Deshpande GA, Fukui T, Mizuno T, Kuroda H, et al. The Association Between Baseline Clinical-Radiological Characteristics and Growth of Pulmonary Nodules With Ground-Glass Opacity. Lung Cancer (2014) 83(1):61–6. doi: 10.1016/j.lungcan.2013.10.017
26. Tamura M, Shimizu Y, Yamamoto T, Yoshikawa J, Hashizume Y. 15-Predictive Value of One-Dimensional Mean Computed Tomography Value of Ground-Glass Opacity on High-Resolution Images for the Possibility of Future Change. J Thorac Oncol (2014) 9(4):469–72. doi: 10.1097/JTO.0000000000000117
27. Bak SH, Lee HY, Kim JH, Um SW, Kwon OJ, Han J, et al. Quantitative Ct Scanning Analysis of Pure Ground-Glass Opacity Nodules Predicts Further Ct Scanning Change. Chest (2016) 149(1):180–91. doi: 10.1378/chest.15-0034
28. Cho J, Kim ES, Kim SJ, Lee YJ, Park JS, Cho YJ, et al. Long-Term Follow-Up of Small Pulmonary Ground-Glass Nodules Stable for 3 Years: Implications of the Proper Follow-Up Period and Risk Factors for Subsequent Growth. J Thorac Oncol (2016) 11(9):1453–9. doi: 10.1016/j.jtho.2016.05.026
29. Lee JH, Park CM, Lee SM, Kim H, McAdams HP, Goo JM. Persistent Pulmonary Subsolid Nodules With Solid Portions of 5 Mm or Smaller: Their Natural Course and Predictors of Interval Growth. Eur Radiol (2016) 26(6):1529–37. doi: 10.1007/s00330-015-4017-4
30. Wu F, Cai ZL, Tian SP, Jin X, Jing R, Yang YQ, et al. Value of Baseline Clinical and Ct Characteristics for Predicting the Progression of Persistent Pure Ground-Glass Nodule 10 Mm or Less in Diameter. Zhongguo Yi Xue Ke Xue Yuan Xue Bao Acta Acad Med Sinicae (2016) 38(4):371–7. doi: 10.3881/j.issn.1000-503X.2016.04.001
31. Sato Y, Fujimoto D, Morimoto T, Uehara K, Nagata K, Sakanoue I, et al. 9-Natural History and Clinical Characteristics of Multiple Pulmonary Nodules With Ground Glass Opacity. Respirology (2017) 22(8):1615–21. doi: 10.1111/resp.13089
32. Wang B, You X, Sun X. The Associations Among Radiological Characteristics, Growth, and Pathological Results of Pulmonary Subsolid Nodules. Biomed Res (2017) 28(15):6829–33.
33. Xu X, Wu K, Zhao Y, Mei L. Stage I Lung Adenocarcinoma: The Value of Quantitative Ct in Differentiating Pathological Subtypes and Predicting Growth of Subsolid Nodules. Med (Baltimore) (2017) 96(16):e6595. doi: 10.1097/MD.0000000000006595
34. Shi Z, Deng J, She Y, Zhang L, Ren Y, Sun W, et al. Quantitative Features Can Predict Further Growth of Persistent Pure Ground-Glass Nodule. Quant Imaging Med Surg (2019) 9(2):283–91. doi: 10.21037/qims.2019.01.04
35. Sato Y, Fujimoto D, Morimoto T, Uehara K, Nagata K, Sakanoue I, et al. Natural History and Clinical Characteristics of Multiple Pulmonary Nodules With Ground Glass Opacity. Respirology (2017) 22(8):1615–21. doi: 10.1111/resp.13089
36. Tamura M, Shimizu Y, Yamamoto T, Yoshikawa J, Hashizume Y. Predictive Value of One-Dimensional Mean Computed Tomography Value of Ground-Glass Opacity on High-Resolution Images for the Possibility of Future Change. J Thorac Oncol (2014) 9(4):469–72. doi: 10.1097/JTO.0000000000000117
37. Oda S, Awai K, Murao K, Ozawa A, Utsunomiya D, Yanaga Y, et al. Volume-Doubling Time of Pulmonary Nodules With Ground Glass Opacity at Multidetector Ct: Assessment With Computer-Aided Three-Dimensional Volumetry. Acad Radiol (2011) 18(1):63–9. doi: 10.1016/j.acra.2010.08.022
38. Song YS, Park CM, Park SJ, Lee SM, Jeon YK, Goo JM. Volume and Mass Doubling Times of Persistent Pulmonary Subsolid Nodules Detected in Patients Without Known Malignancy. Radiology (2014) 273(1):276–84. doi: 10.1148/radiol.14132324
39. de Margerie-Mellon C, Ngo LH, Gill RR, Monteiro Filho AC, Heidinger BH, Onken A, et al. The Growth Rate of Subsolid Lung Adenocarcinoma Nodules at Chest Ct. Radiology (2020) 297(1):189–98. doi: 10.1148/radiol.2020192322
40. Shewale JB, Nelson DB, Rice DC, Sepesi B, Hofstetter WL, Mehran RJ, et al. Natural History of Ground-Glass Lesions Among Patients With Previous Lung Cancer. Ann Thorac Surg (2018) 105(6):1671–7. doi: 10.1016/j.athoracsur.2018.01.031
41. Aoki T, Hanamiya M, Uramoto H, Hisaoka M, Yamashita Y, Korogi Y. Adenocarcinomas With Predominant Ground-Glass Opacity: Correlation of Morphology and Molecular Biomarkers. Radiology (2012) 264(2):590–6. doi: 10.1148/radiol.12111337
42. Kobayashi Y, Mitsudomi T, Sakao Y, Yatabe Y. Genetic Features of Pulmonary Adenocarcinoma Presenting With Ground-Glass Nodules: The Differences Between Nodules With and Without Growth. Ann Oncol (2015) 26(1):156–61. doi: 10.1093/annonc/mdu505
43. Ettinger DS, Wood DE, Aisner DL, Akerley W, Bauman JR, Bharat A, et al. Nccn Guidelines Insights: Non-Small Cell Lung Cancer, Version 2.2021. J Natl Compr Canc Netw (2021) 19(3):254–66. doi: 10.6004/jnccn.2021.0013
44. Al-Ameri A, Malhotra P, Thygesen H, Plant PK, Vaidyanathan S, Karthik S, et al. Risk of Malignancy in Pulmonary Nodules: A Validation Study of Four Prediction Models. Lung Cancer (2015) 89(1):27–30. doi: 10.1016/j.lungcan.2015.03.018
45. Han D, Heuvelmans MA, Oudkerk M. Volume Versus Diameter Assessment of Small Pulmonary Nodules in Ct Lung Cancer Screening. Transl Lung Cancer Res (2017) 6(1):52–61. doi: 10.21037/tlcr.2017.01.05
46. Oh JY, Kwon SY, Yoon HI, Lee SM, Yim JJ, Lee JH, et al. Clinical Significance of a Solitary Ground-Glass Opacity (Ggo) Lesion of the Lung Detected by Chest Ct. Lung Cancer (2007) 55(1):67–73. doi: 10.1016/j.lungcan.2006.09.009
47. Lee SM, Park CM, Goo JM, Lee CH, Lee HJ, Kim KG, et al. Transient Part-Solid Nodules Detected at Screening Thin-Section Ct for Lung Cancer: Comparison With Persistent Part-Solid Nodules. Radiology (2010) 255(1):242–51. doi: 10.1148/radiol.09090547
48. Felix L, Serra-Tosio G, Lantuejoul S, Timsit JF, Moro-Sibilot D, Brambilla C, et al. Ct Characteristics of Resolving Ground-Glass Opacities in a Lung Cancer Screening Programme. Eur J Radiol (2011) 77(3):410–6. doi: 10.1016/j.ejrad.2009.09.008
Keywords: subsolid nodule, clinical features, CT features, interval growth, meta-analysis
Citation: Liang X, Liu M, Li M and Zhang L (2022) Clinical and CT Features of Subsolid Pulmonary Nodules With Interval Growth: A Systematic Review and Meta-Analysis. Front. Oncol. 12:929174. doi: 10.3389/fonc.2022.929174
Received: 26 April 2022; Accepted: 09 June 2022;
Published: 04 July 2022.
Edited by:
Marco Rengo, Sapienza University of Rome, ItalyReviewed by:
David Naidich, New York University, United StatesMark Hammer, Brigham and Women’s Hospital and Harvard Medical School, United States
Copyright © 2022 Liang, Liu, Li and Zhang. This is an open-access article distributed under the terms of the Creative Commons Attribution License (CC BY). The use, distribution or reproduction in other forums is permitted, provided the original author(s) and the copyright owner(s) are credited and that the original publication in this journal is cited, in accordance with accepted academic practice. No use, distribution or reproduction is permitted which does not comply with these terms.
*Correspondence: Li Zhang, emhhbmdsaV9jaWNhbXNAMTYzLmNvbQ==
†These authors have contributed equally to this work and share first authorship