 Mithlesh Kumar Temre
 Saveg Yadav
 Yugal Goel
 Shrish Kumar Pandey
 Ajay Kumar
 Sukh Mahendra Singh
- 1School of Biotechnology, Institute of Science, Banaras Hindu University, Varanasi, India
- 2Deparment of Zoology, Institute of Science, Banaras Hindu University, Varanasi, India
Neoplastic cells overexpress glucose transporters (GLUT), particularly GLUT1 and GLUT3, to support altered metabolism. Hence, novel strategies are being explored to effectively inhibit GLUTs for a daunting interference of glucose uptake. Glutor, a piperazine-2-one derivative, is a newly reported pan-GLUT inhibitor with a promising antineoplastic potential. However, several aspects of the underlying mechanisms remain obscure. To understand this better, tumor cells of thymic origin designated as Dalton’s lymphoma (DL) were treated with glutor and analyzed for survival and metabolism regulatory molecular events. Treatment of tumor cells with glutor caused a decrease in cell survival with augmented induction of apoptosis. It also caused a decrease in glucose uptake associated with altered expression of GLUT1 and GLUT3. HIF-1α, HK-2, LDH-A, and MCT1 also decreased with diminished lactate production and deregulated pH homeostasis. Moreover, glutor treatment modulated the expression of cell survival regulatory molecules p53, Hsp70, IL-2 receptor CD25, and C-myc along with mitochondrial membrane depolarization, increased intracellular ROS expression, and altered Bcl-2/BAX ratio. Glutor also enhanced the chemosensitivity of tumor cells to cisplatin, accompanied by decreased MDR1 expression. Adding fructose to the culture medium containing glutor reversed the latter’s inhibitory action on tumor cell survival. These results demonstrate that in addition to inhibited glucose uptake, modulated tumor growth regulatory molecular pathways are also implicated in the manifestation of the antineoplastic action of glutor. Thus, the novel findings of this study will have a long-lasting clinical significance in evaluating and optimizing the use of glutor in anticancer therapeutic strategies.
Introduction
Neoplastic cells display dependence on glycolysis for their massive bioenergetic and biosynthetic requirements (1–3). Consequently, cancer cells display upregulated expression of various high-affinity glucose transporters (GLUT) to facilitate glucose uptake for accelerated glycolysis. Neoplastic cells overexpress GLUT1, GLUT3, GLUT4, and GLUT12, which vary depending on their etiology (4, 5). As glucose transporters are one of the crucial rate-limiting checkpoints of the reprogrammed carbohydrate metabolism of neoplastic cells, targeting GLUTs, particularly GLUT1 and GLUT3, has emerged as a promising antineoplastic approach (6). Thus, several inhibiting endeavors are being envisaged to imperil glucose uptake in neoplastic cells (7, 8). One of such strategies comprises GLUT inhibitors, being extensively explored for their antineoplastic potential (9). Natural products like genistein (10), quercetin (11), caffeine (12), phloretin (13), resveratrol (14), curcumin (15), and small synthetic inhibitors like cytochalasin B (16), fasentin (17), WZB117 (18), thiazolidinedione (19), STF31 (20), BAY876 (21), DRB18 (22), silybin (23, 24), and naringenin (25, 26) have been explored for their GLUT-inhibiting potential. They are also in various stages of preclinical and clinical trials (27). However, most of these inhibitors are isoform-specific and manifest antineoplastic action at higher concentrations, which can be potentially harmful to GLUT-expressing normal cells. Therefore, there is a necessity for developing GLUT inhibitors, which are expected to possess the ability for Pan-GLUT inhibition and manifest antineoplastic action at lower concentrations.
Recent reports have introduced a pan-GLUT inhibitory molecule named glutor, a piperazine-2-one derivative (Supplementary Figure 1), with a broad spectrum of anticancer potential, which is capable of exerting the antineoplastic action at nanomolar concentrations and is stable in an aqueous environment (22, 28–31). Moreover, glutor can synergistically interfere with tumor metabolism with glutaminase inhibitor CB-839 (29). Several aspects of the molecular mechanisms underlying its antimetabolic action remain unclear, which need to be deciphered for optimal utilization. To the best of our knowledge, no study has been conducted in this direction. It is well established that glucose metabolism can influence the chemosensitivity of neoplastic cells. However, it remains unclear if glutor can alter the tumoricidal action of chemotherapeutic agents. Furthermore, there is no report concerning the antineoplastic activity of glutor on neoplastic cells of thymic origin, which, though fatal, are rare in occurrence (32), and display elevated GLUT expression (33).
Considering the observations mentioned above, we used cells of a thymoma-derived tumor, designated as Dalton’s lymphoma (DL), which is a spontaneously originated tumor of thymic origin (34) that has been widely used as an in vivo tumor model for testing the therapeutic efficacy of anticancer agents (35, 36) and host–tumor relationship (35, 37). The present study reports that glutor displays a potent antineoplastic action against DL cells in vitro by modulating glucose metabolism, pH homeostasis, cell survival, and metabolic machinery.
Materials and Methods
Tumor, Mice, and Reagents
DL was used as a tumor model for understanding the effect of glutor. DL was discovered by Dr. A.J. Dalton (NCI, Bethesda, USA) as a thymoma of DBA mice with spontaneous origin (34). The DL cells were procured from the Department of Zoology, Banaras Hindu University. The DL’s ascitic growth was established by Goldie and Felix (38). Mice handling and experimental procedures were carried out according to the Institutional Animal Ethical Committee (Approval No. BHU/DoZ/IAEC/2021-2022/016). All reagents, unless mentioned otherwise, were purchased from Sigma-Aldrich, USA. Fetal calf serum was purchased from the Hyclone USA and Annexin V/PI apoptosis detection kit from Invitrogen, USA. RPMI-1640 medium (Cat. No. 31800-022) was purchased from Thermofisher Scientific, with a final glucose concentration of 11.11 mM. Primary antibodies against GLUT1 (E-AB-31556), GLUT3 (E-AB-31557), HK-2 (E-AB-14706), and LDH-A (E-AB-19937) were purchased from Elabscience USA; HIF1-α (SC-31515), C-myc (SC-40), p53 (SC-126), β-actin (SC-47778), BAX(CST 2772S), Hsp70 (CST 4872S), and MDR1/ABCB1 (CST 13978) were purchased from Cell Signaling Technology (CST) USA; VEGF (IMG-80214), TGF-β (IMG-6667-E-100), Bcl-2 (IMG-3181), and MCT1 (IMG-4021) were purchased from Imagenex, USA; PE-CD25 (55386) was purchased from BD Biosciences, USA. Secondary antibodies anti-rabbit IgG (A9919) and anti-mouse IgG (A3562) were purchased from Sigma-Aldrich, USA. RT-PCR primers were purchased from Ambion International AG, Germany, Integrated DNA Technologies, USA, and Eurofins, USA.
Trypan Blue Dye Exclusion Test to Determine Cell Viability
The number of viable DL cells was enumerated by Trypan blue dye exclusion test following a method described earlier (35). The cell suspension was mixed with 0.4% (w/v) Trypan blue in PBS in equal volumes, and the viable cells (unstained cells) were enumerated using a hemocytometer under a light microscope (Leitz Wetzlar, Germany).
Examination of Apoptotic Cell Population
Wright–Giemsa and Annexin V/PI staining was used to identify the apoptotic cell population. Annexin V/PI staining was carried out following the manufacturer’s instructions (Imagenex USA). Control and glutor-treated DL cells (1 × 10⁶) were washed and incubated in a working solution of 1× annexin binding buffer, followed by the addition of 10 µl of annexin conjugate and 1 µl of PI working solution (100 µg/ml) and incubation for 15 min at room temperature in the dark. The cells were then washed by centrifugation with 1× annexin binding buffer. The stained cells were mounted on a slide and observed under a fluorescence microscope. Live cells were determined to be those with weak green fluorescence, whereas the deep green high fluorescence cells were marked as apoptotic cells. Apoptotic cells were also confirmed by simultaneous examination of apoptotic morphology under phase contrast optics. To examine apoptotic cells by Wright–Giemsa staining, the cell suspension was smeared on a slide and air-dried. The cells were then fixed in methanol and stained with Wright–Giemsa staining solution. After mounting in glycerine, apoptotic cells were examined under a light microscope (Leitz Wetzlar, Germany). The apoptotic cells were identified based on the typical morphological features, including contracted cell bodies; densely stained, condensed, and uniformly circumscribed chromatin; and the presence of one or more membrane-bound apoptotic bodies containing nuclear fragments. The percentage of apoptotic cells was determined by counting more than 100 cells in at least three separate visions.
MTT Assay for Estimation of Cell Survival
The MTT assay was performed to assess cell survival as an indicator of cellular metabolic activity, proliferation, and cytotoxicity following the method described by Mosmann (39). MTT was dissolved in PBS, and 50 µl of this solution (final concentration, 0.5 mg/ml) was added to the tissue culture plate wells containing the final concentration of 0.5 mg/ml. Cultures were incubated for 4 h at 37°C in a CO2 incubator to allow the formation of formazan crystals. The formazan crystals were solubilized using DMSO, and absorbance was measured at 540 nm using an ELISA plate reader (Labsystems, Finland).
Reverse Transcriptase-Polymerase Chain Reaction
The expression of GLUT1 and GLUT3 genes were examined using a previously described method (35). cDNA was prepared using a cell to cDNA kit (Ambion, USA). The primers’ description is mentioned in Table 1. Thirty-five cycles of amplification were performed. Each cycle consisted of denaturation (2 min at 94°C), annealing (55–60°C) as per the genes’ primers, and elongation (30 s at 72°C). The DNA was electrophoresed on an agarose gel (2%) containing ethidium bromide (0.25% w/v) and was visualized on a UV-transilluminator. The band intensity of each gene was analyzed by ImageJ software.
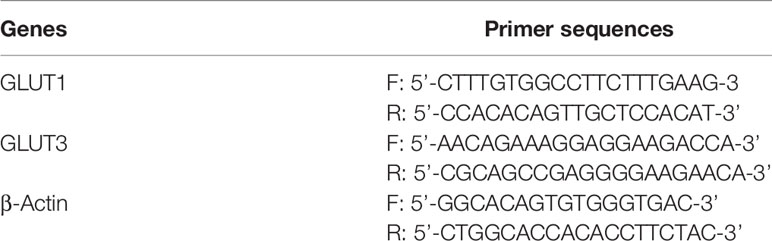
Table 1 Primer sequences for RT-PCR analysis.
Western Blotting
Western blotting was carried out to detect the indicated proteins following the method described by Fido et al. (40) and Goel et al. (41) with slight modifications. Cells were lysed in lysis buffer [Tris-Cl 20 mM (pH 8.0), NaCl (137 mM), glycerol 10% (v/v), Triton X-100 1% (v/v), EDTA 2.0 mM, PMSF 1.0 mM, Leupeptin 20 mM, and aprotinin 0.15 U/ml] for 30 min on ice. Protein content was measured using the Bradford method (42). Samples for electrophoresis were mixed in loading buffer [Tris-Cl 0.5 M (pH 6.8), β-mercaptoethanol 100 mM, SDS 20% (w/v), bromophenol blue 0.1% (v/v), and glycerol 10% (v/v)] and were heated for 3 min in a water bath. A sample containing 30 µg of protein was subjected to electrophoresis by SDS-PAGE. Proteins were transferred to the nitrocellulose membrane (Sartorius, Germany) at 60 mA for 1 h. The membrane was then incubated with primary antibodies against the respective proteins and secondary antibodies conjugated to alkaline phosphatase. Bands were visualized using BCIP/NBT. The band density was examined by ImageJ software.
Estimation of Intracellular Reactive Oxygen Species
A method described by Furuta et al. (43) was used to estimate ROS expression with slight modifications. Cells (1 × 10⁵ cells/ml) were incubated with HBSS containing 0.1 mM dichlorodihydrofluorescein diacetate (DCFDA) at 37°C for 45 min. After washing with PBS, the stained cells were visualized under fluorescence optics (Nikon, Japan). The fluorescence intensity was analyzed by ImageJ software.
Quantification of Glucose
A commercial kit from Agappe Diagnostics Ltd. (Kerala, India) based on converting glucose to H2O2 by the action of glucose oxidase was used to measure glucose content in the culture supernatant. The generated H2O2 was estimated by converting it into a red quinine product by peroxidase action. Ten milliliters of the culture supernatant was added to 1 ml of working reagent [sodium phosphate buffer (pH 7.4), phenol, glucose-oxidase, peroxidase, and 4-amino antipyrine], followed by mixing and incubation at 37°C for 10 min. Absorbance was measured at 505 nm, and the glucose content was expressed in mM.
Estimation of Lactate
Lactate concentration in the culture supernatant was measured using an enzymatic colorimetric kit (Spinreact, Granada, Spain) based on a method described by Somoza et al. (44). Briefly, 1 ml of sample was diluted in 200 ml of PIPES (50 mM; pH 7.5) containing 4-chlorophenol (4 mM), lactate oxidase (800 U/L), peroxidase (2,000 U/L), and 4-aminophenazone (0.4 mM), followed by incubation for 10 min at room temperature, and measurement of absorbance at 505 nm. Lactate concentration was expressed in mg/dl.
Immunofluorescent Staining of Cell Surface Molecules
Cell surface expression of GLUT1, GLUT3, and CD25 was carried out using immunofluorescence staining following a previously described method (45). After washing with PBS, the stained cells were fixed in a mixture of acetic acid and ethanol (5:95) for 10 min at −10°C. Fluorescence was visualized on a fluorescence microscope (Nikon Instruments Inc.).
Estimation of Mitochondrial Membrane Potential by TMRE Staining
Mitochondrial membrane potential was determined following a method described by Crowley et al. by tetramethylrhodamine ethyl ester (TMRE) perchlorate staining (46). Control and glutor-treated DL cells were incubated for 20 min in a medium containing TMRE (100 nM) at 37°C. Fluorescence was detected using a fluorescence microscope (Nikon Instruments Inc.). Data are presented as the percent of TMRE high cells.
Statistical Analysis
All experiments were conducted in triplicates. The Student’s t-test analyzed the statistical significance of differences between test groups. The difference was considered significant when the p-value was less than 0.05.
Results
Effect of Glutor Treatment on the Survival of DL Cells
DL cells (1 × 10⁵) and thymocytes obtained from healthy mice were examined for expression of GLUT1 and GLUT3 by Western blotting as described in the Materials and Methods section. Results are shown in Figure 1A. DL cells displayed an upregulated expression of GLUT1 and GLUT3 compared to thymocytes. Therefore, in the subsequent experiments, the effect of glutor on the survival of DL cells was explored. DL cells (1 × 10⁵) were incubated for 24 h in a medium alone or containing the indicated concentrations of glutor, followed by evaluation of cell viability by Trypan blue dye exclusion test (Figure 1B) and survival by MTT assay (Figure 1C). In another set of experiments, the DL cells (1 × 10⁵) were incubated in a medium alone or containing glutor (0.01 µM) for the indicated time durations, followed by an evaluation of cell viability (Figure 1D) and survival (Figure 1E). As shown in the results (Figures 1B–E), exposure of DL cells to glutor in vitro caused a significant decrease in viable cell count and survival in a dose- and time-dependent manner compared to untreated control. The IC50 was determined to be 0.01 µM. Hence, in all subsequent experiments, DL cells were treated with 0.01 µM dose of glutor for 24 h, unless mentioned otherwise, a period determined to display optimal cytotoxic action of glutor for deciphering the molecular mechanisms underlying the antitumor action of glutor. Thymocytes (1 × 10⁵) obtained from healthy mice without tumor transplantation were also incubated with various concentrations of glutor to estimate its effect on cell survival. Results indicated that glutor did not exert any cytotoxic action on thymocytes (data not shown). Given these observations that glutor can exert a tumor cell-specific cytotoxic action, the mode of observed cytostatic action of glutor was determined in the next set of experiments. DL cells (1 × 10⁵) were incubated in a medium with or without glutor (0.01 µM) for 24 h, followed by an examination of the mode of cell death by Wright–Giemsa (Figures 1F, G) and Annexin V/PI (Figures 1H, I) staining. The cells displaying features of apoptotic morphology were enumerated. The results revealed that treatment of DL cells with glutor significantly increased the number of cells exhibiting typical characteristics of apoptotic morphology compared to untreated control.
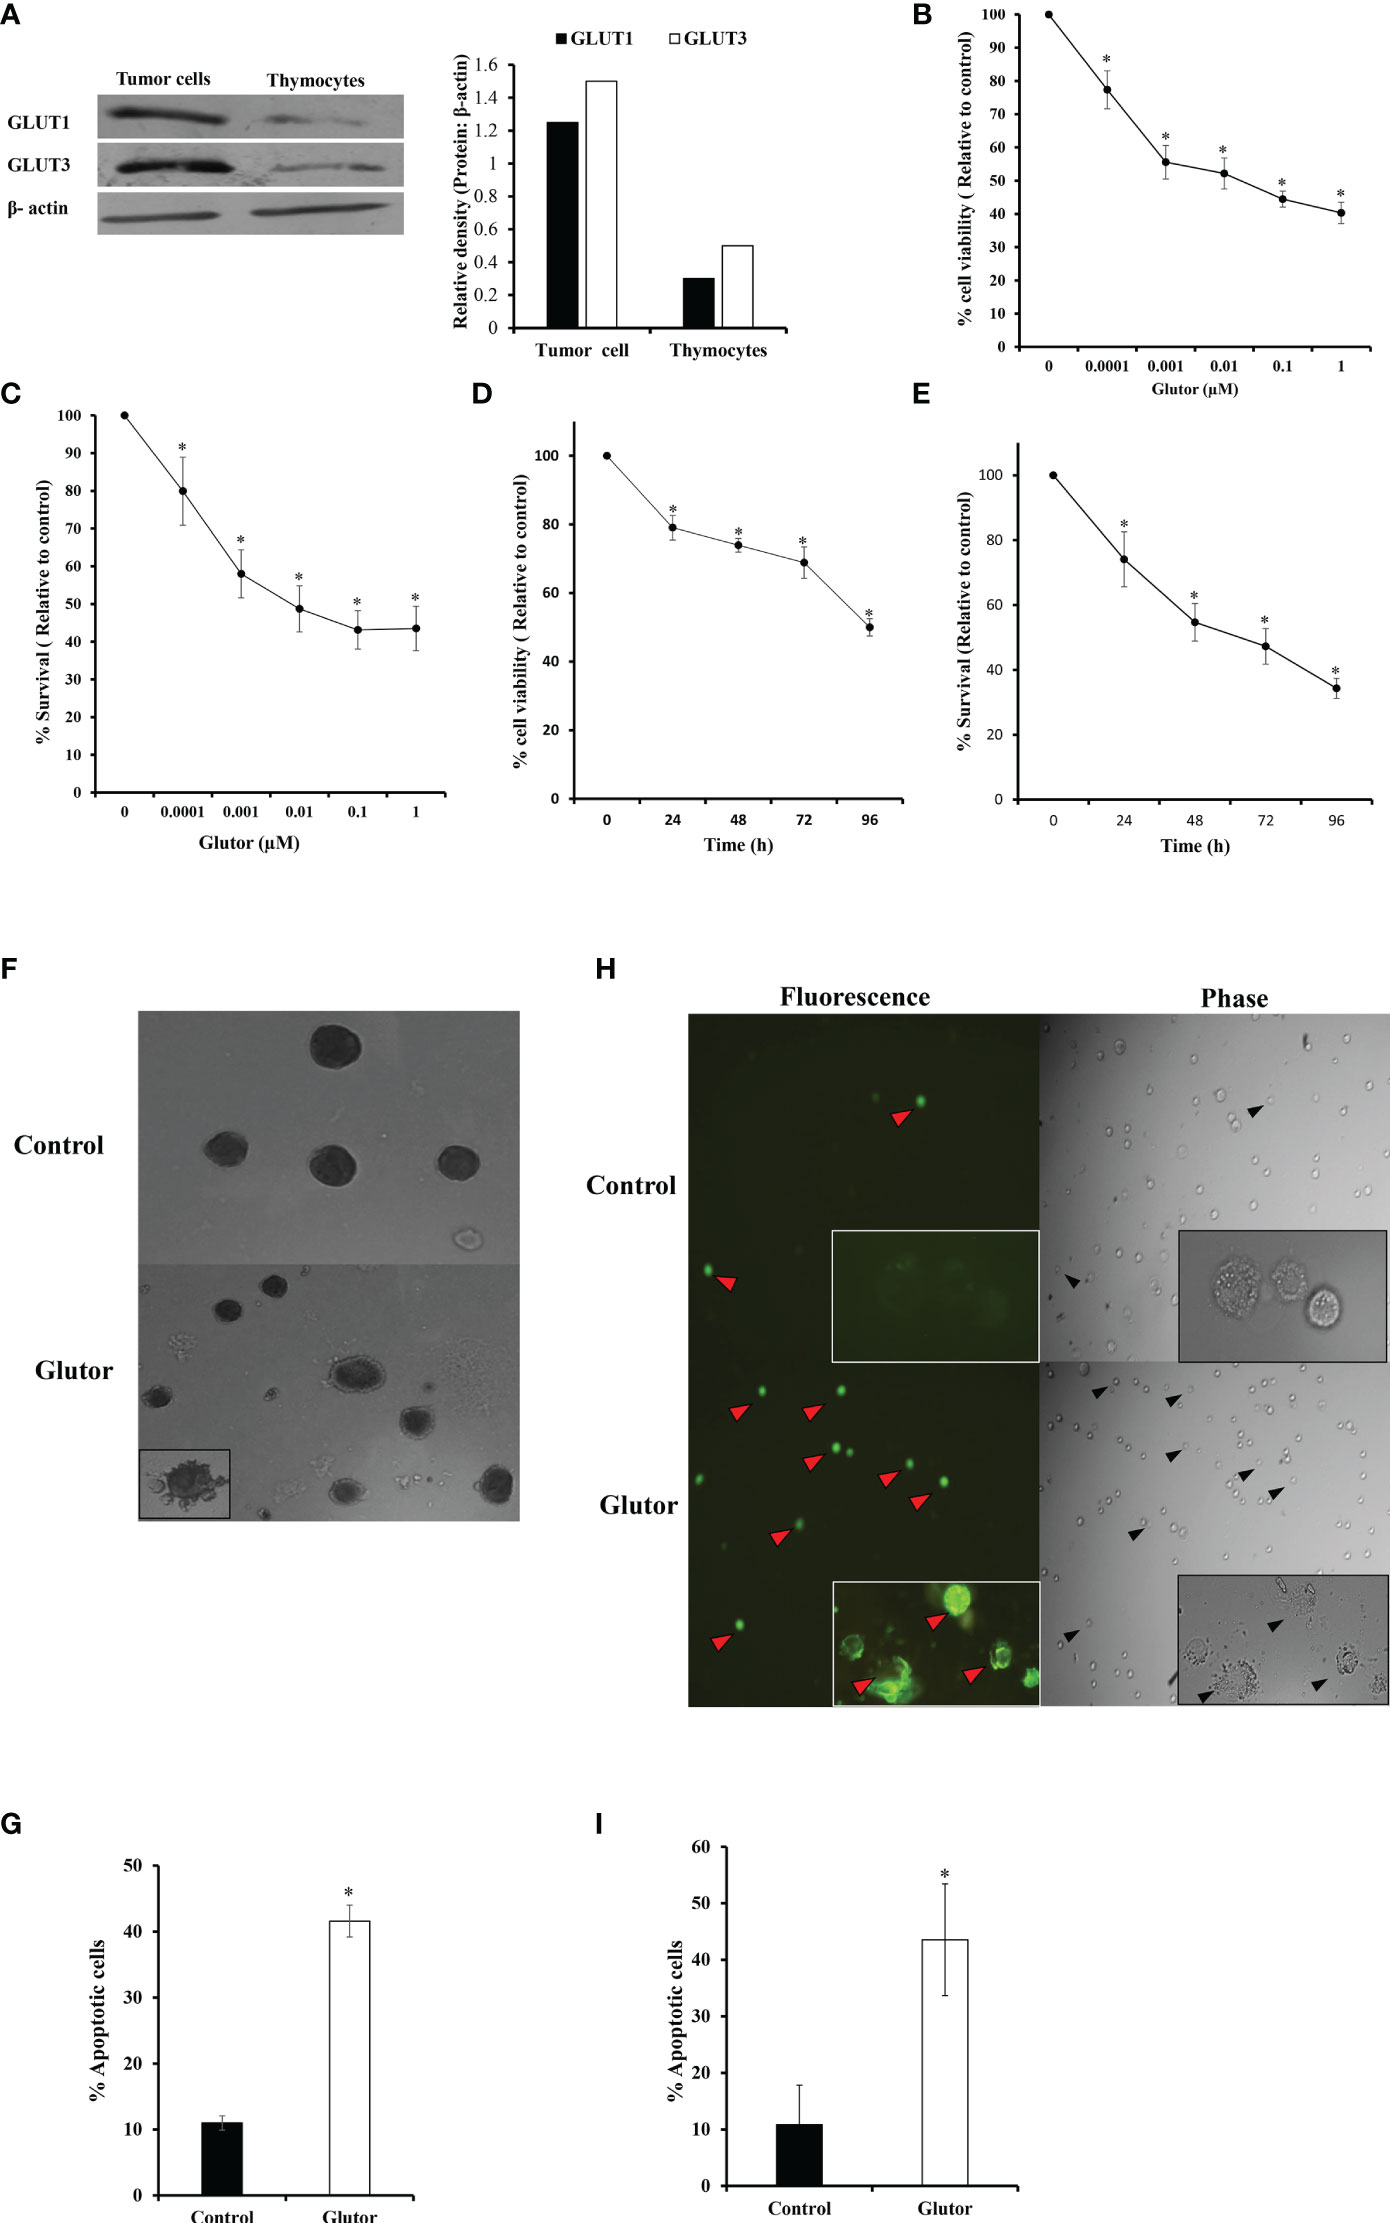
Figure 1 Glutor exerts cytotoxic action on DL cells. DL cells or thymocytes (1 × 10⁵) harvested from the thymi of healthy mice without tumor transplantation were processed for immunoblotting for GLUT1 and GLUT3 as described in the Materials and Methods section (A). DL cells (1 × 10⁵) were incubated in a medium alone or containing the indicated concentrations of glutor for 24 h (B, C) or with 0.01 µM of glutor for the various indicated time durations (D, E), followed by estimation of cell viability by Trypan blue dye exclusion assay and cell survival by MTT assay as described in the Materials and Methods section. DL cells incubated in a medium alone or containing glutor (0.01 µM) for 24 h were examined for the mode of cell death by Annexin V/PI (H, I) and Wright–Giemsa (F, G) staining. Values shown in (B–E) and (G, I) are mean ± SD. The plates shown in (A), (F), and (H) are from a representative experiment out of at least two experiments with similar results. The bar diagram accompanying (A) is the densitometry of respective bands. *p < 0.05 vs. values of the respective control.
Glutor Alters GLUT Expression in DL Cells, Accompanied by Decreased Glucose Uptake
To understand if the tumoricidal action of glutor was accompanied by alterations in GLUT expression and glucose uptake, DL cells (1 × 10⁵) were incubated in a medium alone or containing glutor (0.01 µM) for 24 h followed by estimation of glucose level in culture supernatant and examination of GLUT1 and GLUT3 expression by RT-PCR, Western blot, and immunofluorescence microscopy as described in the Materials and Methods section. Results are shown in Figure 2. DL cells incubated with glutor displayed a decrease in the expression of GLUT1 and GLUT3 at the mRNA (Figure 2A) and protein levels (Figures 2B–D) compared to the untreated control. The glucose uptake of DL cells showed a significant decrease in the glutor-treated DL cells compared to the untreated control (Figure 2E). The culture medium containing glutor was supplemented with indicated amounts of glucose or fructose to understand if the anti-survival action of glutor could be reversed. Results are shown in Figure 3. The addition of glucose to the culture medium did not rescue the inhibition of DL cell survival by glutor, which was partially reversed by adding fructose.
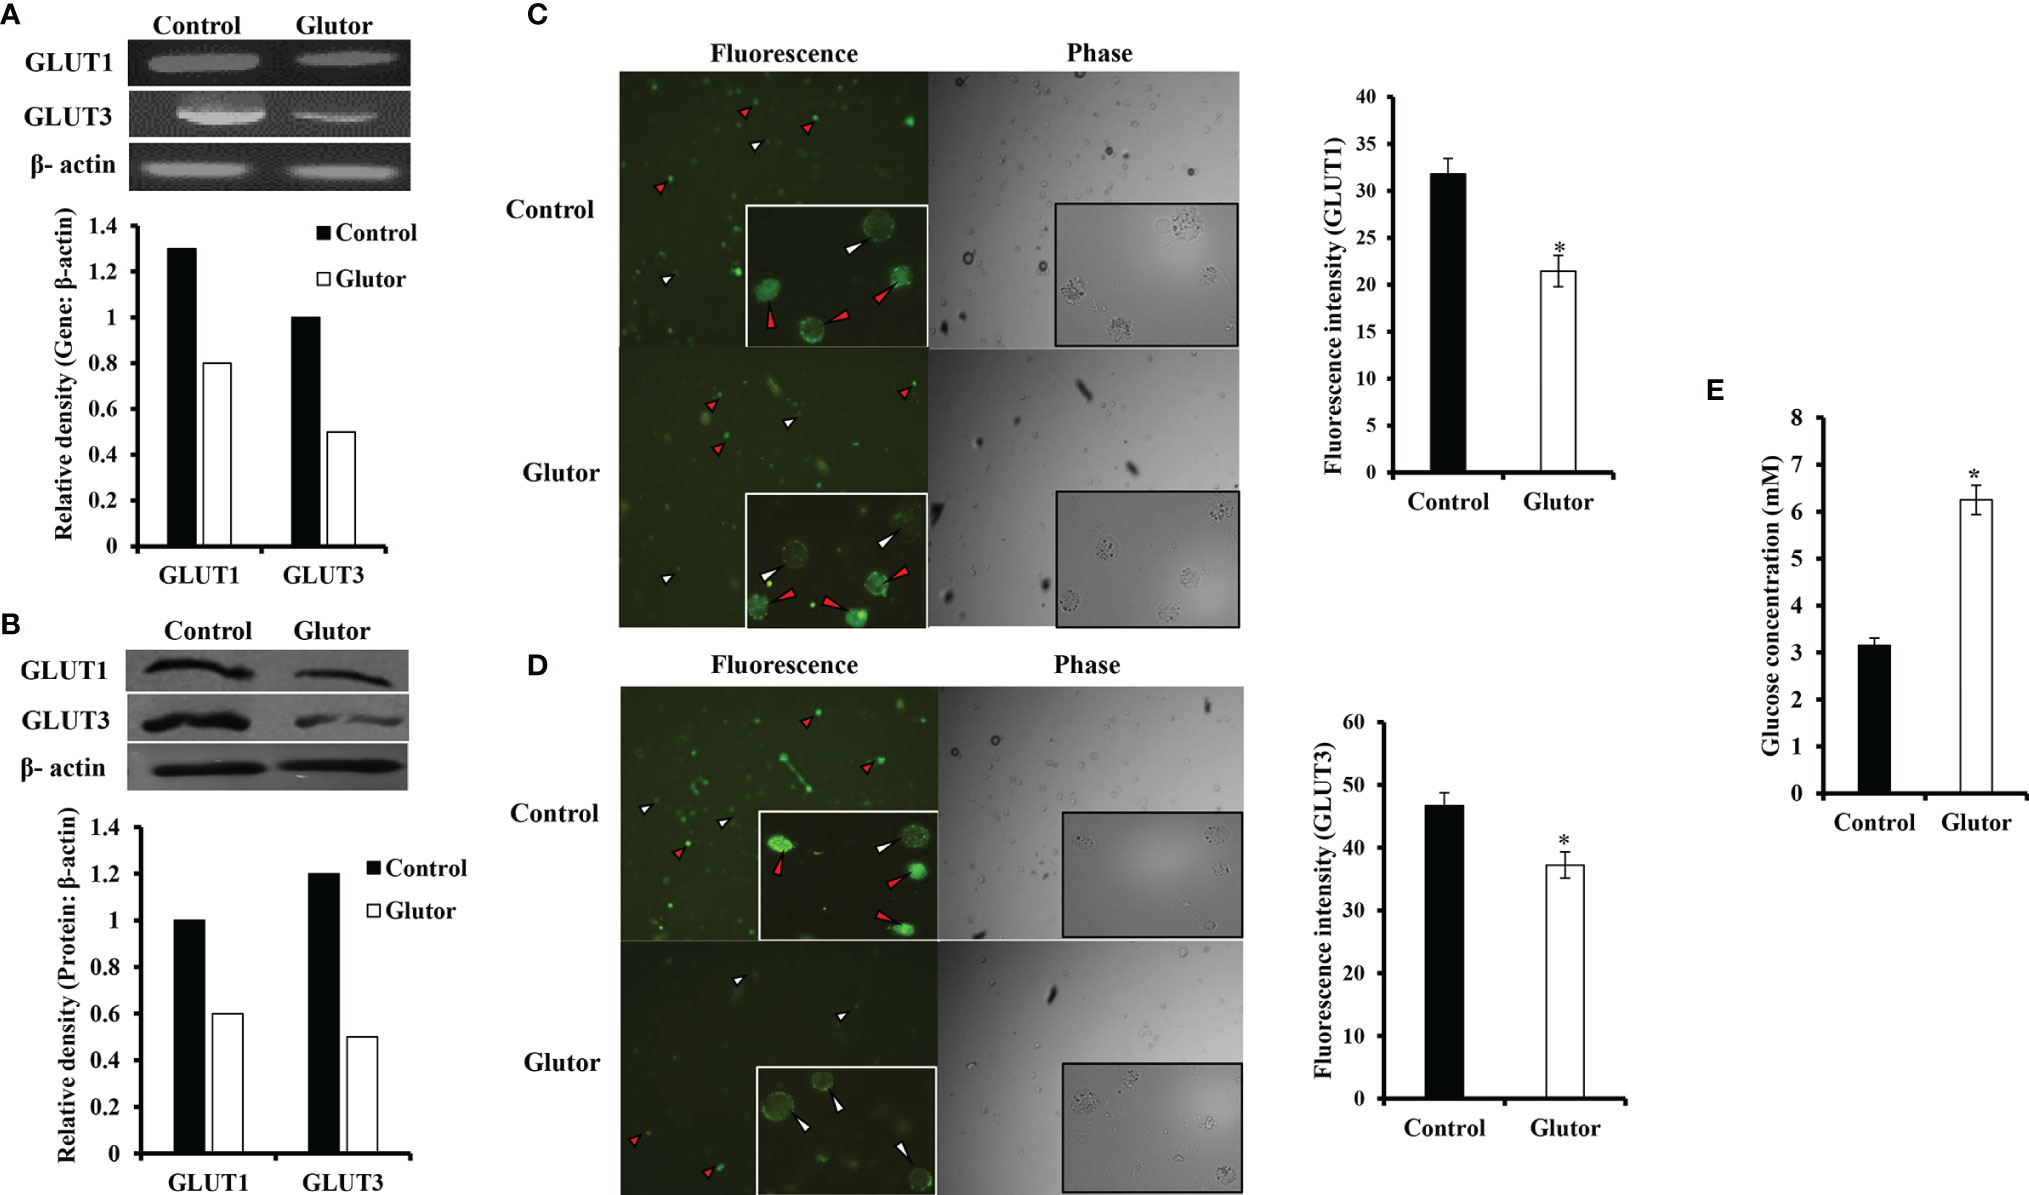
Figure 2 Effect of glutor on the expression of GLUT1, GLUT3, and glucose uptake by DL cells. DL cells (1 × 10⁵) were incubated in a medium alone or containing glutor (0.01 µM) for 24 h, followed by evaluation of GLUT1 and GLUT3 expression by RT-PCR (A) and Western blotting (B) as described in the Materials and Methods section. The expression of GLUT 1 and GLUT 3 was also examined by immunofluorescence (C, D). The glucose level in the culture supernatant of control and glutor-treated DL cells was measured (E) as described in the Materials and Methods section. Values shown in (E) are mean ± SD. The plates shown in (A–D) are from a representative experiment out of at least two experiments with similar results. Accompanying bar diagrams are densitometric images of the respective bands. Bar diagrams accompanying the fluorescence images depict fluorescence intensity. *p < 0.05 vs. respective control.
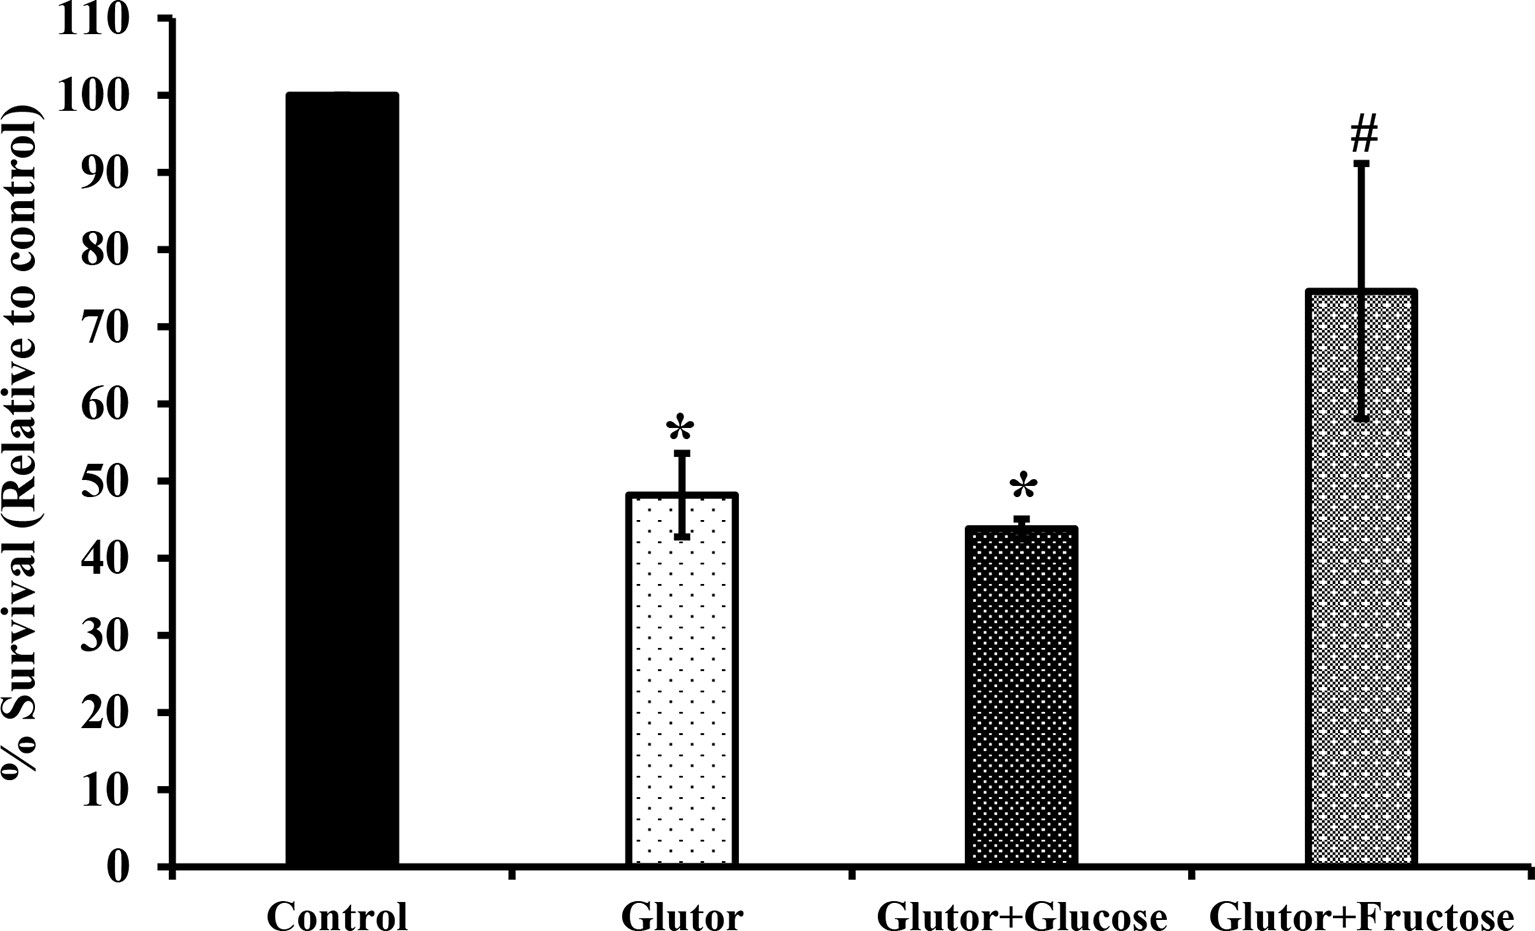
Figure 3 Fructose antagonizes the inhibitory action of glutor on tumor cell survival .DL cells (1 × 10⁵) were incubated in a medium alone or containing glutor in the presence or absence of glucose (1 mM) or fructose (1 mM) for 24 h, followed by an estimation of survival by MTT assay as described in the Materials and Methods section. Values are mean ± SD. *p < 0.05 vs. DL cells incubated in a medium alone. #p < 0.05 vs. DL cells incubated in a medium containing glutor or glutor plus glucose.
Glutor-Induced Tumoricidal Action Is Associated With Modulated Expression of Cell Survival and Metabolism Regulatory Molecules
In the next set of experiments, DL cells (1 × 10⁵) were incubated for 24 h in a medium alone or containing glutor (0.01 µM), followed by an examination of the expression pattern of indicated metabolism (Figure 4A) and cell survival regulatory molecules (Figure 4B) to understand the molecular mechanism(s) of the antineoplastic action of glutor. Treatment of DL cells with glutor inhibited the expression of hypoxia-inducible factor 1-α (HIF-1α), hexokinase 2 (HK-2), and lactate dehydrogenase A (LDH-A) compared to untreated control (Figure 4A). Furthermore, glutor treatment of DL cells also modulated the expression of cell survival regulatory molecules B-cell lymphoma 2 (Bcl-2), Bcl-2-associated X (BAX), and p53 (Figure 4B). The expression of Bcl-2, transforming growth factor-β (TGF-β), C-myc, and heat shock protein 70 (Hsp70) was decreased in DL cells treated with glutor, whereas the expression of BAX and p53 increased compared to the untreated control (Figure 4B). An immunofluorescence examination was carried out to investigate the effect of glutor on the expression of CD25. Glutor treatment of DL cells inhibited the expression of CD25 compared to the control (Figure 4C).
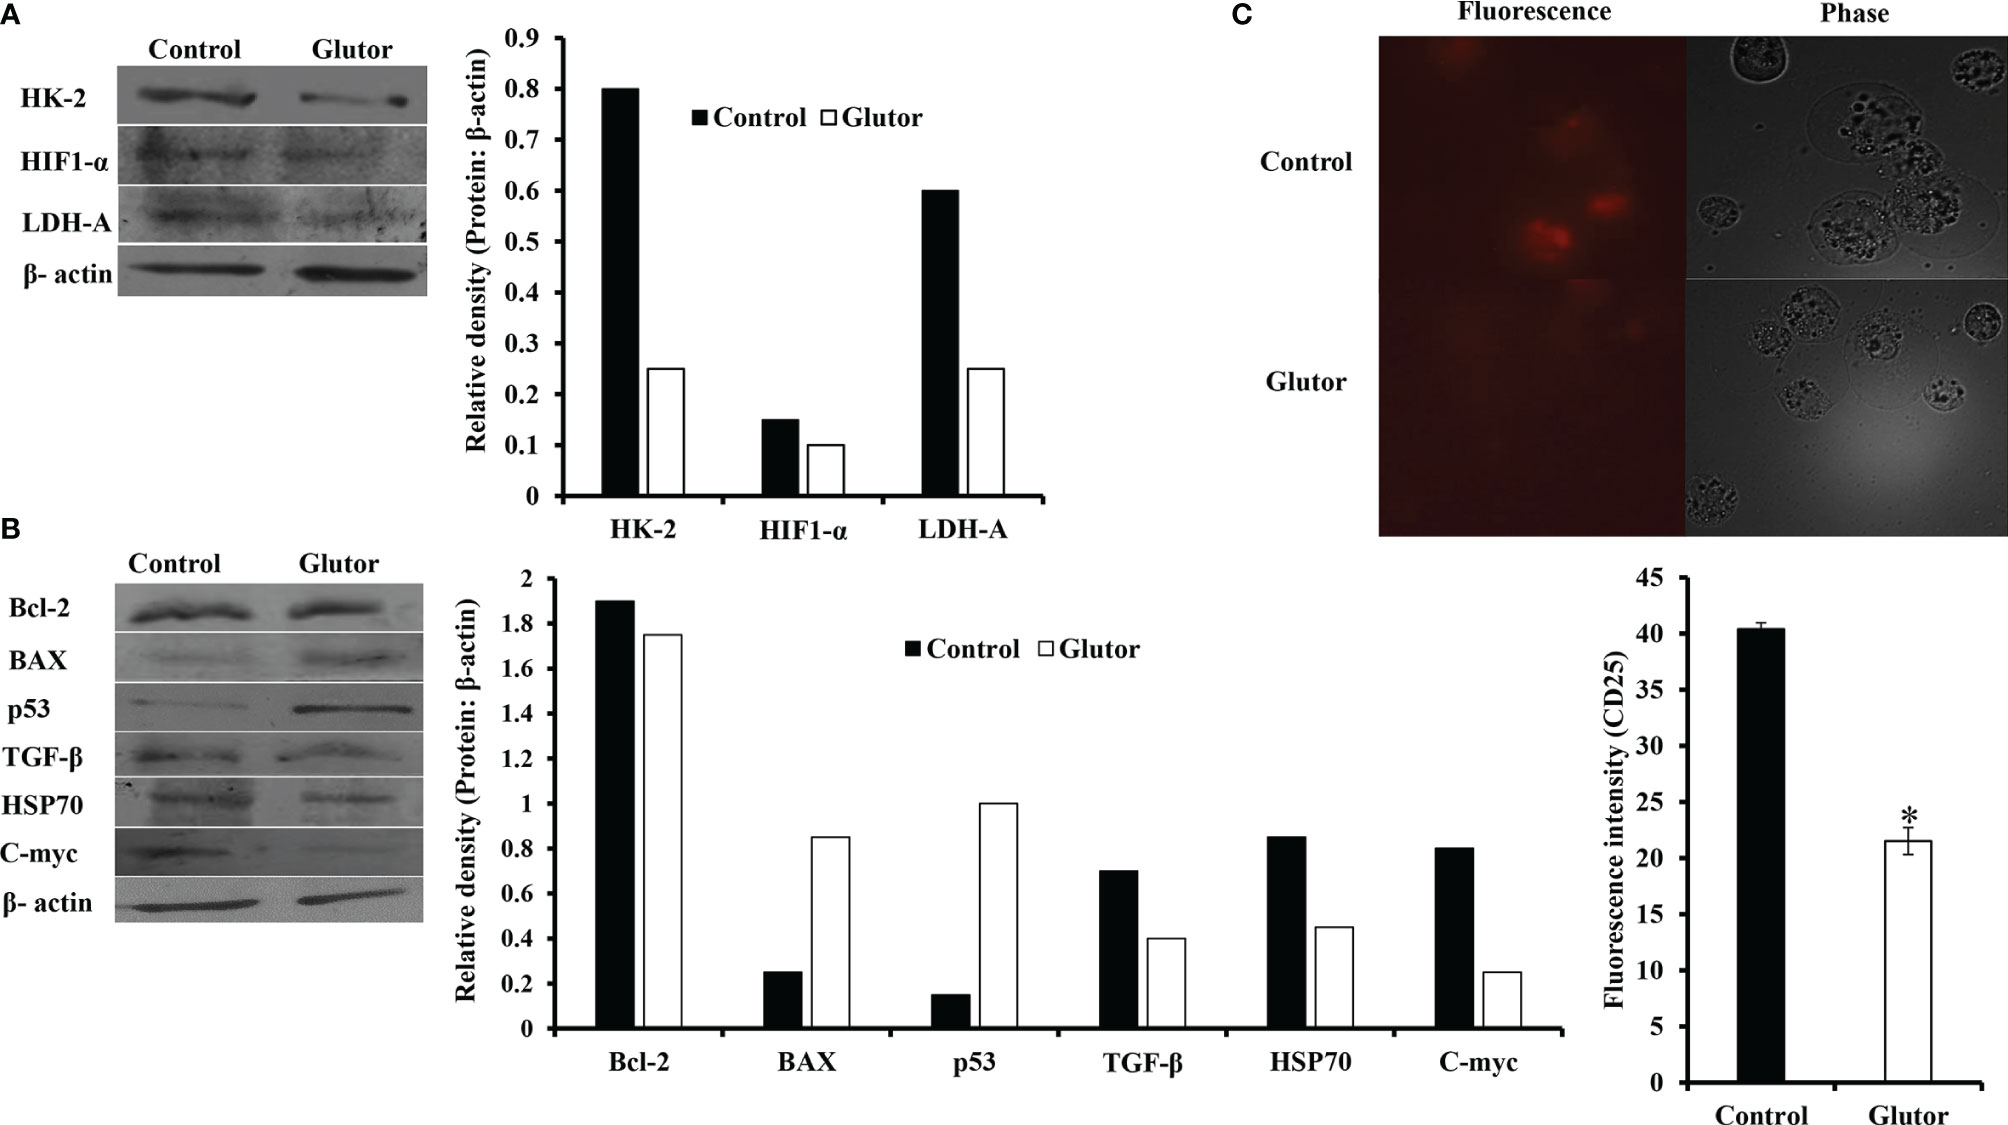
Figure 4 Glutor modulates expression of metabolism and cell survival regulatory molecules in DL cells. DL cells (1 × 10⁵) were incubated in a medium alone or containing glutor (0.01 µM) for 24 h, followed by Western blotting to study the expression of the indicated metabolism (A), cell survival (B) regulatory molecules and CD25 (C) as described in the Materials and Methods section. The plates shown in (A–C) are from a representative experiment out of at least two experiments with similar results. The accompanying bar diagrams are densitometry of the respective bands.
Glutor Treatment Alters the Expression of Intracellular Reactive Oxygen Species in DL Cells
Next, we checked the expression of intracellular ROS in glutor-treated DL cells. DL cells (1 × 10⁵) were incubated in a medium alone or containing glutor (0.01 µM) for 2 h, followed by an estimation of ROS expression by dichlorodihydrofluorescein diacetate (DCFDA) staining as described in the Materials and Methods section. Results are shown in Figure 5. Glutor treatment of DL cells resulted in a significantly higher ROS expression than the untreated control.
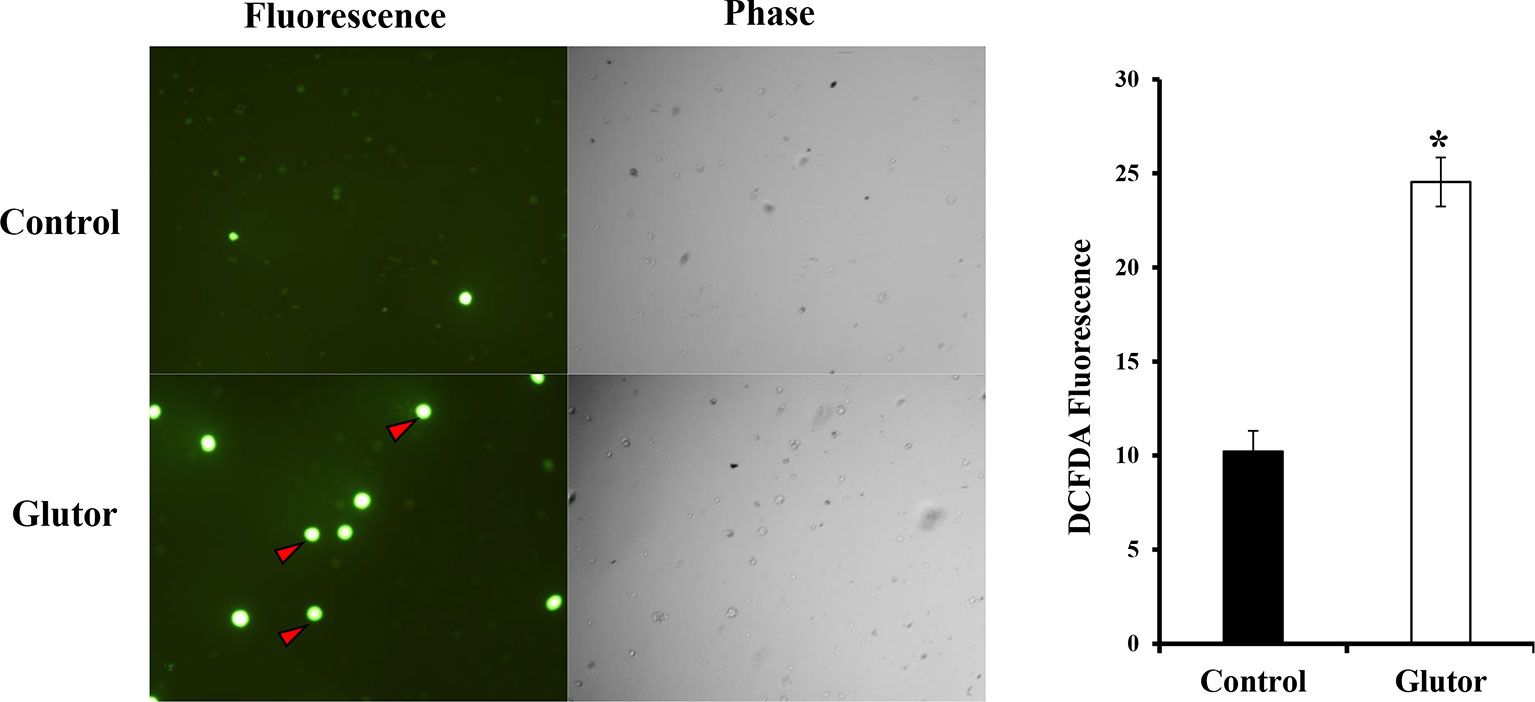
Figure 5 Glutor treatment elevates intracellular ROS expression in DL cells. DL cells (1 × 10⁵) were incubated for 2 h in a medium with or without glutor (0.01 µM), followed by staining with DCFDA and examination of the cells in fluorescence optics as described in the Materials and Methods section. The plates shown are from a representative experiment out of at least two experiments with similar results. The accompanying bar diagram depicts the fluorescence intensity of control and glutor-treated cells. Values are mean ± SD. *p < 0.05 vs. control.
Effect of Glutor on Mitochondrial Membrane Depolarization
We also examined the effect of glutor treatment of DL cells on mitochondrial membrane potential. DL cells (1 × 10⁵) were incubated for 24 h in a medium alone or containing glutor (0.01 µM), followed by TMRE staining and observation of the stained cells under fluorescence optics. As shown in Figure 6, glutor treatment was found to trigger depolarization of the mitochondrial membrane as observed by inhibited fluorescence of TMRE compared to untreated control.

Figure 6 Glutor alters mitochondrial membrane potential. DL cells (1 × 10⁵) were incubated in a medium alone or containing glutor (0.01 µM) for 24 h, followed by TMRE staining as described in the Materials and Methods section. The plates shown are from a representative experiment out of at least two experiments with similar results. Values shown in the accompanying diagram are the mean ± SD of the fluorescence intensity. *p < 0.05 vs. control.
Glutor Interferes With pH Homeostasis of DL Cells
Considering that glucose metabolism influences the pH homeostasis of tumor cells, we investigated the impact of glutor treatment on the expression of pH regulator monocarboxylate transporter 1 (MCT1) along with the estimation of pH and lactate of the culture medium. Glutor (0.01 µM) treatment of DL cells inhibited the expression of MCT1 compared to untreated control (Figure 7A). The pH (Figure 7B) of the culture supernatant of glutor-treated DL cells was found to be remarkably increased whereas the level of lactate was significantly decreased (Figure 7C) compared to the respective untreated control.
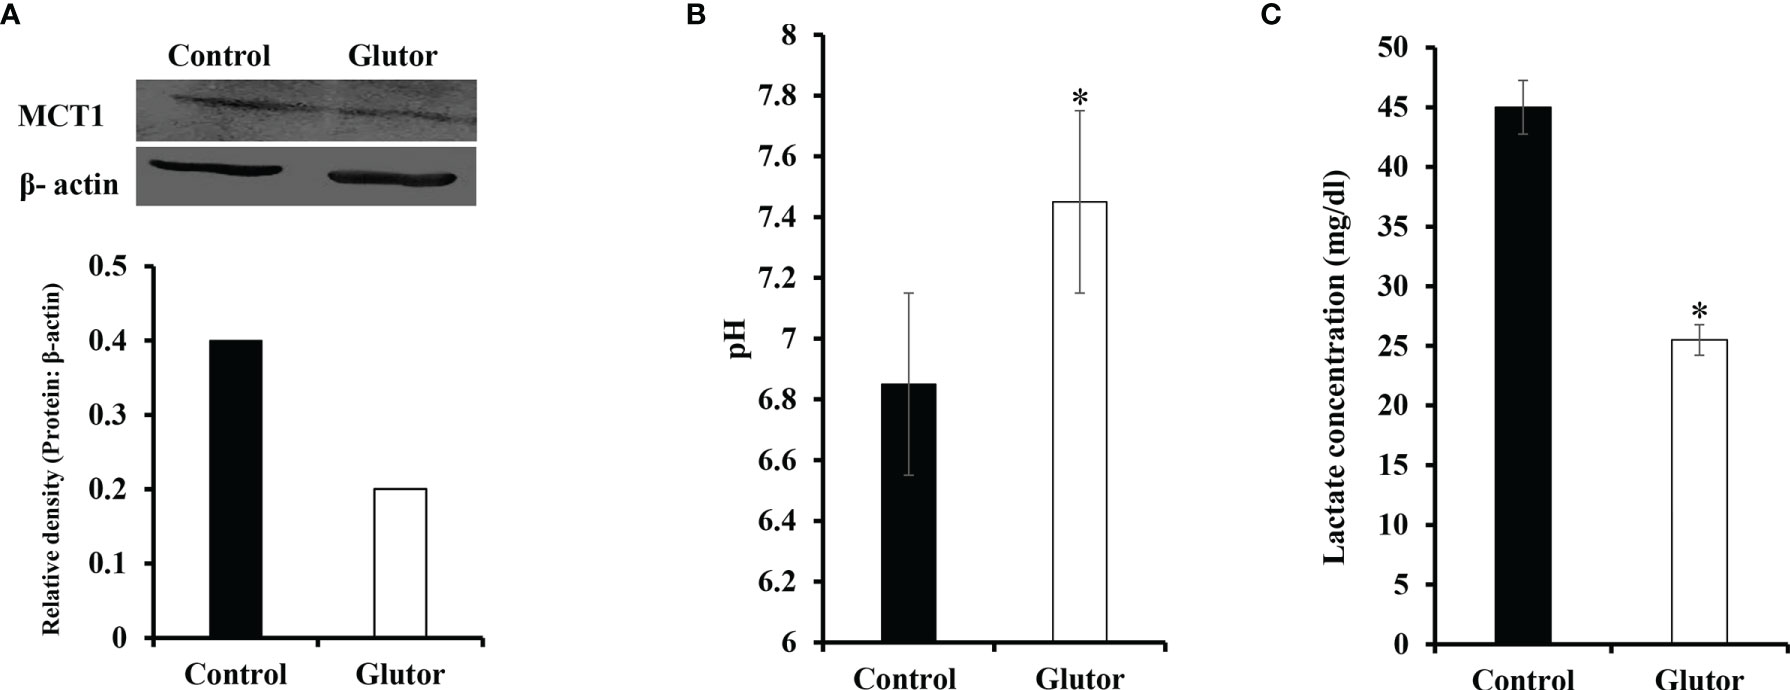
Figure 7 Glutor interferes with pH homeostasis of DL cells. DL cells (1 × 10⁵) were incubated for 24 h in a medium alone or containing glutor (0.01 µM), followed by an examination of MCT1 expression by Western blotting as described in the Materials and Methods section. The culture media of control and glutor-treated DL cells were also examined for pH and lactate levels. The plates shown in (A) are from a representative experiment out of at least two experiments with similar results. The accompanying bar diagram depicts the densitometry of the bands. Values in (B) and (C) are mean ± SD. *p < 0.05 vs. respective control.
Glutor Alters Chemosensitivity of DL Cells
As reprogrammed glucose metabolism of tumor cells is implicated in the modulation of the chemosensitivity of tumor cells, next, we examined the effect of glutor treatment on the susceptibility of DL cells to the anticancer drug cisplatin. DL cells (1 × 10⁵) were incubated in a medium alone or containing glutor (0.01 µM) in the absence or presence of cisplatin for 24 h, followed by an examination of cell survival by MTT assay and expression of multidrug resistance protein 1 (MDR1) by Western blotting as described in the Materials and Methods section. The treatment of DL cells with glutor plus cisplatin resulted in a significantly higher inhibition of cell survival than the DL cells incubated in a medium alone or containing cisplatin or glutor (Figure 8A). The expression of MDR1 decreased in DL cells treated with glutor compared to the untreated control (Figure 8B).
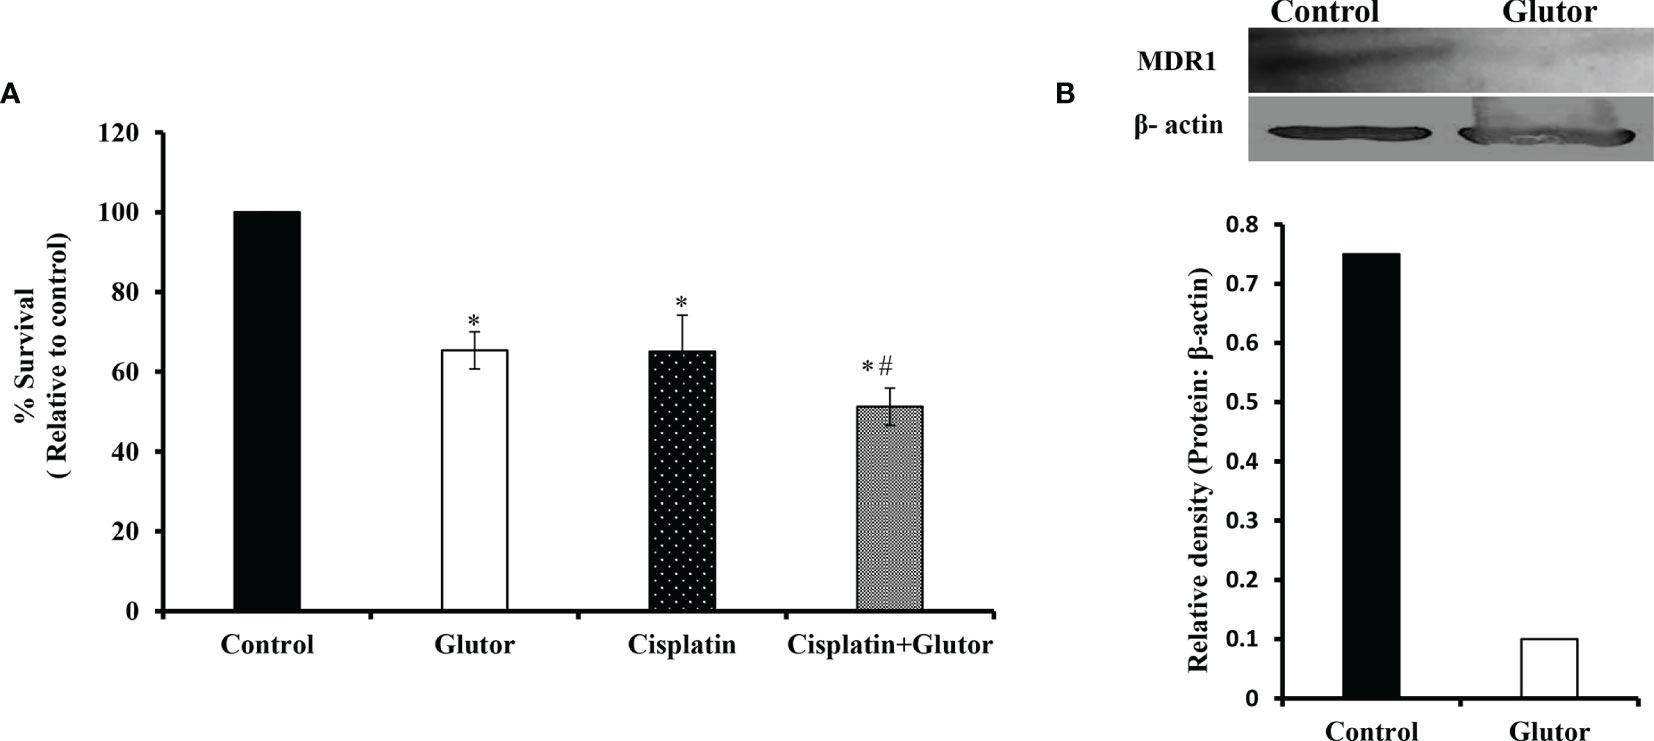
Figure 8 Chemosensitizing action of glutor DL cells (1 × 10⁵) were incubated in a medium alone or containing glutor (0.01 µM) for 24 h in the presence or absence of cisplatin, followed by estimation of cell survival (A) by MTT assay as described in the Materials and Methods section. Control and glutor-treated DL cells were also evaluated for MDR1 expression (B) by Western blotting. Values in (A) are the mean ± SD. The plates shown in (B) are from a representative experiment out of at least two experiments with similar results. The accompanying bar diagram depicts the densitometry of the bands. *p< 0.05 vs. respective control; p< 0.05 vs. DL cells treated with glutor or cisplatin alone.
Discussion
The present investigation demonstrates the antineoplastic and chemosensitizing action of glutor against DL cells. To understand the underlying mechanisms, we considered various possibilities. The likelihood of impaired glucose uptake due to the inhibitory action of glutor was supported by the observation of diminished glucose consumption. This observation is validated further as glutor inhibits glucose uptake in neoplastic cells of other etiologies (29, 47). Although the mechanism(s) of the inhibition of GLUT by glutor is not precisely understood, observations from our in silico experiments indicate a direct binding of glutor to GLUTs, possibly causing transformational alterations, which may impair glucose transport (communicated). As we observed that glutor could efficiently inhibit DL cell survival and induce apoptosis at a low IC50 value of 10 nM, it strongly indicates that glutor may have a high-affinity binding to GLUTs.
The pioneering work of Reckzeh et al. (29) reported the upregulated expression of GLUT1 and GLUT3 in the colorectal cancer cell line DLD-1 cultured under hypoglycemic (1 mM), no glucose condition or following treatment with glutor (0.5 µM) in the presence of glucose (25 mM). The difference with our observations could be attributed to differences in the etiology and physiology of the target cells, glucose, and glutor concentrations used. Interestingly, cell-to-cell variations has been observed in many cancer cells for GLUT expression upon the treatment with GLUT inhibitors (22, 29, 48–51).
Interestingly, we also observed downregulation of HIF-1α in glutor-treated DL cells. Moreover, tumor cells display upregulation of GLUT1 and GLUT3 expression in response to HIF-1α (52). It is noteworthy that GLUT expression is downstream of and regulated by HIF-1α (53–55). Moreover, high glucose concentrations have been reported to upregulate HIF-1α expression (56). As a result, the low glucose uptake caused by glutor-dependent-inhibition of GLUT would have triggered the observed downregulation in HIF-1α expression. Nevertheless, transcription of GLUT genes is also under the regulation of several HIF-1α independent factors, including the C-myc, K-Ras, PI3K/Akt/mTOR, cytokines, hormones, HOX transcript antisense RNA (HOTAIR), and miRNA (54, 57–64). Indeed, we also observed glutor-dependent inflection of C-myc. However, more studies will be required to interpret mechanisms underlying glutor-dependent inhibition of GLUT expression in hypoglycemic conditions.
The present observations also showed that glutor treatment of DL cells induced cell death, accompanying alterations in regulatory molecules and metabolic machinery. Indeed, our observations demonstrate mitochondrial membrane depolarization and increased ROS expression in glutor-treated DL cells. Moreover, hypoglycemia caused by impaired glucose uptake could be another trigger for induction of apoptosis. Hypoglycemia has been demonstrated to cause a decrease in ATP production associated with the induction of apoptosis (65, 66). Our experimental findings do not indicate a direct implication of glutor in the modulation of mitochondrial functions such as mitochondrial membrane potential; however, our results suggest the role of glutor-modulated p53 expression in the implication of altered mitochondrial membrane polarization. Indeed, p53 is reported to maintain mitochondrial membrane integrity and oxidative phosphorylation (67). Moreover, elevated intracellular ROS is also observed in disrupting the mitochondrial membrane potential through the AMPK/p38 MAPK signaling pathway (G. T. 68). ROS also play a vital role in activating p53 (69). Besides ROS and p53, the altered levels of Bcl-2 and BAX have also been associated with the depolarization of the mitochondrial membrane and, consequently, mitochondrial-dependent apoptosis (70–72). Moreover, p53 upregulation is implicated in glycolytic inhibition and oxidative stress-induced apoptosis in DL cells (73). Together, the experimental evidence of the present study demonstrates that glutor alters mitochondrial membrane potential in DL cells, possibly via increasing the levels of p53 and ROS and altering Bcl-2 and BAX levels. Nevertheless, upregulation of BAX, along with inhibition of Bcl-2, is implicated in the induction of apoptosis in neoplastic cells (74–76). Moreover, the inhibited expression of HK-2 and LDH-A in glutor-treated DL cells could also impede glycolysis. Thus, the inhibited glycolysis-associated multiple alterations could be one of the likely reasons for the induction of apoptosis.
Interestingly, intracellular ROS has been shown to inhibit various enzymes of glycolysis such as GAPDH, PDK, and PFK, strongly suggesting its crucial role in the regulation of glycolysis (77, 78). Other studies have also reported that inhibition of GLUT1 leads to increased expression of ROS (79, 80). Moreover, intracellular ROS has been demonstrated to trigger apoptosis in neoplastic cells (81).
Nevertheless, glutor treatment also modulated the expression of Hsp70 and TGF-β, which are downstream of HIF-1α and play a crucial role in regulating cell survival (82, 83). As IL-2 plays an indispensable role in T-cell proliferation (84–88), we also checked if IL2 receptor expression is modulated in DL cells following the decrease of glucose assimilation. Interestingly, glutor treatment of DL cells caused a decrease in CD25 expression, which could be possibly another reason for the observed decrease in the proliferation of DL cells. Indeed, the expression of HIF-1α impacts CD25 expression (84).
Another exciting aspect of the present study was the deregulation of pH homeostasis in glutor-treated DL cells, associated with decreased lactate production and MCT1 expression. Additionally, lactate has been shown to exert a predisposing effect on HIF-1α expression in neoplastic cells displaying the Warburg phenomenon (89). Nevertheless, p53 can also regulate MCT1 expression and hence pH homeostasis of cancer cells (90; Monde 91, 92). Moreover, modulated ROS level has been demonstrated to alter the expression of MCT1 (78, 93, 94). Even glucose levels can modulate MCT1 expression (95). Moreover, HIF-1α also regulates the expression of both MCT1 and LDH-A in cancer cells (96, 97). As we observed a decrease in HIF-1α expression, it could be one of the crucial reasons for the observed decrease in the expression of MCT1 and LDH-A in glutor-treated DL cells.
Next, we examined if glutor can alter the vulnerability of cancer cells to the chemotherapeutic agent cisplatin, considering the role of glucose metabolism in regulating chemosensitivity and MDR expression in neoplastic cells (98). Treatment of DL cells with glutor resulted in augmented cytotoxicity of cisplatin, indicating that it enhances chemosensitivity. Thus, this observation reflects the potential of a new therapeutic modality of using glutor as an adjuvant to increase the chemosensitivity of DL cells. Our observations align with earlier studies showing that p-glycoprotein expression is modulated by glucose levels rendering neoplastic cells susceptible to anticancer drugs (99, 100). Indeed, accelerated glycolysis of cancer cells has been reported to elevate ABC transporter activity in neoplastic cells (101, 102). Moreover, GLUT inhibition has been associated with altered drug efflux in cancer cells. Nevertheless, the expression of MDR molecules is also downstream of HIF-1α, which was inhibited in glutor-treated DL cells. Moreover, modulated levels of lactate have also been implicated in altering MDR1 expression (103).
The present study’s findings suggest that glutor exposure of thymic tumor cells can manifest hypoglycemic conditions leading to a catastrophic effect on the carbohydrate metabolism of neoplastic cells with multiple consequences. Moreover, the cytotoxic and chemosensitizing action of glutor could be facilitated by interdependent molecular events, implicating modulated expression of cell survival and metabolism regulatory molecules, pH regulation, intracellular ROS production, and MDR1 expression. It must also be noted that adding extra fructose but not glucose to the culture medium could partially reverse the inhibitory action of glutor on tumor cell survival. This observation indicates the extraordinary ability of neoplastic cells to utilize alternative fuels to compensate and revive their metabolism even if one pathway gets blocked by an inhibitor. Therefore, these observations must be considered while designing therapeutic regimens using glutor. A summary of the possible molecular mechanisms underlying glutor-dependent inhibition of tumor cell survival is depicted in Figure 9. This study also opens future possibilities to explore the translational value of these observations by testing the tumor growth-retarding action of glutor under in vivo preclinical models. Thus, these findings will have a long-lasting clinical significance in evaluating and optimizing the antineoplastic potential of glutor.
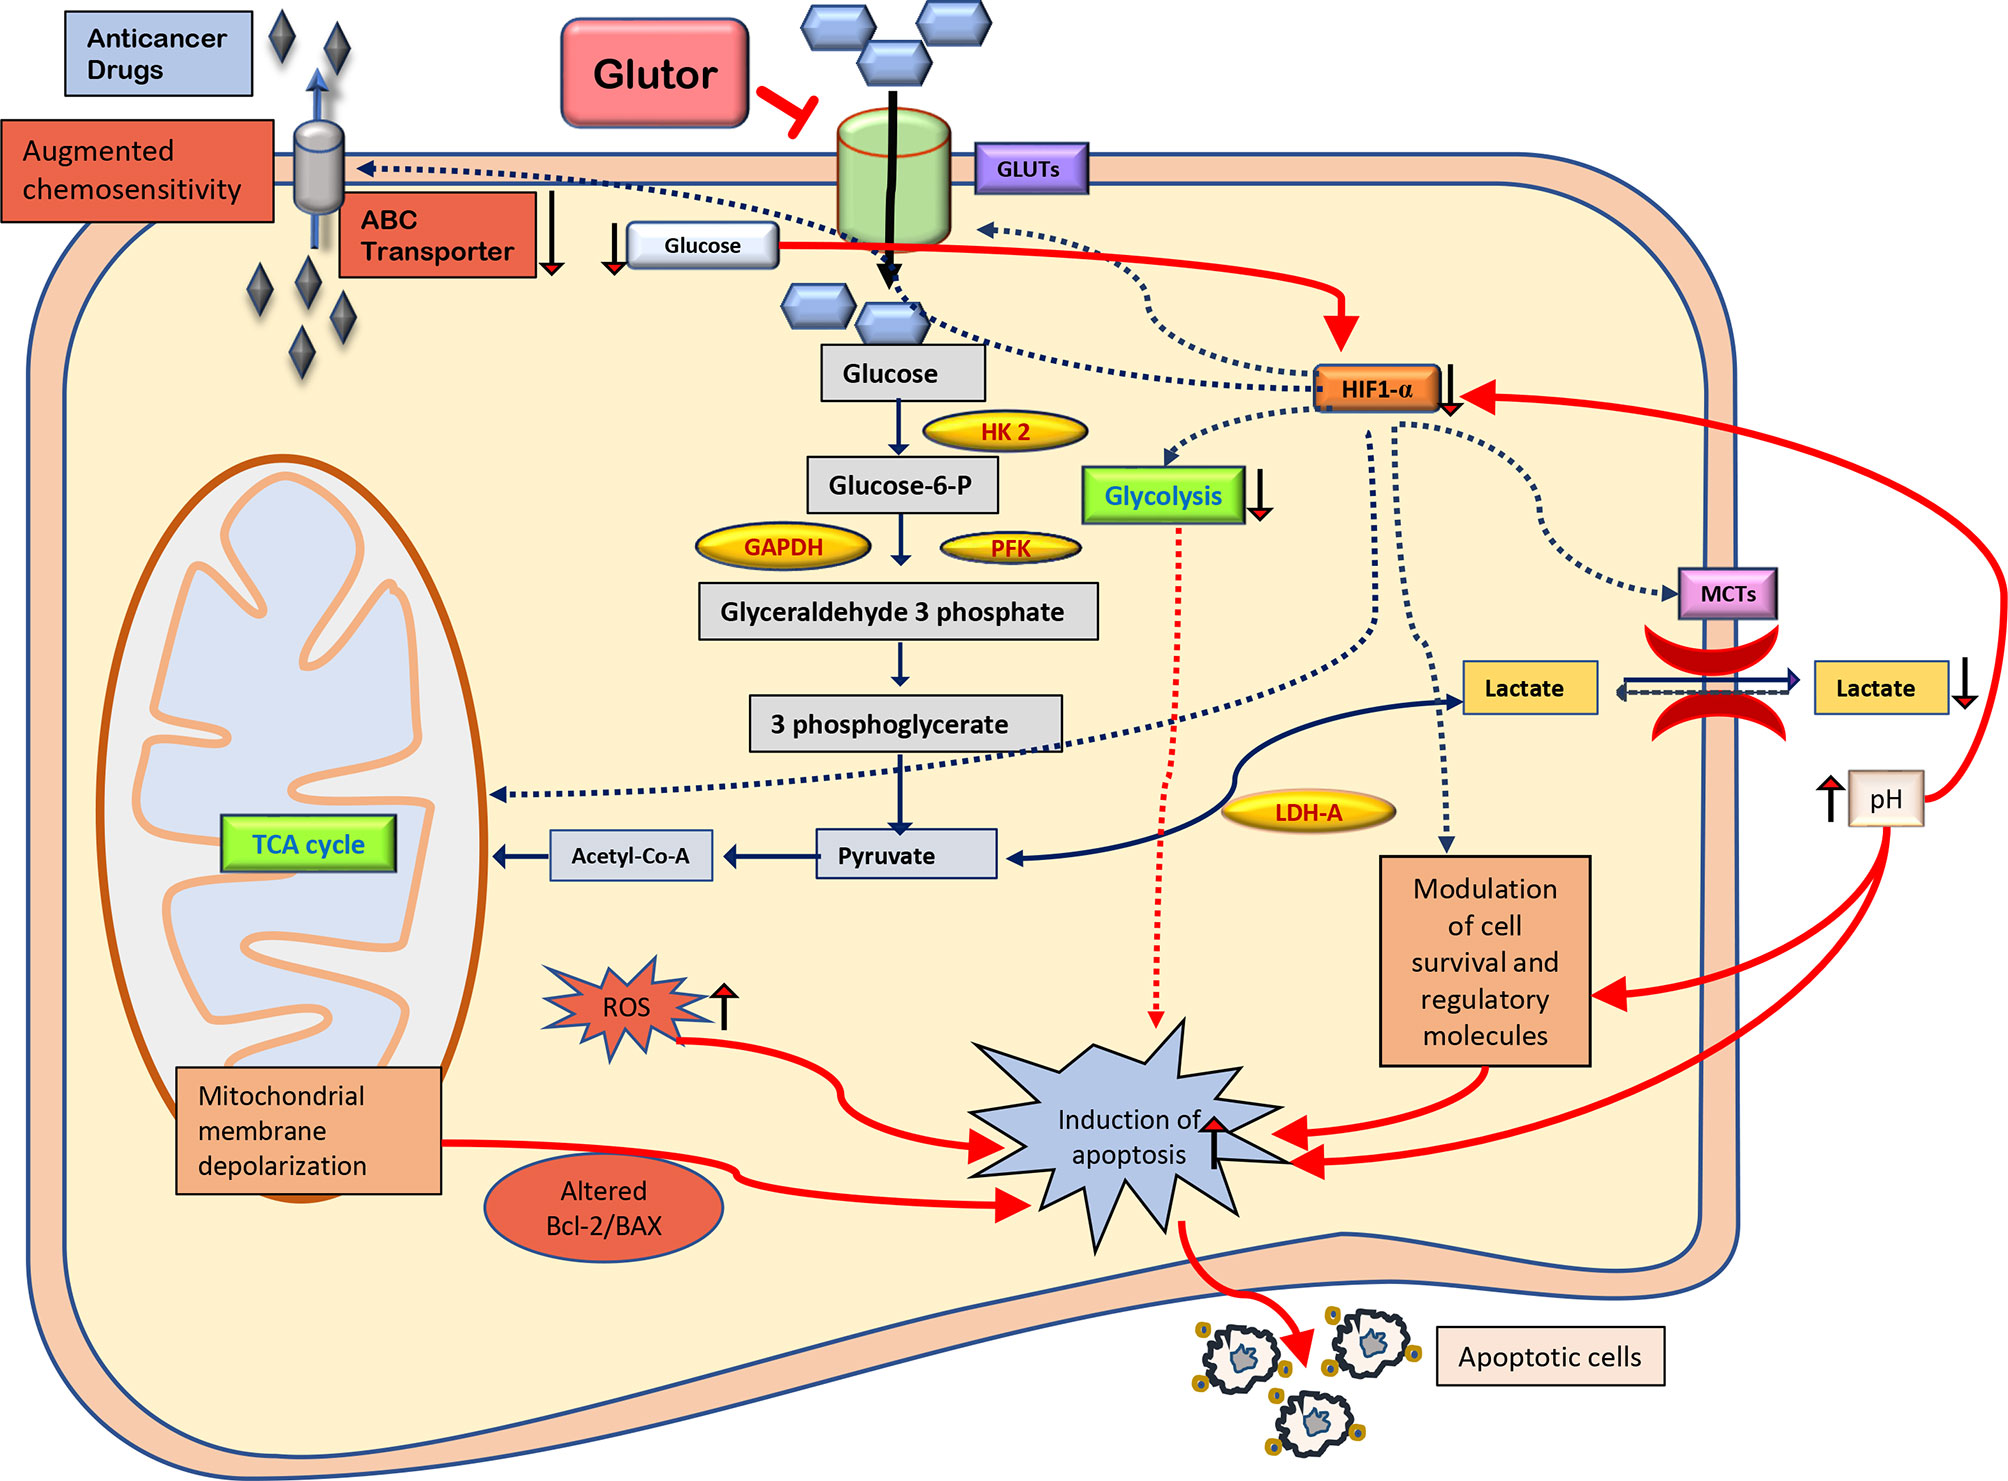
Figure 9 Summary of the molecular mechanisms of the antineoplastic and chemosensitizing action of glutor. The antineoplastic action of glutor involves diminished uptake of glucose, modulated expression of metabolic and cell survival regulatory molecules, altered pH homeostasis, intracellular ROS production, and chemosensitivity. Abbreviations: GLUT, glucose transporter; HK 2, hexokinase 2; GAPDH, glyceraldehyde 3-phosphate dehydrogenase; PFK, phosphofructokinase; HIF-1α, hypoxia-inducible factor 1-alpha; LDH-A, lactate dehydrogenase A; MCTs, monocarboxylate transporters; Bcl-2, B-cell lymphoma 2; BAX, Bcl-2 Associated X; ROS, reactive oxygen species; ABC transporter, ATP-binding cassette transporters.
Data Availability Statement
The raw data supporting the conclusions of this article will be made available by the authors, without undue reservation.
Ethics Statement
The animal study was reviewed and approved by the Institutional Animal Ethical Committee, Institute of Science, Banaras Hindu University, Varanasi 221005, UP, India (Approval No. BHU/DoZ/IAEC/2021-2022/016).
Author Contributions
MT conceived the idea, performed experiments, contributed to data generation, interpreted data, and wrote the manuscript. SY interpreted data and wrote the manuscript. YG interpreted data and wrote the manuscript. SP interpreted data and wrote the manuscript. AK interpreted data and wrote the manuscript. SS conceived the idea, interpreted data, and wrote the manuscript. All authors contributed to the article and approved the submitted version.
Conflict of Interest
The authors declare that the research was conducted in the absence of any commercial or financial relationships that could be construed as a potential conflict of interest.
Publisher’s Note
All claims expressed in this article are solely those of the authors and do not necessarily represent those of their affiliated organizations, or those of the publisher, the editors and the reviewers. Any product that may be evaluated in this article, or claim that may be made by its manufacturer, is not guaranteed or endorsed by the publisher.
Acknowledgments
We acknowledge fellowship support to MT (Award No. DBT/JRF/BET-18/I/2018/AL/154) from DBT, New Delhi. Infrastructural support from DBT, New Delhi, ISLS, IOE, and UGC-UPE, Banaras Hindu University is acknowledged. The work contained in this manuscript is part of the Ph.D. dissertation of MT.
Supplementary Material
The Supplementary Material for this article can be found online at: https://www.frontiersin.org/articles/10.3389/fonc.2022.925666/full#supplementary-material
Supplementary Figure 1 | Molecular structure of glutor Glutor is a piperazine-2-one derivative with IUPAC Name- (S)-6-Methyl-5-(4-morpholinobenzyl)-4-oxo-2-phenyl-N-(pyridin-3-ylmethyl)-4,5,6,7-tetrahydropyrazolo[1,5-a]pyrazine-6-carboxamide.
References
1. Bouillaud F, Hammad N, Schwartz L. Warburg Effect, Glutamine, Succinate, Alanine, When Oxygen Matters. Biology (2021) 10:1000. doi: 10.3390/biology10101000
2. Liberti MV, Locasale JW. The Warburg Effect: How Does It Benefit Cancer Cells? Trends Biochem Sci (2016) 41:211–8. doi: 10.1016/j.tibs.2015.12.001
3. Warburg O. On the Origin of Cancer Cells. Science (1956) 123:309–14. doi: 10.1126/science.123.3191.309
4. Barron C, Tsiani E, Tsakiridis T. Expression of the Glucose Transporters GLUT1, GLUT3, GLUT4 and GLUT12 in Human Cancer Cells. BMC Proc (2012) 6:P4. doi: 10.1186/1753-6561-6-S3-P4
5. Cervantes-Madrid D, Dueñas-González A. Antitumor Effects of a Drug Combination Targeting Glycolysis, Glutaminolysis and De Novo Synthesis of Fatty Acids. Oncol Rep (2015) 34:1533–42. doi: 10.3892/or.2015.4077
6. Dong Y, Tu R, Liu H, Qing G. Regulation of Cancer Cell Metabolism: Oncogenic MYC in the Driver’s Seat. Signal Transduction Targeting Ther (2020) 5:124. doi: 10.1038/s41392-020-00235-2
7. Hay N. Reprogramming Glucose Metabolism in Cancer: Can it be Exploited for Cancer Therapy? Nat Rev Cancer (2016) 16:635–49. doi: 10.1038/nrc.2016.77
8. Tveit DM, Fjeld G, Drengstig T, Filipp FV, Ruoff P, Thorsen K. Exploring Mechanisms of Glucose Uptake Regulation and Dilution Resistance in Growing Cancer Cells. bioRxiv (2020), 2020.01.02.892729. doi: 10.1101/2020.01.02.892729
9. Stine ZE, Schug ZT, Salvino JM, Dang CV. Targeting Cancer Metabolism in the Era of Precision Oncology. Nat Rev Drug Discov (2022) 21:141–62. doi: 10.1038/s41573-021-00339-6
10. Tuli HS, Tuorkey MJ, Thakral F, Sak K, Kumar M, Sharma AK, et al. Molecular Mechanisms of Action of Genistein in Cancer: Recent Advances. Front Pharmacol (2019) 10. doi: 10.3389/fphar.2019.01336
11. Salehi B, Machin L, Monzote L, Sharifi-Rad J, Ezzat SM, Salem MA, et al. Therapeutic Potential of Quercetin: New Insights and Perspectives for Human Health. ACS Omega (2020) 5:11849–72. doi: 10.1021/acsomega.0c01818
12. Tabolacci C, Cordella M, Rossi S, Bonaccio M, Eramo A, Mischiati C, et al. Targeting Melanoma-Initiating Cells by Caffeine: In Silico and In Vitro Approaches. Molecules (2021) 26:3619. doi: 10.3390/molecules26123619
13. Wu K-H, Ho C-T, Chen Z-F, Chen L-C, Whang-Peng J, Lin T-N, et al. The Apple Polyphenol Phloretin Inhibits Breast Cancer Cell Migration and Proliferation via Inhibition of Signals by Type 2 Glucose Transporter. J Food Drug Anal (2018) 26:221–31. doi: 10.1016/j.jfda.2017.03.009
14. Poschner S, Maier-Salamon A, Zehl M, Wackerlig J, Dobusch D, Meshcheryakova A, et al. Resveratrol Inhibits Key Steps of Steroid Metabolism in a Human Estrogen-Receptor Positive Breast Cancer Model: Impact on Cellular Proliferation. Front Pharmacol (2018) 9:742. doi: 10.3389/fphar.2018.00742
15. Soni VK, Shukla D, Kumar A, Vishvakarma NK. Curcumin Circumvent Lactate-Induced Chemoresistance in Hepatic Cancer Cells Through Modulation of Hydroxycarboxylic Acid Receptor-1. Int J Biochem Cell Biol (2020) 123:105752. doi: 10.1016/j.biocel.2020.105752
16. Kapoor K, Finer-Moore JS, Pedersen BP, Caboni L, Waight A, Hillig RC, et al (2016). Mechanism of Inhibition of Human Glucose Transporter GLUT1 Is Conserved Between Cytochalasin B and Phenylalanine Amides. Proc Natl Acad Sci 113:4711. doi: 10.1073/pnas.1603735113
17. Ocaña MC, Martínez-Poveda B, Marí-Beffa M, Quesada AR, Medina M.Á. Fasentin Diminishes Endothelial Cell Proliferation, Differentiation and Invasion in a Glucose Metabolism-Independent Manner. Sci Rep (2020) 10:6132. doi: 10.1038/s41598-020-63232-z
18. Ojelabi O, DeZutter J, Lloyd K, Carruthers A. Novel Small Molecule, WZB117, Competitively Inhibit GLUT1-Mediated Glucose Transport to Halt Cancer Growth. FASEB J (2016) 30:1099.1–1. doi: 10.1096/fasebj.30.1_supplement.1099.1
19. Tilekar K, Upadhyay N, Hess JD, Macias LH, Mrowka P, Aguilera RJ, et al. Structure Guided Design and Synthesis of Furyl Thiazolidinedione Derivatives as Inhibitors of GLUT 1 and GLUT 4, and Evaluation of Their Anti-Leukemic Potential. Eur J Med Chem (2020) 202:112603. doi: 10.1016/j.ejmech.2020.112603
20. Meng Y, Xu X, Luan H, Li L, Dai W, Li Z, et al. The Progress and Development of GLUT1 Inhibitors Targeting Cancer Energy Metabolism. Future Med Chem (2019) 11:2333–52. doi: 10.4155/fmc-2019-0052
21. Siebeneicher H, Cleve A, Rehwinkel H, Neuhaus R, Heisler I, Müller T, et al. Identification and Optimization of the First Highly Selective GLUT1 Inhibitor BAY-876. Chemmedchem (2016) 11:2261–71. doi: 10.1002/cmdc.201600276
22. Shriwas P, Roberts D, Li Y, Wang L, Qian Y, Bergmeier S, et al. A Small-Molecule Pan-Class I Glucose Transporter Inhibitor Reduces Cancer Cell Proliferation In Vitro and Tumor Growth In Vivo by Targeting Glucose-Based Metabolism. Cancer Metab (2021) 9:1–14. doi: 10.1186/s40170-021-00248-7
23. Zhan T, Digel M, Küch E-M, Stremmel W, Füllekrug J. Silybin and Dehydrosilybin Decrease Glucose Uptake by Inhibiting GLUT Proteins. J Cell Biochem (2011) 112:849–59. doi: 10.1002/jcb.22984
24. Flaig TW, Gustafson DL, Su L-J, Zirrolli JA, Crighton F, Harrison GS, et al. A Phase I and Pharmacokinetic Study of Silybin-Phytosome in Prostate Cancer Patients. Invest New Drugs (2007) 25:139–46. doi: 10.1007/s10637-006-9019-2
25. Memariani Z, Abbas SQ, ul Hassan SS, Ahmadi A, Chabra A. Naringin and Naringenin as Anticancer Agents and Adjuvants in Cancer Combination Therapy: Efficacy and Molecular Mechanisms of Action, a Comprehensive Narrative Review. Pharmacol Res (2021) 171:105264. doi: 10.1016/j.phrs.2020.105264
26. Ghanbari-Movahed M, Jackson G, Farzaei MH, Bishayee A. A Systematic Review of the Preventive and Therapeutic Effects of Naringin Against Human Malignancies. Front Pharmacol (2021) 12. doi: 10.3389/fphar.2021.639840
27. Zambrano A, Molt M, Uribe E, Salas M. Glut 1 in Cancer Cells and the Inhibitory Action of Resveratrol as A Potential Therapeutic Strategy. Int J Mol Sci (2019) 20:3374. doi: 10.3390/ijms20133374
28. Davidson CD, Carr FE. Review of Pharmacological Inhibition of Thyroid Cancer Metabolism. J Cancer Metastasis Treat (2021) 7:45. doi: 10.20517/2394-4722.2021.77
29. Reckzeh ES, Karageorgis G, Schwalfenberg M, Ceballos J, Nowacki J, Stroet MCM, et al. Inhibition of Glucose Transporters and Glutaminase Synergistically Impairs Tumor Cell Growth. Cell Chem Biol (2019) 26:1214–1228.e25. doi: 10.1016/j.chembiol.2019.06.005
30. Reckzeh ES, Waldmann H. Development of Glucose Transporter (GLUT) Inhibitors. Eur J Org Chem (2020) 2020:2321–9. doi: 10.1002/ejoc.201901353
31. Schmidl S, Ursu O, Iancu CV, Oreb M, Oprea TI, Choe J. Identification of New GLUT2-Selective Inhibitors Through in Silico Ligand Screening and Validation in Eukaryotic Expression Systems. Sci Rep (2021) 11:13751. doi: 10.1038/s41598-021-93063-5
32. Tseng Y-L. Thymic Carcinoma: A Rare Cancer Requiring Special Attention. Formos. J Surg (2011) 44:136–40. doi: 10.1016/j.fjs.2011.08.007
33. Zeng H, Yang W, Xu B, Zou J, Su C, Zhong B, et al. Relationship of Possible Biomarkers With Malignancy of Thymic Tumors: A Meta-Analysis. BMC Cancer (2020) 20:928. doi: 10.1186/s12885-020-07332-z
34. Dunham LJ, Stewart HL. A Survey of Transplantable and Transmissible Animal Tumors. J Natl Cancer Inst (1953) 13:1299–377. doi: 10.1093/jnci/13.5.1299
35. Goel Y, Yadav S, Pandey SK, Temre MK, Maurya BN, Verma A, et al. Tumor Decelerating and Chemo-Potentiating Action of Methyl Jasmonate on a T Cell Lymphoma In Vivo: Role of Altered Regulation of Metabolism, Cell Survival, Drug Resistance, and Intratumoral Blood Flow. Front Oncol (2021) 11. doi: 10.3389/fonc.2021.619351
36. Yadav S, Pandey SK, Goel Y, Kujur PK, Maurya BN, Verma A, et al. Protective and Recuperative Effects of 3-Bromopyruvate on Immunological, Hepatic and Renal Homeostasis in a Murine Host Bearing Ascitic Lymphoma: Implication of Niche Dependent Differential Roles of Macrophages. Biomed Pharmacother Biomedecine Pharmacother (2018) 99:970–85. doi: 10.1016/j.biopha.2018.01.149
37. Bharti AC, Singh SM. Gangliosides Derived From a T Cell Lymphoma Inhibit Bone Marrow Cell Proliferation and Differentiation. Int Immunopharmacol (2001) 1:155–65. doi: 10.1016/S1567-5769(00)00004-7
38. Goldie H, Felix MD. Growth Characteristics of Free Tumor Cells Transferred Serially in the Peritoneal Fluid of the Mouse. Cancer Res (1951) 11:73–80.
39. Mosmann T. Rapid Colorimetric Assay for Cellular Growth and Survival: Application to Proliferation and Cytotoxicity Assays. J Immunol Methods (1983) 65:55–63. doi: 10.1016/0022-1759(83)90303-4
40. Fido RJ, Tatham AS, Shewry PR. Western Blotting Analysis. Methods Mol Biol Clifton NJ (1995) 49:423–37. doi: 10.1385/0-89603-321-X:423
41. Goel Y, Yadav S, Pandey SK, Temre MK, Singh VK, Kumar A, et al. Methyl Jasmonate Cytotoxicity and Chemosensitization of T Cell Lymphoma In Vitro Is Facilitated by HK 2, HIF-1α, and Hsp70: Implication of Altered Regulation of Cell Survival, pH Homeostasis, Mitochondrial Functions. Front Pharmacol (2021) 12:158. doi: 10.3389/fphar.2021.628329
42. Bradford MM. A Rapid and Sensitive Method for the Quantitation of Microgram Quantities of Protein Utilizing the Principle of Protein-Dye Binding. Anal Biochem (1976) 72:248–54. doi: 10.1006/abio.1976.9999
43. Furuta E, Pai SK, Zhan R, Bandyopadhyay S, Watabe M, Mo Y-Y, et al. Fatty Acid Synthase Gene is Up-Regulated by Hypoxia via Activation of Akt and Sterol Regulatory Element Binding Protein-1. Cancer Res (2008) 68:1003–11. doi: 10.1158/0008-5472.CAN-07-2489
44. Somoza B, Guzmán R, Cano V, Merino B, Ramos P, Díez-Fernández C, et al. Induction of Cardiac Uncoupling Protein-2 Expression and Adenosine 5’-Monophosphate-Activated Protein Kinase Phosphorylation During Early States of Diet-Induced Obesity in Mice. Endocrinology (2007) 148:924–31. doi: 10.1210/en.2006-0914
45. Yadav S, Pandey SK, Goel Y, Temre MK, Singh SM. Antimetabolic Agent 3-Bromopyruvate Exerts Myelopotentiating Action in a Murine Host Bearing a Progressively Growing Ascitic Thymoma. Immunol Invest. (2020) 49:425–42. doi: 10.1080/08820139.2019.1627368
46. Crowley LC, Christensen ME, Waterhouse NJ. Measuring Mitochondrial Transmembrane Potential by TMRE Staining. Cold Spring Harb. Protoc (2016). doi: 10.1101/pdb.prot087361
47. Reckzeh ES, Waldmann H. Small-Molecule Inhibition of Glucose Transporters GLUT-1–4. ChemBioChem (2020) 21:45–52. doi: 10.1002/cbic.201900544
48. Gonzalez-Menendez P, Hevia D, Alonso-Arias R, Alvarez-Artime A, Rodriguez-Garcia A, Kinet S, et al. GLUT1 Protects Prostate Cancer Cells From Glucose Deprivation-Induced Oxidative Stress. Redox Biol (2018) 17:112–27. doi: 10.1016/j.redox.2018.03.017
49. Liu Y, Cao Y, Zhang W, Bergmeier S, Qian Y, Akbar H, et al. A Small-Molecule Inhibitor of Glucose Transporter 1 Downregulates Glycolysis, Induces Cell-Cycle Arrest, and Inhibits Cancer Cell Growth In Vitro and In Vivo. Mol. Cancer Ther (2012) 11:1672–82. doi: 10.1158/1535-7163.MCT-12-0131
50. Ma Y, Wang W, Idowu MO, Oh U, Wang X-Y, Temkin SM, et al. Ovarian Cancer Relies on Glucose Transporter 1 to Fuel Glycolysis and Growth: Anti-Tumor Activity of BAY-876. Cancers (2018) 11:33. doi: 10.3390/cancers11010033
51. Zhao F, Ming J, Zhou Y, Fan L. Inhibition of Glut1 by WZB117 Sensitizes Radioresistant Breast Cancer Cells to Irradiation. Cancer Chemother Pharmacol (2016) 77:963–72. doi: 10.1007/s00280-016-3007-9
52. Masoud GN, Li W. HIF-1α Pathway: Role, Regulation and Intervention for Cancer Therapy. Acta Pharm Sin B (2015) 5:378–89. doi: 10.1016/j.apsb.2015.05.007
53. Hao L-S, Liu Q, Tian C, Zhang D-X, Wang B, Zhou D-X, et al. Correlation and Expression Analysis of Hypoxia−Inducible Factor 1α, Glucose Transporter 1 and Lactate Dehydrogenase 5 in Human Gastric Cancer. Oncol Lett (2019) 18:1431–41. doi: 10.3892/ol.2019.10457
54. Li Y, Sun X-X, Qian DZ, Dai M-S. Molecular Crosstalk Between MYC and HIF in Cancer. Front Cell Dev Biol (2020) 8. doi: 10.3389/fcell.2020.590576
55. Sadlecki P, Bodnar M, Grabiec M, Marszalek A, Walentowicz P, Sokup A, et al. The Role of Hypoxia-Inducible Factor-1α, Glucose Transporter-1, (GLUT-1) and Carbon Anhydrase IX in Endometrial Cancer Patients. BioMed Res Int (2014) 2014:e616850. doi: 10.1155/2014/616850
56. Li W, Liu H, Qian W, Cheng L, Yan B, Han L, et al. Hyperglycemia Aggravates Microenvironment Hypoxia and Promotes the Metastatic Ability of Pancreatic Cancer. Comput Struct Biotechnol J (2018) 16:479–87. doi: 10.1016/j.csbj.2018.10.006
57. Balihodzic A, Barth DA, Prinz F, Pichler M. Involvement of Long Non-Coding RNAs in Glucose Metabolism in Cancer. Cancers (2021) 13:977. doi: 10.3390/cancers13050977
58. Bishop EL, Gudgeon N, Dimeloe S. Control of T Cell Metabolism by Cytokines and Hormones. Front Immunol (2021) 12. doi: 10.3389/fimmu.2021.653605
59. Guo Y, Lv B, Liu R, Dai Z, Zhang F, Liang Y, et al. Role of LncRNAs in Regulating Cancer Amino Acid Metabolism. Cancer Cell Int (2021) 21:209. doi: 10.1186/s12935-021-01926-8
60. Hoxhaj G, Manning BD. The PI3K-AKT Network at the Interface of Oncogenic Signalling and Cancer Metabolism. Nat Rev Cancer (2020) 20:74–88. doi: 10.1038/s41568-019-0216-7
61. Lozano-Romero A, Astudillo-de la Vega H, Terrones-Gurrola MC, del R, Marchat LA, Hernández-Sotelo D, et al. HOX Transcript Antisense RNA HOTAIR Abrogates Vasculogenic Mimicry by Targeting the AngiomiR-204/FAK Axis in Triple Negative Breast Cancer Cells. Non-Coding RNA (2020) 6:19. doi: 10.3390/ncrna6020019
62. Evangelisti C, Chiarini F, Cappellini A, Paganelli F, Fini M, Santi S, et al. Targeting Wnt/β-Catenin and PI3K/Akt/mTOR Pathways in T-Cell Acute Lymphoblastic Leukemia. J Cell Physiol (2020) 235:5413–28. doi: 10.1002/jcp.29429
63. Li Y, Liu Y, Lu Y, Zhao B. Inhibitory Effects of 17β-Estradiol or a Resveratrol Dimer on Hypoxia-Inducible Factor-1α in Genioglossus Myoblasts: Involvement of Erα and its Downstream P38 MAPK Pathways. Int J Mol Med (2017) 40:1347–56. doi: 10.3892/ijmm.2017.3123
64. Cluff ER, Nolan J, Collins C, Varadaraj A, Rajasekaran N. Hypoxia-Inducible Factor-1α Is Upregulated in Natural Killer Cells by Interleukin-2 and Hypoxia via PI3K/mTOR Signaling Pathway. J Immunol (2019) 202:194.37–7. doi: 10.1007/s00262-021-03126-9
65. Elgendy M, Cirò M, Hosseini A, Weiszmann J, Mazzarella L, Ferrari E, et al. Combination of Hypoglycemia and Metformin Impairs Tumor Metabolic Plasticity and Growth by Modulating the PP2A-Gsk3β-MCL-1 Axis. Cancer Cell (2019) 35:798–815.e5. doi: 10.1016/j.ccell.2019.03.007
66. Olatunde A, Nigam M, Singh RK, Panwar AS, Lasisi A, Alhumaydhi FA, et al. Cancer and Diabetes: The Interlinking Metabolic Pathways and Repurposing Actions of Antidiabetic Drugs. Cancer Cell Int (2021) 21:499. doi: 10.1186/s12935-021-02202-5
67. Bergeaud M, Mathieu L, Guillaume A, Moll UM, Mignotte B, Le Floch N, et al. Mitochondrial P53 Mediates a Transcription-Independent Regulation of Cell Respiration and Interacts With the Mitochondrial F1F0-ATP Synthase. Cell Cycle Georget. Tex (2013) 12:2781–93. doi: 10.4161/cc.25870
68. Kim GT, Lee SH, Kim YM. Torilis Japonica Extract-Generated Intracellular ROS Induces Apoptosis by Reducing the Mitochondrial Membrane Potential via Regulation of the AMPK-P38 MAPK Signaling Pathway in HCT116 Colon Cancer. Int J Oncol (2016) 49:1088–98. doi: 10.3892/ijo.2016.3578
69. Shi T, Dansen TB. Reactive Oxygen Species Induced P53 Activation: DNA Damage, Redox Signaling, or Both? Antioxid Redox Signal (2020) 33:839–59. doi: 10.1089/ars.2020.8074
70. Gyulkhandanyan AV, Allen DJ, Mykhaylov S, Lyubimov E, Ni H, Freedman J, et al. Mitochondrial Inner Membrane Depolarization as a Marker of Platelet Apoptosis: Disclosure of Nonapoptotic Membrane Depolarization. Clin Appl Thromb (2017) 23:139–47. doi: 10.1177/1076029616665924
71. Matsuyama S, Reed JC. Mitochondria-Dependent Apoptosis and Cellular pH Regulation. Cell Death Differ (2000) 7:1155–65. doi: 10.1038/sj.cdd.4400779
72. Wang C, Youle RJ. The Role of Mitochondria in Apoptosis*. Annu Rev Genet (2009) 43:95–118. doi: 10.1146/annurev-genet-102108-134850
73. Koiri RK, Trigun SK, Mishra L. Activation of P53 Mediated Glycolytic Inhibition-Oxidative Stress-Apoptosis Pathway in Dalton’s Lymphoma by a Ruthenium (II)-Complex Containing 4-Carboxy N-Ethylbenzamide. Biochimie (2015) 110:52–61. doi: 10.1016/j.biochi.2014.12.021
74. Kapoor I, Bodo J, Hill BT, Hsi ED, Almasan A. Targeting BCL-2 in B-Cell Malignancies and Overcoming Therapeutic Resistance. Cell Death Dis (2020) 11:941. doi: 10.1038/s41419-020-03144-y
75. Lucantoni F, Düssmann H, Llorente-Folch I, Prehn JHM. BCL2 and BCL(X)L Selective Inhibitors Decrease Mitochondrial ATP Production in Breast Cancer Cells and Are Synthetically Lethal When Combined With 2-Deoxy-D-Glucose. Oncotarget (2018) 9:26046–63. doi: 10.18632/oncotarget.25433
76. Sharma A, Boise LH, Shanmugam M. Cancer Metabolism and the Evasion of Apoptotic Cell Death. Cancers (2019) 11:1144. doi: 10.3390/cancers11081144
77. Ghanbari Movahed Z, Rastegari-Pouyani M, Mohammadi M, Mansouri K. Cancer Cells Change Their Glucose Metabolism to Overcome Increased ROS: One Step From Cancer Cell to Cancer Stem Cell? Biomed Pharmacother. (2019) 112:108690. doi: 10.1016/j.biopha.2019.108690
78. Rodic S, Vincent MD. Reactive Oxygen Species (ROS) Are a Key Determinant of Cancer’s Metabolic Phenotype. Int J Cancer (2018) 142:440–8. doi: 10.1002/ijc.31069
79. Kim J, Kim J, Bae J-S. ROS Homeostasis and Metabolism: A Critical Liaison for Cancer Therapy. Exp Mol Med (2016) 48:e269–9. doi: 10.1038/emm.2016.119
80. Liemburg-Apers DC, Willems PHGM, Koopman WJH, Grefte S. Interactions Between Mitochondrial Reactive Oxygen Species and Cellular Glucose Metabolism. Arch Toxicol (2015) 89:1209–26. doi: 10.1007/s00204-015-1520-y
81. Perillo B, Di Donato M, Pezone A, Di Zazzo E, Giovannelli P, Galasso G, et al. ROS in Cancer Therapy: The Bright Side of the Moon. Exp Mol Med (2020) 52:192–203. doi: 10.1038/s12276-020-0384-2
82. Huang W-J, Xia L-M, Zhu F, Huang B, Zhou C, Zhu H-F, et al. Transcriptional Upregulation of HSP70-2 by HIF-1 in Cancer Cells in Response to Hypoxia. Int J Cancer (2009) 124:298–305. doi: 10.1002/ijc.23906
83. Huang Y, Chen Z, Lu T, Bi G, Li M, Liang J, et al. HIF-1α Switches the Functionality of TGF-β Signaling via Changing the Partners of Smads to Drive Glucose Metabolic Reprogramming in Non-Small Cell Lung Cancer. J Exp Clin Cancer Res CR (2021) 40:398. doi: 10.1186/s13046-021-02188-y
84. Jiang T, Zhou C, Ren S. Role of IL-2 in Cancer Immunotherapy. Oncoimmunology (2016) 5:e1163462. doi: 10.1080/2162402X.2016.1163462
85. Koiri RK, Mehrotra A, Trigun SK, Koiri RK, Mehrotra A, Trigun SK. Dalton’s Lymphoma as a Murine Model for Understanding the Progression and Development of T-Cell Lymphoma and Its Role in Drug Discovery. Int J Immunother. Cancer Res (2017) 3:001–6. doi: 10.17352/2455-8591.000011
86. Ross SH, Cantrell DA. Signaling and Function of Interleukin-2 in T Lymphocytes. Annu Rev Immunol (2018) 36:411–33. doi: 10.1146/annurev-immunol-042617-053352
87. Serrate SA, Schulof RS, Leondaridis L, Goldstein AL, Sztein MB. Modulation of Human Natural Killer Cell Cytotoxic Activity, Lymphokine Production, and Interleukin 2 Receptor Expression by Thymic Hormones. J Immunol Baltim. Md (1987) 139:2338–43.
88. Shanker A, Singh SM, Sodhi A. Ascitic Growth of a Spontaneous Transplantable T Cell Lymphoma Induces Thymic Involution. Tumor Biol (2000) 21:288–98. doi: 10.1159/000030134
89. De Saedeleer CJ, Copetti T, Porporato PE, Verrax J, Feron O, Sonveaux P. Lactate Activates HIF-1 in Oxidative But Not in Warburg-Phenotype Human Tumor Cells. PloS One (2012) 7:e46571. doi: 10.1371/journal.pone.0046571
90. Liu J, Zhang C, Hu W, Feng Z. Tumor Suppressor P53 and Metabolism. J Mol Cell Biol (2019) 11:284–92. doi: 10.1093/jmcb/mjy070
91. Ntwasa M. Glucose Metabolism and Carcinogenesis: The Impact of the Tumor Suppressor. In: Njende U, Shahzad HN, editors. Neoplasm. Rijeka: IntechOpen (2018). p. p53. doi: 10.5772/intechopen.75976
92. Puzio-Kuter AM. The Role of P53 in Metabolic Regulation. Genes Cancer (2011) 2:385–91. doi: 10.1177/1947601911409738
93. De Saedeleer CJ, Porporato PE, Copetti T, Pérez-Escuredo J, Payen VL, Brisson L, et al. Glucose Deprivation Increases Monocarboxylate Transporter 1 (MCT1) Expression and MCT1-Dependent Tumor Cell Migration. Oncogene (2014) 33:4060–8. doi: 10.1038/onc.2013.454
94. Johnson JM, Cotzia P, Fratamico R, Mikkilineni L, Chen J, Colombo D, et al. MCT1 in Invasive Ductal Carcinoma: Monocarboxylate Metabolism and Aggressive Breast Cancer. Front Cell Dev Biol (2017) 5:27. doi: 10.3389/fcell.2017.00027
95. Zhang G, Zhang Y, Dong D, Wang F, Ma X, Guan F, et al. MCT1 Regulates Aggressive and Metabolic Phenotypes in Bladder Cancer. J Cancer (2018) 9:2492–501. doi: 10.7150/jca.25257
96. Cui X-G, Han Z-T, He S-H, Wu X, Chen T-R, Shao C-H, et al. Hif1/2α Mediates Hypoxia-Induced LDHA Expression in Human Pancreatic Cancer Cells. Oncotarget (2017) 8:24840–52. doi: 10.18632/oncotarget.15266
97. Lacher SE, Levings DC, Freeman S, Slattery M. Identification of a Functional Antioxidant Response Element at the HIF1A Locus. Redox Biol (2018) 19:401–11. doi: 10.1016/j.redox.2018.08.014
98. Qiu J, Zheng Q, Meng X. Hyperglycemia and Chemoresistance in Breast Cancer: From Cellular Mechanisms to Treatment Response. Front Oncol (2021) 11:628359. doi: 10.3389/fonc.2021.628359
99. Bukowski K, Kciuk M, Kontek R. Mechanisms of Multidrug Resistance in Cancer Chemotherapy. Int J Mol Sci (2020) 21:03233. doi: 10.3390/ijms21093233
100. Lee G, Joung J-Y, Cho J-H, Son C-G, Lee N. Overcoming P-Glycoprotein-Mediated Multidrug Resistance in Colorectal Cancer: Potential Reversal Agents Among Herbal Medicines. Evid. Based Complement. Alternat. Med (2018) 2018:3412074. doi: 10.1155/2018/3412074
101. Giddings EL, Champagne DP, Wu M-H, Laffin JM, Thornton TM, Valenca-Pereira F, et al. Mitochondrial ATP Fuels ABC Transporter-Mediated Drug Efflux in Cancer Chemoresistance. Nat Commun (2021) 12:2804. doi: 10.1038/s41467-021-23071-6
102. Nakano A, Tsuji D, Miki H, Cui Q, El Sayed SM, Ikegame A, et al. Glycolysis Inhibition Inactivates ABC Transporters to Restore Drug Sensitivity in Malignant Cells. PloS One (2011) 6:e27222. doi: 10.1371/journal.pone.0027222
Keywords: glutor, GLUT, thymoma, metabolism, cell survival regulation, targeted therapeutics
Citation: Temre MK, Yadav S, Goel Y, Pandey SK, Kumar A and Singh SM (2022) Glutor, a Glucose Transporter Inhibitor, Exerts Antineoplastic Action on Tumor Cells of Thymic Origin: Implication of Modulated Metabolism, Survival, Oxidative Stress, Mitochondrial Membrane Potential, pH Homeostasis, and Chemosensitivity. Front. Oncol. 12:925666. doi: 10.3389/fonc.2022.925666
Received: 21 April 2022; Accepted: 01 June 2022;
Published: 30 June 2022.
Edited by:
Matiullah Khan, AIMST University, MalaysiaReviewed by:
Stephen John Ralph, Griffith University, AustraliaAnita Bakrania, University Health Network (UHN), Canada
Copyright © 2022 Temre, Yadav, Goel, Pandey, Kumar and Singh. This is an open-access article distributed under the terms of the Creative Commons Attribution License (CC BY). The use, distribution or reproduction in other forums is permitted, provided the original author(s) and the copyright owner(s) are credited and that the original publication in this journal is cited, in accordance with accepted academic practice. No use, distribution or reproduction is permitted which does not comply with these terms.
*Correspondence: Sukh Mahendra Singh, c21zaW5naGJpb3RlY2hAYmh1LmFjLmlu