 Xiu-qing Xue
 Wen-Ji Yu
 Xun Shi1,2
 Yue-Tao Wang
- 1Department of Nuclear Medicine, The First People’s Hospital of Yancheng, Yancheng, China
- 2The Yancheng Clinical College of Xuzhou Medical University, Yancheng, China
- 3Department of Nuclear Medicine, The Third Affiliated Hospital of Soochow University, Changzhou, China
- 4Institute of Clinical Translation of Nuclear Medicine and Molecular Imaging, Soochow University, Changzhou, China
Objective: Lymph node metastasis (LNM) is not only one of the important factors affecting the prognosis of gastric cancer but also an important basis for treatment decisions. The purpose of this study was to investigate the value of the radiomics nomogram based on preoperative 18F-deoxyglucose (FDG) PET/CT primary lesions and clinical risk factors for predicting LNM in gastric cancer (GC).
Methods: We retrospectively analyzed radiomics features of preoperative 18F-FDG PET/CT images in 224 gastric cancer patients from two centers. The prediction model was developed in the training cohort (n = 134) and validated in the internal (n = 59) and external validation cohorts (n = 31). The least absolute shrinkage and selection operator (LASSO) regression was used to select features and build radiomics signatures. The radiomics feature score (Rad-score) was calculated and established a radiomics signature. Multivariate logistic regression analysis was used to screen independent risk factors for LNM. The minimum Akaike’s information criterion (AIC) was used to select the optimal model parameters to construct a radiomics nomogram. The performance of the nomogram was assessed with calibration, discrimination, and clinical usefulness.
Results: There was no significant difference between the internal verification and external verification of the clinical data of patients (all p > 0.05). The areas under the curve (AUCs) (95% CI) for predicting LNM based on the 18F-FDG PET/CT radiomics signature in the training cohort, internal validation cohort, and external validation cohort were 0.792 (95% CI: 0.712–0.870), 0.803 (95% CI: 0.681–0.924), and 0.762 (95% CI: 0.579–0.945), respectively. Multivariate logistic regression showed that carbohydrate antigen (CA) 19-9 [OR (95% CI): 10.180 (1.267–81.831)], PET/CT diagnosis of LNM [OR (95% CI): 6.370 (2.256–17.984)], PET/CT Rad-score [OR (95% CI): 16.536 (5.506–49.660)] were independent influencing factors of LNM (all p < 0.05), and a radiomics nomogram was established based on those factors. The AUCs (95% CI) for predicting LNM were 0.861 (95% CI: 0.799–0.924), 0.889 (95% CI: 0.800–0.976), and 0.897 (95% CI: 0.683–0.948) in the training cohort, the internal validation cohort, and the external validation cohort, respectively. Decision curve analysis (DCA) indicated that the 18F-FDG PET/CT-based radiomics nomogram has good clinical utility.
Conclusions: Radiomics nomogram based on the primary tumor of 18F-FDG PET/CT could facilitate the preoperative individualized prediction of LNM, which is helpful for risk stratification in GC patients.
Main findings
● The radiomics nomogram based on preoperative 18F-FDG PET/CT primary lesions and clinical risk factors showed a favorable performance for predicting LNM in GC.
● PET/CT Rad-score outperformed conventional PET/CT diagnosis of LNM in GC.
● The radiomics nomogram facilitates the preoperative individualized prediction of LNM in GC.
Introduction
In China, gastric cancer (GC) is the most common malignant tumor of the digestive system (1). Lymph node metastasis (LNM) is the most common route of GC metastasis, which not only affects the prognosis of GC patients but also affects the formulation of personalized treatment plans (1, 2). Accurately evaluating lymph node status before an operation is significant for making pretreatment decisions, dissecting lymph nodes intraoperatively, and selecting the surgical methods and the neoadjuvant chemotherapy (3–7). The existing imaging methods for diagnosing LNM of GC include computed tomography (CT), endoscopic ultrasonography (EUS), and magnetic resonance imaging (MRI). However, the above imaging methods diagnosing LNM of GC are mainly based on the information of lymph nodes, such as the diameter and enhancement of lymph nodes, and their diagnostic accuracy is still not satisfactory (8). Since LNM is a complex biological process, it can also be affected by characteristics of primary tumor cells, such as proliferation rate, invasiveness, and chemotaxis (9, 10). With the development of molecular imaging technology, 18F-fluoro-2-deoxy-glucose positron emission tomography/computed tomography (18F-FDG PET/CT) has been clinically applied in the staging, restaging, curative effect evaluation, and prognosis evaluation in GC, which is advantageous in evaluating tumor metabolism (11–13). However, the conventional 18F-FDG PET/CT diagnosis has the drawback of low sensitivity (<50%) for detecting LNM in GC, due to low spatial resolution and some lesions without obvious 18F-FDG uptake (14–16). Understanding these heterogeneities associated with tumor metabolic properties requires further analysis of the images. Radiomics analysis refers to the quantitative extraction of high-dimensional data from medical digital images to realize the non-invasive analysis of tumor heterogeneity (17), which gradually expanded to PET/CT imaging applications, and it is necessary to use radiomics to improve the accuracy of predicting LNM. Most of the radiomics research was based on CT or MR (18–20); there were few 18F-FDG PET/CT-based studies that would enable excellent prediction of LNM in GC. It is well known that the metabolic information obtained from 18F-FDG PET/CT in the primary tumors may reflect the biological aggressiveness and proliferative activity of the tumor, which is always related to tumor LNM (21). Furthermore, radiomics analysis based on 18F-FDG PET/CT is advantageous in that it can merge the metabolic information from 18F-FDG PET with the anatomical information from CT, so radiomics deeply explore the potential connection between medical images and LNM and may be more helpful to predict LNM than CT and MRI alone. Therefore, it is necessary to use radiomics based on 18F-FDG PET/CT from the primary tumor to improve the accuracy of predicting LNM.
The purpose of this study was to establish and estimate the value of the radiomics nomogram based on 18F-FDG PET/CT imaging for the individual preoperative prediction of LNM in GC.
Methods
Patient selection
A total of 224 GC patients were enrolled in the training cohort and internal validation cohort (n = 193) from the Third Affiliated Hospital of Soochow University (study center 1) and external validation cohort (n = 31) from the First People’s Hospital of Yancheng (study center 2) between January 2014 and December 2021. Inclusion criteria were 1) patients with a pathologically confirmed GC, 2) an interval of <15 days between surgery and PET/CT imaging, 3) PET/CT images met the analysis requirements, and 4) complete postoperative pathological and clinical data. Exclusion criteria were 1) subjects had undergone any anti-tumor treatment before surgery, 2) the number of lymph nodes removed was <16 by D2 lymphadenectomy, 3) subjects with multiple primary tumors, 4) subjects with a serious infection or diabetes, and 5) lesions were without obvious 18F-FDG uptake (study center 1 has 13 patients, and study center 2 has 1 patient) or the metabolic tumor volume (MTV) was less than 10 cm3 or voxels < 64 cannot meet the software requirements. The screening flowchart of the study population is shown in Figure 1.
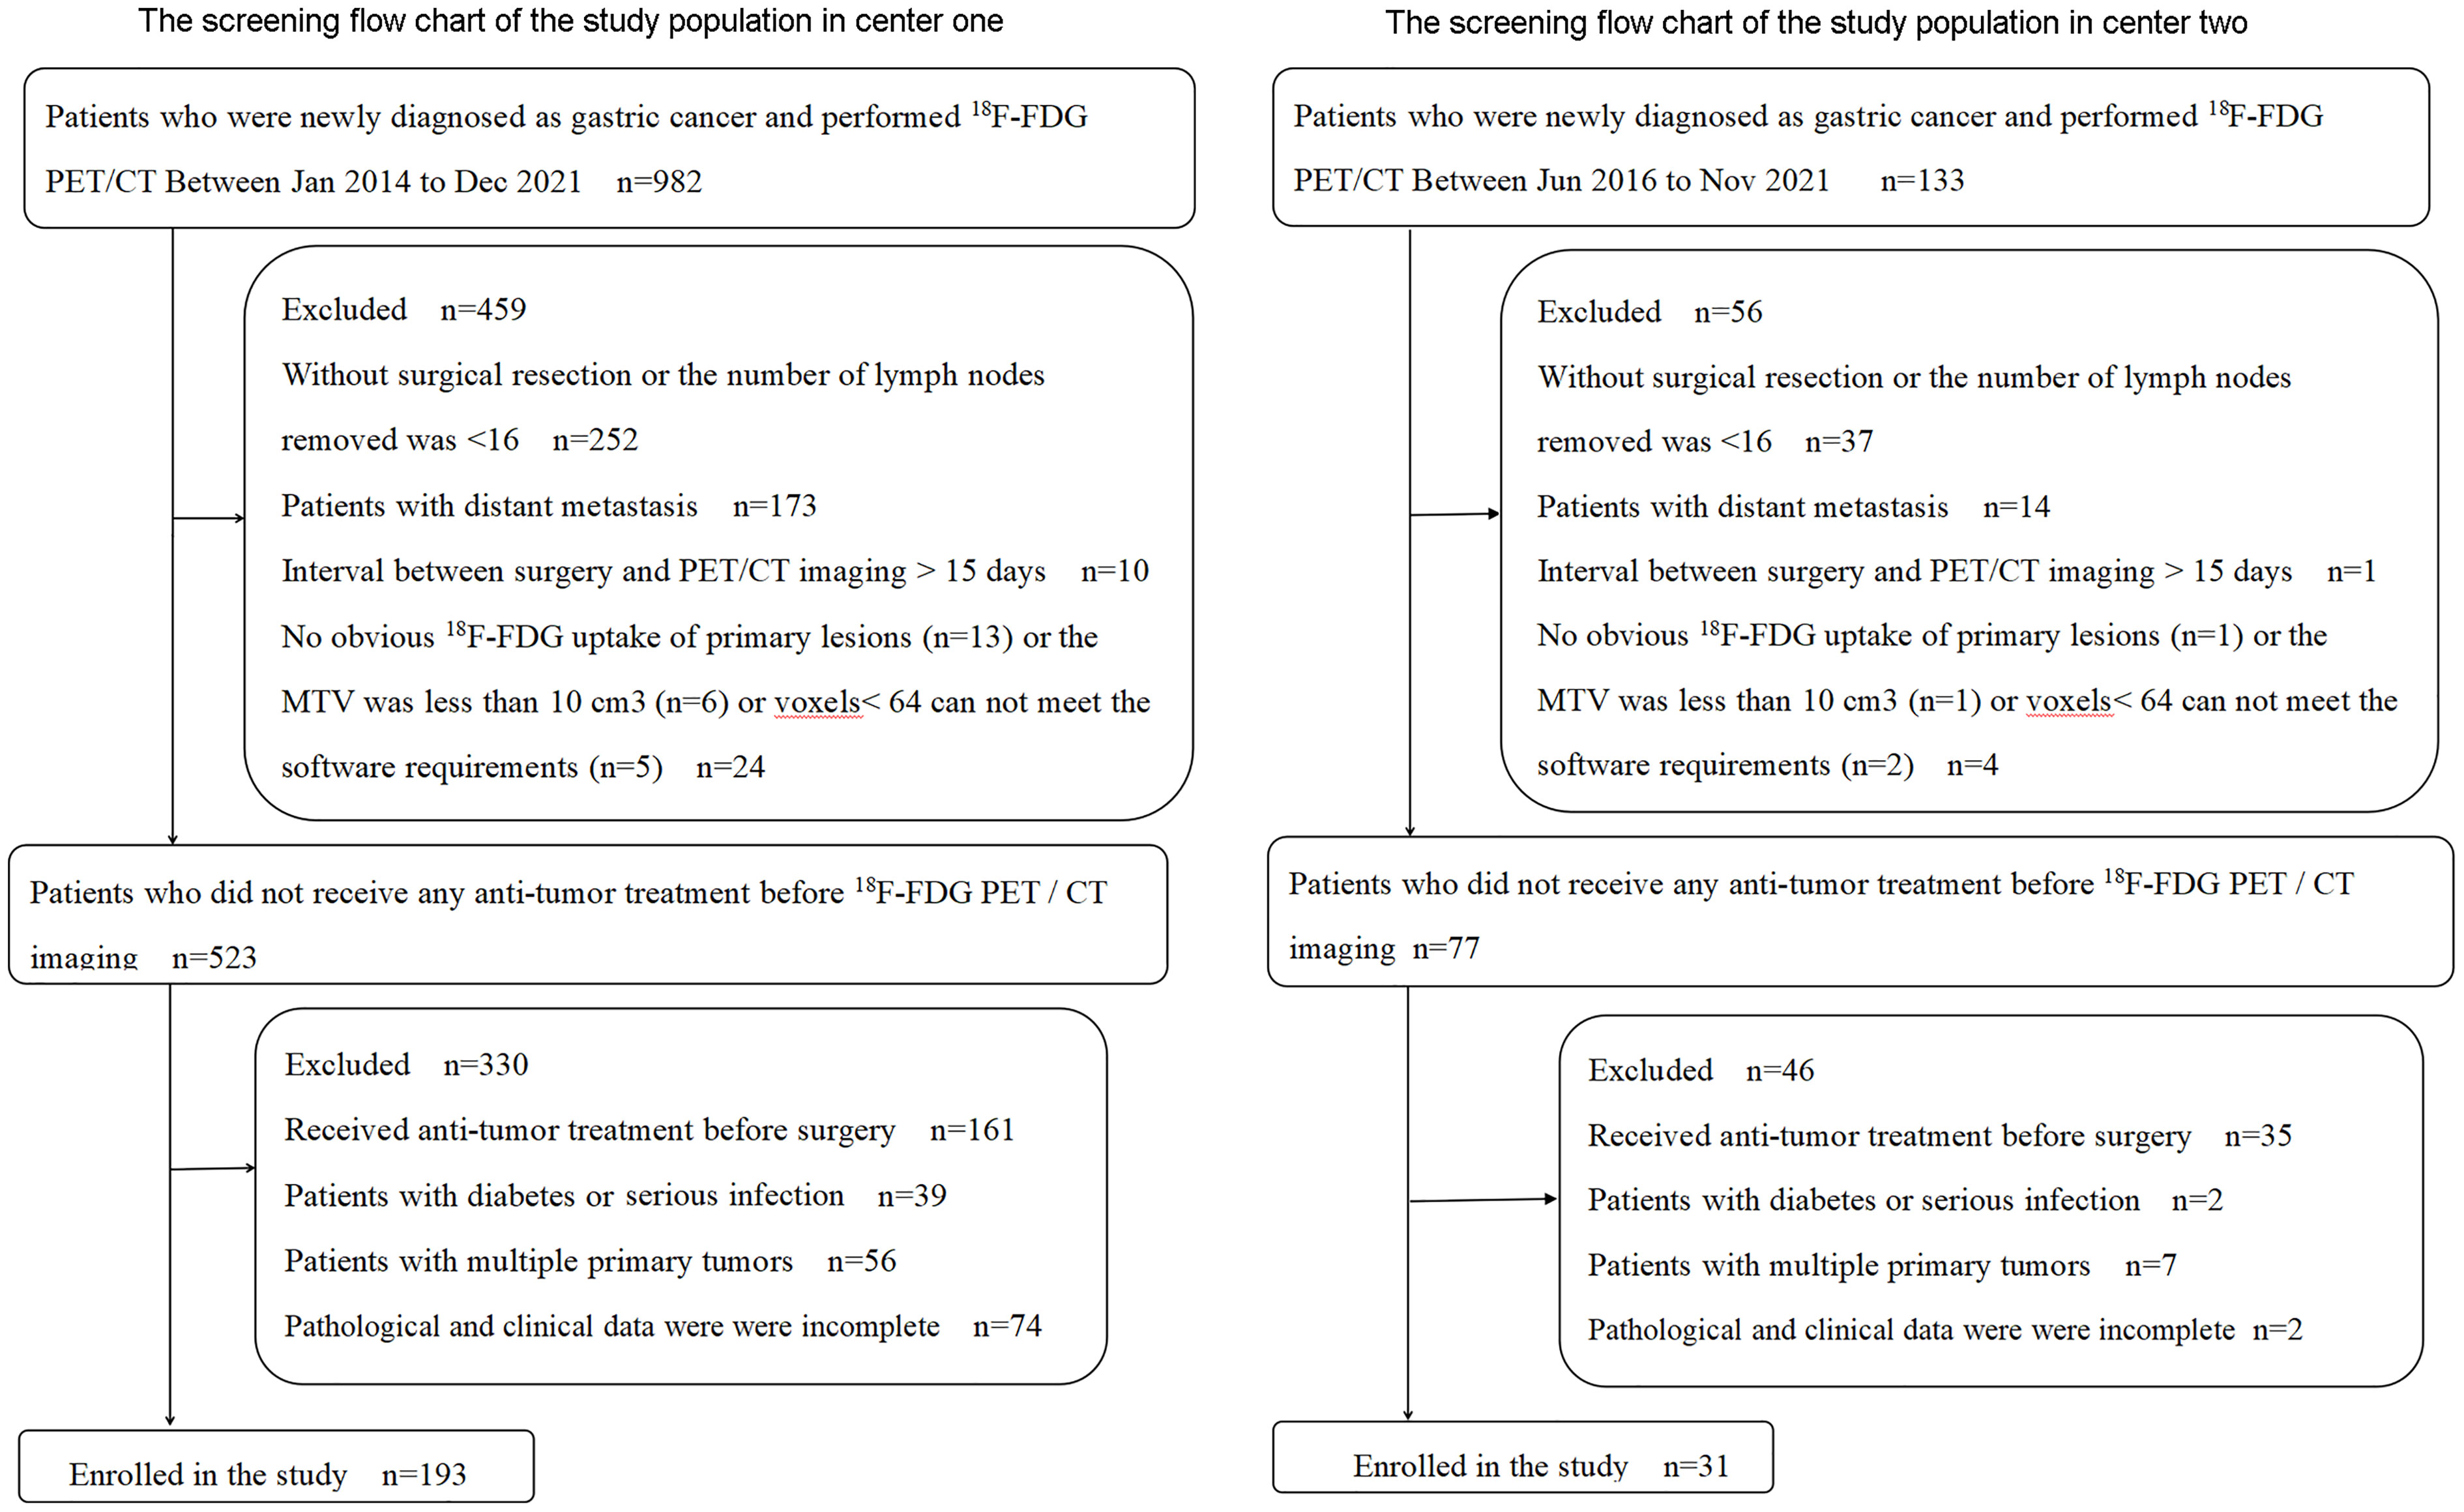
Figure 1 Flowchart of the study population.
Basic information, clinical data, and the postoperative pathology of all the subjects were collected, including gender, age, body mass index (BMI), primary tumor location, the state of lymph nodes, C-reactive protein (CRP), and preoperative tumor biomarkers including carbohydrate antigen (CA) 19-9 and carcinoembryonic antigen (CEA). The post-operative staging was evaluated based on the TNM 8th edition (22). The retrospective analysis was approved by the ethics committee of the Third Affiliated Hospital of Soochow University (study center 1) and the First People’s Hospital of Yancheng (study center 2). The requirement for informed consent was waived.
PET/CT imaging procedure
All patients underwent PET/CT after fasting for at least 6 h and were checked for blood glucose levels ≤ 10.0 mmol/L. Imaging acquisition began 1 h after 18F-FDG (radiochemical purity > 95%) was injected at a dose of 4.44 MBq/kg. The 18F-FDG of study center 1 and study center 2 was provided by JYAMS PET Research and Development Ltd. (Nanjing, China) and Shanghai Atom Kexing Pharmaceuticals Co., Ltd. (Shanghai, China), respectively. Images were obtained from the skull base to upper thighs using the same PET/CT equipment of the models (Biograph mCT 64 PET/CT system: Siemens Medical Solutions, Ann Arbor, MI, USA) in two study centers. All the subjects were instructed to drink at least 500 ml of water prior to PET/CT scanning. Low-dose CT scanning (study center 1: 35 mA/120 kV, 5-mm thickness; study center 2: automatic regulating current/120 kV, 5-mm thickness) was used for attenuation correction. PET images were obtained with an acquisition time of 2 min per bed position in a three-dimensional (3D) model and reconstructed by the ordered subset expectation maximization (OSEM).
The tumor site of primary tumors
In accordance with the previous studies (19, 21, 23), the stomach is divided into three parts (upper, middle, and lower) based on the tripartite connection of the greater curvature and the lesser curvature at the position of the coronal.
Imaging analysis and radiomics feature extraction
The PET/CT images in the two study centers were transferred to the LIFEx software in DICOM format. For PET/CT imaging, radiomics features were extracted by using the LIFEx software (version 6.0, http://www.lifexsoft.org ) from the volume of interest (VOI) of the primary tumor lesion (24). For PET images, we adopted the threshold of 40% of the SUVmax to semiautomatically define the VOI for the primary lesion. The segmentation correction was performed by two nuclear medicine doctors (Y.WJ outlined the VOI, and X.XQ checked it). If there is any dispute, they would discuss it with the third nuclear medicine doctor and solve it through negotiation. When the respiratory movement caused the mismatch between CT and PET images, the VOI of the primary lesion on the CT image was manually adjusted. Intensity discretization is for PET images and CT images (PET images, the continuous scale decreased to 64 bins with absolute scale bounds between 0 and 30; CT images, gray levels of 400 bins with absolute scale bounds between −10,000 and 3,000 HU). LIFEx software automatically extracted 136 textural features (PET, 71 features; CT, 65 features) from the VOI of the PET/CT image (Table 1). When using texture features of PET images to quantify the heterogeneity, it could be affected by the tumor volume effect, particularly in the focus zone, which is less than 10 cm3 (25); thus, we only conducted analyses for MTV greater than 10 cm3. The intra- and interobserver reproducibility and consistency of the PET/CT texture feature extraction were evaluated by intra- and interclass correlation coefficients (ICCs). ICC > 0.75 manifested a consistency of extraction properties.
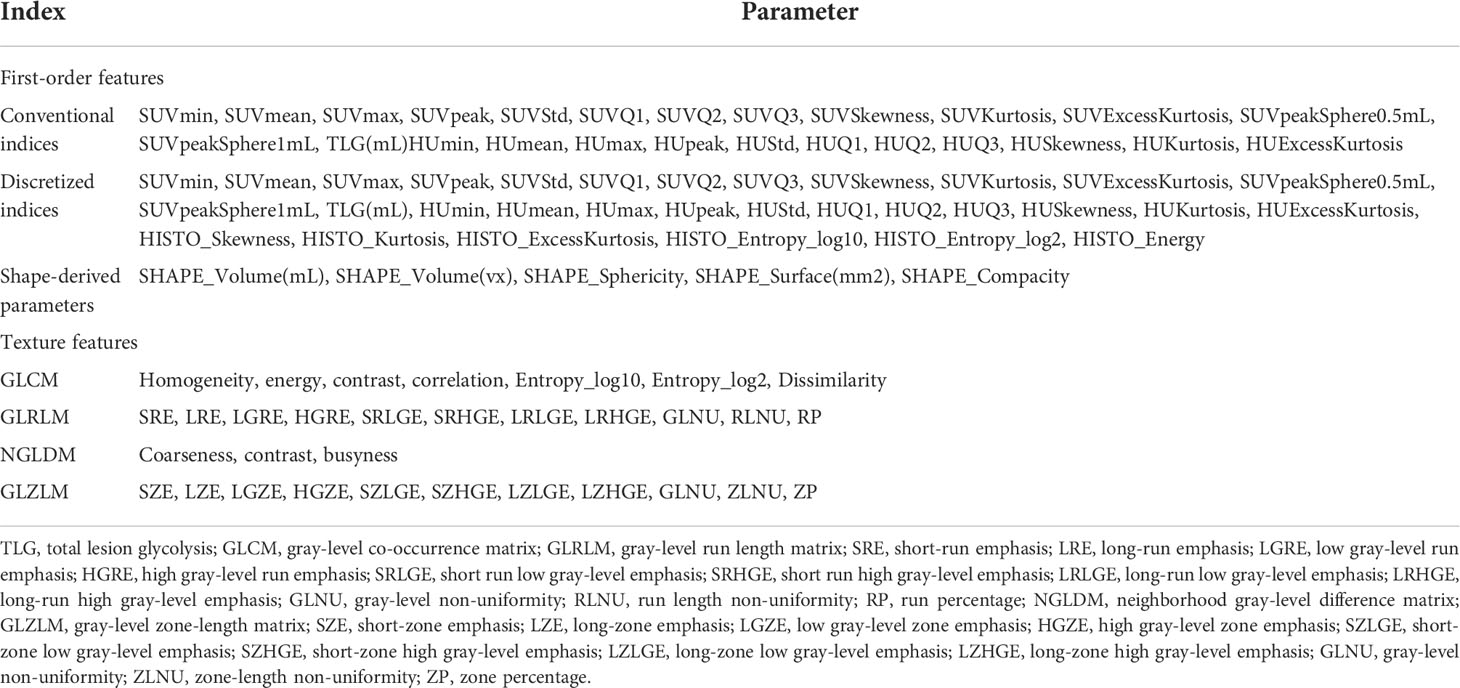
Table 1 PET/CT radiomics feature extraction of primary gastric cancer.
Radiomics feature selection and model construction
All the extracted radiomics features were standardized by Z-score, and the data were converted into a new score with an average value of 0 and a standard deviation of 1. Due to the relatively small sample size and the relatively large radiomics features, the Mann–Whitney U test was primarily applied to filter some features with significant differences between the LNM group and the no LNM (NLNM) group (p < 0.10). Then, the least absolute shrinkage and selection operator (LASSO) regression (26) was used to screen out the effective features, and the radiomics feature score (Rad-score) was calculated and established a radiomics prediction model. PET-score only included the PET radiomics feature, and PET/CT-score simultaneously contained the PET and CT radiomics feature. Multivariate logistic regression analysis was used to screen independent risk factors for LNM, and the minimum Akaike’s information criterion (AIC) was used to select the optimal model parameters to construct a radiomics nomogram.
The diagnosis of lymph node metastasis by conventional 18F-FDG PET/CT
The diagnosis of LNM in GC by conventional 18F-FDG PET/CT was defined as follows: the diameter of lymph nodes ≥ 10 mm on CT images or the 18F-FDG uptake of lymph nodes on PET images was similar to or higher than that of the liver (27).
Histopathological diagnostic criteria for lymph node metastasis
Conventional paraffin-embedded specimens were sectionalized at 4–5 μm continuously and stained with hematoxylin and eosin (H&E). The diagnostic criteria for LNM are the presence of carcinoma in the lymph node capsule. Each slice was interpreted separately by two pathologists. In case of disagreement, the third pathologist shall be invited to interpret it again. Finally, three pathologists will reach a consensus through consultation.
Statistical analysis
Continuous variables were indicated as mean±standard deviation(SD) or M (p25-p75), and categorical variables were indicated as frequency (%). We compared two groups using the Mann–Whitney U tests or independent t-tests for continuous variables. Pearson’s chi-square test or Fisher’s exact test was used for categorical variables. Univariate and multivariable logistic regression analyses were conducted to identify the independent risk factors for LNM. The collinearity between significant independent variables was evaluated using correlation coefficients β and variance inflation factors (VIFs), and only variables with correlation coefficients β < 0.25 or VIF < 5 were included. A violin plot was used to show the distribution and probability density of PET/CT-scores. Receiver operating characteristic (ROC) and decision curves were used to evaluate and validate the performance of nomograms for predicting LNM in the training cohort, internal validation cohort, and external validation cohort. Internal validation of the model and calculation of the 95% confidence interval (CI) of the area under the curve (AUC) were performed using the bootstrap resampling method (times = 500), which was recommended by the Tripod Reporting Specification (28). All the data analyses were conducted with R3.4.3 (http://www.R-project.org; software packages: glmnet, pROC, rms, dca. R). A two-sided p < 0.05 was considered statistically significant.
Results
Basic characteristics of the enrolled patients
Cases from study center 1 were randomly divided into a training cohort (n = 134) and an internal validation cohort (n = 59) in a 7:3 ratio. Baseline characteristics of the patients in the training cohort (n = 134), internal (n = 59), and external validation cohort (n = 31) are listed in Tables 2, 3. The clinical characteristics of patients were similar among the three cohorts (all p > 0.05): 66.4% (89/134), 66.1% (39/59), and 67.7% (21/31) patients have LNM in the training cohort, internal validation cohort, and external validation cohort, respectively. According to the postoperative pathological results, 649 of 2,989 LNs, 318 of 1,329 LNs, and 101 of 578 LNs were found to be positive for metastasis in the training cohort, internal validation cohort, and external validation cohort, respectively. The levels of CA19-9 and CEA included in the study were used as categorical variables. In the training cohort, the proportion of CA19-9 > 37 and PET/CT diagnosis positive in the LNM group were significantly higher than that of the NLNM group (17.98% vs. 2.22%, p = 0.01; 43.82% vs. 11.11%, p < 0.001). Other clinical factors, including age, gender, BMI, CEA, CRP, location of primary focus, and pathological type showed no significant differences between the two groups (p = 0.084–0.978). In the internal validation cohort, the proportion of CA19-9 > 37 in the LNM group was significantly higher than that in the NLNM group (20.51% vs. 0.00%, p = 0.029), and the other clinical characteristics were not significantly different between the two groups (p = 0.093–0.885). In the external validation cohort, there were no statistically significant differences between the LNM group and NLNM group in all clinical characteristics (p = 0.071–0.095).
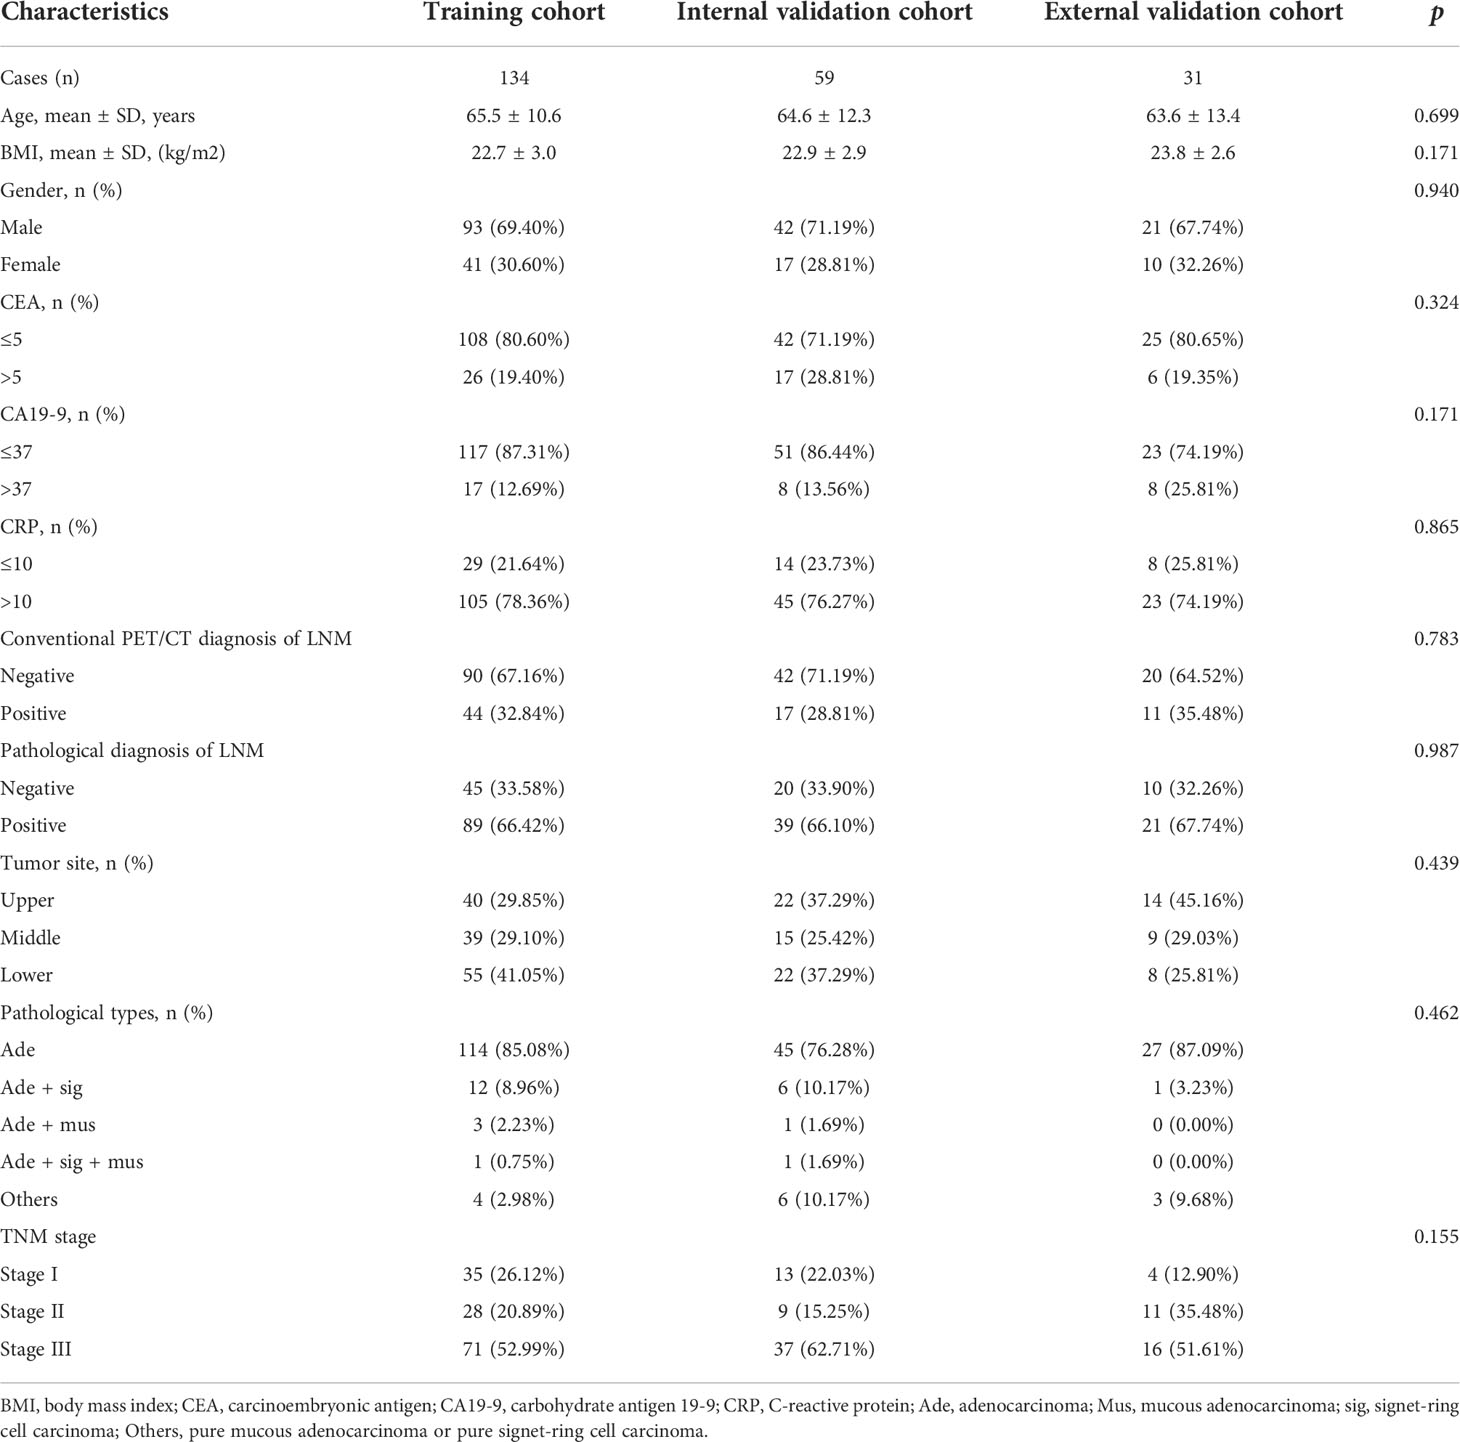
Table 2 Characteristics of the study patients in two centers.
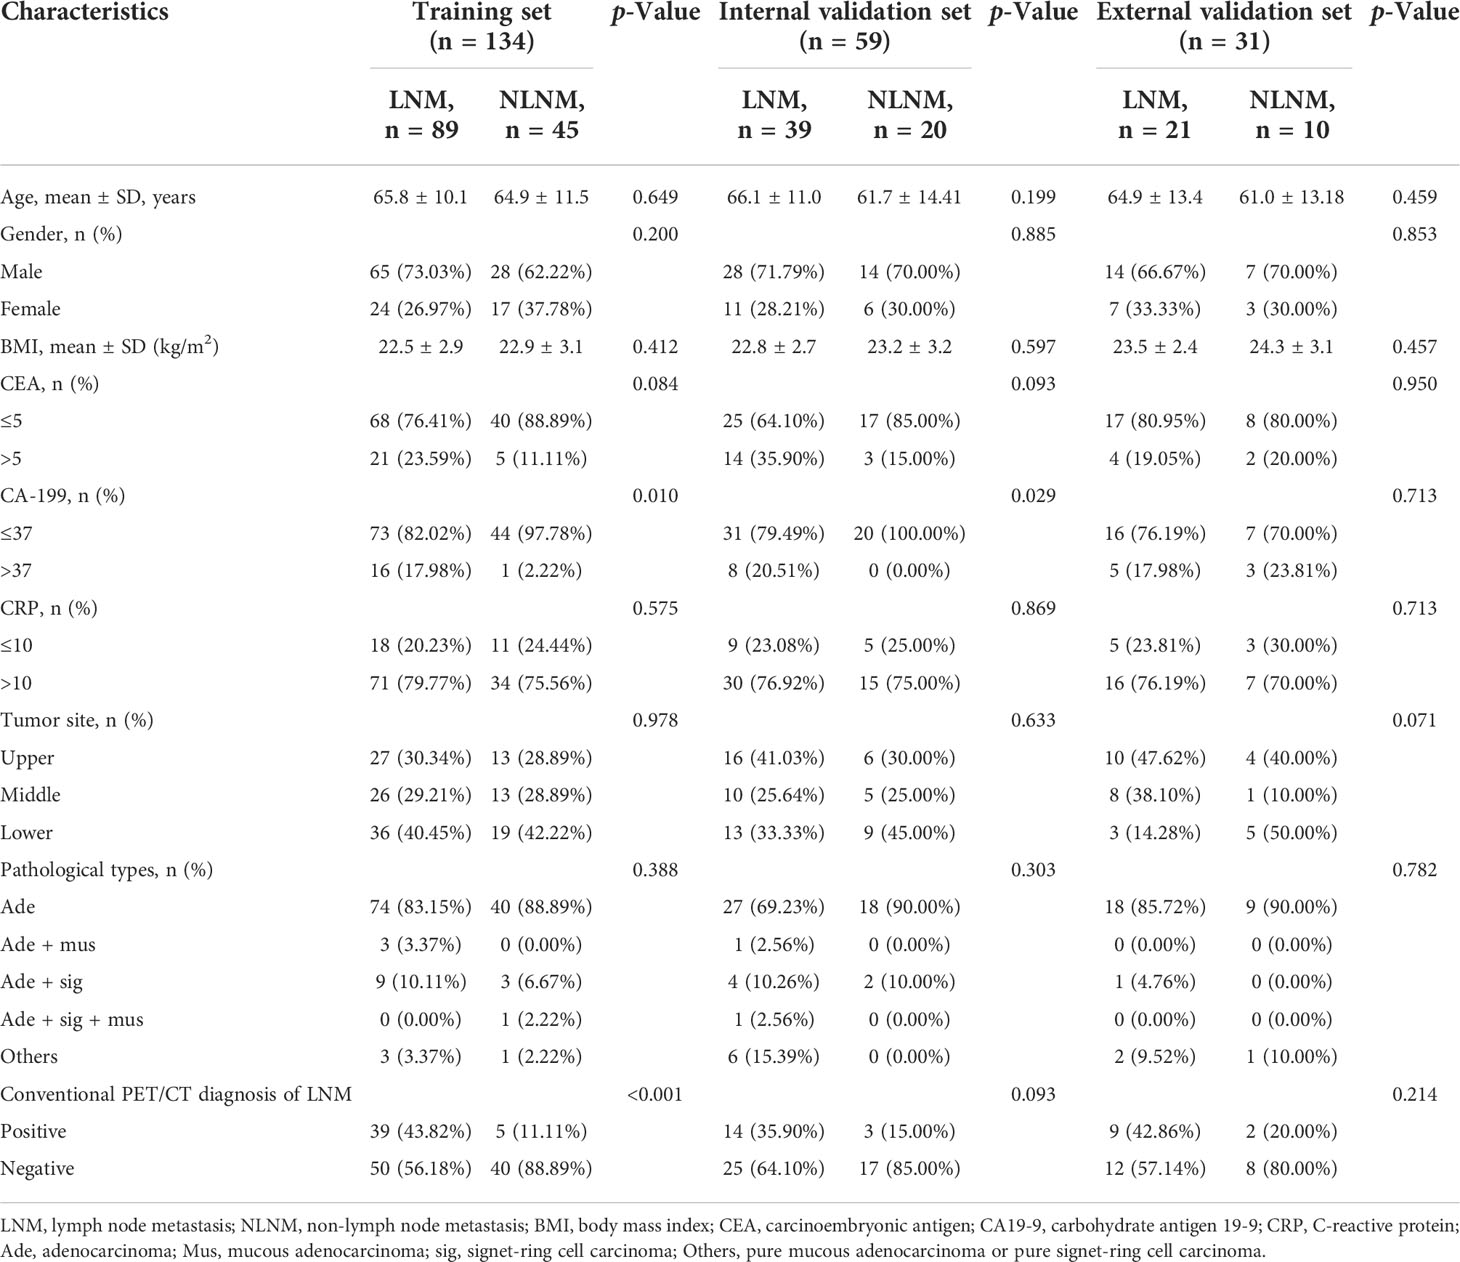
Table 3 Characteristics of patients in training cohort, internal validation cohort, and external validation cohort.
Feature extraction and selection
The intra-observer ICCs of the texture features were from 0.911 to 0.982, whereas the interobserver ICCs were from 0.961 to 0.990. Of the texture features, 136 features were reduced to 64 potential predictors on the basis of 193 patients in the training cohort. Then λ = 0.1122 with log (λ) = −2.1872 was chosen as the optimal value, and finally, the optimal λ resulted in two non-zero coefficients (Figure 2). The two non-zero coefficients included were GLZLM_SZE (PET feature) and CONVENTIONAL_HUQ3 (CT feature). The Rad-score of each patient was calculated by the following calculation formula:
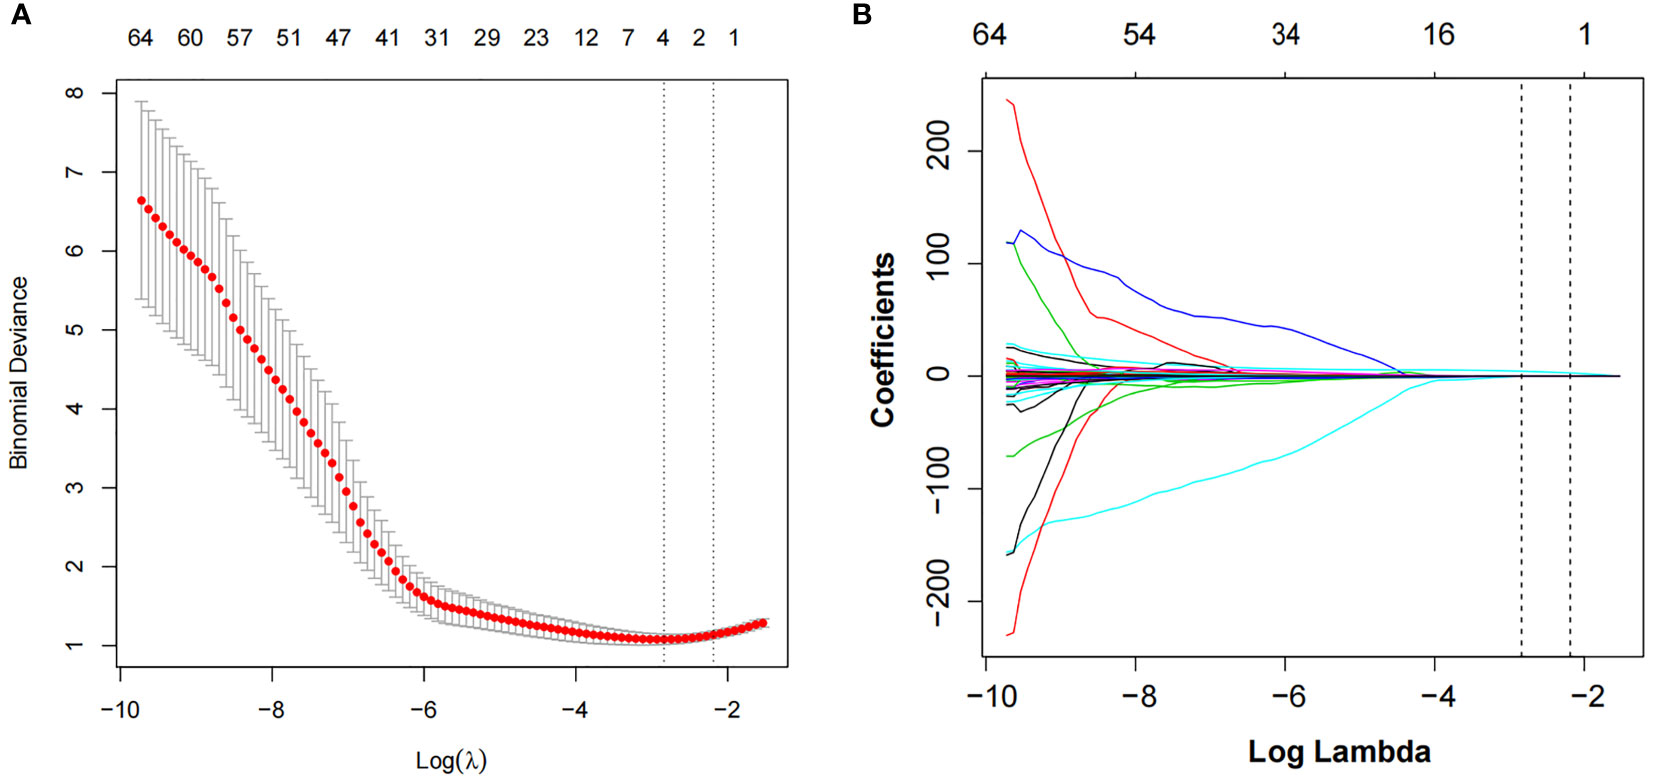
Figure 2 LASSO algorithm and 10-fold cross-validation to select the optimal texture features. (A) The tuning parameter (λ) in the LASSO model was selected using 10-fold cross-validation. The function of log(λ) is plotted by binomial deviances from the LASSO regression cross-validation. The black vertical line is plotted at the best values of λ for which the model provides the best matching of the data. λ = 0.1122 with log (λ) = −2.1872 was chosen as the optimal value. (B) LASSO coefficient profiles of the 64 radiomics features. The vertical line is the value selected using 10-fold cross-validation in panel A, where optimal λ resulted in two non-zero coefficients. LASSO, least absolute shrinkage and selection operator.
PET/CT-score = 2.74891 * GLZLM_SZE + 0.01145 * CONVENTIONAL_HUQ3
Comparison of PET-score and PET/CT-score in training cohort and verification cohort (internal and external)
The comparison of the PET-score and PET/CT-score between the LNM group and NLNM group in the training cohort, internal cohort, and external validation cohort is shown in Table 4. The results showed that PET-score and PET/CT-score in the LNM group were much higher than those in the NLNM group (p < 0.05 in the three cohorts). The PET-scores of the LNM group and NLNM group were (1.634 (1.311–1.875) vs. 1.173 (0.855–1.505), p < 0.001), (1.470 (1.264–1.691) vs. 1.092 (0.632–1.320), p < 0.001), and (1.486 (1.254–1.726) vs. 1.079 (0.806–1.297), p = 0.009) in the training cohort, internal validation cohort, and external validation cohort, respectively. The PET/CT-scores of the LNM group and NLNM group were [2.033 (1.767–2.287) vs. 1.474 (1.252–1.817), p < 0.001), (1.890 (1.693–2.093) vs. 1.518 (1.071–1.713), p < 0.001), and (1.852 (1.565–2.235) vs. 1.462 (1.194–1.736), p = 0.011] in the training cohort, internal validation cohort, and external validation cohort, respectively. The violin figure of the Rad-score is displayed in Figure 3.
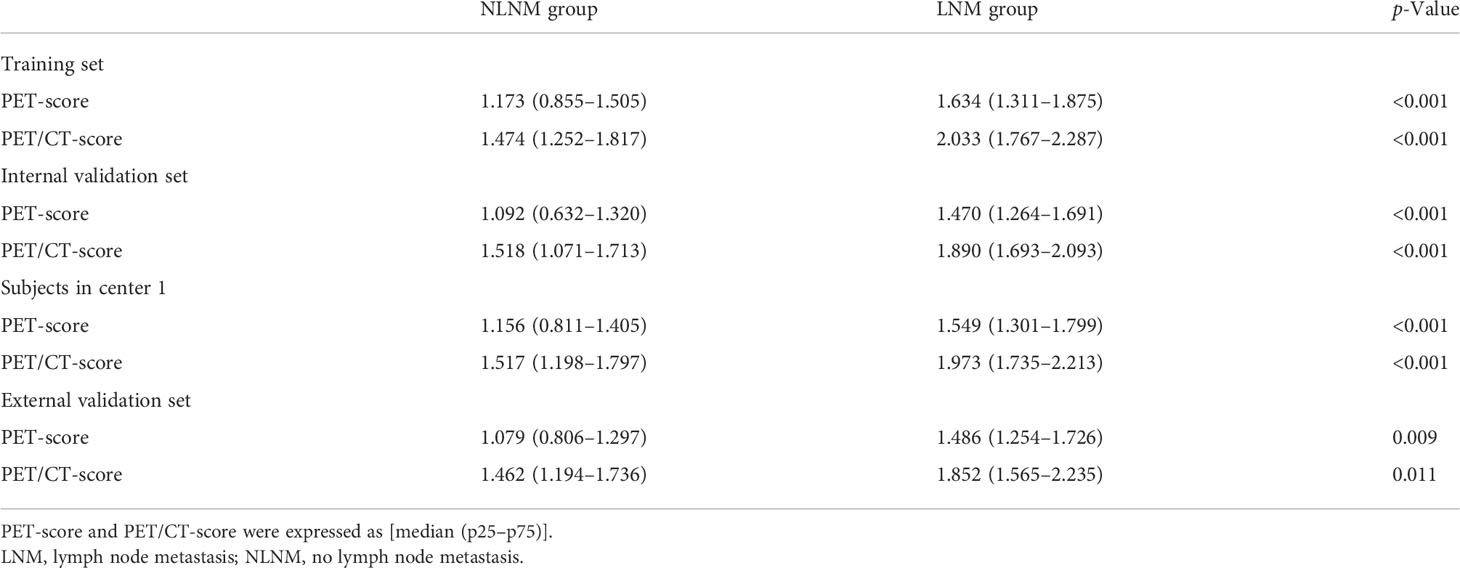
Table 4 Comparison between the PET-score and PET/CT-score in training set and verification set.
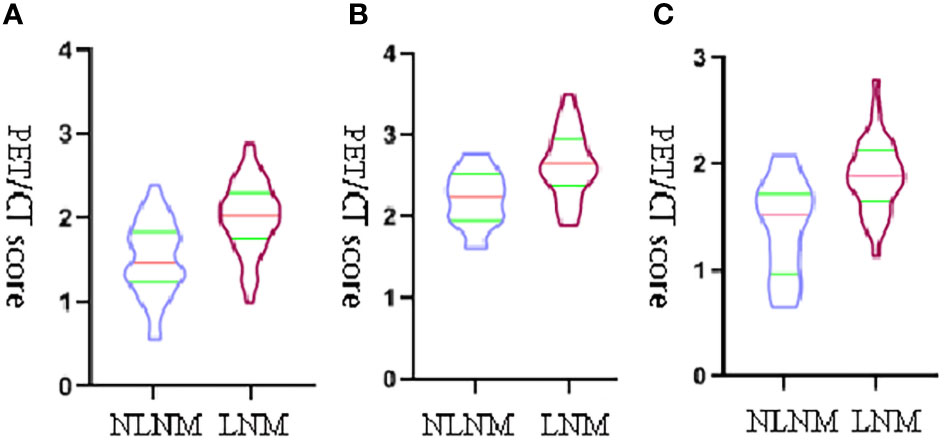
Figure 3 The violin figure of the PET/CT-score. The transverse axis represents the status of lymph nodes, and the vertical y-axis represents PET/CT-score. (A) The violin figure of the PET/CT-score between the LNM group and NLNM group in training set. (B) The violin figure of the PET/CT-score between the LNM group and NLNM group in internal validation set. (C) The violin figure of the PET/CT-score between the LNM group and NLNM group in external validation set.
Construction and verification of radiomics nomogram
Univariate and multivariate logistic regression results are shown in Table 5. Multivariate logistic regression showed that CA19-9 [OR (95% CI): 10.180 (1.267–81.831)], PET/CT diagnosis of LNM [OR (95% CI): 6.370 (2.256–17.984)], and PET/CT score [OR (95% CI): 16.536 (5.506–49.660)] were independent influencing factors of LNM in GC (all p < 0.05). Then, we constructed a radiomics nomogram, integrating CA19-9, PET/CT diagnosis of LNM, and PET/CT Rad-score, according to the AIC in the training cohort (Figure 4). The nomogram formula is as follows:
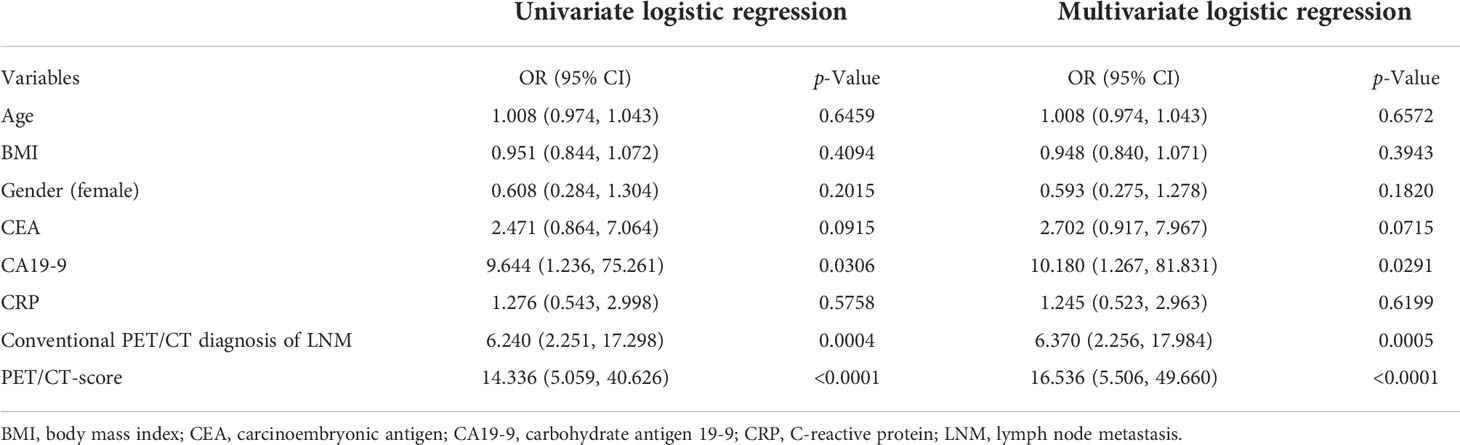
Table 5 Univariate and multivariate logistic regression analyses for lymph node metastasis.
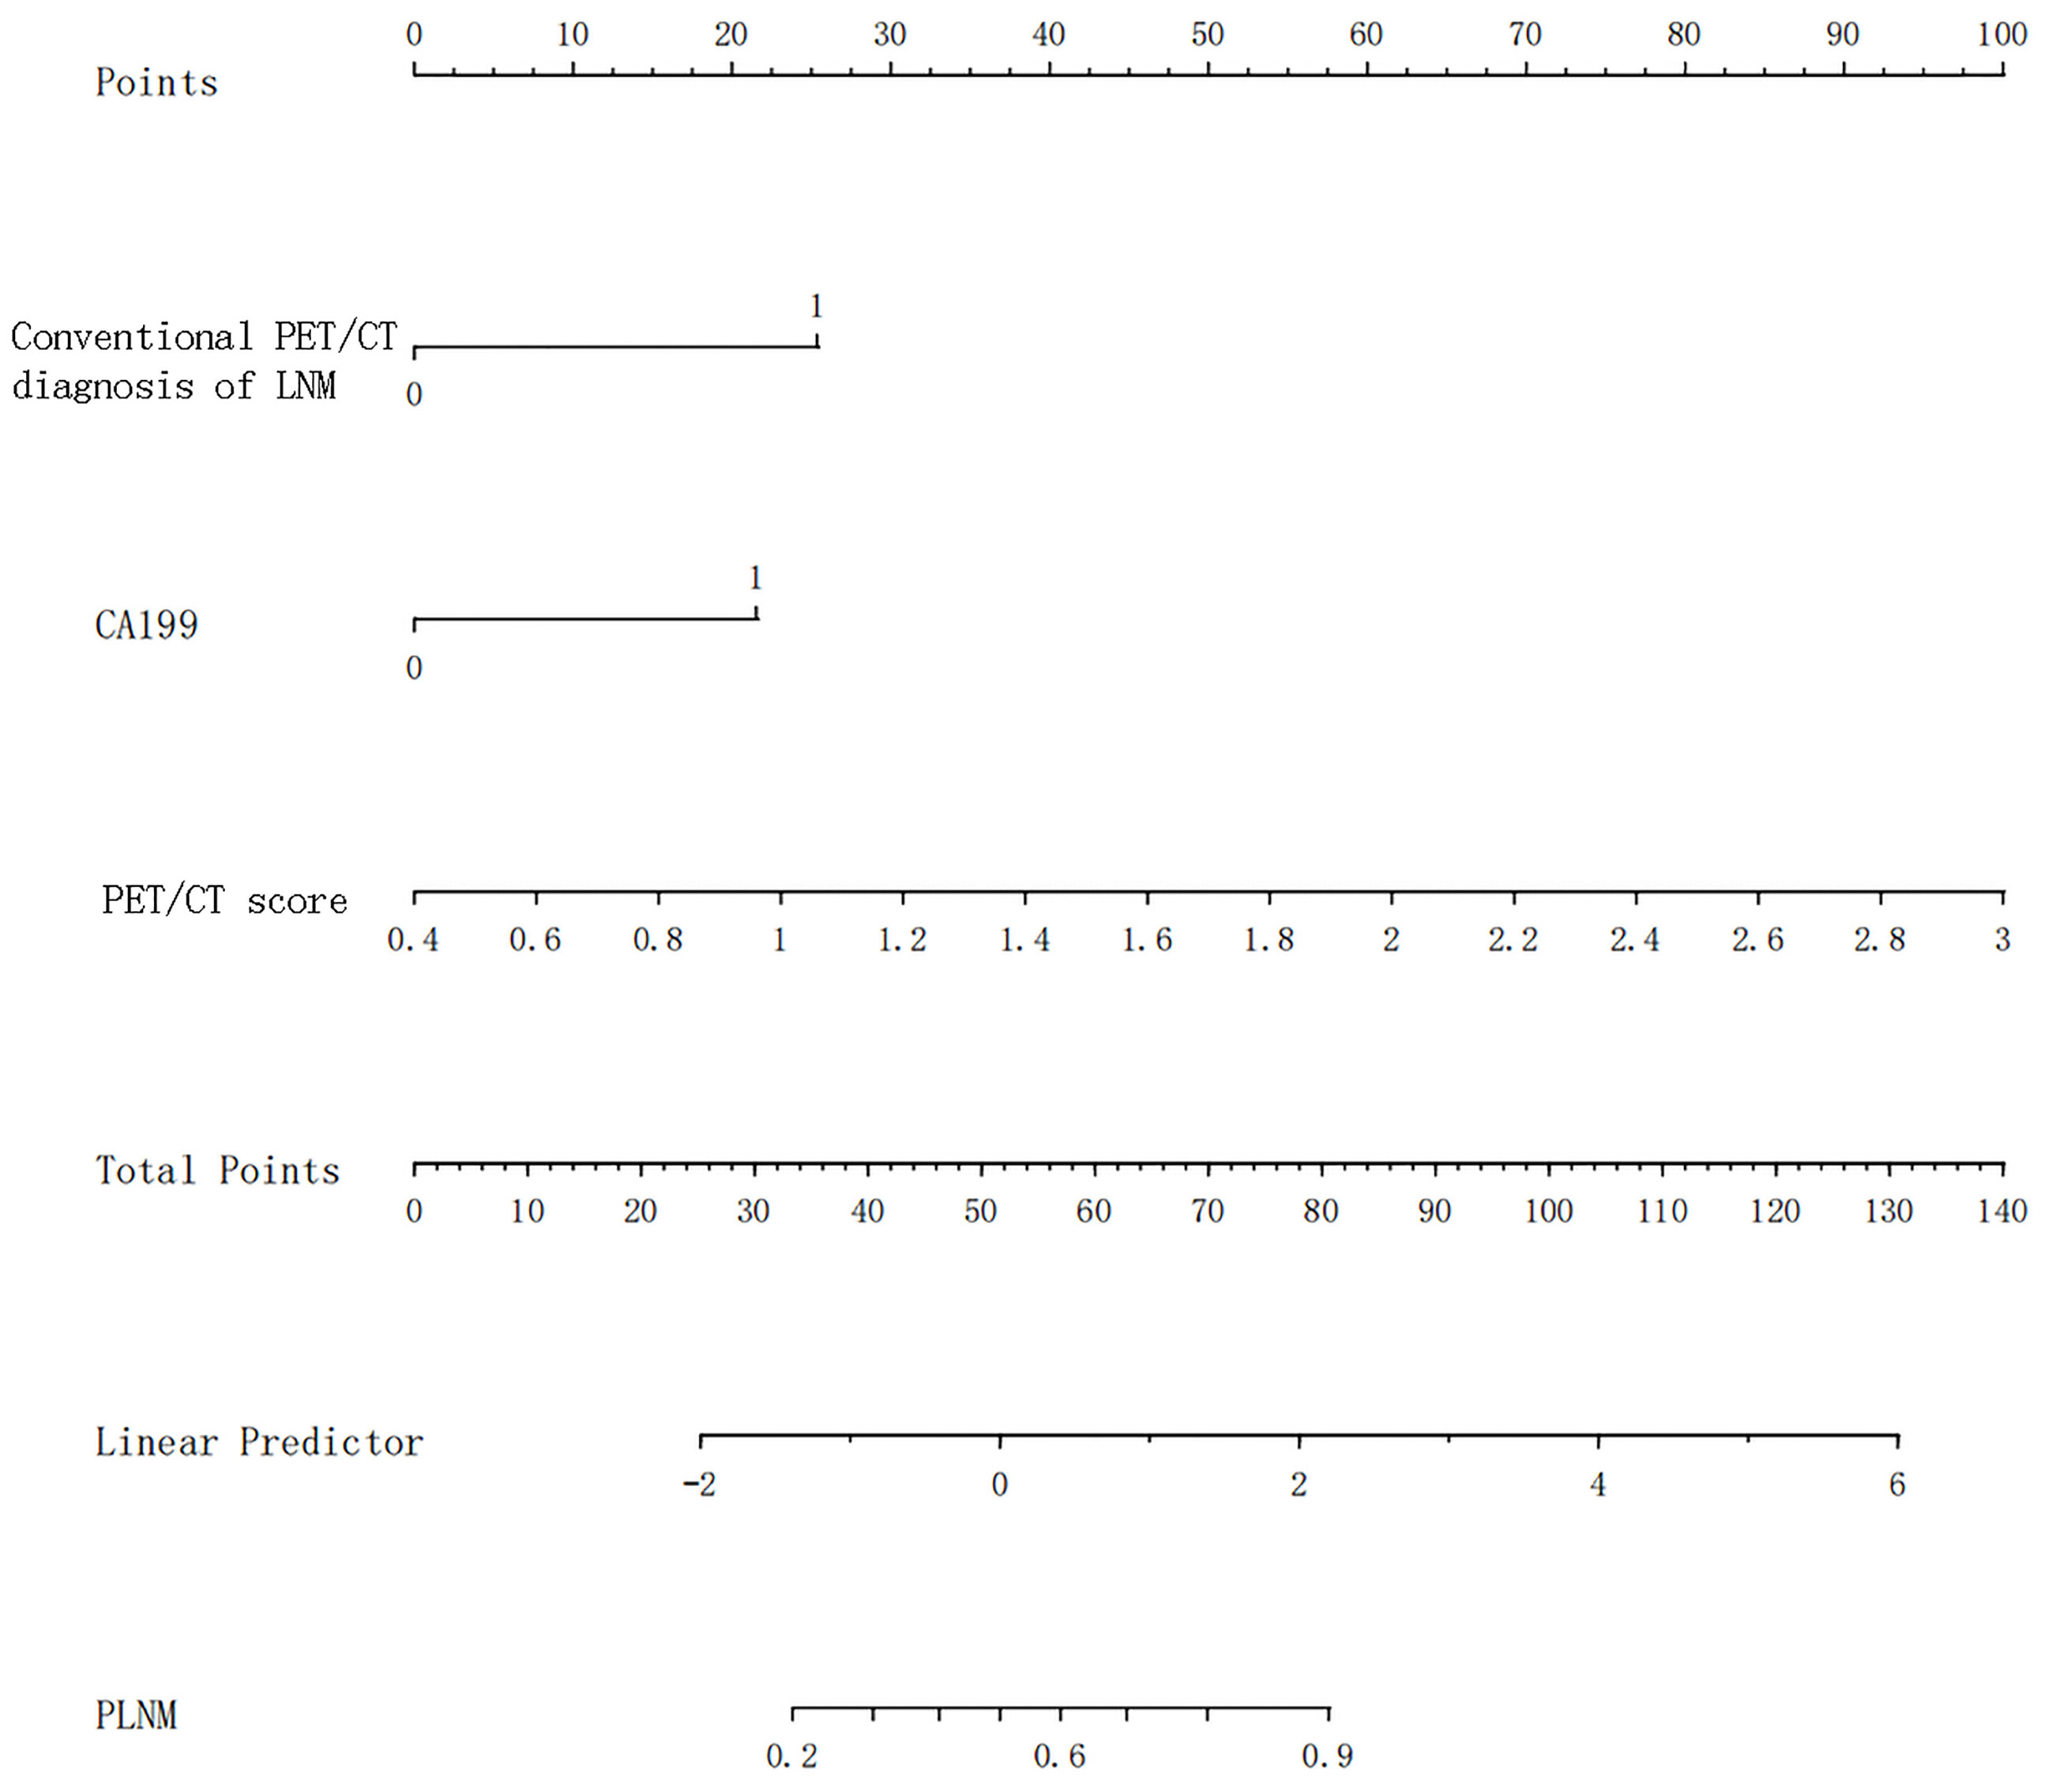
Figure 4 The nomogram for the prediction of LNM. LNM, lymph node metastasis.
Logit (LNM) = −5.08113 + 1.92293 * (traditional PET/CT diagnosis LNM = positive) + 1.63248 * (CA19-9 > 37) + 2.91691 * PET/CT-score
The diagnostic efficiency of each model in the training and verification cohorts is shown in Table 6 and Figure 5. The sensitivity, specificity, and accuracy of conventional PET/CT diagnosis of LNM for predicting LNM were 43.8%, 88.9%, and 58.9% in the training cohort; 35.9%, 85.0%, and 52.5% in the internal validation cohort; and 42.8%, 80.0%, and 54.8% in the external validation cohort, respectively. The AUCs for predicting LNM based on the 18F-FDG PET/CT-score in the training cohort, internal validation cohort, and external validation cohort were 0.792 (95% CI: 0.712–0.870), 0.803 (95% CI: 0.681–0.924), and 0.762 (95% CI: 0.579–0.945), respectively. The AUCs of radiomics nomogram for predicting LNM were 0.861 (95% CI: 0.799–0.924), 0.889 (95% CI: 0.800–0.976), and 0.897 (95% CI: 0.683–0.948) in the training, internal validation, and external validation cohorts, respectively. The sensitivity, specificity, and accuracy of the radiomics nomogram for predicting LNM were 85.4%, 71.1%, and 80.6% in the training cohort; 82.1%, 85.0%, and 83.1% in the internal validation cohort; and 95.2%, 80.0%, and 90.3% in the external validation cohort, respectively. Radiomics nomogram shows significant advantage over PET/CT alone and radiomics for predicting LNM in GC, with a remarkable improvement of sensitivity and AUC in the training cohort (sensitivity: 85.4% vs. 74.2% vs. 43.8%, respectively; AUC: 0.861 vs. 0.792 vs. 0.664, respectively), internal validation cohort (sensitivity: 82.1% vs. 74.4% vs. 35.9%, respectively; AUC: 0.889 vs. 0.803 vs. 0.605, respectively), and external validation cohort (sensitivity: 95.2% vs. 71.4% vs. 42.8%, respectively; AUC: 0.897 vs. 0.762 vs. 0.614, respectively), while the specificity slightly decreased. Decision curve analysis (DCA) showed that the PET/CT radiomics nomogram had a higher net benefit than the PET/CT-score across the majority of the range of reasonable threshold probabilities in the training and validation cohorts, which indicated that the radiomics nomogram based on 18F-FDG PET/CT radiomics has good clinical utility (Figure 6).
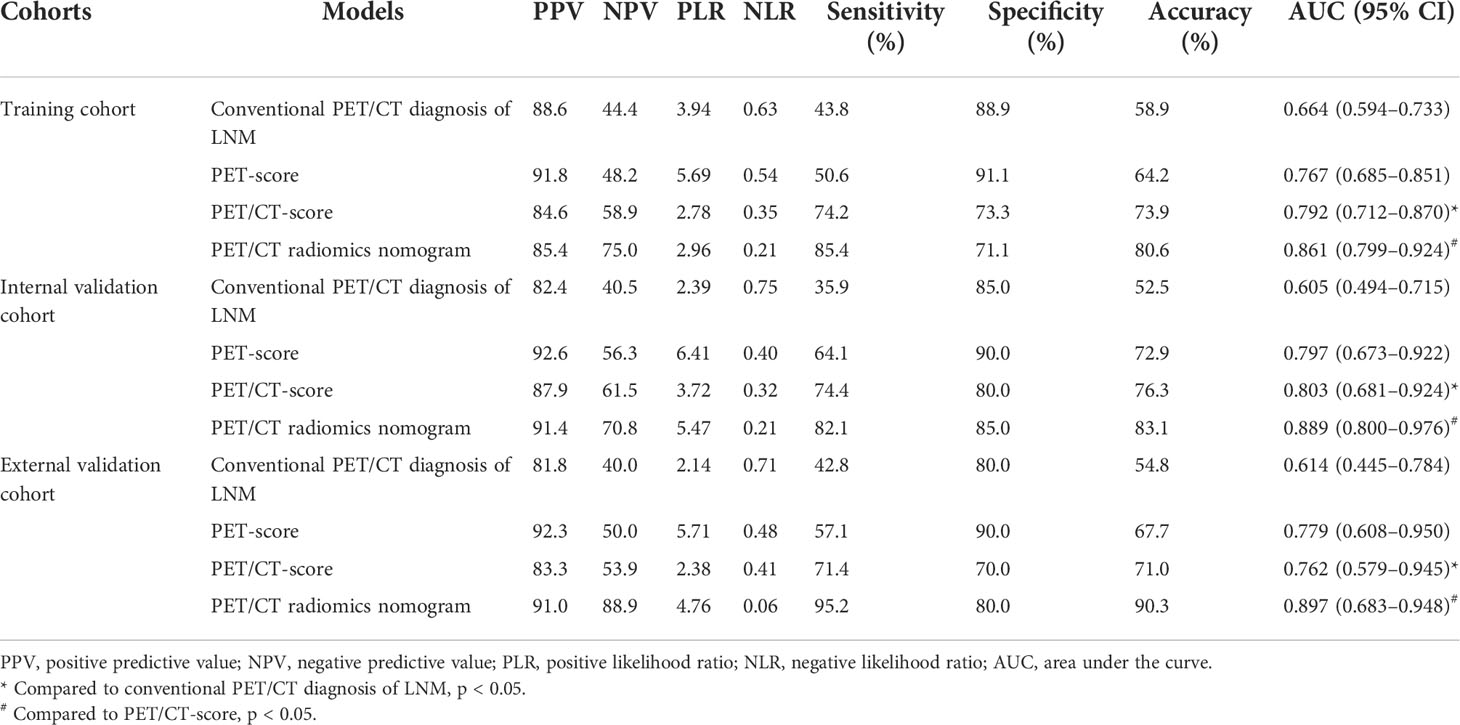
Table 6 Diagnostic efficiency of each model in training and verification cohorts.
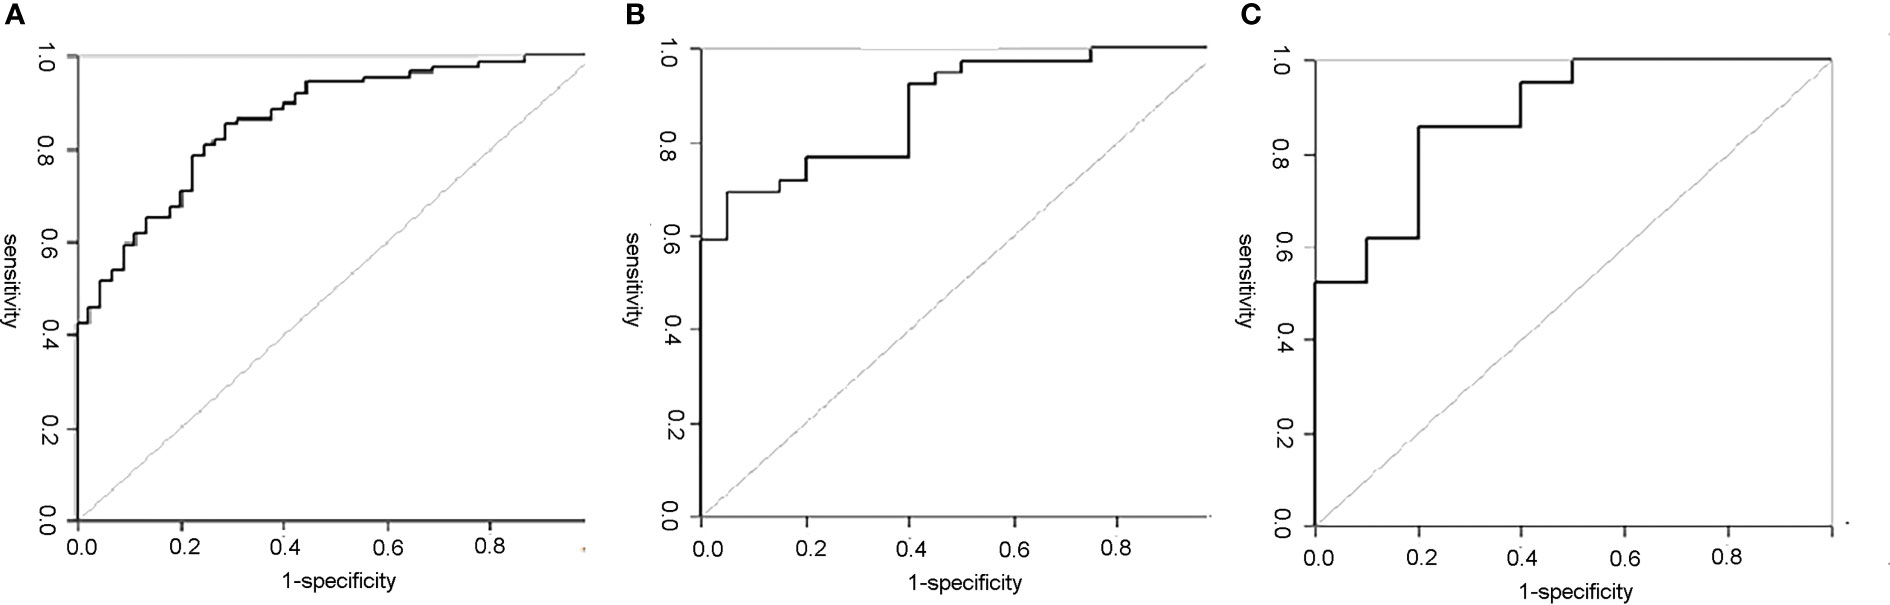
Figure 5 ROC curves of the PET/CT radiomics nomogram in each cohort. (A) The ROC curve of the PET/CT radiomics nomogram for predicting LNM in training set; the AUC was 0.861. (B) The ROC curve of the PET/CT radiomics nomogram for predicting LNM in internal validation set; the AUC was 0.889. (C) The ROC curve of the PET/CT radiomics nomogram for predicting LNM in external validation set; the AUC was 0.897. ROC, receiver operating characteristic; LNM, lymph node metastasis; AUC, area under the curve.
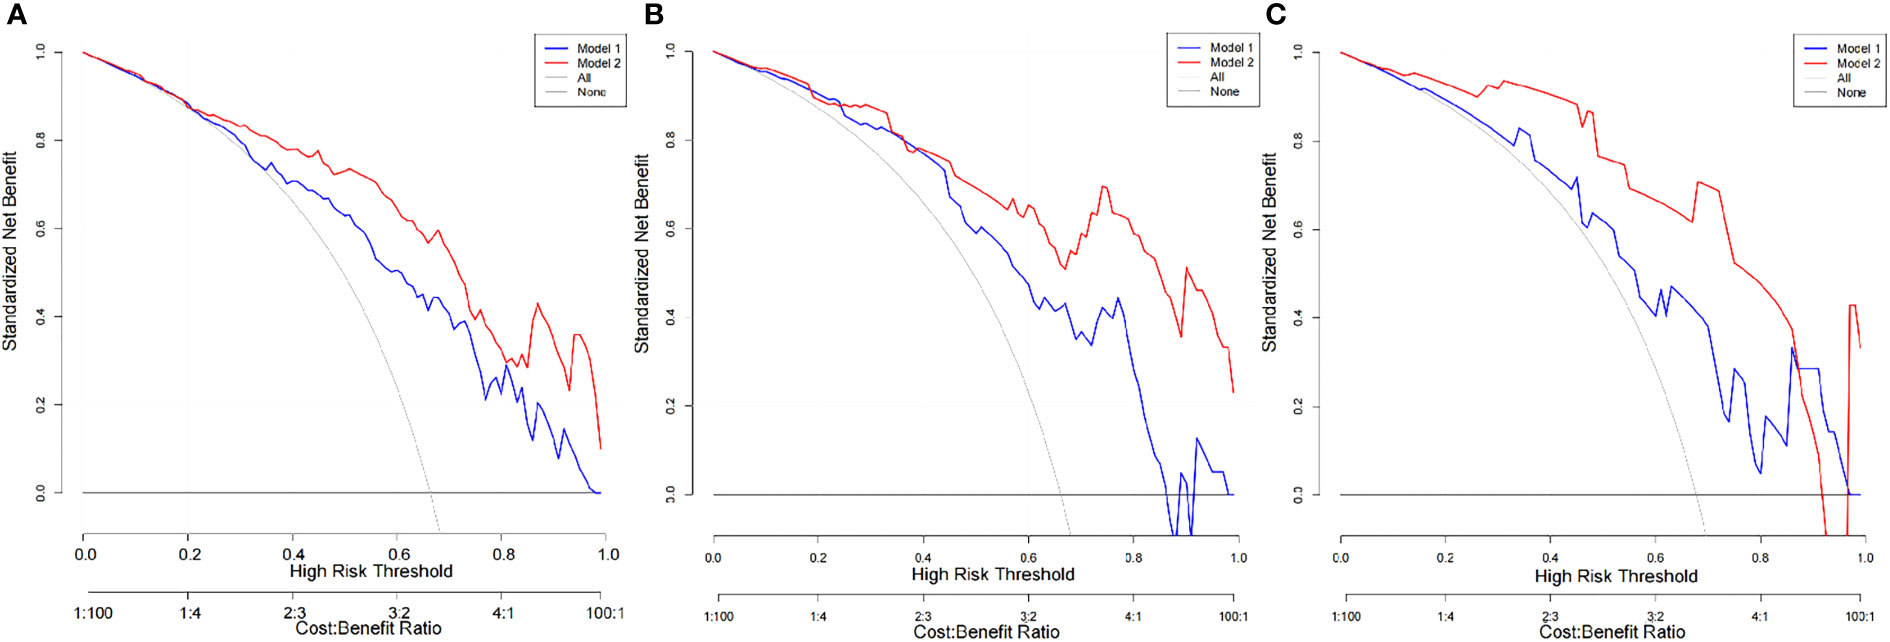
Figure 6 DCA of the PET/CT-score and PET/CT radiomics nomogram in each cohort. (A) DCA of the PET/CT-score and PET/CT radiomics nomogram in training set (Model 1, PET/CT-score; Model 2, PET/CT radiomics nomogram). (B) DCA of the PET/CT-score and PET/CT radiomics nomogram in internal validation set (Model 1, PET/CT-score; Model 2, PET/CT radiomics nomogram). (C) DCA of the PET/CT-score and PET/CT radiomics nomogram in external validation set (Model 1: PET/CT-score; Model 2: PET/CT radiomics nomogram). DCA, decision curve analysis.
Discussion
In the present study, we constructed a radiomics nomogram by combining 18F-FDG PET/CT radiomics signatures and traditional clinical risk factors (CA19-9 and conventional PET/CT diagnosis of LNM), which provides additional information for 18F-FDG PET/CT alone and radiomics alone for preoperatively evaluating LNM of GC, with higher AUC and sensitivity than 18F-FDG PET/CT alone and radiomics alone in the training cohort, the internal validation cohort, and the external validation cohort. Our results concluded that the radiomics nomogram could be used to predict LNM of GC preoperatively, making up for the deficiency of conventional 18F-FDG PET/CT diagnostic sensitivity, which is helpful for risk stratification, preoperative individualized assessment, and guiding treatment decisions.
18F-FDG PET/CT can quantitatively assess the glucose metabolism and reflect the total tumor burden, biologic aggressiveness, and proliferative activity of the primary tumor, which is always related to tumor LNM (15). The PET/CT radiomics features screened in this study included PET texture features (GLZLM-SZE) and CT routine parameter (CONVENTIONAL-HUQ3). The PET/CT-score increased with the increase in GLZLM-SZE and CONVENTIONAL-HUQ3, and compared with CONVENTIONAL-HUQ3 by CT, the GLZLM-SZE obtained by PET is more weighted. It may be due to the tumor cells ingesting a large amount of glucose, relying on glycolysis as the main source of energy metabolism, and converting glucose into lactate to generate adenosine triphosphate (ATP) to supply energy, leading to the malignant proliferation of tumor cells. This abnormal energy metabolism appears earlier than the morphological changes, and the radiomics features extracted by 18F-FDG PET can visualize and quantify the heterogeneity of energy metabolism sensitively, early, and specifically.
Other studies (29–31) also have shown that the combination of CT anatomical images and PET metabolic images for radiomics analysis is more effective in differential diagnosis and prognosis evaluation of diseases than PET alone, and the accuracy of predicting LNM is significantly better than that of conventional PET/CT diagnosis. Recently, a study using 18F-FDG PET/CT radiomics features (31) randomly assigned 185 patients with GC to the training cohort and verification cohort in a ratio of 8:2 and established BalancedBagging ensemble classifier for predicting LNM in GC. Although it has different sample sizes and methodology, the PET/CT-score for predicting LNM preoperatively in the present study is similar to that of the aforementioned study (31). In clinical practice, adequate analysis of clinical and imaging data can contribute to the correct diagnosis and management of GC, so we further combined PET/CT radiomics features with clinical risk factors to construct a radiomics nomogram to predict LNM. Previous studies have shown that radiomics nomograms can effectively predict LNM in GC patients (32, 33). However, most of them were based on postoperative parameters, such as tumor histological differentiation and vascular invasion, leading to poor clinical practicability. Our study established a radiomics nomogram for predicting LNM with PET/CT-score and two preoperative factors in GC. Incorporating CA19-9, conventional PET/CT diagnosis of LNM and PET/CT-score, the easy-to-use radiomics nomogram may be more accurate to predict LNM, improve the application of PET/CT imaging technology, and facilitate risk stratification as well as individualized treatment of GC patients. The DCA indicated that the nomogram had clinical practicability for predicting LNM in GC patients, which is conducive to the selection of perioperative treatment plan, individualized operation, and the scope of lymph node dissection.
There are some limitations of our study: firstly, the retrospective study was performed in two centers, and the sample size of the external validation group was relatively small, which may result in selective bias. Furthermore, the lesions without significant 18F-FDG uptake were excluded, and further studies should be performed to elucidate the function of the radiomics nomogram based on PET/CT in a subgroup of different pathological types. In the present study, 66.10%–67.74% of patients had LNM at diagnosis. These results are similar to or lower than those of previous reports (16, 18) and also similar to those of a clinical study on 1,456 cases of GC with LNM in China (72.9% of patients had LNM) (34); this reflects the real situation of Chinese patients with GC. Secondly, we focused on identifying the presence of LNM, without investigating the N-stage (N0 and N1–N3b) and the location of metastatic lymph nodes (16 stations). Thirdly, we applied the traditional radiomics method, and there may be an overfitting effect in the process of data processing.
Conclusion
The radiomics nomogram based on the primary tumor of 18F-FDG PET/CT could be conveniently applied to facilitate the preoperative individualized prediction of LNM in GC, which has high external applicability and clinical practicability. Future multi-center and multi-disciplinary studies are warranted to verify the robustness of the radiomics nomogram.
Data availability statement
The raw data supporting the conclusions of this article will be made available by the authors, without undue reservation.
Author contributions
All authors were involved in drafting the article or revising it critically for important intellectual content, and all authors approved the final version to be published. Prof. Y-TW had full access to all of the data and takes responsibility for the accuracy of the data analysis. Study conception and design: X-QX and W-JY. Acquisition of data: XS. Analysis and interpretation of data: X-LS. All authors contributed to the article and approved the submitted version.
Conflict of interest
The authors declare that the research was conducted in the absence of any commercial or financial relationships that could be construed as a potential conflict of interest.
Publisher’s note
All claims expressed in this article are solely those of the authors and do not necessarily represent those of their affiliated organizations, or those of the publisher, the editors and the reviewers. Any product that may be evaluated in this article, or claim that may be made by its manufacturer, is not guaranteed or endorsed by the publisher.
References
1. Sung H, Ferlay J, Siegel RL, Laversanne M, Soerjomataram I, Jemal A. Et al, global cancer statistics 2020: GLOBOCAN estimates of incidence and mortality worldwide for 36 cancers in 185 countries. CA Cancer J Clin (2021) 71:209–49. doi: 10.3322/caac.21660
2. Feng RM, Zong YN, Cao SM, Xu RH. Current cancer situation in China: good or bad news from the 2018 global cancer statistics? Cancer Commun (Lond) (2019) 39:22. doi: 10.1186/s40880-019-0368-6
3. Noh SH, Park SR, Yang HK, Chung HC, Chung IJ, Kim SW, et al. Adjuvant capecitabine plus oxaliplatin for gastric cancer after D2 gastrectomy (CLASSIC): 5-year follow-up of an open-label, randomised phase 3 trial. Lancet Oncol (2014) 15:1389–96. doi: 10.1016/s1470-2045(14)70473-5
4. Deng JY, Liang H. Clinical significance of lymph node metastasis in gastric cancer. World J Gastroenterol (2014) 20:3967–75. doi: 10.3748/wjg.v20.i14.3967
5. Jiang Y, Li T, Liang X, Hu Y, Huang L, Liao Z, et al. Association of adjuvant chemotherapy with survival in patients with stage II or III gastric cancer. JAMA Surg (2017) 152:e171087. doi: 10.1001/jamasurg.2017.1087
6. Jiang Y, Zhang Q, Hu Y, Li T, Yu J, Zhao L, et al. ImmunoScore signature: A prognostic and predictive tool in gastric cancer. Ann Surg (2018) 267:504–13. doi: 10.1097/sla.0000000000002116
7. Wang FH, Shen L, Li J, Zhou ZW, Liang H, Zhang XT, et al. The Chinese society of clinical oncology (CSCO): clinical guidelines for the diagnosis and treatment of gastric cancer. Cancer Commun (Lond). (2019) 39:10. doi: 10.1186/s40880-019-0349-9
8. Kwee RM, Kwee TC. Imaging in assessing lymph node status in gastric cancer. Gastric Cancer. (2009) 12:6–22. doi: 10.1007/s10120-008-0492-5
9. Huang YQ, Liang CH, He L, Tian J, Liang CS, Chen X, et al. Development and validation of a radiomics nomogram for preoperative prediction of lymph node metastasis in colorectal cancer. J Clin Oncol (2016) 34:2157–64. doi: 10.1200/jco.2015.65.9128
10. Ito S, Sano T, Mizusawa J, Takahari D, Katayama H, Katai H, et al. A phase II study of preoperative chemotherapy with docetaxel, cisplatin, and s-1 followed by gastrectomy with D2 plus para-aortic lymph node dissection for gastric cancer with extensive lymph node metastasis: JCOG1002. Gastric Cancer. (2017) 20:322–31. doi: 10.1007/s10120-016-0619-z
11. Kim J, Lim ST, Na CJ, Han YH, Kim CY, Jeong HJ, et al. Pretreatment f-18 FDG PET/CT parameters to evaluate progression-free survival in gastric cancer. Nucl Med Mol Imaging. (2014) 48:33–40. doi: 10.1007/s13139-013-0243-3
12. Lee JW, Lee SM, Son MW, Lee MS. Diagnostic performance of FDG PET/CT for surveillance in asymptomatic gastric cancer patients after curative surgical resection. Eur J Nucl Med Mol Imaging. (2016) 43:881–8. doi: 10.1007/s00259-015-3249-5
13. Wang C, Guo W, Zhou M, Zhu X, Ji D, Li W, et al. The predictive and prognostic value of early metabolic response assessed by positron emission tomography in advanced gastric cancer treated with chemotherapy. Clin Cancer Res (2016) 22:1603–10. doi: 10.1158/1078-0432.Ccr-14-3235
14. Kim EY, Lee WJ, Choi D, Lee SJ, Choi JY, Kim BT, et al. The value of PET/CT for preoperative staging of advanced gastric cancer: comparison with contrast-enhanced CT. Eur J Radiol (2011) 79:183–8. doi: 10.1016/j.ejrad.2010.02.005
15. Yun M. Imaging of gastric cancer metabolism using 18 f-FDG PET/CT. J Gastric Cancer. (2014) 14:1–6. doi: 10.5230/jgc.2014.14.1.1
16. Bosch KD, Chicklore S, Cook GJ, Davies AR, Kelly M, Gossage JA, et al. Staging FDG PET-CT changes management in patients with gastric adenocarcinoma who are eligible for radical treatment. Eur J Nucl Med Mol Imaging (2020) 7:759–67. doi: 10.1007/s00259-019-04429-x
17. Aerts HJ, Velazquez ER, Leijenaar RT, Parmar C, Grossmann P, Carvalho S, et al. Decoding tumour phenotype by noninvasive imaging using a quantitative radiomics approach. Nat Commun (2014) 5:4006. doi: 10.1038/ncomms5006
18. Wang Y, Liu W, Yu Y, Liu JJ, Xue HD, Qi YF, et al. CT radiomics nomogram for the preoperative prediction of lymph node metastasis in gastric cancer. Eur Radiol (2020) 30:976–86. doi: 10.1007/s00330-019-06398-z
19. Chen W, Wang S, Dong D, Gao X, Zhou K, Li J, et al. Evaluation of lymph node metastasis in advanced gastric cancer using magnetic resonance imaging-based radiomics. Front Oncol (2019) 9:1265. doi: 10.3389/fonc.2019.01265
20. Li J, Dong D, Fang M, Wang R, Tian J, Li H, et al. Dual-energy CT-based deep learning radiomics can improve lymph node metastasis risk prediction for gastric cancer. Eur Radiol (2020) 30:2324–33. doi: 10.1007/s00330-019-06621-x
21. Song BI. Nomogram using f-18 fluorodeoxyglucose positron emission tomography/computed tomography for preoperative prediction of lymph node metastasis in gastric cancer. World J Gastrointest Oncol (2020) 12:447–56. doi: 10.4251/wjgo.v12.i4.447
22. In H, Solsky I, Palis B, Langdon-Embry M, Ajani J, Sano T., et al. Validation of the 8th edition of the AJCC TNM staging system for gastric cancer using the national cancer database. Ann Surg Oncol (2017) 24:3683-91. doi: 10.1245/s10434-017-6078-x
23. Jiang Y, Yuan Q, Lv W, Xi S, Huang W, Sun Z, et al. Radiomic signature of 18F fluorodeoxyglucose PET/CT for prediction of gastric cancer survival and chemotherapeutic benefits. Theranostics. (2018) 8:5915–28. doi: 10.7150/thno.28018
24. Nioche C, Orlhac F, Boughdad S, Reuzé S, Goya-Outi J, Robert C, et al. LIFEx: A freeware for radiomic feature calculation in multimodality imaging to accelerate advances in the characterization of tumor heterogeneity. Cancer Res (2018) 78:4786–9. doi: 10.1158/0008-5472.Can-18-0125
25. Hatt M, Majdoub M, Vallières M, Tixier F, Le Rest CC, Groheux D, et al. 18F-FDG PET uptake characterization through texture analysis: investigating the complementary nature of heterogeneity and functional tumor volume in a multi-cancer site patient cohort. J Nucl Med (2015) 56:38–44. doi: 10.2967/jnumed.114.14405522
26. McNeish DM. Using lasso for predictor selection and to assuage overfitting: A method long overlooked in behavioral sciences. Multivariate Behav Res (2015) 50:471–84. doi: 10.1080/00273171.2015.1036965
27. Namikawa T, Okabayshi T, Nogami M, Ogawa Y, Kobayashi M, Hanazaki K. Assessment of (18)F-fluorodeoxyglucose positron emission tomography combined with computed tomography in the preoperative management of patients with gastric cancer. Int J Clin Oncol (2014) 19:649-55. doi: 10.1007/s10147-013-0598-6
28. Moons KG, Altman DG, Reitsma JB, Ioannidis JP, Macaskill P, Steyerberg EW, et al. Transparent reporting of a multivariable prediction model for individual prognosis or diagnosis (TRIPOD): explanation and elaboration. Ann Intern Med (2015) 162:W1–73. doi: 10.7326/m14-0698
29. Manafi-Farid R, Karamzade-Ziarati N, Vali R, Mottaghy FM, Beheshti M. 2-[18F]FDG PET/CT radiomics in lung cancer: An overview of the technical aspect and its emerging role in management of the disease. Methods. (2021) 188:84–97. doi: 10.1016/j.ymeth.2020.05.023
30. He J, Wang Q, Zhang Y, Wu H, Zhou Y, Zhao S. Preoperative prediction of regional lymph node metastasis of colorectal cancer based on 18F-FDG PET/CT and machine learning. Ann Nucl Med (2021) 35:617–27. doi: 10.1007/s12149-021-01605-8
31. Liu Q, Li J, Xin B, Sun Y, Feng D, Fulham MJ, et al. (18)F-FDG PET/CT radiomics for preoperative prediction of lymph node metastases and nodal staging in gastric cancer. Front Oncol (2021) 11:723345. doi: 10.3389/fonc.2021.723345
32. Zheng Z, Zhang Y, Zhang L, Li Z, Wu X, Liu Y, et al. A nomogram for predicting the likelihood of lymph node metastasis in early gastric patients. BMC Cancer. (2016) 16:92. doi: 10.1186/s12885-016-2132-5
33. Guo CG, Zhao DB, Liu Q, Zhou ZX, Zhao P, Wang GQ, et al. A nomogram to predict lymph node metastasis in patients with early gastric cancer. Oncotarget. (2017) 8:12203–10. doi: 10.18632/oncotarget.14660
Keywords: gastric cancer, positron emission tomography - computed tomography (PET-CT), radiomics, nomogram, lymph node metastasis (LNM)
Citation: Xue X-q, Yu W-J, Shi X, Shao X-L and Wang Y-T (2022) 18F-FDG PET/CT-based radiomics nomogram for the preoperative prediction of lymph node metastasis in gastric cancer. Front. Oncol. 12:911168. doi: 10.3389/fonc.2022.911168
Received: 20 April 2022; Accepted: 13 July 2022;
Published: 08 August 2022.
Edited by:
Ming Li, Fudan University, ChinaCopyright © 2022 Xue, Yu, Shi, Shao and Wang. This is an open-access article distributed under the terms of the Creative Commons Attribution License (CC BY). The use, distribution or reproduction in other forums is permitted, provided the original author(s) and the copyright owner(s) are credited and that the original publication in this journal is cited, in accordance with accepted academic practice. No use, distribution or reproduction is permitted which does not comply with these terms.
*Correspondence: Yue-Tao Wang, eXVldGFvLXdAMTYzLmNvbQ==
†These authors share first authorship
‡ORCID: Yue-Tao Wang, orcid.org/0000-0003-2859-8625