
94% of researchers rate our articles as excellent or good
Learn more about the work of our research integrity team to safeguard the quality of each article we publish.
Find out more
ORIGINAL RESEARCH article
Front. Oncol. , 13 July 2022
Sec. Cancer Imaging and Image-directed Interventions
Volume 12 - 2022 | https://doi.org/10.3389/fonc.2022.902991
This article is part of the Research Topic Women in Cancer Imaging and Image-directed Interventions Vol II: 2022 View all 18 articles
 Wenting Pan1†
 Huangqi Zhang1*†
 Shengze Jin2Xin Li1Jiawen Yang1Binhao Zhang1Xue Dong3
 Ling Ma4
 Wenbin Ji1*
Background: There remains a demand for a practical method of identifying lipid-poor adrenal lesions.
Purpose: To explore the predictive value of computed tomography (CT) features combined with demographic characteristics for lipid-poor adrenal adenomas and nonadenomas.
Materials and Methods: We retrospectively recruited patients with lipid-poor adrenal lesions between January 2015 and August 2021 from two independent institutions as follows: Institution 1 for the training set and the internal validation set and Institution 2 for the external validation set. Two radiologists reviewed CT images for the three sets. We performed a least absolute shrinkage and selection operator (LASSO) algorithm to select variables; subsequently, multivariate analysis was used to develop a generalized linear model. The probability threshold of the model was set to 0.5 in the external validation set. We calculated the sensitivity, specificity, accuracy, and area under the receiver operating characteristic curve (AUC) for the model and radiologists. The model was validated and tested in the internal validation and external validation sets; moreover, the accuracy between the model and both radiologists were compared using the McNemar test in the external validation set.
Results: In total, 253 patients (median age, 55 years [interquartile range, 47–64 years]; 135 men) with 121 lipid-poor adrenal adenomas and 132 nonadenomas were included in Institution 1, whereas another 55 patients were included in Institution 2. The multivariable analysis showed that age, male, lesion size, necrosis, unenhanced attenuation, and portal venous phase attenuation were independently associated with adrenal adenomas. The clinical-image model showed AUCs of 0.96 (95% confidence interval [CI]: 0.91, 0.98), 0.93 (95% CI: 0.84, 0.97), and 0.86 (95% CI: 0.74, 0.94) in the training set, internal validation set, and external validation set, respectively. In the external validation set, the model showed a significantly and non-significantly higher accuracy than reader 1 (84% vs. 65%, P = 0.031) and reader 2 (84% vs. 69%, P = 0.057), respectively.
Conclusions: Our clinical-image model displayed good utility in differentiating lipid-poor adrenal adenomas. Further, it showed better diagnostic ability than experienced radiologists in the external validation set.
Over the last decades, there has been an epidemic increase in the detection of adrenal incidentalomas (1). Adrenal adenomas account for most adrenal lesions and do not require further treatment or only need regular follow-up (2). Adrenal adenomas that contain large amounts of fat could be reliably diagnosed through conventional imaging methods (3). However, 30% of adenomas having an attenuation value of >10 HU (i.e., lipid-poor adenomas) cannot be correctly differentiated from nonadenomas (1). For adrenal lesions suspected to be metastatic tumors or pheochromocytoma, further clinical examination and intervention are needed to avoid adverse events, such as life-threatening hypertension crises during operation. Therefore, it is important to distinguish adrenal lipid-poor adenoma from nonadenoma.
Chemical shift magnetic resonance imaging and energy spectrum computed tomography (CT) are slightly more sensitive for detection (4–7). However, their general use is limited by the high price and relatively limited accessibility. Thus, lipid-poor adrenal lesions usually need a dedicated adrenal washout CT protocol for further characterization (8–11). Nevertheless, the delayed phase and additional radiation exposure may limit the utility of the washout CT protocol (12). However, the relative percentage wash-in ratio of adrenal lesions from the unenhanced to the portal venous phase can remedy the above defects (12, 13). To our knowledge, only a few studies including a large number of lipid-rich adenomas have simultaneously assessed unenhanced attenuation and contrast wash-in features on CT (12, 14). There is currently no combined model established on easily available demographic information and CT characteristics for distinguishing lipid-poor adenomas and nonadenomas. Therefore, we aimed to develop a practical clinical-image model for identifying lipid-poor adrenal lesions.
Our study was approved by the Institutional Review Committee, and the requirement of written informed consent was waived. We followed the TRIPOD Statement (15) and completed the checklist (Supplementary Table S1).
We conducted a retrospective study on patients with adrenal lesions who were continuously treated in Institution 1 from January 2015 to August 2021. The inclusion criteria were as follows: adult patients with adrenal lesions who underwent adrenal or abdominal unenhanced and contrast-enhanced CT scans.
The exclusion criteria were as follows: (a) lesions with an HU ≤ 10 on unenhanced CT and visible lipid-rich lesions (lipid-rich adrenal adenoma or myelolipoma); (b) missing solid components in the lesion: the change of CT attenuation between the portal venous phase and unenhanced phase is ≤ 10 HU; (c) lesions showing an increase of 10%–30% in the maximum diameter of the adrenal gland during the follow-up period; (d) the scheme of the adrenal or abdominal CT did not meet the standards; (e) lesions with a history of systematic or local treatment; and (f) lesions with a maximum diameter < 10 mm, which was determined to avoid the partial volume effect caused by a thickness of 5 mm (8). For patients with multiple adrenal lesions, only the maximum diameter was included in the analysis to reduce the aggregation effect. The flowchart of the patient selection is summarized in Figure 1. Patients from Institution 1 were randomly split into the training set and the internal validation set according to a ratio of 7:3. Some data in this study had been used in prior research (16) on radiomics conducted by our team.
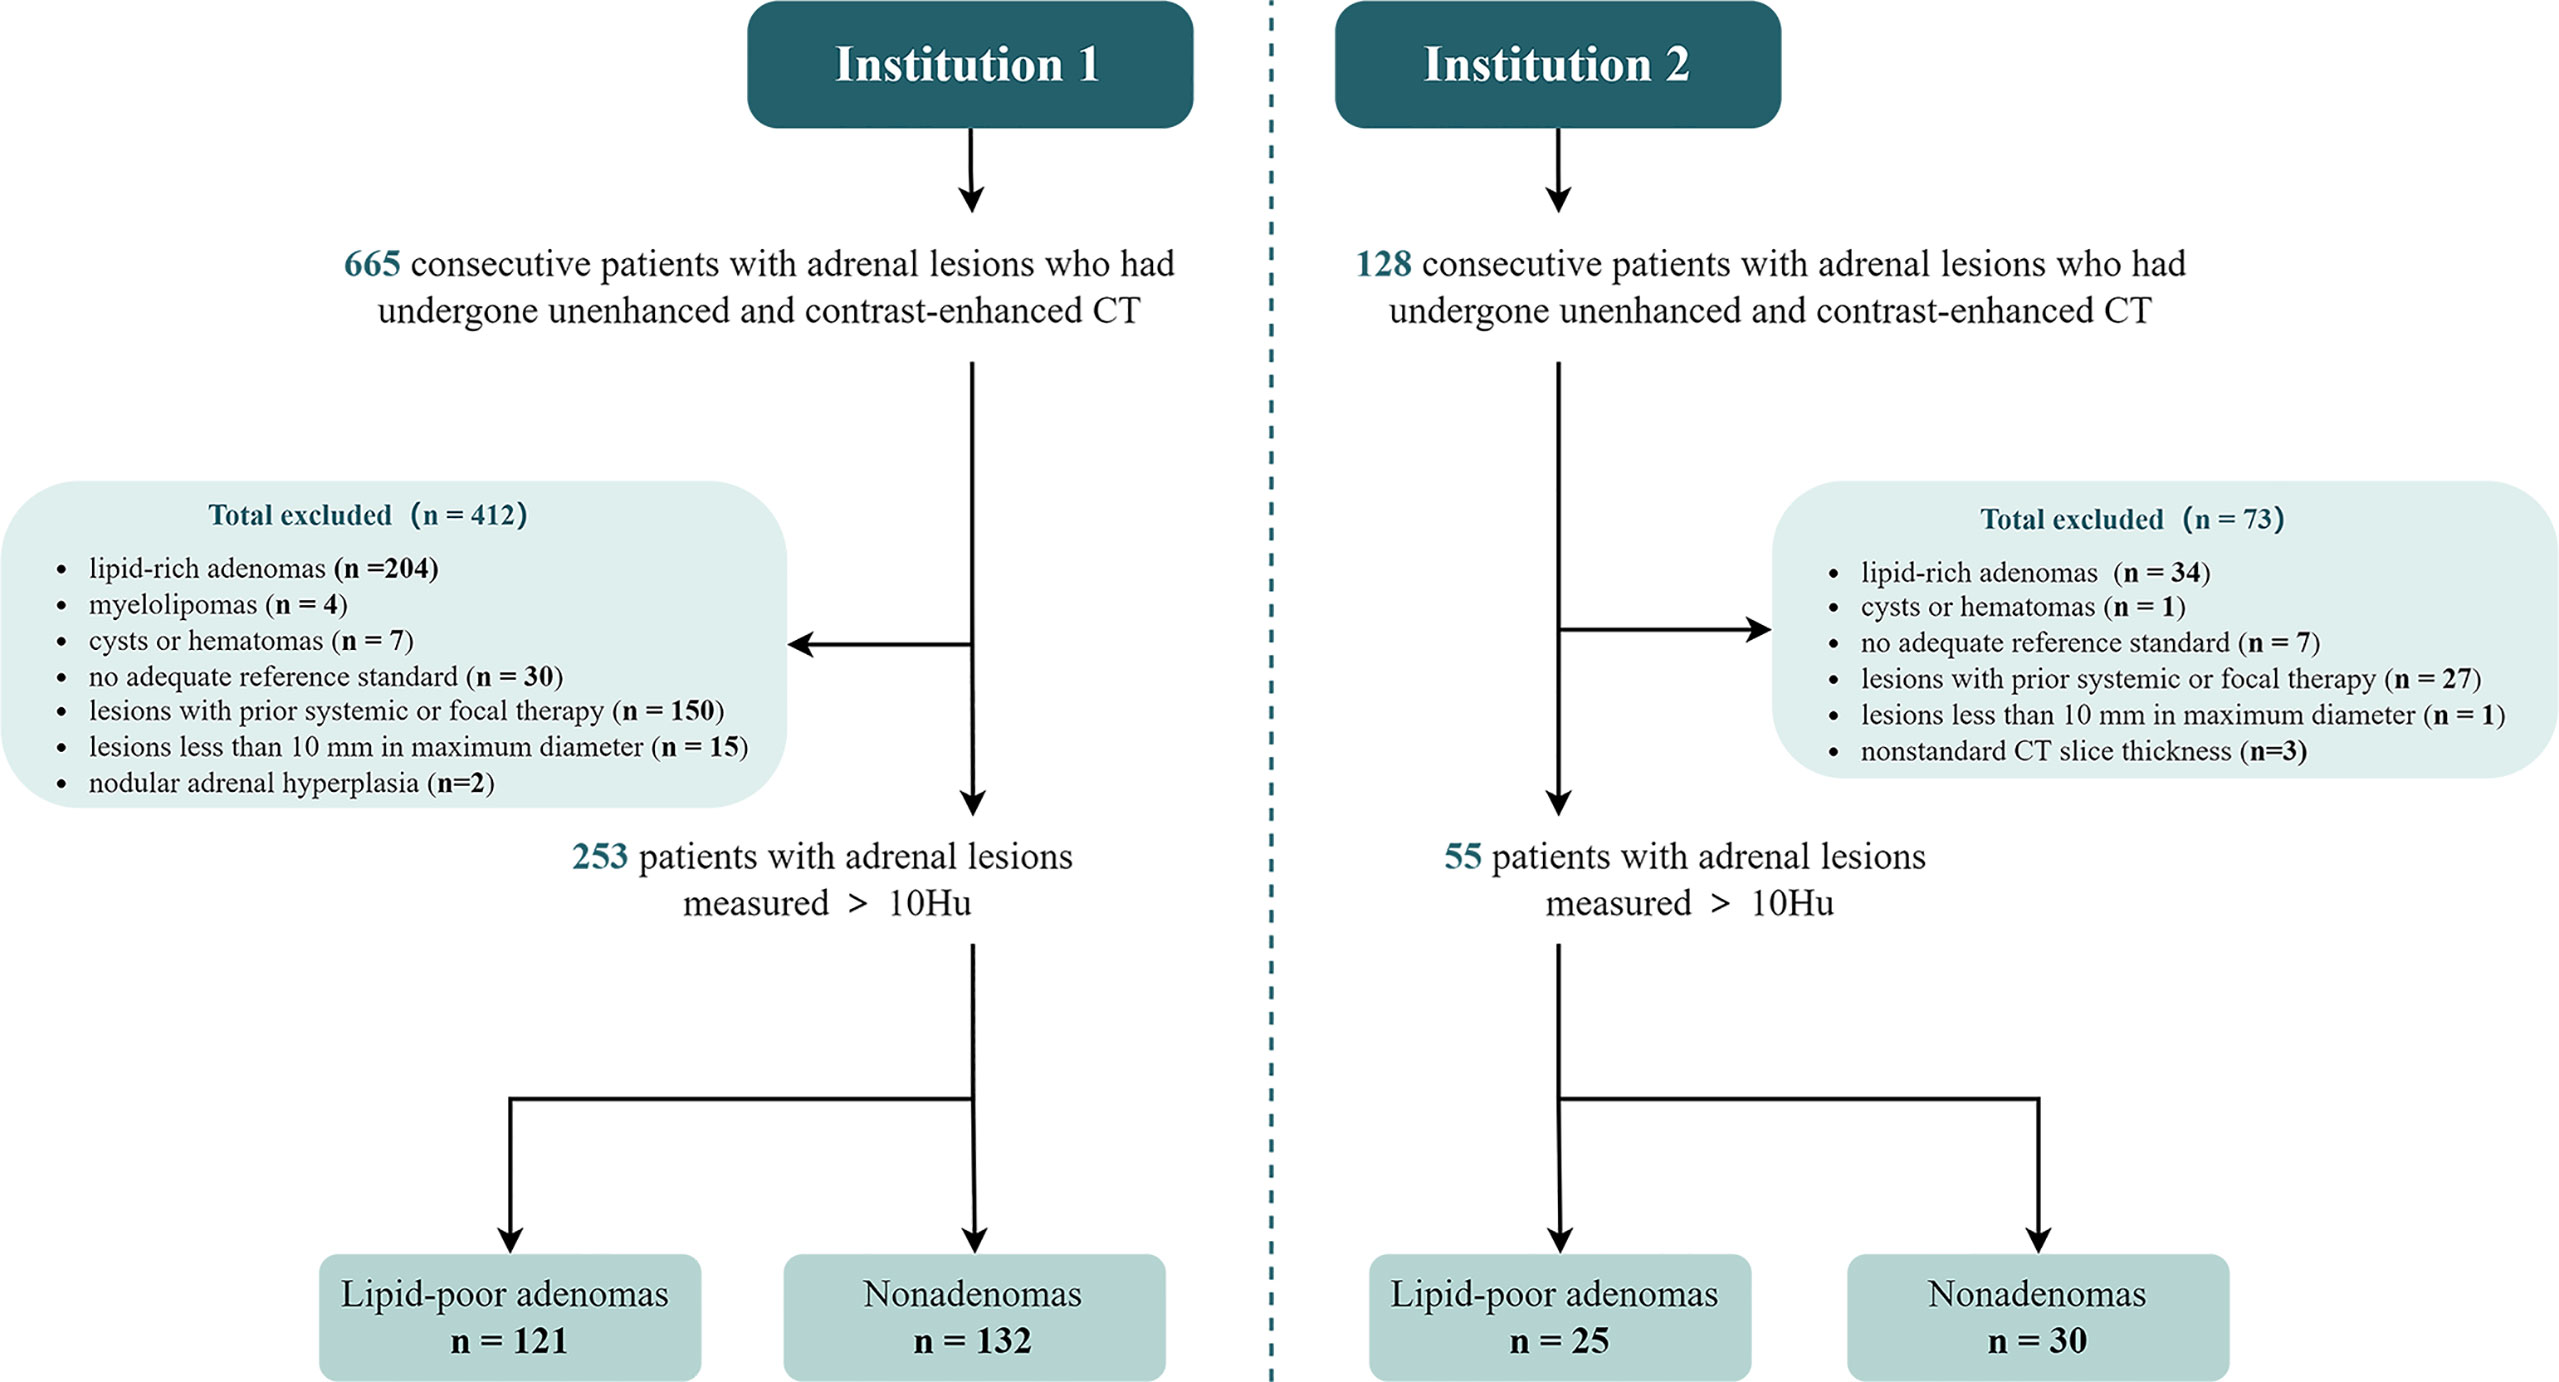
Figure 1 Flowchart of the study sample.
For all lesions, the final diagnosis was based on pathology or widely accepted imaging standards (8). The diagnostic criteria for lipid-poor adrenal adenomas and nonadenomas are summarized in Supplementary Material S1.
Institution 2 analyzed patients with adrenal lesions continuously treated from January 2015 to August 2021, constructed an independent external validation set, and tested the model. Patients in Institution 1 and Institution 2 were selected based on the same inclusion and exclusion criteria (Figure 1). Moreover, the scanning equipment, protocol, and contrast agent concentration were consistent for patients in both institutions.
All unenhanced and contrast-enhanced CT images were obtained using multi-slice spiral CT scanners (uCT 530; United Imaging, Shanghai, China; Discovery CT750HD; GE Healthcare, Chicago, IL, USA). The images were displayed and stored in the image archiving and communication system (PACS). The CT protocols are provided in Supplementary Material S2.
The region of interest was manually drawn in the lesion layer with the maximum diameter. Additionally, the obvious cystic, calcified, and necrotic areas were avoided. All regions of interest were determined on contrast-enhanced images. Subsequently, they were copied to the unenhanced images. Placements were corrected if necessary.
Two radiologists (ZHQ, reader 1, a radiologist with 3 years of experience; LX, reader 2, a radiologist with 20 years of experience), who were blinded to the clinical data and final diagnosis, independently reviewed the CT images and recorded information regarding shape, boundary, and necrosis. Moreover, they measured the maximum diameter and the unenhanced and portal venous phase CT attenuations which was also called contrast-enhanced attenuation.
Absolute enhancement was calculated by subtracting unenhanced from contrast-enhanced attenuation. The absolute enhancement rate was calculated as follows: contrast-enhanced attenuation/unenhanced attenuation × 100%. Based on established guidelines (8): 1 ~ 2 cm, 2 ~ 4 cm, and ≥ 4 cm were defined as small, medium, and large nodules, respectively.
To assess inter-reader agreement, all analyses were performed independently by a third radiologist (PWT, a radiologist with 2 years of experience), who was also unaware of any clinical data and final diagnosis. The consistency of quantitative variables between the two readers was compared using intraclass correlation coefficients (ICC). Inter-reader agreement was evaluated using the kappa statistics for qualitative variables. Between-reader differences were shown in the Bland Altman plots based on the mean of the measurement (17). After the consistency test, the variables with ICC or kappa statistics > 0.8 was included. The average values of the quantitative variables were used for subsequent analysis. Between-reader disagreements in qualitative data were resolved through a consensus between the two readers.
Normally distributed continuous variables were analyzed using Student’s t-test and presented as means and standard deviations. Non-normally distributed continuous variables were examined using the Mann-Whitney U test and presented as medians and interquartile range (IQR). Categorical variables were analyzed using the chi-square or Fisher’s exact test and expressed as the frequency and percentage.
We conducted a least absolute shrinkage and selection operator (LASSO) algorithm to select demographic variables and CT features in the training set. We established a generalized linear model (logistic regression) through multivariate analysis of statistically significant variables to predict the probability of lipid-poor adrenal adenoma. Identification and calibration are crucial attributes with respect to the performance evaluation of multivariable models (18). Clinical effectiveness was evaluated using decision curve analysis. The constructed model was used to predict the probability of lipid-poor adenoma in the internal validation set and external validation set.
The sensitivity, specificity, accuracy, and receiver operating characteristic curve (AUC) of the model, and two readers were calculated. AUCs between the combined model, unenhanced attenuation, and absolute enhancement rate was compared using the Delong test in the training set and internal validation set. The accuracy between the model and both readers were compared through the McNemar test in the external validation set. MedCalc (version 19.4.1, MedCalc Software) and R software (version 4.1.1, http://www.r-project.org) (rms, glmnet, rmda, ggDCA, Hmisc, DynNom, rsconnect) were used to perform the statistical analyses. Statistical significance was set at two sided. P<0.05.
We included 665 patients with adrenal lesions who underwent adrenal or abdominal unenhanced and contrast-enhanced CT. We excluded 412 patients and included 253 in Institution 1 (median age, 55 years [IQR, 47-64 years]; 135 men). Among the included patients, 121 (48%) showed lipid-poor adrenal adenomas, while 132 (52%) showed nonadenomas, including 68 (27%) metastases and 64 (25%) other nonadenomas (Figure 1).
The 121 lipid-poor adrenal adenomas were identified based on pathological diagnosis (n = 109); size stability (n = 11), and abnormal 18F-FDG uptake, fulfilling the criteria for adenoma (n = 1).
The primary lesions and the diagnostic approaches of metastases, and pathological types of other nonadenomas are presented in Supplementary Material S3.
Using the same inclusion and exclusion criteria, 55 patients (median age, 61 years [IQR, 50-70 years]; 29 men) with adrenal lesions from Institution 2 were included in the external validation set. Among them, 25 (45%) had adrenal adenomas and 30 (55%) had nonadenomas, including 13 metastases and 17 others (Figure 1).
Table 1 summarizes the clinical and CT characteristics of the patients from Institution 1 and Institution 2. Patients with adrenal adenomas were significantly younger and more of the female sex than those with nonadenomas (median age, 52 years [IQR, 44–57 years] vs. 60 years [IQR, 52–67 years], [P < 0.001]; women: 64% [77/121] vs. 31% [41/132], [P < 0.001]). Moreover, patients with adrenal adenomas showed a higher BMI than patients with nonadenomas (median BMI, 24.6 kg/m2 [IQR, 22.4–26.7 kg/m2] vs. 23.1 kg/m2 [IQR, 20.8–25.9 kg/m2], [P < 0.001]).
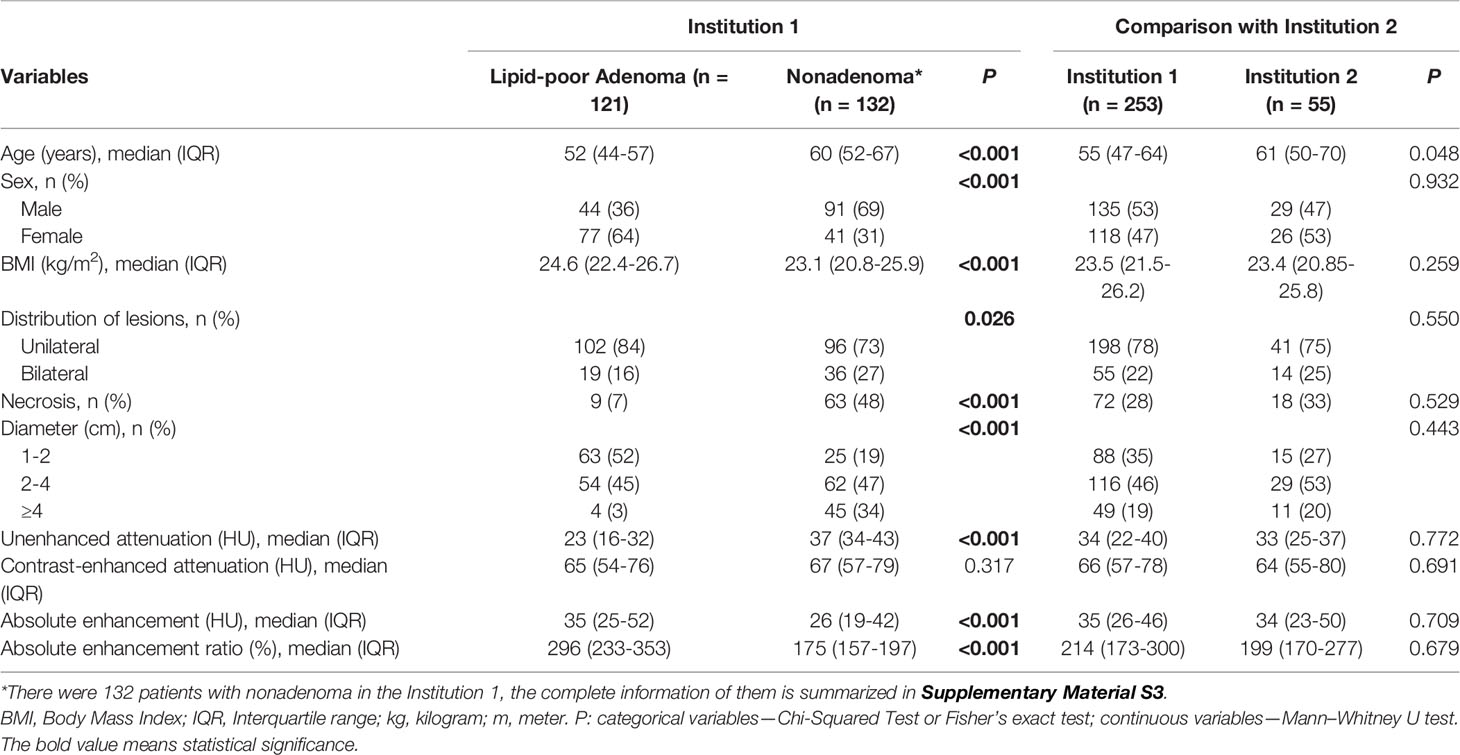
Table 1 Characteristics of Institution 1 and Institution 2.
Regarding the CT signs, patients with lipid-poor adrenal adenomas showed lower unenhanced attenuation than patients with nonadenomas (median, 23 HU [IQR, 16–32 HU] vs. 37 HU [IQR, 34–43 HU], [P < 0.001]), with no significant between-group difference in contrast-enhanced attenuation (median, 65 HU [IQR, 54–76 HU] vs. 67 HU [IQR, 57–79 HU], [P = 0.317]). However, patients with adrenal adenomas showed higher absolute enhancement attenuation than patients with nonadenomas (median, 35 HU [IQR, 25–52 HU] vs. 26 HU [IQR, 19–42 HU], [P < 0.001]). Similarly, the absolute enhancement rate was higher in adenomas than in nonadenomas (296% [IQR, 233–353%] vs. 175% [IQR, 157–197%], [P < 0.001]).
Unilateral lesions were more frequent in patients with adenomas than in those with nonadenomas (102 of 121 patients [84%] vs. 96 of 132 patients [73%]; P = 0.026). Lipid-poor adrenal adenomas were smaller in diameter and were less prone to necrosis than nonadenomas (P < 0.001). There were no significant between-group differences in the other demographic and CT characteristics (P > 0.05).
Supplementary Table S2 summarizes the clinical and CT characteristics of the training set and internal validation set. Except for the distribution of lesions and contrast-enhanced attenuation, other clinical and CT features were statistically different between patients with adenoma and those with nonadenoma in the training set (P < 0.05). No statistically significant difference was observed in all variables between the training set and the internal validation set.
The inter-reader agreement was moderate for shape and boundary (κ = 0.53–0.56) and almost perfect for necrosis (κ = 0.86), size, unenhanced attenuation, and contrast-enhanced attenuation (ICC = 0.98–0.99). More details are shown in Supplementary Figure S1. After LASSO, except for body mass index (BMI) and distribution of lesions, the other variables were included (Supplementary Figure S2).
Multivariate analysis showed that age (odds ratio [OR], 0.94; 95% confidence interval [CI]: 0.90, 0.98; P = 0.015), male sex (OR, 0.26; 95% CI: 0.08, 0.74; P = 0.015), lesion size (2-4cm: OR, 0.51; 95% CI: 0.14, 1.75; P = 0.289; ≥ 4 cm: OR, 0.09; 95% CI: 0.01, 0.57; P = 0.014), necrosis (OR, 0.19; 95% CI: 0.04, 0.78; P = 0.027), unenhanced attenuation (OR, 0.79; 95% CI: 0.72, 0.85; P < 0.001), and contrast-enhanced attenuation (OR, 1.07; 95% CI: 1.04, 1.11; P < 0.001) were independently associated with adrenal adenomas (Table 2). The formula of the combined model is as follows:
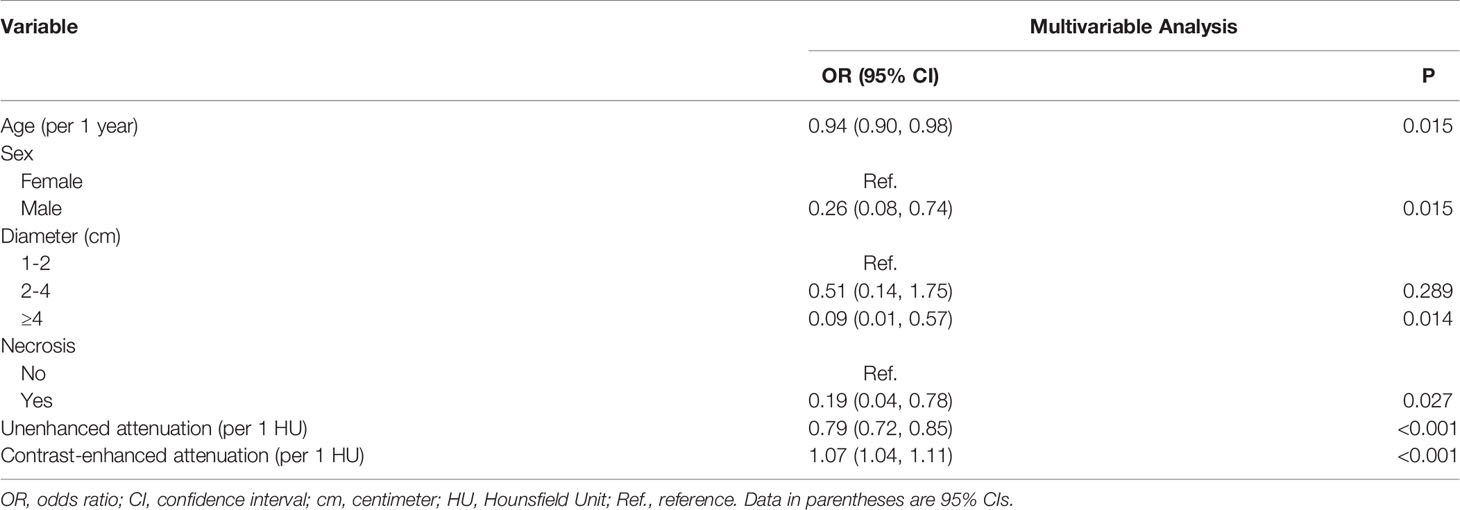
Table 2 Results of multivariate analysis for features selected by LASSO algorithm.
In the training set, the AUCs were 0.96 (95% CI: 0.91, 0.98), 0.87 (95% CI: 0.81, 0.91), and 0.92 (95% CI: 0.87, 0.96) for the model, unenhanced attenuation, and absolute enhancement rate, respectively. Additionally, the diagnostic performance of the model was higher than that of the unenhanced attenuation or absolute enhancement rate (P < 0.001 and P = 0.002, respectively). The AUC of the model was 0.93 (95% CI: 0.84, 0.97) in the internal validation set, which was superior to that of the unenhanced attenuation and absolute enhancement rate (AUC: 0.83 [95% CI: 0.73, 0.91; P = 0.040] and 0.88 [95% CI: 0.78, 0.94; P = 0.060], respectively). Figure 2 shows the nomogram and the receiver operating characteristic (ROC) curves in the training set and internal validation set. Moreover, the calibration curve of the model in the training set is shown in Supplementary Figure S3. The online tool is available at https://zhanghuangqi.shinyapps.io/dynnomapp/. Examples of the nomogram’s clinical use are displayed in Figures 3, 4. The decision curve and clinical impact curves are shown in Supplementary Figures S4, S5. This study revealed that the model achieved a seemingly better net benefit than unenhanced attenuation or relative enhancement rate.
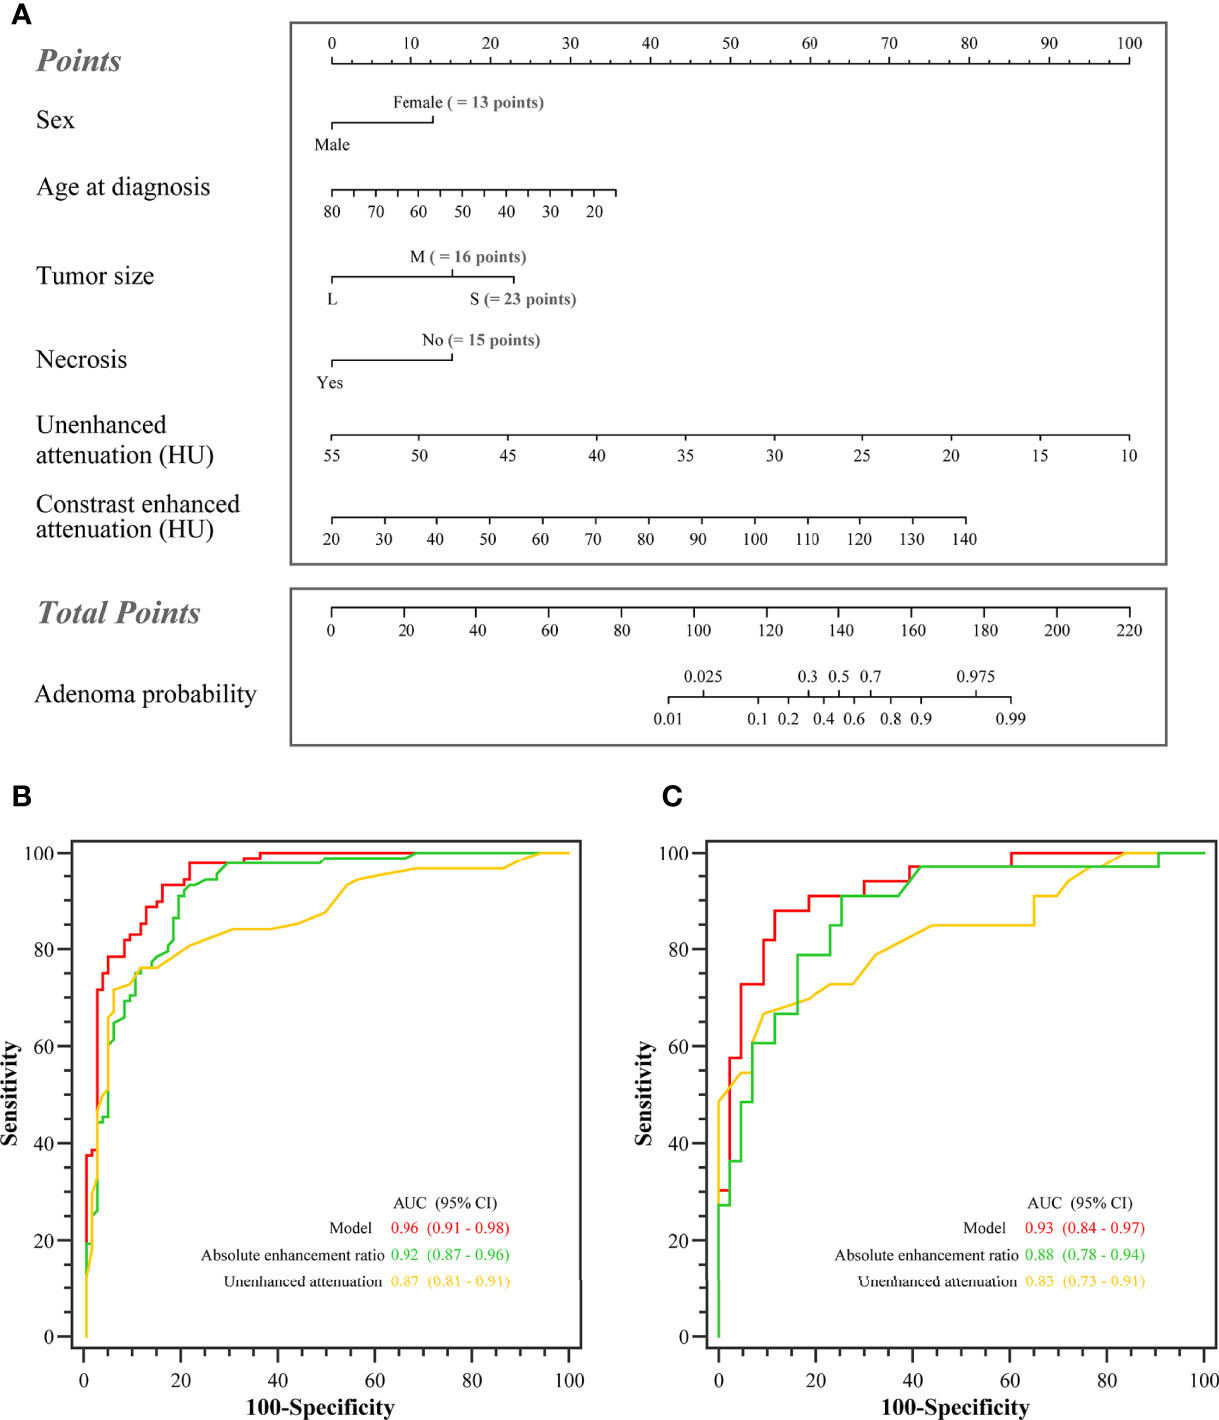
Figure 2 The nomogram and the receiver operating characteristic (ROC) curves in the training set and the internal validation set. (A) Nomogram of lipid-poor adrenal adenoma prediction based on clinical-image model. Added up the scores of each variable to get the total score. Based on it, the probability of lipid-poor adrenal adenoma was showed by projecting the score to the risk axis. Online tool is available at https://zhanghuangqi.shinyapps.io/dynnomapp/. (B) The ROC curves for differentiating lipid-poor adenomas and nonadenomas in the training set. The highest area under the curve was obtained with the combined model (0.96 [95% CI: 0.91, 0.98]), followed by absolute enhancement rate (0.92 [95% CI: 0.87, 0.96]), and unenhanced attenuation (0.87 [95% CI: 0.81, 0.91]). (C) The combined model displayed the best diagnostic performance for prediction of lipid-poor adenomas in the internal validation set (AUC, 0.93 [95% CI: 0.84, 0.97]).
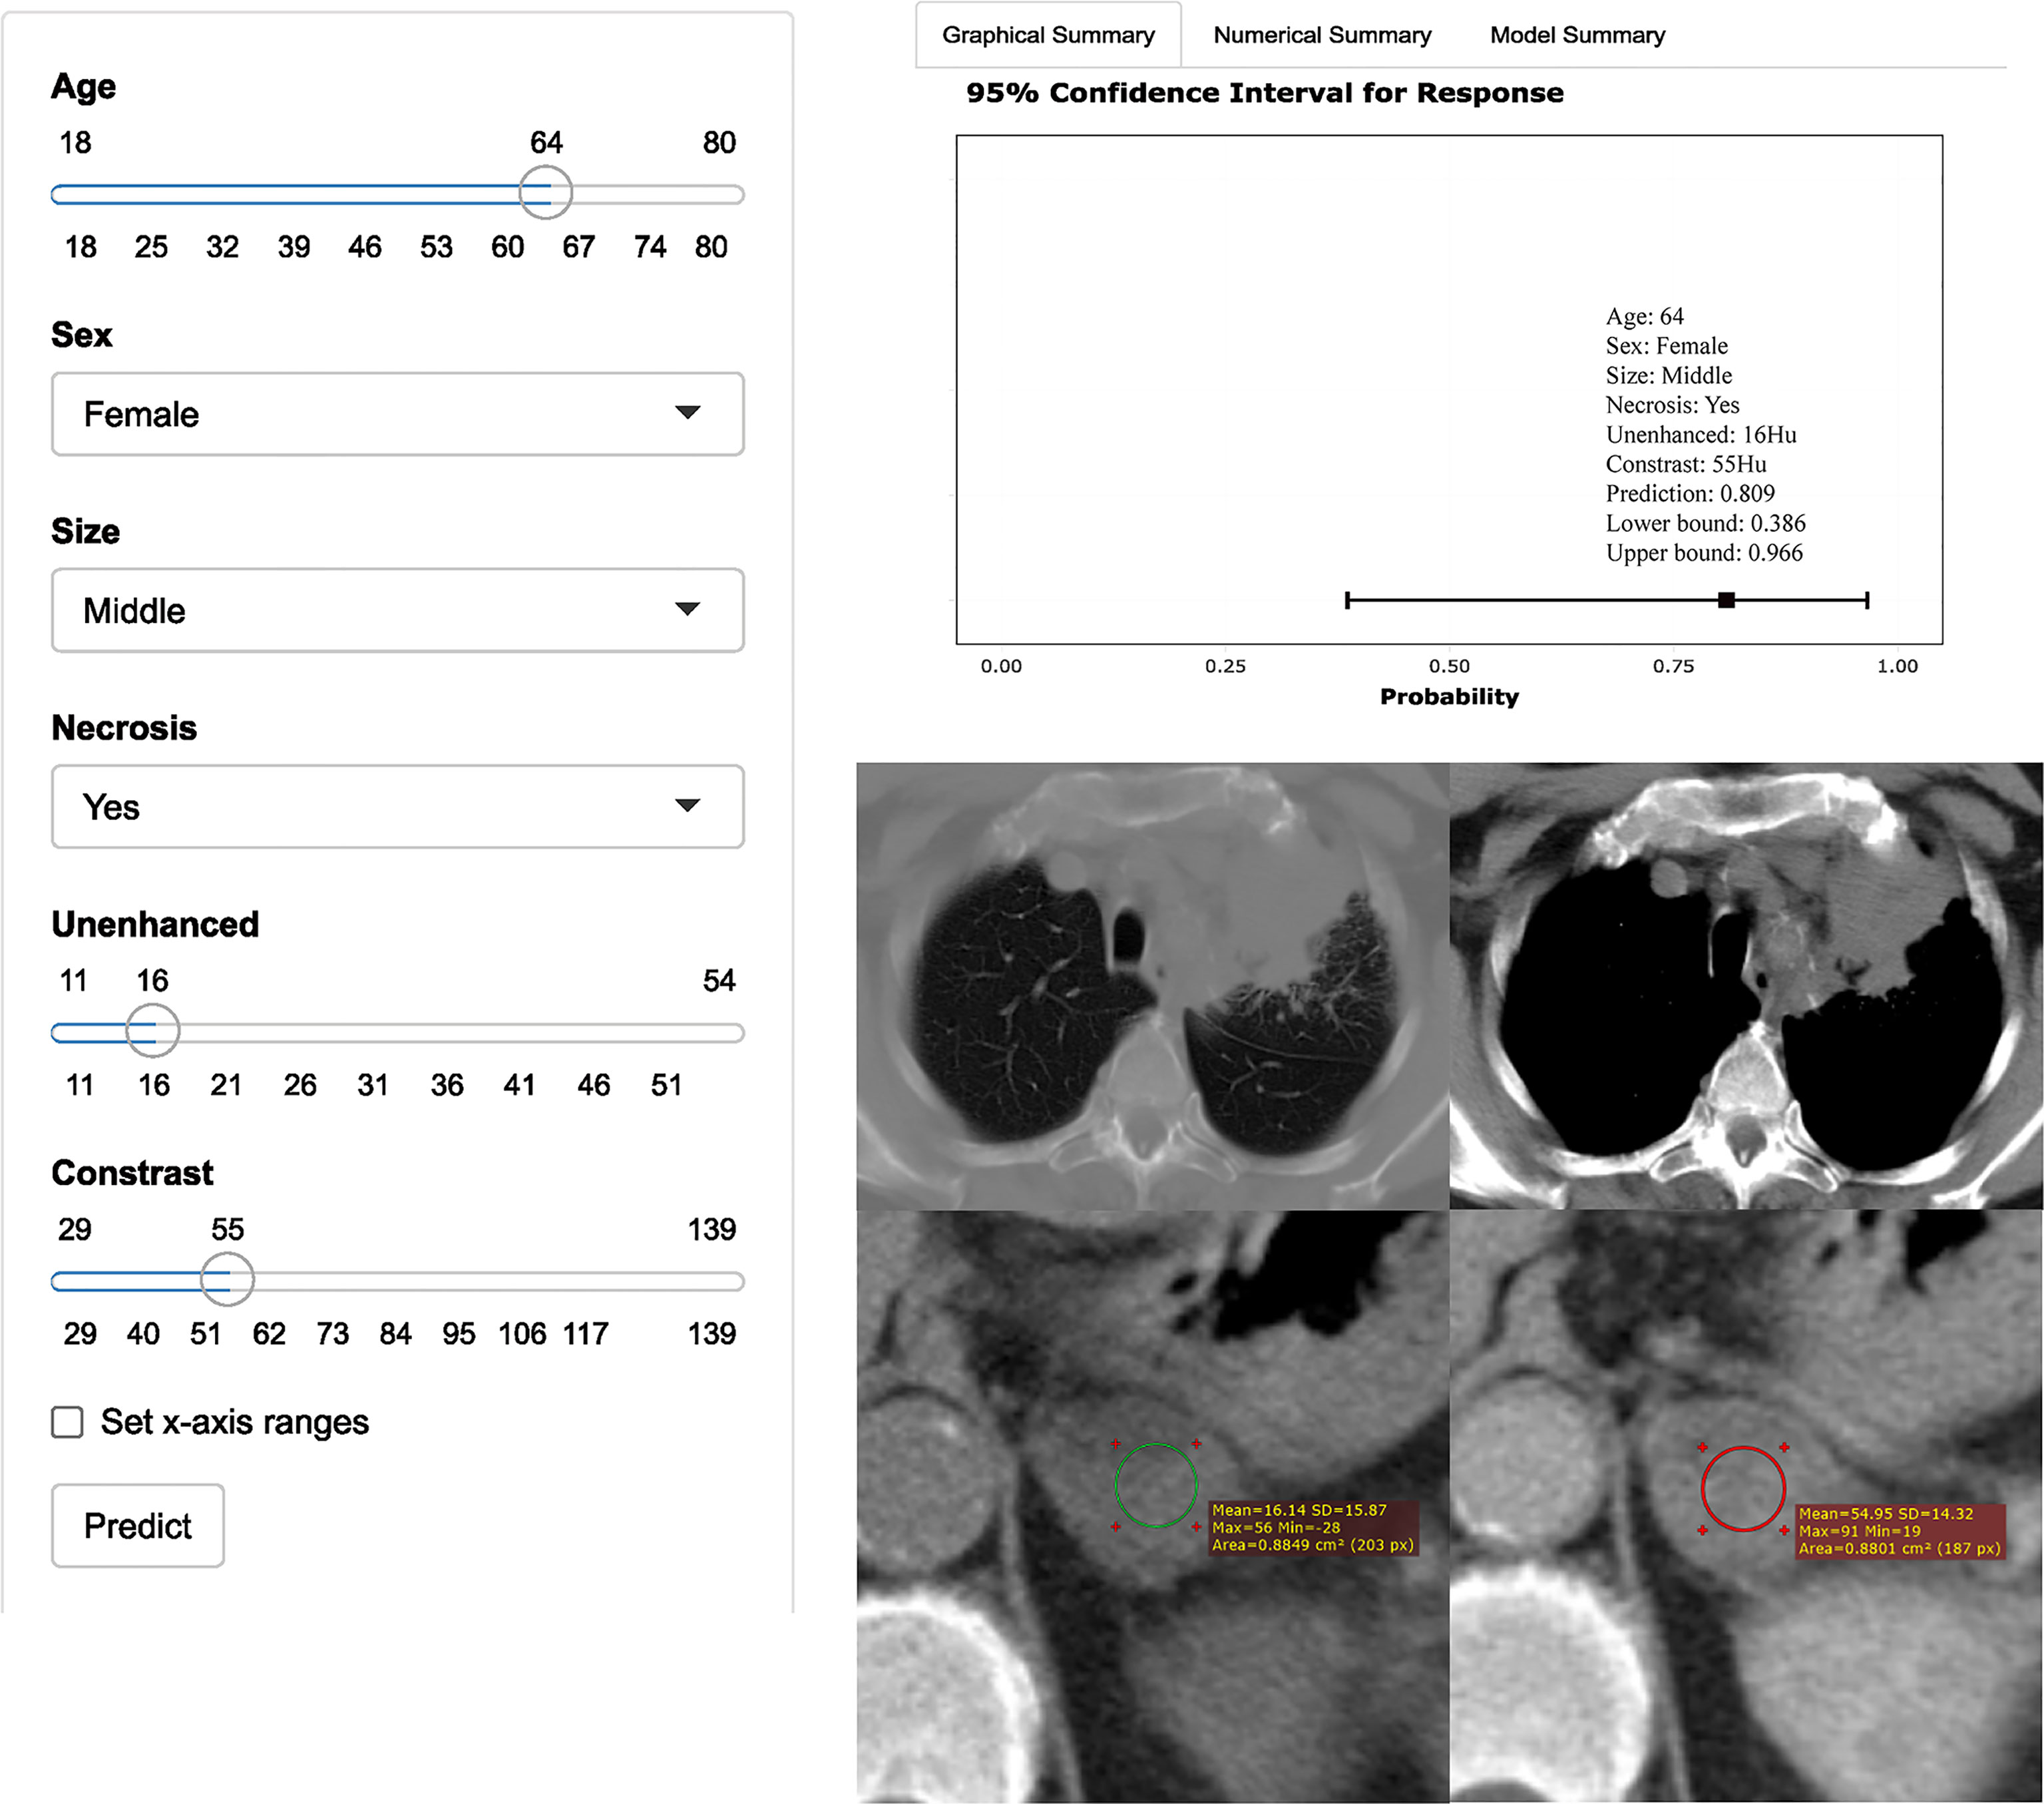
Figure 3 Axial unenhanced and contrast-enhanced adrenal CT images in a 64-year-old woman with cough and expectoration. The woman was accidentally found having left adrenal lesions due to chest CT findings of left upper lung mass and multiple lymph nodes in the left hilar and mediastinum. CT features were analyzed as follows: lesion location = “left”, size = “ middle (2.7cm×2.1cm)”, shape =“quasi-circular”, unenhanced attenuation = 16 HU, contrast-enhanced attenuation = 55 HU, and necrosis= “yes”. Both radiologists evaluated that the possibility of nonadenoma (metastasis) was high, while the possibility of adenoma judged by the model was up to 81% (95% CI: 39%, 97%). The result of pathological diagnosis was adrenal adenoma.
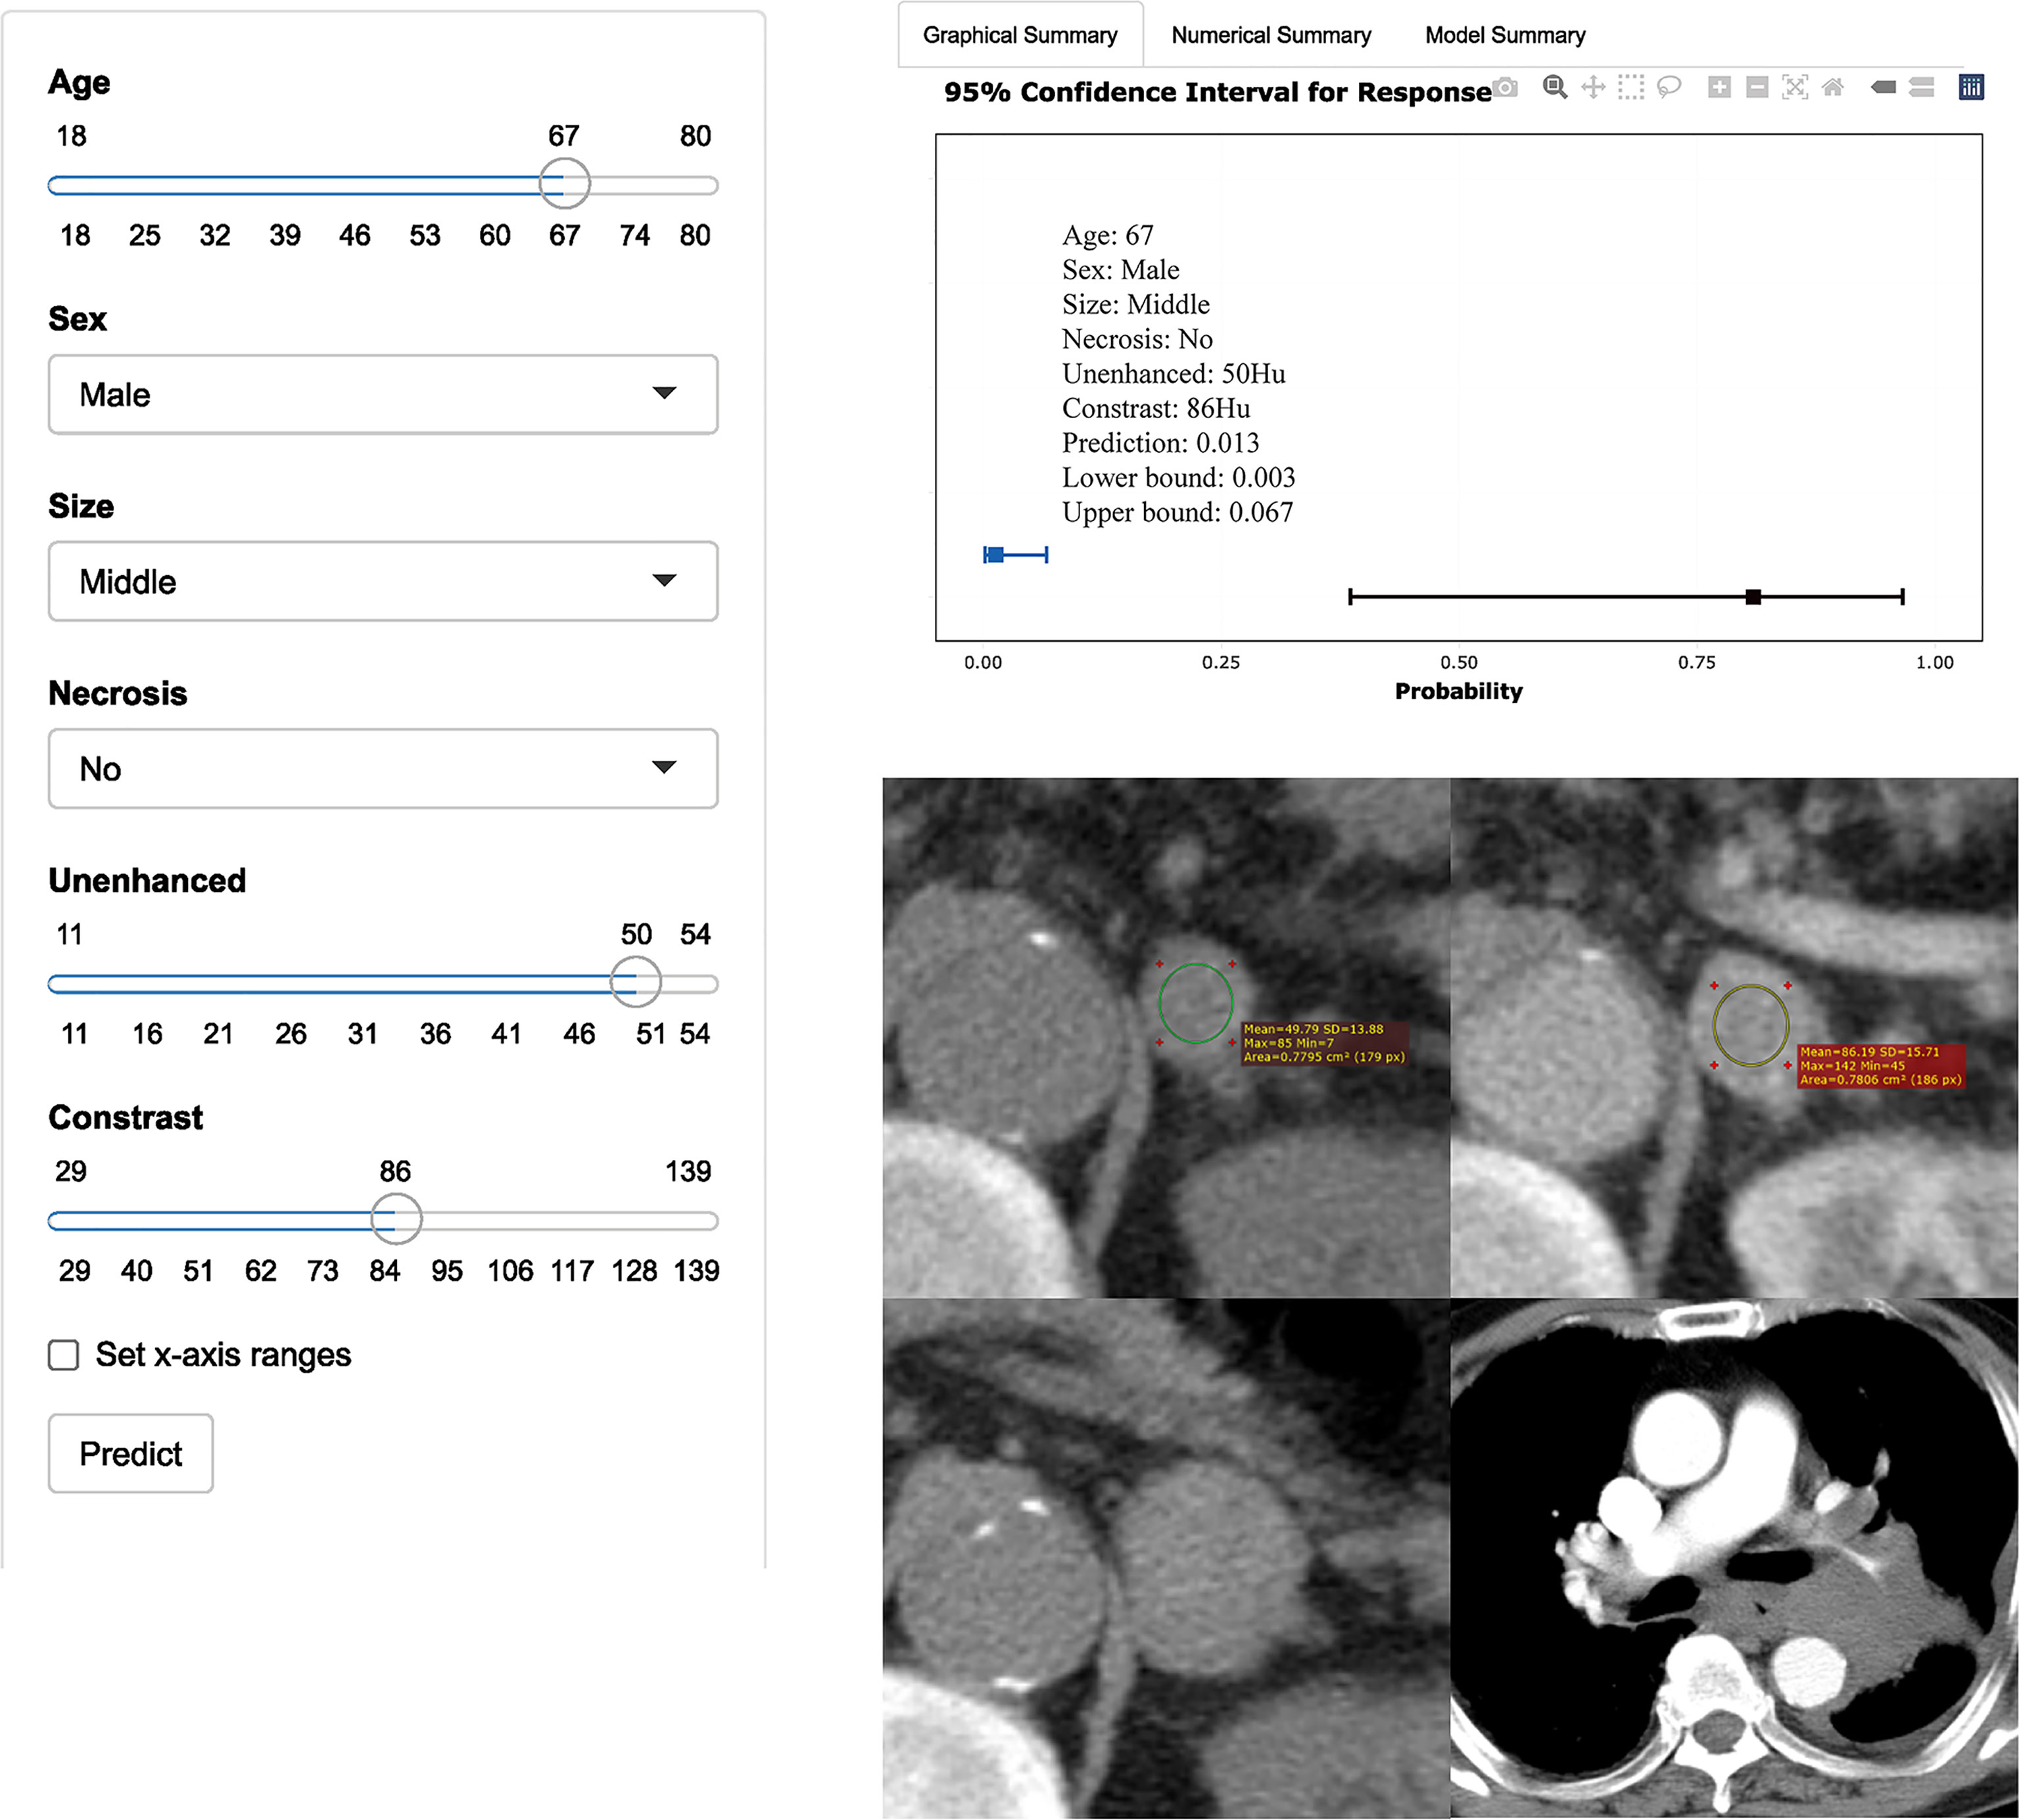
Figure 4 Axial unenhanced and contrast-enhanced adrenal CT images in a 67-year-old man with dizziness and unstable walking. The man was accidentally found having left adrenal lesions due to abdominal CT findings of right kidney occupied. Meanwhile, the boundary of the mass was clear, and no obvious enlarged lymph nodes were found around. CT features were analyzed as follows: lesion location = “left”, size = “middle (2.7cm×2.1cm)”, shape =“quasi-circular”, unenhanced attenuation = 50 HU, and contrast-enhanced attenuation = 86 HU. The renal lesion was considered to be a malignancy. Reader 1 thought that it was more likely to be nonadenoma, while reader 2 thought that it was more likely to be adenoma. The possibility of adenoma judged by the model was only 1% (95% CI: 0%, 7%). One year later, the patient went to see a doctor again due to repeated cough, expectoration, and chest tightness. CT showed that left hilar was occupied by mass with bronchial and pulmonary artery stenosis. It was confirmed as small cell lung cancer pathologically. The left adrenal gland was significantly larger than before, with maximum diameter of 3.3cm. Metastasis was considered first, but it cannot be determined whether the metastasis was from lung cancer or renal cancer.
In the external validation set (n = 55), the AUC of the model was 0.86 (95% CI: 0.74, 0.94). The model (84%; 95% CI: 71%, 92%) showed a significantly and non-significantly higher accuracy than reader 1 (65%; 95%CI: 51%, 78%; P = 0.031) and reader 2 (69%; 95% CI: 55%, 81%; P = 0.057), respectively (Table 3).
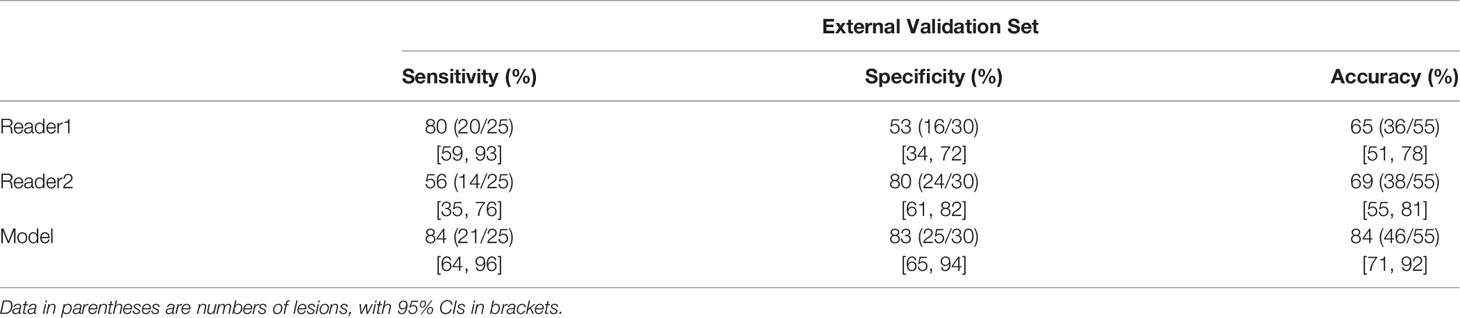
Table 3 Sensitivity, Specificity, and Accuracy for Differentiating Lipid-Poor Adenomas from Nonadenomas by Two Readers and the Model.
It is desirable to develop a practical and convenient method for identifying lipid-poor adrenal lesions. To our knowledge, this is the first study to establish a combined model based on easily available demographic information and CT characteristics for differentiating lipid-poor adrenal adenomas from nonadenomas. Our model was validated and tested using the internal validation set and independent external data and showed good diagnostic efficiency. Further, it displayed better diagnostic ability than inexperienced radiologists in the external validation set. To facilitate the clinical use of this model, we have transformed it into online software for use.
Previous studies have tried to identify lipid-poor adrenal adenoma. Several studies found that CT attenuation displayed potential usefulness in distinguishing adrenal adenoma (13, 14, 19). Our clinical-image model showed higher diagnostic efficiency than simple unenhanced CT attenuation and absolute enhancement rates. In previous studies, the diagnosis of adenomas was confirmed by long-term radiological follow-up; there was a relatively low proportion of adenomas confirmed by surgery or puncture (20, 21). However, in our study, 90% (109 of 121 patients) of the adenomas were confirmed by pathology. Yi et al. developed radiomic nomograms to distinguish subclinical pheochromocytoma from lipid-poor adenoma through CT images with an AUC of 0.904 (22). Our model was based on easily available demographic information and CT features and also achieved good performance; moreover, our study covered a wider etiology of adrenal nonadenoma.
Multivariable analysis revealed that the main demographics for predicting lipid-poor adrenal adenoma were age and sex, consistent with previous studies (23–25). Many nonadenomas were metastases, which tend to occur in the elderly (8). The presence or absence of necrosis and lesion size were independently associated with the diagnosis of lipid-poor adrenal adenoma. According to relevant guidelines (8), we used the lesion size as a categorical variable since it is clinically significant. Given the high possibility of benign lesions, follow-up should be conducted for lesions with a size of 1–2 cm. For lesions with a size > 2 cm and < 4 cm, the next plan is determined in combination with unenhanced attenuation. Finally, for lesions larger than 4 cm, surgical resection is decided based on the malignancy history.
Patients with adenomas showed lower unenhanced attenuation than patients with nonadenomas. Several studies have demonstrated that adrenal adenomas have lower unenhanced attenuation than pheochromocytomas or malignant adrenal lesions (26). Pathologically, adrenal adenoma, whether rich in or lacking lipids, is a benign neoplasm of adrenocortical cells. The adrenal cortex consists of zona glomerulosa, zona fasciculata, and zona reticularis. The zona fasciculata constitutes three-fourths of the cortex comprising lipid-laden cells (1).
Although adenomas have been reported to show rapid wash in the portal vein phase (13, 27), they often showed no statistically significant difference in univariate analysis. A recent study (12) indicated that the ratio of portal venous phase attenuation to unenhanced attenuation allowed sufficient identification of lipid-poor adenomas and nonadenomas. Therefore, we attempted to incorporate the portal vein phase attenuation into the combined model, which was an independent risk factor in multivariate analysis. The above may be attributed to the correlations between independent variables; the influence of independent variables on dependent variables reflects their own role and the mixed roles of other variables.
In the external validation set, there were 13 cases of adrenal metastases, which were accurately identified by our combined model. A total of five nonadenomas were misjudged as adenomas, including four pheochromocytomas and one spindle cell tumor. Only one pheochromocytoma among these five patients was correctly identified by reader 2. Previous studies have indicated that some pheochromocytomas are misdiagnosed as adenomas on adrenal enhanced CT (20, 28). Furthermore, these pheochromocytomas were rich in blood vessels and displayed rapid washout similar to adenomas, which cannot be accurately characterized in the delayed phase (20, 28).
Our study has some limitations. First, we did not collect the full clinical history or laboratory examination. However, this was consistent with our study objective, which was an early, rapid, and noninvasive diagnosis of lipid-poor adenoma and effective stratification of patients to avoid some unnecessary examination. Second, we used a total iodine dose of 400 mgI/kg, which is lower than previously reported values (10, 20, 29) and might limit the application of our model. This could be attributed to our participants weighing less than those in previous studies due to race differences. Simultaneously, an excessively high iodine dose adversely affects patients, causing fever, pain, and contrast medium nephropathy (30, 31). Third, the diagnostic efficiency of the combined model in the external validation set was not as high as we expected. Moreover, the diagnostic accuracy of the two readers in the external validation set was lower than that in the training set, which could partly explain the reduced diagnostic efficiency of the model. Specifically, this might be attributed to differences in the types of patients treated in both sets.
This study shows that the combined model, which is based on accessible demographic characteristics and CT features, can facilitate the identification of lipid-poor adrenal adenoma. In the training set, the combined model had better diagnostic efficiency than unenhanced attenuation or the absolute enhancement rate. In the external validation set, the model showed higher accuracy than an inexperienced radiologist.
The original contributions presented in the study are included in the article/Supplementary Material. Further inquiries can be directed to the corresponding authors.
WP, HZ, and WJ: conception and design. HZ, XL, SJ, and JY: collection and assembly of data. HZ, WP, and LM: data analysis and interpretation. WP, XD, BZ, and JY: manuscript writing. All authors contributed to the article and approved the submitted version.
Author LM is employed by He Kang Corporate Management (SH).
The remaining authors declare that the research was conducted in the absence of any commercial or financial relationships that could be construed as a potential conflict of interest.
All claims expressed in this article are solely those of the authors and do not necessarily represent those of their affiliated organizations, or those of the publisher, the editors and the reviewers. Any product that may be evaluated in this article, or claim that may be made by its manufacturer, is not guaranteed or endorsed by the publisher.
We would like to thank Editage (www.editage.com) for English language editing.
The Supplementary Material for this article can be found online at: https://www.frontiersin.org/articles/10.3389/fonc.2022.902991/full#supplementary-material
CT, computed tomography; AUC, area under the receiver operating characteristic curve; CI, confidence interval; IQR, Interquartile range; BMI, Body Mass Index; HU, Hounsfield unit.
1. Sherlock M, Scarsbrook A, Abbas A, Fraser S, Limumpornpetch P, Dineen R, et al. Adrenal Incidentaloma. Endocr Rev (2020) 41:775–820. doi: 10.1210/endrev/bnaa008
2. Fassnacht M, Arlt W, Bancos I, Dralle H, Newell-Price J, Sahdev A, et al. Management of Adrenal Incidentalomas: European Society of Endocrinology Clinical Practice Guideline in Collaboration With the European Network for the Study of Adrenal Tumors. Eur J Endocrinol (2016) 175:G1–1G34. doi: 10.1530/EJE-16-0467
3. Maurea S, Mainolfi C, Bazzicalupo L, Panico MR, Imparato C, Alfano B, et al. Imaging of Adrenal Tumors Using FDG PET: Comparison of Benign and Malignant Lesions. AJR Am J Roentgenol (1999) 173:25–9. doi: 10.2214/ajr.173.1.10397094
4. Platzek I, Sieron D, Plodeck V, Borkowetz A, Laniado M, Hoffmann RT. Chemical Shift Imaging for Evaluation of Adrenal Masses: A Systematic Review and Meta-Analysis. Eur Radiol (2019) 29:806–17. doi: 10.1007/s00330-018-5626-5
5. Nagayama Y, Inoue T, Oda S, Tanoue S, Nakaura T, Morinaga J, et al. Unenhanced Dual-Layer Spectral-Detector CT for Characterizing Indeterminate Adrenal Lesions. Radiology (2021) 301:369–78. doi: 10.1148/radiol.2021202435
6. Connolly MJ, McInnes M, El-Khodary M, McGrath TA, Schieda N. Diagnostic Accuracy of Virtual non-Contrast Enhanced Dual-Energy CT for Diagnosis of Adrenal Adenoma: A Systematic Review and Meta-Analysis. Eur Radiol (2017) 27:4324–35. doi: 10.1007/s00330-017-4785-0
7. Nagayama Y, Inoue T, Oda S, Tanoue S, Nakaura T, Ikeda O, et al. Adrenal Adenomas Versus Metastases: Diagnostic Performance of Dual-Energy Spectral CT Virtual Noncontrast Imaging and Iodine Maps. Radiology (2020) 296:324–32. doi: 10.1148/radiol.2020192227
8. Mayo-Smith WW, Song JH, Boland GL, Francis IR, Israel GM, Mazzaglia PJ, et al. Management of Incidental Adrenal Masses: A White Paper of the ACR Incidental Findings Committee. J Am Coll Radiol (2017) 14:1038–44. doi: 10.1016/j.jacr.2017.05.001
9. Szolar DH, Kammerhuber F. Quantitative CT Evaluation of Adrenal Gland Masses: A Step Forward in the Differentiation Between Adenomas and Nonadenomas. Radiology (1997) 202:517–21. doi: 10.1148/radiology.202.2.9015083
10. Kebapci M, Kaya T, Gurbuz E, Adapinar B, Kebapci N, Demirustu C. Differentiation of Adrenal Adenomas (Lipid Rich and Lipid Poor) From Nonadenomas by Use of Washout Characteristics on Delayed Enhanced CT. Abdom Imaging (2003) 28:709–15. doi: 10.1007/s00261-003-0015-0
11. Foti G, Malleo G, Faccioli N, Guerriero A, Furlani L, Carbognin G. Characterization of Adrenal Lesions Using MDCT Wash-Out Parameters: Diagnostic Accuracy of Several Combinations of Intermediate and Delayed Phases. Radiol Med (2018) 123:833–40. doi: 10.1007/s11547-018-0911-6
12. Nagayama Y, Inoue T, Kato Y, Tanoue S, Kidoh M, Oda S, et al. Relative Enhancement Ratio of Portal Venous Phase to Unenhanced CT in the Diagnosis of Lipid-Poor Adrenal Adenomas. Radiology (2021) 301:360–8. doi: 10.1148/radiol.2021210231
13. Foti G, Faccioli N, Manfredi R, Mantovani W, Mucelli RP. Evaluation of Relative Wash-in Ratio of Adrenal Lesions at Early Biphasic CT. AJR Am J Roentgenol (2010) 194:1484–91. doi: 10.2214/AJR.09.3636
14. Szolar DH, Kammerhuber FH. Adrenal Adenomas and Nonadenomas: Assessment of Washout at Delayed Contrast-Enhanced CT. Radiology (1998) 207:369–75. doi: 10.1148/radiology.207.2.9577483
15. Moons KG, Altman DG, Reitsma JB, Ioannidis JP, Macaskill P, Steyerberg EW, et al. Transparent Reporting of a Multivariable Prediction Model for Individual Prognosis or Diagnosis (TRIPOD): Explanation and Elaboration. Ann Intern Med (2015) 162:W1–73. doi: 10.7326/M14-0698
16. Zhang B, Zhang H, Li X, Jin S, Yang J, Pan W, et al. Can Radiomics Provide Additional Diagnostic Value for Identifying Adrenal Lipid-Poor Adenomas From Non-Adenomas on Unenhanced Ct. Front Oncol (2022) 12:888778. doi: 10.3389/fonc.2022.888778
17. Abu-Arafeh A, Jordan H, Drummond G. Reporting of Method Comparison Studies: A Review of Advice, an Assessment of Current Practice, and Specific Suggestions for Future Reports. Br J Anaesth (2016) 117:569–75. doi: 10.1093/bja/aew320
18. Alba AC, Agoritsas T, Walsh M, Hanna S, Iorio A, Devereaux PJ, et al. Discrimination and Calibration of Clinical Prediction Models: Users Guides to the Medical Literature. JAMA (2017) 318:1377–84. doi: 10.1001/jama.2017.12126
19. Ng CS, Wei W, Altinmakas E, Li X, Ghosh P, Perrier NA, et al. Differentiation of Malignant and Benign Adrenal Lesions With Delayed CT: Multivariate Analysis and Predictive Models. AJR Am J Roentgenol (2018) 210:W156–156W163. doi: 10.2214/AJR.17.18428
20. Caoili EM, Korobkin M, Francis IR, Cohan RH, Platt JF, Dunnick NR, et al. Adrenal Masses: Characterization With Combined Unenhanced and Delayed Enhanced CT. Radiology (2002) 222:629–33. doi: 10.1148/radiol.2223010766
21. Caoili EM, Korobkin M, Francis IR, Cohan RH, Dunnick NR. Delayed Enhanced CT of Lipid-Poor Adrenal Adenomas. AJR Am J Roentgenol (2000) 175:1411–5. doi: 10.2214/ajr.175.5.1751411
22. Yi X, Guan X, Zhang Y, Liu L, Long X, Yin H, et al. Radiomics Improves Efficiency for Differentiating Subclinical Pheochromocytoma From Lipid-Poor Adenoma: A Predictive, Preventive and Personalized Medical Approach in Adrenal Incidentalomas. EPMA J (2018) 9:421–9. doi: 10.1007/s13167-018-0149-3
23. Mosconi C, Vicennati V, Papadopoulos D, Dalmazi GD, Morselli-Labate AM, Golfieri R, et al. Can Imaging Predict Subclinical Cortisol Secretion in Patients With Adrenal Adenomas? A CT Predictive Score. AJR Am J Roentgenol (2017) 209:122–9. doi: 10.2214/AJR.16.16965
24. Northcutt BG, Trakhtenbroit MA, Gomez EN, Fishman EK, Johnson PT. Adrenal Adenoma and Pheochromocytoma: Comparison of Multidetector CT Venous Enhancement Levels and Washout Characteristics. J Comput Assist Tomogr (2016) 40:194–200. doi: 10.1097/RCT.0000000000000343
25. Pennanen M, Raade M, Louhimo J, Sane T, Heiskanen I, Arola J, et al. Adrenocortical Tumours: High CT Attenuation Value Correlates With Eosinophilia But Does Not Discriminate Lipid-Poor Adenomas From Malignancy. J Clin Pathol (2013) 66:1076–80. doi: 10.1136/jclinpath-2013-201513
26. Akbulut S, Erten O, Kahramangil B, Gokceimam M, Kim YS, Li P, et al. A Critical Analysis of Computed Tomography Washout in Lipid-Poor Adrenal Incidentalomas. Ann Surg Oncol (2021) 28:2756–62. doi: 10.1245/s10434-020-09329-1
27. Inan N, Arslan A, Akansel G, Anik Y, Balci NC, Demirci A. Dynamic Contrast Enhanced MRI in the Differential Diagnosis of Adrenal Adenomas and Malignant Adrenal Masses. Eur J Radiol (2008) 65:154–62. doi: 10.1016/j.ejrad.2007.03.012
28. Park BK, Kim B, Ko K, Jeong SY, Kwon GY. Adrenal Masses Falsely Diagnosed as Adenomas on Unenhanced and Delayed Contrast-Enhanced Computed Tomography: Pathological Correlation. Eur Radiol (2006) 16:642–7. doi: 10.1007/s00330-005-0017-0
29. Park SW, Kim TN, Yoon JH, Kim TH, Chung JM, Jeon UB, et al. The Washout Rate on the Delayed CT Image as a Diagnostic Tool for Adrenal Adenoma Verified by Pathology: A Multicenter Study. Int Urol Nephrol (2012) 44:1397–402. doi: 10.1007/s11255-012-0202-4
30. Li Z, Li Q, Shen Y, Li A, Li H, Liang L, et al. Adrenal and Nephrogenic Hypertension: An Image Quality Study of Low Tube Voltage, Low-Concentration Contrast Media Combined With Adaptive Statistical Iterative Reconstruction. Int J Clin Pract (2016) 70 Suppl 9B:B29–36. doi: 10.1111/ijcp.12860
Keywords: adrenal adenoma, computed tomography, model, clinic, distinguish
Citation: Pan W, Zhang H, Jin S, Li X, Yang J, Zhang B, Dong X, Ma L and Ji W (2022) Development and Validation of a Clinical-Image Model for Quantitatively Distinguishing Uncertain Lipid-Poor Adrenal Adenomas From Nonadenomas. Front. Oncol. 12:902991. doi: 10.3389/fonc.2022.902991
Received: 23 March 2022; Accepted: 13 June 2022;
Published: 13 July 2022.
Edited by:
Lei Hu, Shanghai Jiao Tong University, ChinaCopyright © 2022 Pan, Zhang, Jin, Li, Yang, Zhang, Dong, Ma and Ji. This is an open-access article distributed under the terms of the Creative Commons Attribution License (CC BY). The use, distribution or reproduction in other forums is permitted, provided the original author(s) and the copyright owner(s) are credited and that the original publication in this journal is cited, in accordance with accepted academic practice. No use, distribution or reproduction is permitted which does not comply with these terms.
*Correspondence: Huangqi Zhang, MTIyNDE5MDAwNEBxcS5jb20=; Wenbin Ji, d2IuakAxNjMuY29t
†These authors have contributed equally to this work and share first authorship
Disclaimer: All claims expressed in this article are solely those of the authors and do not necessarily represent those of their affiliated organizations, or those of the publisher, the editors and the reviewers. Any product that may be evaluated in this article or claim that may be made by its manufacturer is not guaranteed or endorsed by the publisher.
Research integrity at Frontiers
Learn more about the work of our research integrity team to safeguard the quality of each article we publish.