 Santiago Olaechea1
 Bhavani S. Gannavarapu2
 Christian Alvarez1
 Anne Gilmore1
 Brandon Sarver3
 Donglu Xie4
 Rodney Infante1*
 Puneeth Iyengar2*
- 1Center for Human Nutrition, University of Texas Southwestern Medical Center, Dallas, TX, United States
- 2Department of Radiation Oncology, University of Texas Southwestern Medical Center, Dallas, TX, United States
- 3McGovern Medical School, University of Texas Health Science Center, Houston, TX, United States
- 4Academic Information Systems, University of Texas Southwestern Medical Center, Dallas, TX, United States
Aim: To investigate the diagnostic potential of and associations between tumor 18F‐FDG uptake on PET imaging and cancer-associated weight loss.
Methods: 774 non-small cell lung cancer (NSCLC) patients with pre-treatment PET evaluated between 2006 and 2014 were identified. Using the international validated definition of cachexia, the presence of clinically significant pretreatment cancer-associated weight loss (WL) was retrospectively determined. Maximum Standardized Uptake Value (SUVMax) of 18F‐FDG was recorded and dichotomized based on 3 experimental cutpoints for survival analyses. Each SUVMax cutpoint prioritized either survival differences, total cohort comparison sample sizes, or sample size by stage. Patient outcomes and associations between SUVMax and cancer-associated weight loss were assessed by multivariate, categorical, and survival analyses.
Results: Patients were found to have an increased likelihood of having WL at diagnosis associated with increasing primary tumor SUVMax after controlling for potentially confounding patient and tumor characteristics on multivariate logistic regression (OR 1.038; 95% CI: 1.012, 1.064; P=0.0037). After stratifying the cohort by WL and dichotomized SUVMax, both factors were found to be relevant in predicting survival outcomes when the alternative variable was constant. Of note, the most striking survival differences contributed by WL status occurred in high SUVMax groups, where the presence of WL predicted a median survival time detriment of up to 10 months, significant regardless of cutpoint determination method applied to categorize high SUVMax patients. SUVMax classification was found to be most consistently relevant in both WL and no WL groups.
Conclusions: The significant positive association between significant pretreatment cancer-associated weight loss and primary tumor SUVMax underscores increased glucose uptake as a component of catabolic tumor phenotypes. This substantiates 18F‐FDG PET analysis as a prospective tool for assessment of cancer-associated weight loss and corresponding survival outcomes. Furthermore, the survival differences observed between WL groups across multiple SUVMax classifications supports the importance of weight loss monitoring in oncologic workups. Weight loss in the setting of NSCLCs with higher metabolic activity as determined by 18F‐FDG PET signal should encourage more aggressive and earlier palliative care interventions.
1 Introduction
Cancer cachexia is a multifactorial syndrome characterized by skeletal muscle wasting and depletion of adipose stores (1, 2). There are limited tools beyond overt weight loss documentation routinely utilized in the diagnosis and risk assessment of cachexia manifestation (3). Evolving preclinical research has identified various explicit mechanisms through which cachexia-inducing tumors manipulate systemic inflammatory and metabolic states ultimately leading to pronounced physical wasting (4–7). This presents a discrepancy between the breadth of mechanistic understanding of cachexia and the limited diagnostic methods employed in clinical practice. The Cachexia Score (CASCO), is an example of a comprehensive method of evaluation that implements these findings, as it incorporates measures of relevant inflammatory markers, metabolic disturbances, physical performance, anorexia, quality of life detriments, and lean body mass changes in addition to weight loss assessment in cachexia grading (8). However, the feasibility of this method is limited by the lack of consistent collection of this data in the clinical setting. Another interfering factor in the development of practical diagnostic tools is the heterogeneity of mechanisms capable of inducing weight loss across diverse tumor histologies and sites. Tumors can generate systemic catabolism through processes including but not limited to: the induction of a metabolically demanding inflammatory state, aggressive depletion of metabolites, and anorexia through disadvantageous hypothalamic signaling or mechanical obstruction from tumor mass effect (4–7, 9–11). As benchside research continues to refine our understanding of cancer cachexia at the molecular and cellular level, we set out to probe for diagnostic potential in routinely obtained tumor imaging characteristics.
Positron Emission Tomography (PET) is a functional imaging technique commonly used in the initial staging of patients with newly diagnosed solid tumors. PET is often performed with the intravenous administration of fluorine-18-fluoro-2-deoxy-D-glucose (18F‐FDG), a positron emitting glucose molecule. 18F‐FDG accumulates in organs with high glucose utilization such as the brain, heart, and liver. Malignant cells demonstrate increased uptake of 18F-FDG on PET due to overexpression of GLUT receptors and elevated intracellular levels of hexokinase, which generate increased rates of glycolysis (6, 12, 13). Another contributing phenomenon is the Warburg effect, in which tumor cells preferentially undergo anaerobic glycolysis to produce ATP, regardless of being in nonhypoxic conditions (14). The endpoint of these metabolic processes is fluorinated glucose trapped within the cell with characteristic increased activity on PET. The measure of 18F-FDG uptake is commonly quantified using standardized uptake values (SUV), a measurement of tracer uptake in a lesion normalized to injected activity and volume of distribution (15, 16). SUV should therefore function as a measure of tumor glycolytic capacity. This might be particularly relevant within the context of cancer-associated weight loss and cachexia, as escalated glucose consumption by tumors can distort systemic metabolic flux and suggest increasingly malignant genetic dysregulation through mechanisms such as the Warburg effect. Our research team previously demonstrated the relevance of 18F‐FDG uptake in incidence of significant pretreatment weight loss and survival for patients with gastroesophageal cancer (17). Prior studies have supported alternate uses of PET imaging for the detection of cancer cachexia (18), linking low hepatic uptake (19) and increased metabolically active brown adipose tissue uptake (20) of 18F‐FDG with the syndrome.
The clinical hallmark of cancer cachexia is unintentional weight loss. The presence of this finding at the time of detection of non-small cell lung cancer (NSCLC) portends poor survival, even after controlling for other factors such as age, sex, comorbidity, and tumor stage (21–23). Although targeted interventions are currently limited (24–26), evidence highlighting the benefits of nutritional rehabilitation for weight-losing cancer patients continues to emerge (27–30). Therefore, early identification of patients bearing tumors with metabolic ramifications is essential. The purpose of this study was to determine the association between primary tumor 18F‐FDG uptake via Maximum SUV (SUVMax) and the presence of significant cancer-associated weight loss at the time of diagnosis, prior to any cancer-directed intervention, in a large cohort of NSCLC patients. We also aimed to investigate differential survival outcomes based on SUVMax and pretreatment weight loss. Further characterization of the effects of and potential associations between these factors may clarify metabolic disruptions exerted by tumors that lead to weight loss. Moreover, evaluating the prospective utility of weight assessment and tumor 18F‐FDG uptake might help providers identify NSCLC patients with poor prognoses.
2 Methods
2.1 Population Cohort
Using a prospectively maintained tumor registry from a single tertiary care center and retrospective patient electronic medical record review, we identified 774 patients with NSCLC diagnosed between 1/1/2006 and 12/31/2013 with pre-treatment PET available for review. Exclusion criteria for this study included synchronous or metachronous malignancy and incomplete data. Patients with carcinoma in situ, carcinoid, neuroendocrine, lymphoma, melanoma, or sarcoma tumor histologies were excluded. Patient and tumor characteristics, including age, sex, race, date of death/last follow up, Charlson comorbidity index (CCI) score, primary tumor site, tumor grade, and cancer stage, were recorded. Descriptive statistics were used to summarize patient and tumor characteristics. The 7th and 8th editions of the American Joint Committee on Cancer (AJCC) staging system were adopted in 2009 and 2018, respectively, but patient stage was not adjusted for the purpose of this study. This study was approved by our Institutional Review Board at UT Southwestern.
2.2 Assessment of Cancer-Associated Weight Loss
We reviewed medical records—including vital signs, physician notes, and dietician notes at the time of cancer diagnosis but before any therapeutic measure—for documented weight loss and associated symptoms. At our health system, patients are routinely weighed as a part of each office visit, and this measurement is documented in the electronic medical record. Patients missing weight data before the initiation of therapy were excluded. Determination of clinically significant pretreatment cancer-associated weight loss (WL) was based on the validated international consensus definition of cancer cachexia (1). WL was defined as unintentional weight loss > 5% within 6 months preceding cancer diagnosis in patients with body mass index ≥ 20 kg/m2 or unintentional weight loss > 2% in patients with body mass index < 20 kg/m2. Patients with stable weight, weight gain, or purposeful weight loss were classified as not having WL. When multiple measures of weight were available in the pre-treatment period, a consistent weight decrease was required for a patient to be classified as having WL.
2.3 Positron Emission Tomography (PET) and SUVMax Cutpoint Determination
PET with 18F-FDG was obtained in all analyzed patients at the time of diagnosis and prior to any oncologic intervention. After a standard uptake phase of 60-90 minutes, each patient underwent computed tomography (CT) imaging from the level of the midbrain to the midthigh at 3 mm intervals with arms raised above the head. Following completion of the CT portion of the study, 3D emission images were obtained through the same distance. Oral contrast was used in all patients, unless otherwise contraindicated. The CT images were generated for the purpose of PET image optimization and for anatomical correlation of PET findings. Each PET report was generated by a trained nuclear medicine physician. SUVMax of the primary tumor, serum blood glucose level at the time of scan, and time interval between 18F‐FDG injection and scan initiation, when available, were recorded.
We created 3 experimental SUVMax cutpoints. A cutpoint optimizing survival was calculated through the method of Contal and O’Quigley (31, 32), which determined the optimal primary tumor SUVMax threshold for survival time. The total cohort median cutpoint prioritized sample size by dichotomizing the cohort using the overall median SUVMax. The stage medians cutpoint method similarly prioritized sample size and stratified the patients into high/low SUVMax groups by their respective stage median SUVMax.
Tumor PET images and L3 CT slices from the time of cancer diagnosis were obtained for representative patients from relevant groups. PET images were obtained to demonstrate tumor 18F-FDG uptake. The L3 level was selected from CT imaging for visualization of psoas and erector spinae muscle groups. Both representative patients had matching gender, tumor histology, and tumor stage at diagnosis.
2.4 Statistics
All tests were two-sided and performed at the 5% significance level. SPSS Statistics version 28.0.1.1(International Business Machines, Armonk, NY).
2.4.1 Multivariate
Multivariate logistic regression (N=700) was conducted with WL at diagnosis as the dependent binary variable. Covariates included in this analysis were patient sex, age at diagnosis, race, alcohol history, tobacco history, and CCI score, as well as tumor characteristics including histology, stage and SUVMax. All variables were categorical with the exception of age at diagnosis and tumor SUVMax. Due to tumor grade limiting the sample size available for analysis, the parameter was not included in the primary multivariate analysis. The results from the limited sample (N=408) multivariate analysis including tumor grade as a covariate are included in Supplementary Table 1.
2.4.2 Categorical
Chi square testing was carried out to evaluate differences between expected and observed incidence of WL in high and low SUVMax groups. Tests were repeated for each cutpoint method.
2.4.3 Survival
Survival probability was plotted using Kaplan-Meier estimator. Event occurrence was defined by patient death. Time to censoring or event was provided by the time in months from the cancer diagnosis date to the date of patient death or last contact, respectively. Significance of survival differences were evaluated through log-rank testing.
Groups evaluated for survival included the overall cohort, patients with or without WL at diagnosis, and patients with high or low SUVMax. Further analyses divided the cohort 4 groups on the basis of +/- WL at diagnosis and high/low SUVMax, in which log-rank testing was done across groups with one differing variable. All tests involving SUVMax were repeated for each cutpoint method
3 Results
3.1 Patient Cohort
Patient characteristics summarized in Table 1. The median age at diagnosis was 66 years (interquartile range, 58-74); 47.90% of patients were female and 34.20% were non-white. 27.80%, 10.80%, 32.30%, and 29.10% patients had stage 1, 2, 3, and 4 NSCLC, respectively. WL was identified in 24.70% of patients.

Table 1 Patient Characteristics and Incidence of Significant Pretreatment Cancer-Associated Weight Loss (WL).
3.2 Associations Between SUVMax and Cancer-Associated Weight Loss at Diagnosis
After controlling for covariates (sex, age at diagnosis, race, alcohol history, tobacco history, CCI score, histology, stage), SUVMax demonstrated a statistically significant association with the incidence of cancer-associated weight loss at diagnosis with an odds ratio of 1.038 (95% CI: 1.012, 1.064; P=0.0037; Table 2). The same analysis using the sample-limiting parameter of tumor stage demonstrated an odds ratio of 1.050 (95% CI: 1.011, 1.091; P=0.0110; Supplementary Table 1).
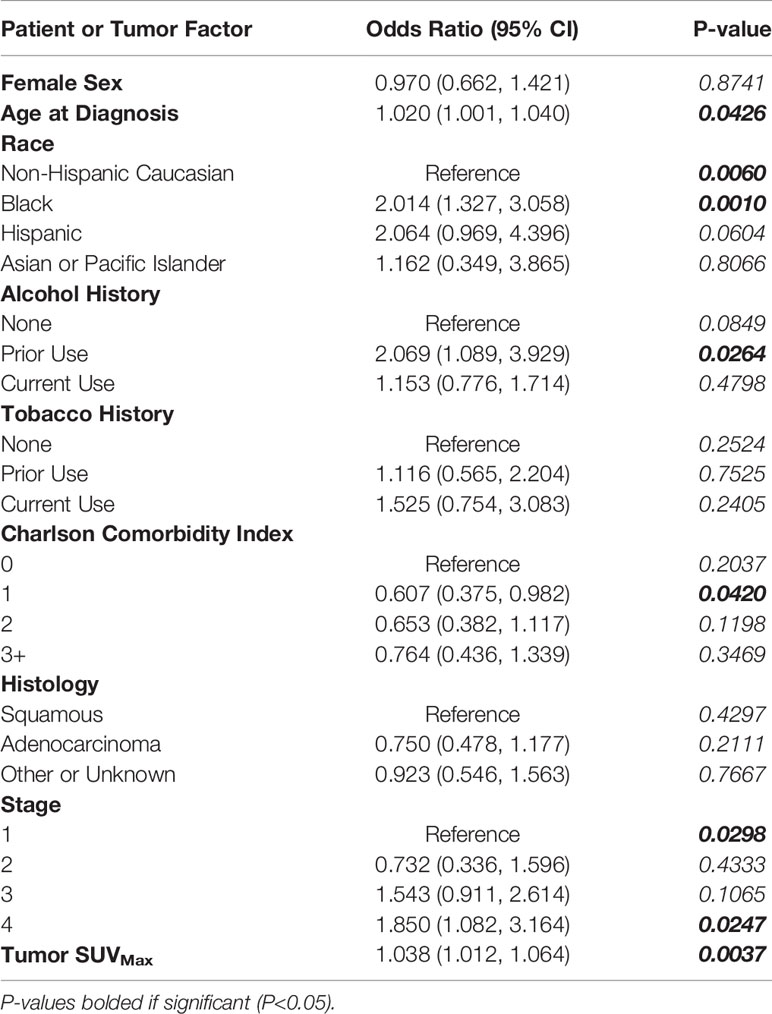
Table 2 Multivariate Logistic Regression Evaluating Relationship of Tumor SUVMax with Patient and Tumor Characteristics as Covariates with Incidence of Significant Pretreatment Cancer-Associated Weight Loss (WL).
The calculated survival optimizing cutpoint of 6.8 defined 220 patients as low SUVMax and 554 patients as high SUVMax. The incidence of WL at diagnosis was 15.00% in the low SUVMax group and 28.52% in the high SUVMax group (P<0.0001, Table 3).
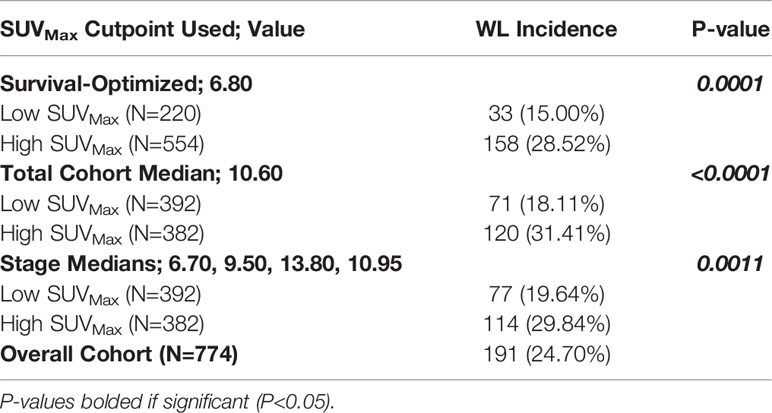
Table 3 Incidence of Significant Pretreatment Cancer-Associated Weight Loss (WL) by High and Low SUVMax Determined by Experimental Cutpoints.
Groups defined by sample size optimizing cutpoints similarly categorized 392 patients into low SUVMax groups and 382 patients into high SUVMax groups. Across groups defined by the total cohort median SUVMax of 10.60, WL incidence in patients was 18.11% and 31.41% in patients with low and high SUVMax, respectively (P<0.0001). Median SUVMax values for ascending tumor stage values were 6.70, 9.50, 13.80, and 10.95. WL incidence was 19.64% and 29.84% in patients with stage-defined low and high SUVMax values respectively (P=0.0011; Table 3).
Artifact-corrected PET images at the level of the primary tumor and CT images at the L3 level were obtained for representative patients with and without WL. One patient demonstrated low tumor SUVMax by every cutpoint method and no WL at diagnosis (Supplementary Figures 1A, B). The second representative patient had high SUVMax and WL at diagnosis (Supplementary Figures 1C, D).
3.3 Survival Associations
The median survival for the entire cohort was 24 months (95% CI: 20.222, 27.778). Patients were grouped into one of four groups on the basis of WL status and SUVMax dichotomized above and below the calculated cutpoints. WL and high SUVMax by any cutpoint determination method predicted for poor survival outcomes to a significant degree as demonstrated by log-rank testing (Supplementary Table 2).
Table 4 and Figures 1-3 demonstrate survival findings and comparisons between groups with varying WL and SUVMax status utilizing the different cutpoint determination methods. Regardless of the cutpoint determining method implemented, both WL and SUVMax status demonstrated significant or near-significant associations with survival when the alternative variable was held constant. Notably, in the stage median cutpoint survival analysis, where sample size matching was prioritized by stage, WL significantly predicted for survival outcome in both low (P=0.0449) and high (P=0.0004) SUVMax groups.
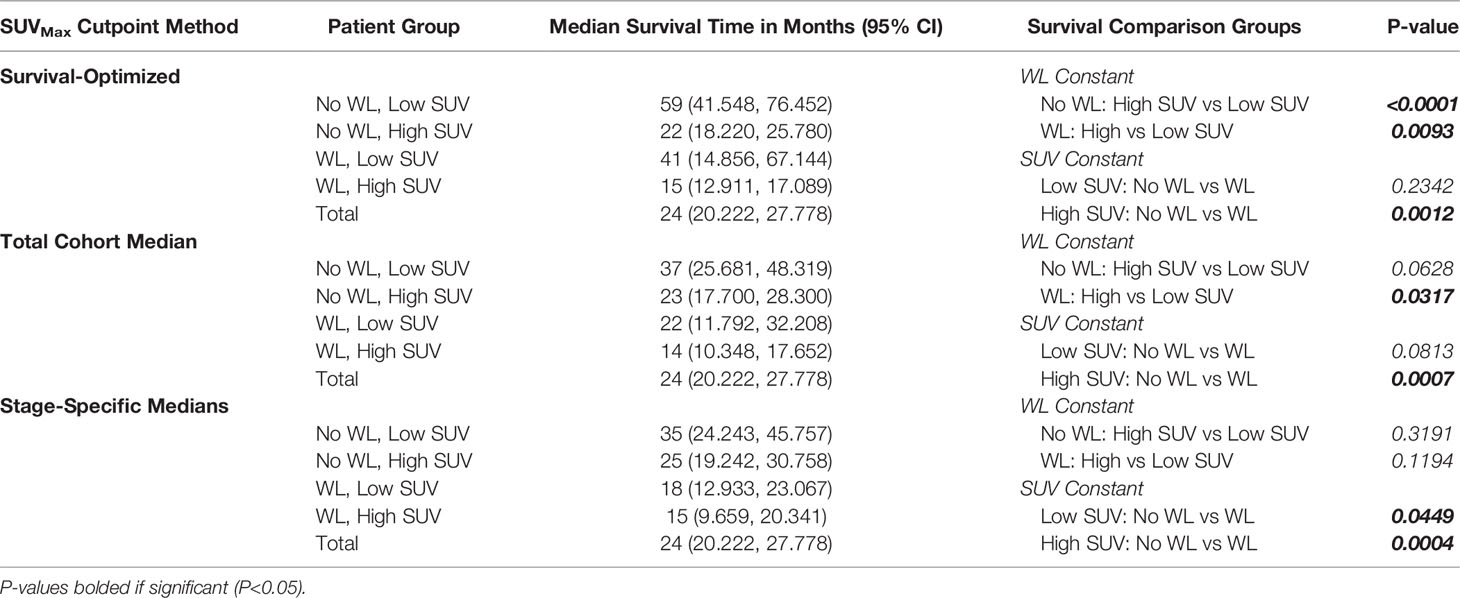
Table 4
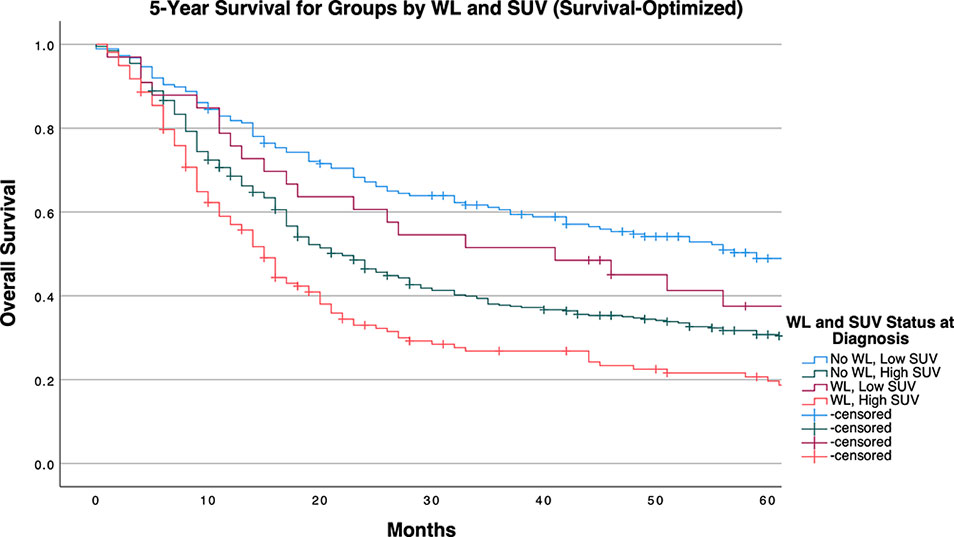
Figure 1 5-Year Overall Survival Stratified by Significant Pretreatment Cancer-Associated Weight Loss (WL) and Primary Tumor SUVMax Group Determined by Survival-Optimized Cutpoint.
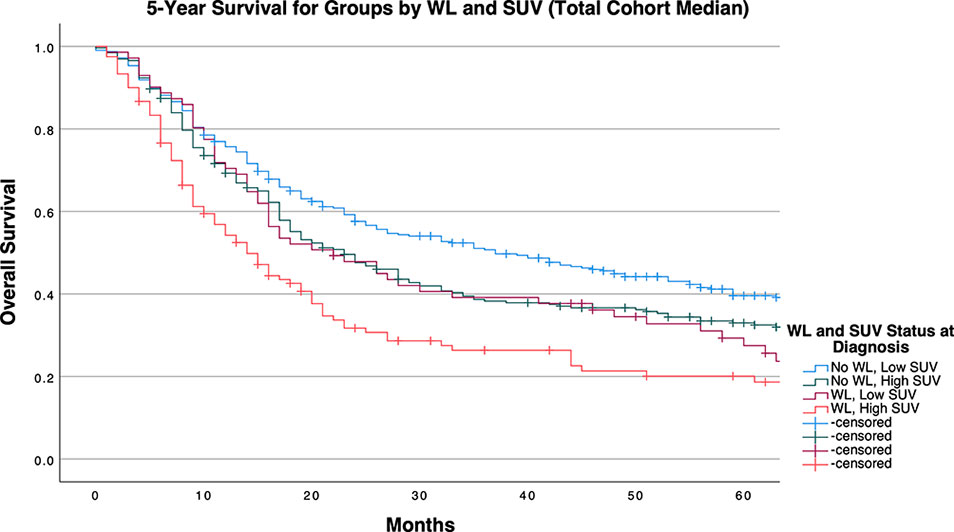
Figure 2 5-Year Overall Survival Stratified by Significant Pretreatment Cancer-Associated Weight Loss (WL) and Primary Tumor SUVMax Group Determined by Cohort Median Cutpoint.
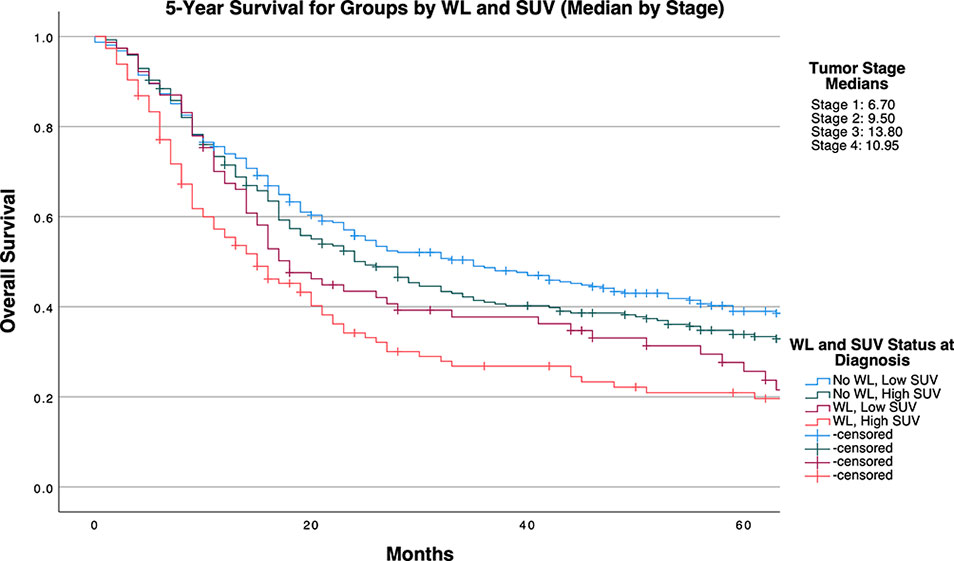
Figure 3 5-Year Overall Survival Stratified by Presence of Significant Pretreatment Cancer-Associated Weight Loss (WL) and Primary Tumor SUVMax Group Determined by Stage-Specific Cutpoints.
Broadly, after repeating these analyses in stage-specific subcohorts, SUVMax appeared to retain significance in lower stage tumors, with WL at diagnosis demonstrating associations with survival to a higher frequency in higher stage tumors (Supplementary Tables 3–5 and Supplemental Figures 2–4).
4 Discussion
4.1 Study Findings
Our study demonstrates a significant positive association between primary tumor SUVMax and pre-treatment cancer-associated weight loss, as well as observable survival detriments related to either and both factors. Through multivariate logistic regression, we accounted for potential confounding factors including patient characteristics (age, sex, race, risk behaviors, comorbidities) as well as conventional tumor classifications (histology, grade, stage), further implicating a mechanistic association between these variables. By dichotomizing SUVMax across multiple cutpoint calculation methods, we provided experimental models for implementing SUVMax diagnostic cutoffs to assess for the presence of cancer-associated weight loss. Regardless of cutpoint method, patients with SUVMax values above a cutpoint had a 1.5 to 2 times increased incidence of pre-treatment cancer-associated weight loss qualifying for diagnosis of cachexia. Mechanistically, these findings underscore the relevance of heightened tumor glucose metabolism to the systemic metabolic derangements classically observed in cachexia. Clinically, our study supports both a heightened consideration of weight loss with increasing tumor SUVMax value and a crucial association between clinically significant pretreatment weight loss identified at diagnosis with survival detriment in patients with both high or low SUVMax tumors.
4.2 Clinical Relevance
The associations observed between tumor SUVMax and WL at diagnosis in multivariate analysis suggest a potential prognostic value of PET imaging results in predicting presence or risk of cancer-associated weight loss. By applying multiple cutpoint strategies, we demonstrated that optimal PET measure cutoff values vary depending on the intended prognostic measure. In this project, these measures included WL at diagnosis and survival prediction. Furthermore, our stage stratification of both survival analyses and cutpoint determination indicate differential utility of PET imaging results based on the depth of stratification applied within the cancer type.
To control for the potential bias of later stage tumors (with known survival detriment) being disproportionally classified as having high PET imaging results, our stage-specific median cutpoint group balanced SUVMax groups by stage. Still, the presence of WL at diagnosis significantly predicted a survival detriment independent of SUVMax status, as median survival time was decreased by approximately 17 months in patients with SUVMax below the stage-tailored cutpoint, and 10 months in patients with higher SUVMax values. This trend was consistently observed when analyses were conducted separately for each stage, albeit with diminished significance likely attributable to the limited statistical power permitted by multiple divisions of our cohort. Notably, within this stage stratified cohort, SUVMax surpassed WL as the primarily significant determinant of survival as indicated by the group comparisons in patients with stage 1 tumors. Meeting criteria for WL at diagnosis exceeded SUVMax as the primary determinant factor towards survival detriment. Of note, even when the cutpoint selected favored the relevance of SUVMax in survival (as determined by the method of Contal and O’Quigley), WL significantly predicted a detriment in survival within the high SUVMax group, which retained significance in stage 3 tumors after further stratification (with near-significant results in stage 1 tumors). The relevance of weight loss at presentation to survival of patients with high SUVMax tumors underscores an objective detriment in patient outcomes exerted by cancer-associated weight loss in patients with severe NSCLC tumor phenotypes.
4.3 Mechanism of Cancer-Associated Weight Loss and Tumor 18F‐FDG Uptake
The observed positive association between primary tumor SUVMax and cancer-associated weight loss is concordant with results observed in murine models of cancer cachexia. In a prior study by Penet et al., in-vivo cachexia-inducing MAC16 tumors were characterized by higher 18F‐FDG uptake than histologically similar non-cachexia-inducing MAC13 tumors (33). With validation from our large clinical database, these results shed additional light on cancer metabolism, supporting the relevance of elevated tumor glucose consumption (signified by high 18FDG uptake) in the induction or presentation of tumor phenotype capable of inducing weight loss.
The study by Penet et al. also found that mice with cachectic MAC16 tumors underwent significant depletion of lipid tissue in their adipose tissue and skeletal muscle, with sparing of lipid at tumor sites (33). These effects highlight the complexity of cachexia manifestation, as there were heterogenous alterations of metabolic state at the systemic level and at the immediate tumor microenvironment. The exact process retains pathophysiologic ambiguity, as current literature supports various mechanisms contributing to the induction of lipolysis in cachexia. These include upregulated inflammatory signaling through IL-6 messengers including leukemia inhibitory factor (34, 35), thermogenic gene induction through tumor signals such as PTHrP (36), and physiologic lipolysis as a downstream metabolic effect of increased energy expenditure through intensified tumor glucose consumption (37). The importance of maladaptive induction of lipolysis in cachexia has been further supported by murine studies demonstrating profoundly elevated activation of thermogenic brown adipose tissue in cachectic over non-cachectic mice, despite matched food intake and thermoneutral conditions (38). In parallel, multiple clinical studies have revealed positive associations between brown adipose tissue induction and cachexia incidence in humans (11, 20, 35, 36). Reasonably, the capability of 18F‐FDG PET analysis to measure the activity of brown adipose tissue (39) further augments its potential utility in the assessment and prediction of cancer-associated weight loss and cachexia (18).
4.4 Study Limitations
This analysis has a number of limitations. For example, WL was retrospectively assessed from medical records rather than a formal prospective protocol. Although WL was based on the consensus definition of cancer cachexia, more specific diagnostic criteria indicative of a cachectic state - such as specific biomarkers, enhanced lipolysis, and sarcopenia- were omitted due to limitations on what is routinely obtained in patient management (25). Cachexia-specific biomarkers include molecular assays and measures of serum cytokines that were not available for this cohort. The absence of brown adipose tissue analysis on PET reports prohibited our inclusion of maladaptive lipolysis. Regarding sarcopenia, this would have entailed comprehensive evaluations of skeletal muscle mass and function. Although CT imaging permits an estimation of total body skeletal muscle mass through visualization of major muscle groups, we lacked longitudinal imaging data for comparison (40–43). Furthermore, muscle function tests such as grip strength were not routinely obtained for this cohort.
4.5 Conclusion
Our study supports a positive association between increased tumor glucose utilization and the development of cancer-associated weight loss that is independent of various potential confounding patient and tumor characteristics. Moreover, we identified a vulnerability of patient survival time to significant weight loss prior to cancer diagnosis, particularly for patients with tumors demonstrating high 18F‐FDG uptake.
PET imaging is routinely used for prognosing NSCLC patients using radiolabeled 18F‐FDG uptake. Our study validates this function by consistently demonstrating the relevance of SUVMax obtained from this technique in survival prognosis. Given the maladaptive metabolic changes that underpin both cancer-associated weight loss and PET imaging enhancement by 18F‐FDG uptake (18), we explored the potential alternative clinical contributions of this imaging modality. Our outcomes encourage heightened consideration of cancer-associated weight loss in NSCLC patient management and substantiate prospective clinical trials to further validate the effectiveness of 18F‐FDG PET analysis within the workup of cancer-associated weight loss and cachexia.
Data Availability Statement
The original contributions presented in the study are included in the article/Supplementary Material, further inquiries can be directed to the corresponding authors.
Author Contributions
SO BG RI PI designed the study. DX, BG, and SO contributed to and organized the database. SO and BG performed statistical analyses. BG and SO wrote sections of the manuscript. All authors contributed to manuscript revision, read, and approved the submitted version.
Funding
This work was supported by National Institutes of Health [P30 CA142543]; Burroughs Wellcome Fund Career Awards for Medical Scientists [1019692]; American Gastroenterological Association Scholar Award [2019AGARSA3]; American Cancer Society grant [133889-RSG-19-195-01-TBE]; Cancer Prevention and Research Institute of Texas [RP200170]; and V Foundation Scholar Award [V2019-014].
Conflict of Interest
The authors declare that the research was conducted in the absence of any commercial or financial relationships that could be construed as a potential conflict of interest.
Publisher’s Note
All claims expressed in this article are solely those of the authors and do not necessarily represent those of their affiliated organizations, or those of the publisher, the editors and the reviewers. Any product that may be evaluated in this article, or claim that may be made by its manufacturer, is not guaranteed or endorsed by the publisher.
Supplementary Material
The Supplementary Material for this article can be found online at: https://www.frontiersin.org/articles/10.3389/fonc.2022.900712/full#supplementary-material
References
1. Fearon K, Strasser F, Anker SD, Bosaeus I, Bruera E, Fainsinger RL, et al. Definition and Classification of Cancer Cachexia: An International Consensus. Lancet Oncol (2011) 12(5):489–95. doi: 10.1016/S1470-2045(10)70218-7
2. Blum D, Stene GB, Solheim TS, Fayers P, Hjermstad MJ, Baracos VE, et al. Validation of the Consensus-Definition for Cancer Cachexia and Evaluation of a Classification Model–a Study Based on Data From an International Multicentre Project (EPCRC-CSA). Ann Oncol (2014) 25(8):1635–42. doi: 10.1093/annonc/mdu086
3. von Haehling S, Anker SD. Cachexia as a Major Underestimated and Unmet Medical Need: Facts and Numbers. J Cachexia Sarcopenia Muscle (2010) 1(1):1–5. doi: 10.1007/s13539-010-0002-6
4. Porporato PE. Understanding Cachexia as a Cancer Metabolism Syndrome. Oncogenesis (2016) 5:e200. doi: 10.1038/oncsis.2016.3
5. Fonseca G, Farkas J, Dora E, von Haehling S, Lainscak M. Cancer Cachexia and Related Metabolic Dysfunction. Int J Mol Sci (2020) 21(7):2321. doi: 10.3390/ijms21072321
6. Fearon KC, Glass DJ, Guttridge DC. Cancer Cachexia: Mediators, Signaling, and Metabolic Pathways. Cell Metab (2012) 16(2):153–66. doi: 10.1016/j.cmet.2012.06.011
7. Aoyagi T, Terracina KP, Raza A, Matsubara H, Takabe K. Cancer Cachexia, Mechanism and Treatment. World J Gastrointest Oncol (2015) 7(4):17–29. doi: 10.4251/wjgo.v7.i4.17
8. Argilés JM, Betancourt A, Guàrdia-Olmos J, Peró-Cebollero M, López-Soriano FJ, Madeddu C, et al. Validation of the CAchexia SCOre (CASCO). Staging Cancer Patients: The Use of miniCASCO as a Simplified Tool. Front Physiol (2017) 8:92(92). doi: 10.3389/fphys.2017.00092
9. Evans WJ, Morley JE, Argiles J, Bales C, Baracos V, Guttridge D, et al. Cachexia: A New Definition. Clin Nutr (2008) 27(6):793–9. doi: 10.1016/j.clnu.2008.06.013
10. Schcolnik-Cabrera A, Chavez-Blanco A, Dominguez-Gomez G, Duenas-Gonzalez A. Understanding Tumor Anabolism and Patient Catabolism in Cancer-Associated Cachexia. Am J Cancer Res (2017) 7(5):1107–35.
11. Rohm M, Zeigerer A, Machado J, Herzig S. Energy Metabolism in Cachexia. EMBO Rep (2019) 20(4):e47258. doi: 10.15252/embr.201847258
12. Yoshikawa T, Noguchi Y, Satoh S. Inhibition of IRS-1 Phosphorylation and the Alterations of GLUT4 in Isolated Adipocytes From Cachectic Tumor-Bearing Rats. Biochem Biophys Res Commun (1999) 256(3):676–81. doi: 10.1006/bbrc.1999.0394
13. Chaiyasit K, Jularattanaporn V, Muangsri K. Cancer Cachexia and Metabolism: A Challenge in Nutrition Oncology. J Asian Assoc Schools Phar (JAASP) (2014) 1:187–93.
14. Liberti MV, Locasale JW. The Warburg Effect: How Does it Benefit Cancer Cells? Trends Biochem Sci (2016) 41(3):211–8. doi: 10.1016/j.tibs.2015.12.001
15. Thie JA. Understanding the Standardized Uptake Value, its Methods, and Implications for Usage. J Nucl Med (2004) 45(9):1431–4.
16. Kinahan PE, Fletcher JW. Positron Emission Tomography-Computed Tomography Standardized Uptake Values in Clinical Practice and Assessing Response to Therapy. Semin Ultrasound CT MR (2010) 31(6):496–505. doi: 10.1053/j.sult.2010.10.001
17. Olaechea S, Gannavarapu BS, Gilmore A, Alvarez C, Iyengar P, Infante R. The Influence of Tumour Fluorodeoxyglucose Avidity and Cachexia Development on Patient Survival in Oesophageal or Gastroesophageal Junction Cancer. JCSM Clin Rep (2021) 6(4):128–36. doi: 10.1002/crt2.42
18. Han J, Harrison L, Patzelt L, Wu M, Junker D, Herzig S, et al. Imaging Modalities for Diagnosis and Monitoring of Cancer Cachexia. EJNMMI Res (2021) 11(1):94. doi: 10.1186/s13550-021-00834-2
19. Nakamoto R, Okuyama C, Ishizu K, Higashi T, Takahashi M, Kusano K, et al. Diffusely Decreased Liver Uptake on FDG PET and Cancer-Associated Cachexia With Reduced Survival. Clin Nucl Med (2019) 44(8):634–42. doi: 10.1097/rlu.0000000000002658
20. Beijer E, Schoenmakers J, Vijgen G, Kessels F, Dingemans AM, Schrauwen P, et al. A Role of Active Brown Adipose Tissue in Cancer Cachexia? Oncol Rev (2012) 6(1):e11. doi: 10.4081/oncol.2012.e11
21. Gannavarapu BS, Lau SKM, Carter K, Cannon NA, Gao A, Ahn C, et al. Prevalence and Survival Impact of Pretreatment Cancer-Associated Weight Loss: A Tool for Guiding Early Palliative Care. J Oncol Pract (2018) 14(4):e238–e50. doi: 10.1200/JOP.2017.025221
22. Dewys WD, Begg C, Lavin PT, Band PR, Bennett JM, Bertino JR, et al. Prognostic Effect of Weight Loss Prior to Chemotherapy in Cancer Patients. Eastern Cooperative Oncology Group. Am J Med (1980) 69(4):491–7. doi: 10.1016/s0149-2918(05)80001-3
23. Roch B, Coffy A, Jean-Baptiste S, Palaysi E, Daures J-P, Pujol J-L, et al. Cachexia - Sarcopenia as a Determinant of Disease Control Rate and Survival in non-Small Lung Cancer Patients Receiving Immune-Checkpoint Inhibitors. Lung Cancer (2020) 143:19–26. doi: 10.1016/j.lungcan.2020.03.003
24. Baba MR, Buch SA. Revisiting Cancer Cachexia: Pathogenesis, Diagnosis, and Current Treatment Approaches. Asia Pac J Oncol Nurs (2021) 8(5):508–18. doi: 10.4103/apjon.apjon-2126
25. Nishikawa H, Goto M, Fukunishi S, Asai A, Nishiguchi S, Higuchi K. Cancer Cachexia: Its Mechanism and Clinical Significance. Int J Mol Sci (2021) 22(16):8491. doi: 10.3390/ijms22168491
26. Roeland EJ, Bohlke K, Baracos VE, Bruera E, Del Fabbro E, Dixon S, et al. Management of Cancer Cachexia: ASCO Guideline. J Clin Oncol (2020) 38(21):2438–53. doi: 10.1200/JCO.20.00611
27. Nakajima N. Differential Diagnosis of Cachexia and Refractory Cachexia and the Impact of Appropriate Nutritional Intervention for Cachexia on Survival in Terminal Cancer Patients. Nutrients (2021) 13(3):915. doi: 10.3390/nu13030915
28. Amano K, Maeda I, Ishiki H, Miura T, Hatano Y, Tsukuura H, et al. Effects of Enteral Nutrition and Parenteral Nutrition on Survival in Patients With Advanced Cancer Cachexia: Analysis of a Multicenter Prospective Cohort Study. Clin Nutr (2021) 40(3):1168–75. doi: 10.1016/j.clnu.2020.07.027
29. van de Worp W, Schols A, Theys J, van Helvoort A, Langen RCJ. Nutritional Interventions in Cancer Cachexia: Evidence and Perspectives From Experimental Models. Front Nutr (2020) 7:601329. doi: 10.3389/fnut.2020.601329
30. Tobberup R, Carus A, Rasmussen HH, Falkmer UG, Jorgensen MG, Schmidt EB, et al. Feasibility of a Multimodal Intervention on Malnutrition in Patients With Lung Cancer During Primary Anti-Neoplastic Treatment. Clin Nutr (2021) 40(2):525–33. doi: 10.1016/j.clnu.2020.05.050
31. Contal C, O'Quigley J. An Application of Changepoint Methods in Studying the Effect of Age on Survival in Breast Cancer. Comput Stat Data (1999) 30(3):253–70. doi: 10.1016/S0167-9473(98)00096-6
32. Mandrekar J, Mandrekar S, Cha S. Cutpoint Determination Methods in Survival Analysis Using SAS. (2003).
33. Penet MF, Gadiya MM, Krishnamachary B, Nimmagadda S, Pomper MG, Artemov D, et al. Metabolic Signatures Imaged in Cancer-Induced Cachexia. Cancer Res (2011) 71(22):6948–56. doi: 10.1158/0008-5472.CAN-11-1095
34. Arora GK, Gupta A, Guo T, Gandhi AY, Laine A, Williams DL, et al. Janus Kinase Inhibitors Suppress Cancer Cachexia-Associated Anorexia and Adipose Wasting in Mice. JCSM Rapid Commun (2020) 3(2):115–28. doi: 10.1002/rco2.24
35. Arora GK, Gupta A, Narayanan S, Guo T, Iyengar P, Infante RE. Cachexia-Associated Adipose Loss Induced by Tumor-Secreted Leukemia Inhibitory Factor is Counterbalanced by Decreased Leptin. JCI Insight (2018) 3(14):e121221. doi: 10.1172/jci.insight.121221
36. Kir S, White JP, Kleiner S, Kazak L, Cohen P, Baracos VE, et al. Tumour-Derived PTH-Related Protein Triggers Adipose Tissue Browning and Cancer Cachexia. Nature (2014) 513(7516):100–4. doi: 10.1038/nature13528
37. Wang F, Liu H, Hu L, Liu Y, Duan Y, Cui R, et al. The Warburg Effect in Human Pancreatic Cancer Cells Triggers Cachexia in Athymic Mice Carrying the Cancer Cells. BMC Cancer (2018) 18(1):360. doi: 10.1186/s12885-018-4271-3
38. Tsoli M, Moore M, Burg D, Painter A, Taylor R, Lockie SH, et al. Activation of Thermogenesis in Brown Adipose Tissue and Dysregulated Lipid Metabolism Associated With Cancer Cachexia in Mice. Cancer Res (2012) 72(17):4372–82. doi: 10.1158/0008-5472.CAN-11-3536
39. Cohade C, Osman M, Pannu HK, Wahl RL. Uptake in Supraclavicular Area Fat ("USA-Fat"): Description on 18F-FDG PET/Ct. J Nucl Med (2003) 44(2):170–6.
40. Patzelt L, Junker D, Syvari J, Burian E, Wu M, Prokopchuk O, et al. MRI-Determined Psoas Muscle Fat Infiltration Correlates With Severity of Weight Loss During Cancer Cachexia. Cancers (Basel) (2021) 13(17):4433. doi: 10.3390/cancers13174433
41. Gu DH, Kim MY, Seo YS, Kim SG, Lee HA, Kim TH, et al. Clinical Usefulness of Psoas Muscle Thickness for the Diagnosis of Sarcopenia in Patients With Liver Cirrhosis. Clin Mol Hepatol (2018) 24(3):319–30. doi: 10.3350/cmh.2017.0077
42. Benedek Z, Todor-Boer S, Kocsis L, Bauer O, Suciu N, Coros MF. Psoas Muscle Index Defined by Computer Tomography Predicts the Presence of Postoperative Complications in Colorectal Cancer Surgery. Medicina (Kaunas) (2021) 57(5):472. doi: 10.3390/medicina57050472
Keywords: cachexia, positron- emission-tomography, lung neoplams, palliative cancer care, Warburg effect, lipid mobilization, sarcopenia, weight loss
Citation: Olaechea S, Gannavarapu BS, Alvarez C, Gilmore A, Sarver B, Xie D, Infante R and Iyengar P (2022) Primary Tumor Fluorine‐18 Fluorodeoxydglucose (18F‐FDG) Is Associated With Cancer-Associated Weight Loss in Non-Small Cell Lung Cancer (NSCLC) and Portends Worse Survival. Front. Oncol. 12:900712. doi: 10.3389/fonc.2022.900712
Received: 21 March 2022; Accepted: 23 May 2022;
Published: 24 June 2022.
Edited by:
Nadia Judith Jacobo-Herrera, Instituto Nacional de Ciencias Médicas y Nutrición Salvador Zubirán (INCMNSZ), MexicoReviewed by:
José Cesar Rosa Neto, University of São Paulo, BrazilVeronica Garcia, National Autonomous University of Mexico, Mexico
Copyright © 2022 Olaechea, Gannavarapu, Alvarez, Gilmore, Sarver, Xie, Infante and Iyengar. This is an open-access article distributed under the terms of the Creative Commons Attribution License (CC BY). The use, distribution or reproduction in other forums is permitted, provided the original author(s) and the copyright owner(s) are credited and that the original publication in this journal is cited, in accordance with accepted academic practice. No use, distribution or reproduction is permitted which does not comply with these terms.
*Correspondence: Rodney Infante, Um9kbmV5LkluZmFudGVAVVRTb3V0aHdlc3Rlcm4uZWR1; Puneeth Iyengar, UHVuZWV0aC5JeWVuZ2FyQFVUU291dGh3ZXN0ZXJuLmVkdQ==