 Teng Zhang1†
 Guang Yang
 Mei Yuan
94% of researchers rate our articles as excellent or good
Learn more about the work of our research integrity team to safeguard the quality of each article we publish.
Find out more
ORIGINAL RESEARCH article
Front. Oncol. , 11 August 2022
Sec. Thoracic Oncology
Volume 12 - 2022 | https://doi.org/10.3389/fonc.2022.900049
This article is part of the Research Topic Epidemiology, Screening and Diagnosis of Lung Cancer View all 24 articles
Objective: To investigate whether radiomics can help radiologists and thoracic surgeons accurately predict invasive adenocarcinoma (IAC) manifesting as part-solid nodules (PSNs) with solid components <6 mm and provide a basis for rational clinical decision-making.
Materials and Methods: In total, 1,210 patients (mean age ± standard deviation: 54.28 ± 11.38 years, 374 men and 836 women) from our hospital and another hospital with 1,248 PSNs pathologically diagnosed with adenocarcinoma in situ (AIS), minimally invasive adenocarcinoma (MIA), or IAC were enrolled in this study. Among them, 1,050 cases from our hospital were randomly divided into a derivation set (n = 735) and an internal validation set (n = 315), 198 cases from another hospital were used for external validation. Each labeled nodule was segmented, and 105 radiomics features were extracted. Least absolute shrinkage and selection operator (LASSO) was used to calculate Rad-score and build the radiomics model. Multivariable logistic regression was conducted to identify the clinicoradiological predictors and establish the clinical-radiographic model. The combined model and predictive nomogram were developed based on identified clinicoradiological independent predictors and Rad-score using multivariable logistic regression analysis. The predictive performances of the three models were compared via receiver operating characteristic (ROC) curve analysis. Decision curve analysis (DCA) was performed on both the internal and external validation sets to evaluate the clinical utility of the nomogram.
Results: The radiomics model showed superior predictive performance than the clinical-radiographic model in both internal and external validation sets (Az values, 0.884 vs. 0.810, p = 0.001; 0.924 vs. 0.855, p < 0.001, respectively). The combined model showed comparable predictive performance to the radiomics model (Az values, 0.887 vs. 0.884, p = 0.398; 0.917 vs. 0.924, p = 0.271, respectively). The clinical application value of the nomogram developed based on the Rad-score, maximum diameter, and lesion shape was confirmed, and DCA demonstrated that application of the Rad-score would be beneficial for radiologists predicting invasive lesions.
Conclusions: Radiomics has the potential as an independent diagnostic tool to predict the invasiveness of PSNs with solid components <6 mm.
With the increasing use of low-dose computed tomography (LDCT) in the screening of high-risk populations for lung cancer, the detection rate of part-solid nodules (PSNs) has been increasing, especially in Asian women and non-smokers (1–4). Previous research has shown that persistent PSNs are highly correlated with early-stage lung adenocarcinoma, including invasive adenocarcinoma (IAC), minimally invasive adenocarcinoma (MIA), and adenocarcinoma in situ (AIS) (5–7).
Accurate differentiation between IAC and AIS/MIA appearing as PSNs is critical and can determine the patient’s treatment options. Unlike IAC, AIS/MIA can be resected by limited wedge resection or segmentectomy rather than lobectomy to maximize the preservation of functional pulmonary parenchyma. Moreover, lymph node exploration is not required for AIS/MIA (8, 9). For clinical management, as long as the lesions suspected of AIS/MIA remain stable, the strategy of conservative periodic follow-up with CT, with surgical resection in case of lesion growth, has been widely accepted by clinicians, ultimately avoiding unnecessary surgery for patients (4, 10, 11).
One of the key factors to predict the invasiveness of PSNs is the assessment of the size of the solid component within the nodules, which is highly correlated with the pathologically invasive foci of adenocarcinomas (12–14). For PSNs, a size criterion of solid component diameter ≥6 mm is widely accepted to discriminate IAC from AIS/MIA on CT, which is also the newly revised threshold standard for T-factor staging of adenocarcinoma. Most IACs commonly manifest as PSNs with solid components ≥6 mm and can be easily and accurately diagnosed by radiologists and thoracic surgeons (4, 15, 16). A statement from the Fleischner Society suggested that surgical resection should be considered if solid components were ≥6 mm in PSNs, while yearly surveillance CT is recommended for PSNs with solid components <6 mm (4, 17). However, due to the insufficient CT resolution, the ground-glass components of PSNs may contain invasive foci that cannot be recognized by the naked eyes; a large number of IAC cases also present as PSNs with solid component <6 mm or even non-solid nodules (NSNs), which were difficult to distinguish from AIS/MIA, and closer follow-up is needed for these lesions (18). Ahn et al. (19) indicated that the sizes of the solid component measured on CT images commonly underestimate the real size of invasive foci on pathology. Therefore, it is a great challenge for radiologists to predict the invasiveness of PSNs with a solid component <6 mm and NSNs because of their pathological diversity.
Many studies regarding the invasiveness prediction of PSNs have been reported with different methods, including radiographic feature evaluation and quantitative analysis (20–22). However, these studies have limitations: 1) there are no limits set on the size of solid components in PSNs. If too many PSNs with a solid component ≥6 mm (the pathological type is mostly IAC) are included in a study, the predictive performance may be exaggerated; 2) many evaluated radiographic features show an overlap between IAC and AIS/MIA; 3) previous studies used varied quantitative parameters and reported different results, making it unclear whether these studies can help radiologists improve the prediction performance.
Radiomics has been widely used to establish diagnosis and prediction models for tumor grading and staging, treatment outcome evaluation, and prognosis prediction by extracting and selecting predefined subtle image features (23, 24). Sun et al. (25) and Yuan et al. (26) have successfully used radiomics to predict the invasiveness of NSNs and PSNs, respectively. However, few studies have focused on the prediction of invasiveness of PSNs with a solid component <6 mm, whose diagnosis remains challenging for radiologists. Therefore, the purpose of our study was to investigate whether radiomics is able to help radiologists accurately predict IAC manifesting as PSNs with solid components <6 mm and provide a basis for rational clinical decision-making.
The ethical committee of our hospital approved this retrospective study and waived the informed consent for the patients (approval number: 2021-SR-053).
We searched the institution’s database and collected the clinical and imaging data of 3,326 patients who underwent surgery in our hospital and were pathologically diagnosed with AIS, MIA, or IAC from January 2015 to December 2020. The dataset of our hospital included 1,012 patients (mean age ± standard deviation, 54.16 ± 11.21 years, 316 men and 696 women) with 1,050 PSNs satisfying the following inclusion criteria: 1) the lesions manifested as PSNs on CT imaging, with the maximum diameter of the solid components <6 mm (excluding bronchi and vessels); 2) the maximum diameter of the PSNs was 5–30 mm; 3) non-enhanced CT scans were performed within 2 weeks prior to surgery; 4) lesions were completely removed, and the pathological diagnosis was unambiguous. In accordance with previous studies, the CT threshold of the solid components in PSNs was set to >-188 HU (27). Three-dimensional (3D) Slicer software (version 4.12; National Institutes of Health; https://www.slicer.org) can automatically identify solid components in PSNs. According to the automatic segment results of the solid components in PSNs in 3D Slicer software, authors #1 and #3 (with 10 and 7 years’ experience in chest CT imaging, respectively) separately measured the maximum diameter of the solid components from the axial, coronal, and sagittal images in Picture Archiving and Communication System (PACS) (Supplementary Figure S1). PSNs with solid components greater than 6 mm measured from any direction will be excluded from the study. Author #9, a radiologist with 16 years’ experience, reviewed the measurement results of authors #1 and #3 to reach a consensus.
Finally, the dataset from our hospital was randomly divided into a derivation set (735 cases: 67 AIS, 316 MIA, and 352 IAC) and an internal validation set (315 cases: 29 AIS, 135 MIA, and 151 IAC) at a ratio of 7:3.
Authors #1, #3, and #9 used the same methods andreviewed patients who underwent surgery in another hospital and were pathologically diagnosed with AIS, MIA, or IAC from January 2020 to December 2020. Finally, 198 cases (25 AIS, 79 MIA, and 94 IAC) were enrolled in our study as the external validation set. The workflow was illustrated in Figure 1.
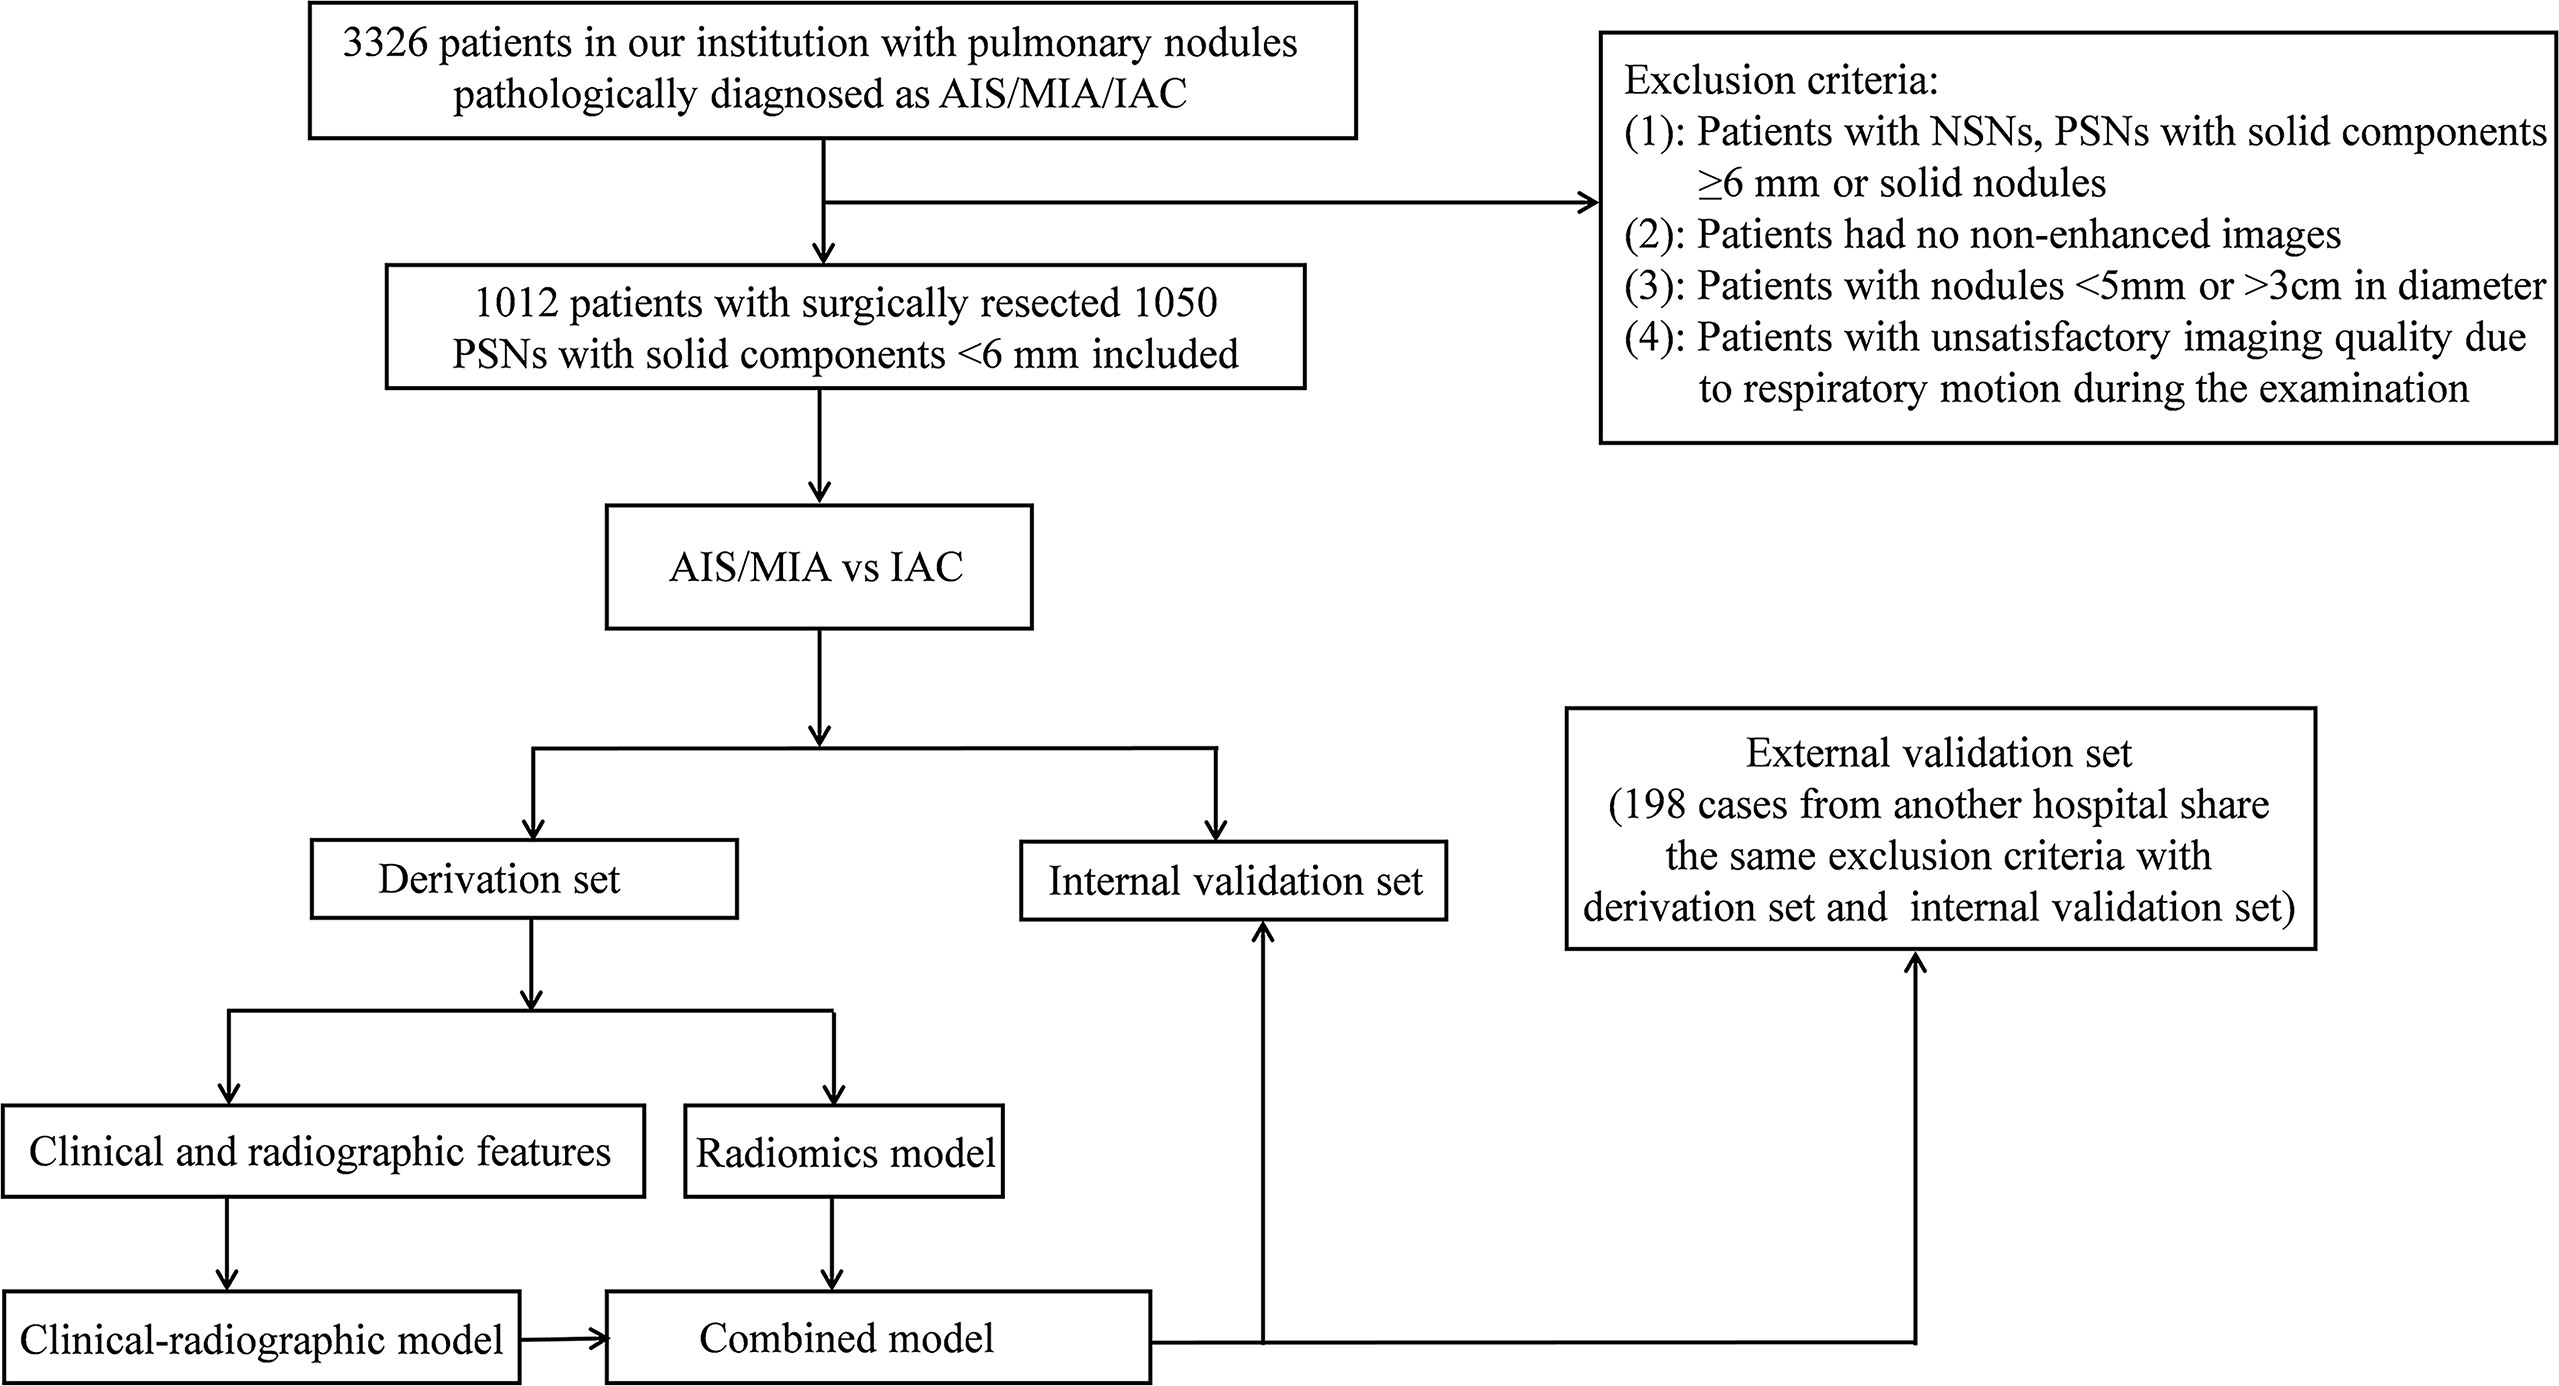
Figure 1 The workflow of our study.
None of the 597 IAC cases included in our study had lymph node metastases. Only 16 IAC cases were classified as pT2 stage because of the presence of pleural invasion and the rest were all classified as pT1 stage according to the eighth edition of the tumor, node, and metastasis (TNM) classification of lung cancer.
The resection specimens were fixed with formalin, embedded in paraffin, sectioned, and stained with hematoxylin and eosin. Author #6, a pathologist with 26 years’ work experience, reviewed the pathological classification of all specimens based on the 2011 classification criteria for lung adenocarcinoma proposed by International Association for the Study of Lung Cancer/American Thoracic Society/European Respiratory Society (IASLC/ATS/ERS).
All patients underwent CT examination using one of the four CT scanners: SOMATOM Definition AS+, SOMATOM Sensation 16, and GE Discovery CT750 HD of our hospital and GE LightSpeed VCT of another hospital. The detailed scan and reconstruction parameters and the number of patients performed by each scanner were shown in Supplementary Table S1.
The patient’s clinical information was collected from electronic medical records, including: 1) age, 2) sex, 3) smoking history, 4) carcinoembryonic antigen (CEA) level, 5) history of chronic obstructive pulmonary disease (COPD), 6) history of other cancers, and 7) family history of lung cancer. Authors #1 and #3, who did not know the patients’ pathological diagnosis, interpreted the CT images individually under lung window settings (width, 1,200 Hu; level, -600 Hu). The radiographic features of all lesions evaluated in this study include the following: 1) lesion location; 2) maximal axial diameter; 3) maximum axial diameter of the solid component; 4) consolidation-to-tumor ratio (CTR); 5) border (undefined or defined); 6) shape (round/oval or irregular); 7) vacuole sign (lesions with cystic cavities with the diameter <5 mm); 8) air bronchogram sign (dilated bronchioles observed in lesions); 9) microvascular sign (lesions with convergent, dilated, or tortuous supplying vessels); and 10) pleural indentation sign (pleura adjacent to lesions showed thickening or contraction). The CTR (%) was calculated as 100×(maximum axial diameter of the solid component/maximum axial diameter of the lesion) referring to previous studies (28, 29). Kappa values and intraclass correlation coefficients (ICCs) were calculated to assess the consistency of the two authors’ evaluations. To reach a consensus, author #9 rechecked the image interpretation results.
CT images (DICOM format) were retrieved from the institution archive and loaded into a personal computer for further analysis. The volume of interest (VOI) was automatically segmented using a homemade software MultiLabel (version 1.1, Shanghai Key Laboratory of Magnetic Resonance, East China Normal University, China). Manual adjustment for the precise edge of the VOI was performed by author #1 if the border of the lesion was undefined or to ensure the large vessels and bronchioles were excluded from the VOI (Supplementary Figure S2). Author #9 reviewed the VOIs to ensure accurate segmentation. Then, the whole set of CT images with VOI segmentation information was converted to NII format for further radiomics analysis.
We normalized all images with the following formula: f(x)=1000∗(x−μx)/σx, where μx and σx denote the mean and standard deviation of the image intensity, respectively, before 3D radiomics features were extracted from the original image with PyRadiomics (Ver. 3.0) (30). We extracted 105 commonly used features in radiomics analysis, including 18 gray-level histogram features (e.g., mean, kurtosis, skewness), 14 shape features (e.g., compactness, sphericity), and 73 high-order texture features [gray-level co-occurrence matrix (GLCM), gray-level run-length matrix (GLRLM), gray-level size-zone matrix (GLSZM), and neighborhood gray-tone difference matrix (NGTDM)]. Most features defined by Pyradiomics follow feature definitions as described by the Imaging Biomarker Standardization Initiative (IBSI) (31).
In order to check the inter- and intra-observer reproducibility of the 105 radiomics features that we extracted, 60 cases (20 AIS, 20 MIA, and 20 IAC) were randomly chosen for analysis. Author #1 and author #3 repeated the nodule segmentation procedure for the selected 60 cases separately approximately 3 months later. The intra- and inter-observer agreement of the 105 extracted features were assessed by interclass correlation coefficients and ICCs. An ICC greater than 0.75 indicated good reproducibility of the feature extraction.
Firstly, all features were normalized with z-score (subtracted mean value and divided by standard deviation), then minimum-Redundancy Maximum Relevance (mRMR) was used to remove redundant features. The remaining 30 features were used to build the radiomics model with least absolute shrinkage and selection operator (LASSO), a classifier suitable for high-dimensional data regression. Parameter and thus the appropriate number of the most weighted predictive features was determined using a 10-fold cross-validation over the derivation set. To minimize the number of features in the final model, we chose the model with the least number of features and a binomial deviance within 1 standard deviation from the minimum binomial deviance.
After the model had been built, Rad-score, namely, the predictive probability of the radiomics model for each patient, was calculated via a linear combination of the selected most weighted features with their respective coefficients.
Univariable and multivariable logistic regression analyses were carried out on the clinical and radiographic features of the derivation set to determine the independent predictors for IAC and establish the clinical-radiographic model. The independent predictors and Rad-score were analyzed using multivariable logistic regression; thus, a combined model and an individual prediction nomogram were constructed. Receiver operating characteristic (ROC) curve analysis was used to evaluate the performance of the clinical-radiographic model, radiomics model, and combined model in the derivation, internal validation, and external validation sets. The optimal cutoff value was determined by Youden index in the ROC analysis. DeLong’s test was also used to compare the performance of the models. Model evaluation metrics such as positive predictive value (PPV), negative predictive value (NPV), F1-score, and Matthews correlation coefficient (MCC) were calculated to identify the best prediction model. Waterfall plot was used to show the prediction probability of all patients, and calibration curves were plotted to analyze the diagnostic performance of the nomogram in each dataset. Hosmer–Lemeshow test and decision curve analysis (DCA) were used to evaluate the goodness of fit and clinical value of the nomogram.
Statistical analysis was performed using IBM SPSS software (version 26.0; https://www.ibm.com) and R software (version 4.1.0; https://www.r-project.org). Specifically, we used rms package for calibration analysis, ResourceSelection package for Hosmer–Lemeshow test, rmda for DCA, mRMRe for feature selection, and glmnet for LASSO. p-values <0.05 were considered statistically significant.
Supplementary Table S2 showed the inter-observer agreement for the radiographic sign evaluation and measurement of PSNs. The Kappa values for lesion measurement and radiographic features evaluation were medium to high.
It can be seen from Table 1 that there were no statistically significant differences between the derivation set and internal/external validation set in the comparison of clinical and radiographic features.
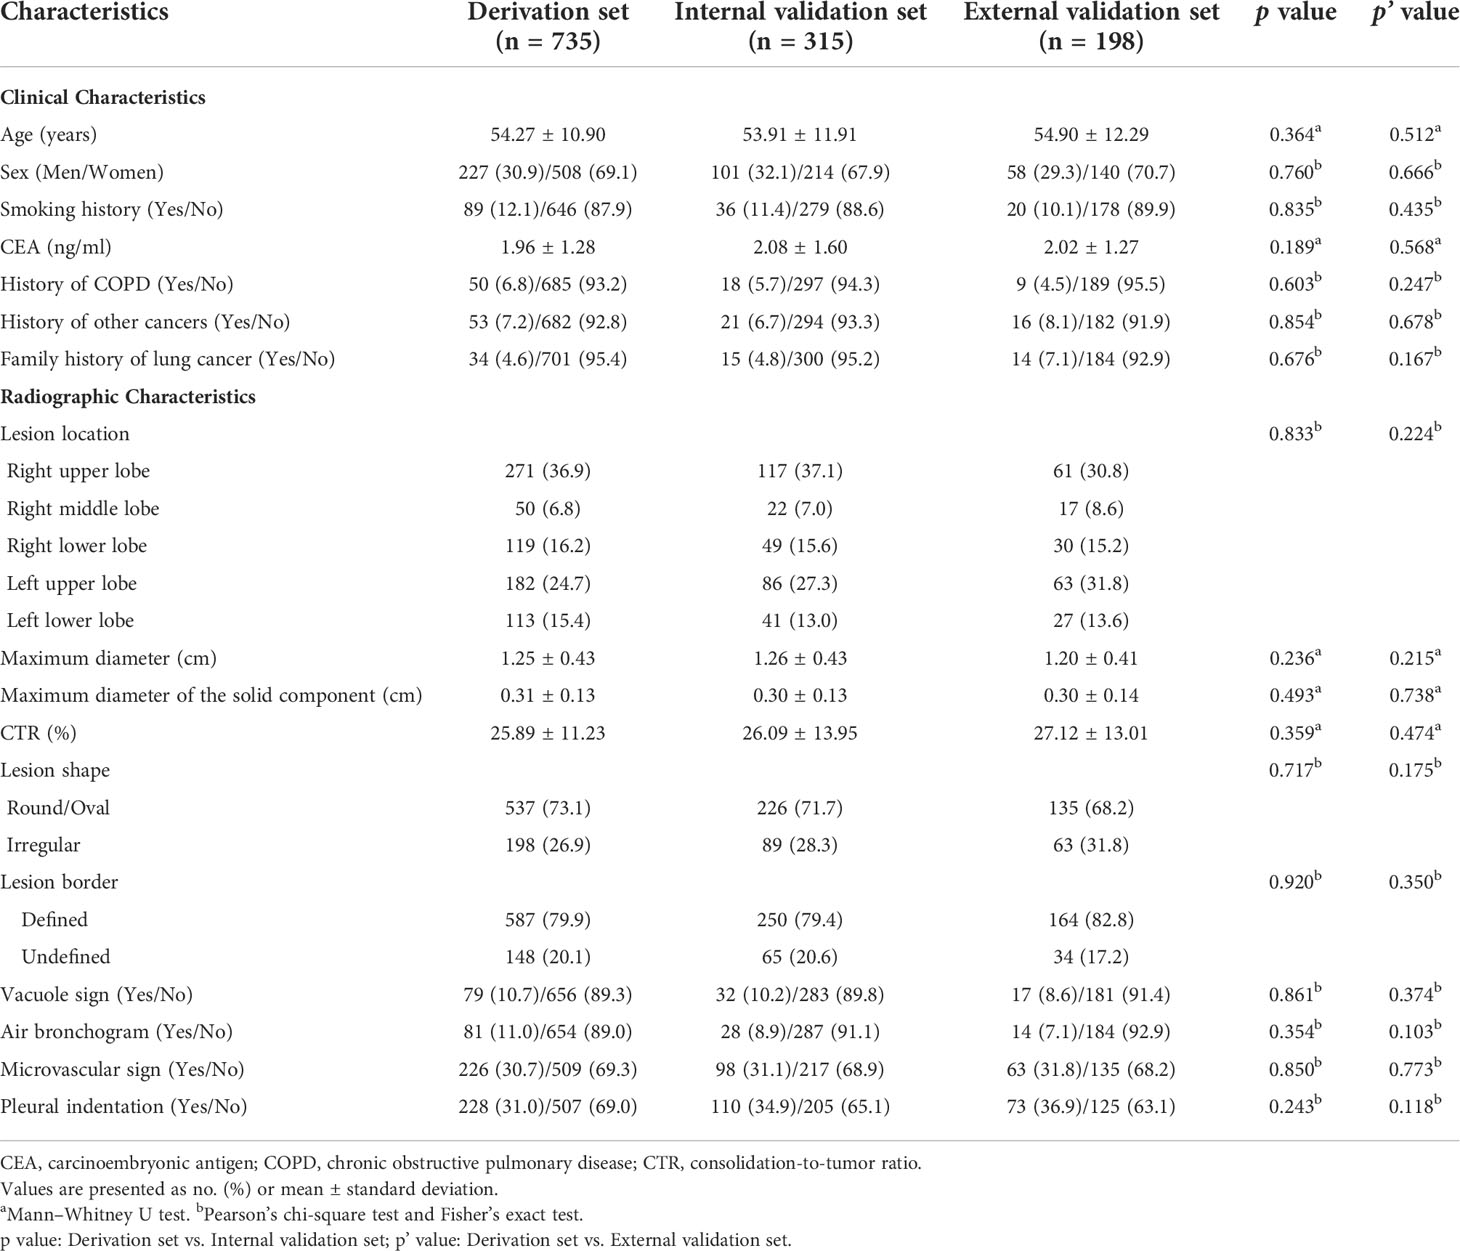
Table 1 Comparison of clinical and radiographic characteristics between derivation and internal/external validation sets.
Table 2 and Figure 2 present the comparison on the clinical and radiographic features between AIS/MIA and IAC in the derivation, internal validation, and external validation sets. Univariable and multivariable logistic regression analyses in the derivation set revealed the maximum diameter [odds ratio (OR) 3.62, 95% confidence interval (CI) 2.26–5.80, p < 0.001], lesion shape (OR 1.89, 95% CI 1.26–2.81, p = 0.002), vacuole sign (OR 1.89, 95% CI 1.07–3.32, p = 0.028), microvascular sign (OR 1.91, 95% CI 1.31–2.79, p = 0.001), and maximum diameter of the solid component (OR 26.83, 95% CI 6.81–105.76, p < 0.001) were independent predictors for IAC.
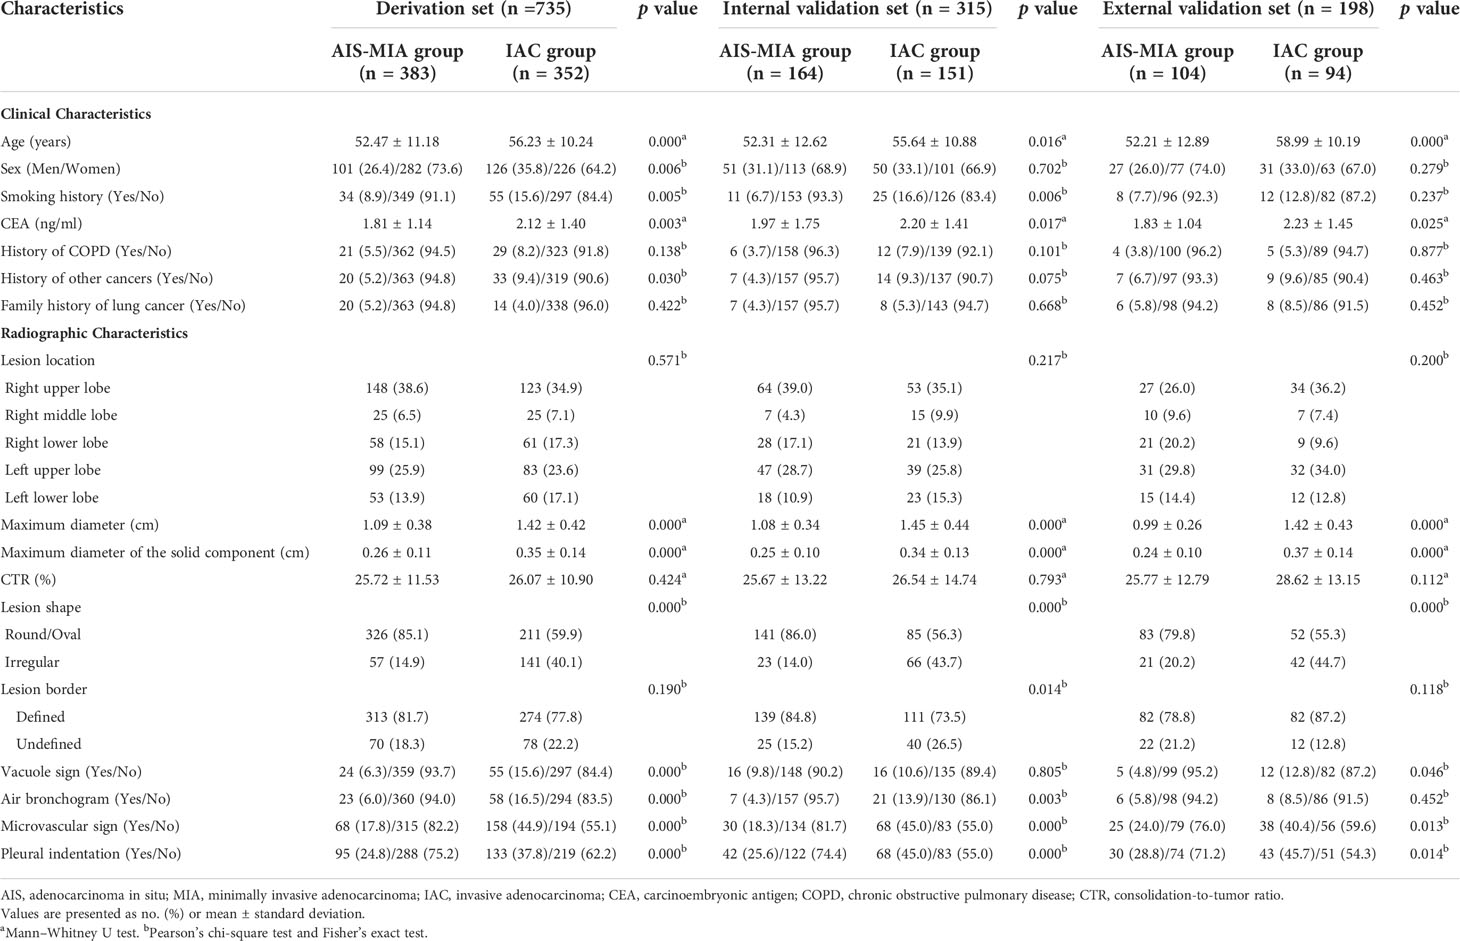
Table 2 Comparison on the clinical and radiographic characteristics between AIS-MIA and IAC in the derivation, internal validation, and external validation sets.
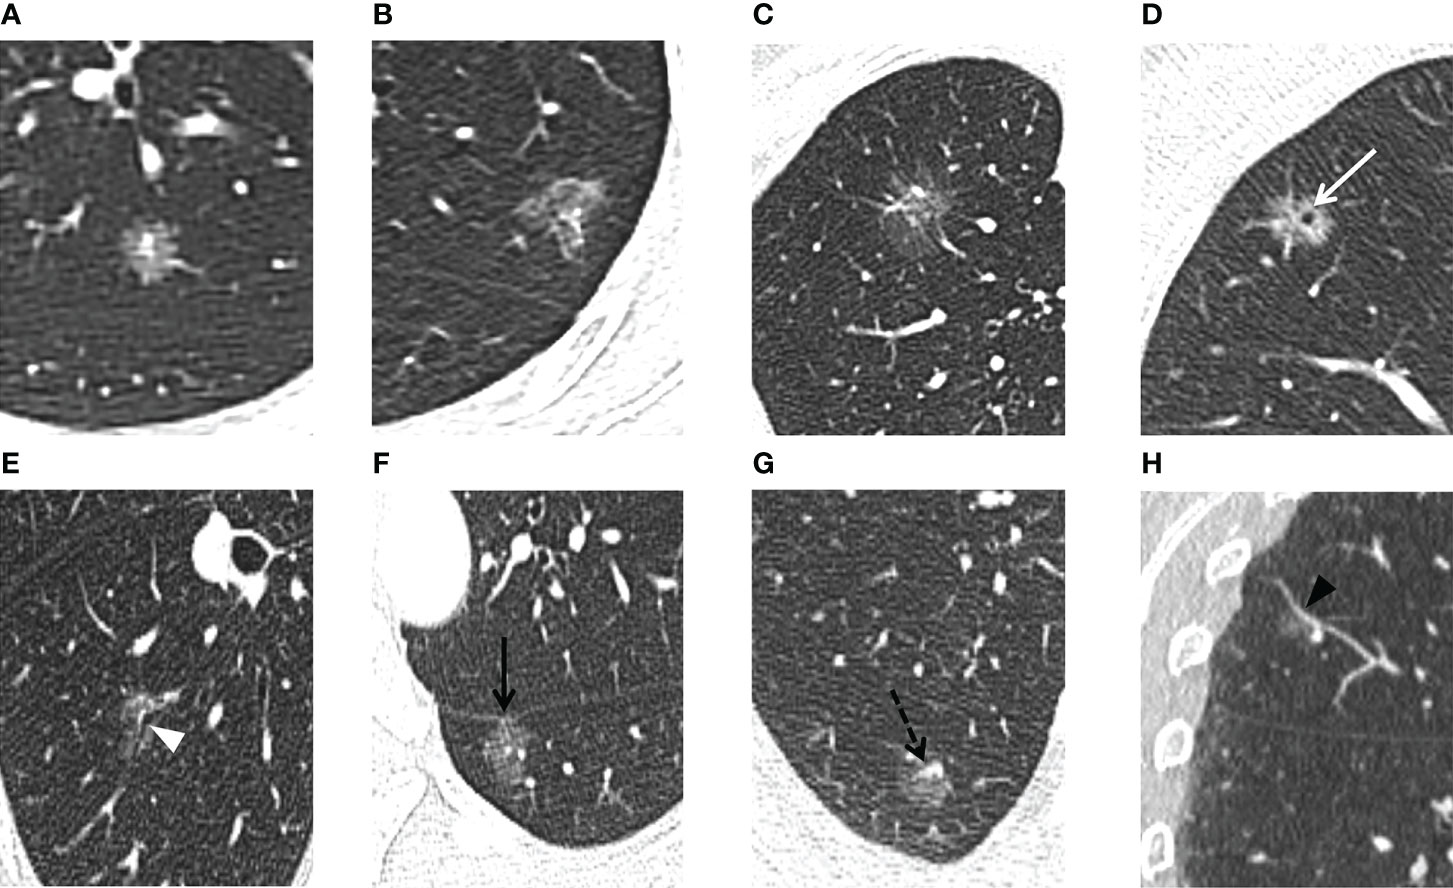
Figure 2 For the PSNs included in our study, thin-section CT radiographic features were evaluated. The lesion shape is evaluated as (A) round/oval or (B) irregular. The lesion border is evaluated as (A, B) defined and (C) undefined. (D) Vacuole sign: MIA in the right upper lobe exhibits a bubble-like lucency within the nodule (white arrow). (E) Air bronchogram sign: MIA in the right lower lobe shows air-filled bronchi present inside the lesion (white arrowhead). (F) Pleural indentation: MIA in the left lower lobe shows pleural indentation adjacent to the oblique fissure (black arrow). (G, H) Microvascular sign: IAC in the right upper lobe shows a small adjacent pulmonary vessel entering the lesion (black dotted arrow). Reverse tracing shows that the blood vessel is a branch of the pulmonary artery. Coronal reconstruction better shows the dilation of the supplying vessel (black arrowhead).
The Az value of the clinical-radiographic model was 0.779 (95% CI 0.747–0.809) in the derivation set, 0.810 (95% CI 0.762–0.852) in the internal validation set, and 0.855 (95% CI 0.799–0.901) in the external validation set (Figure 3).
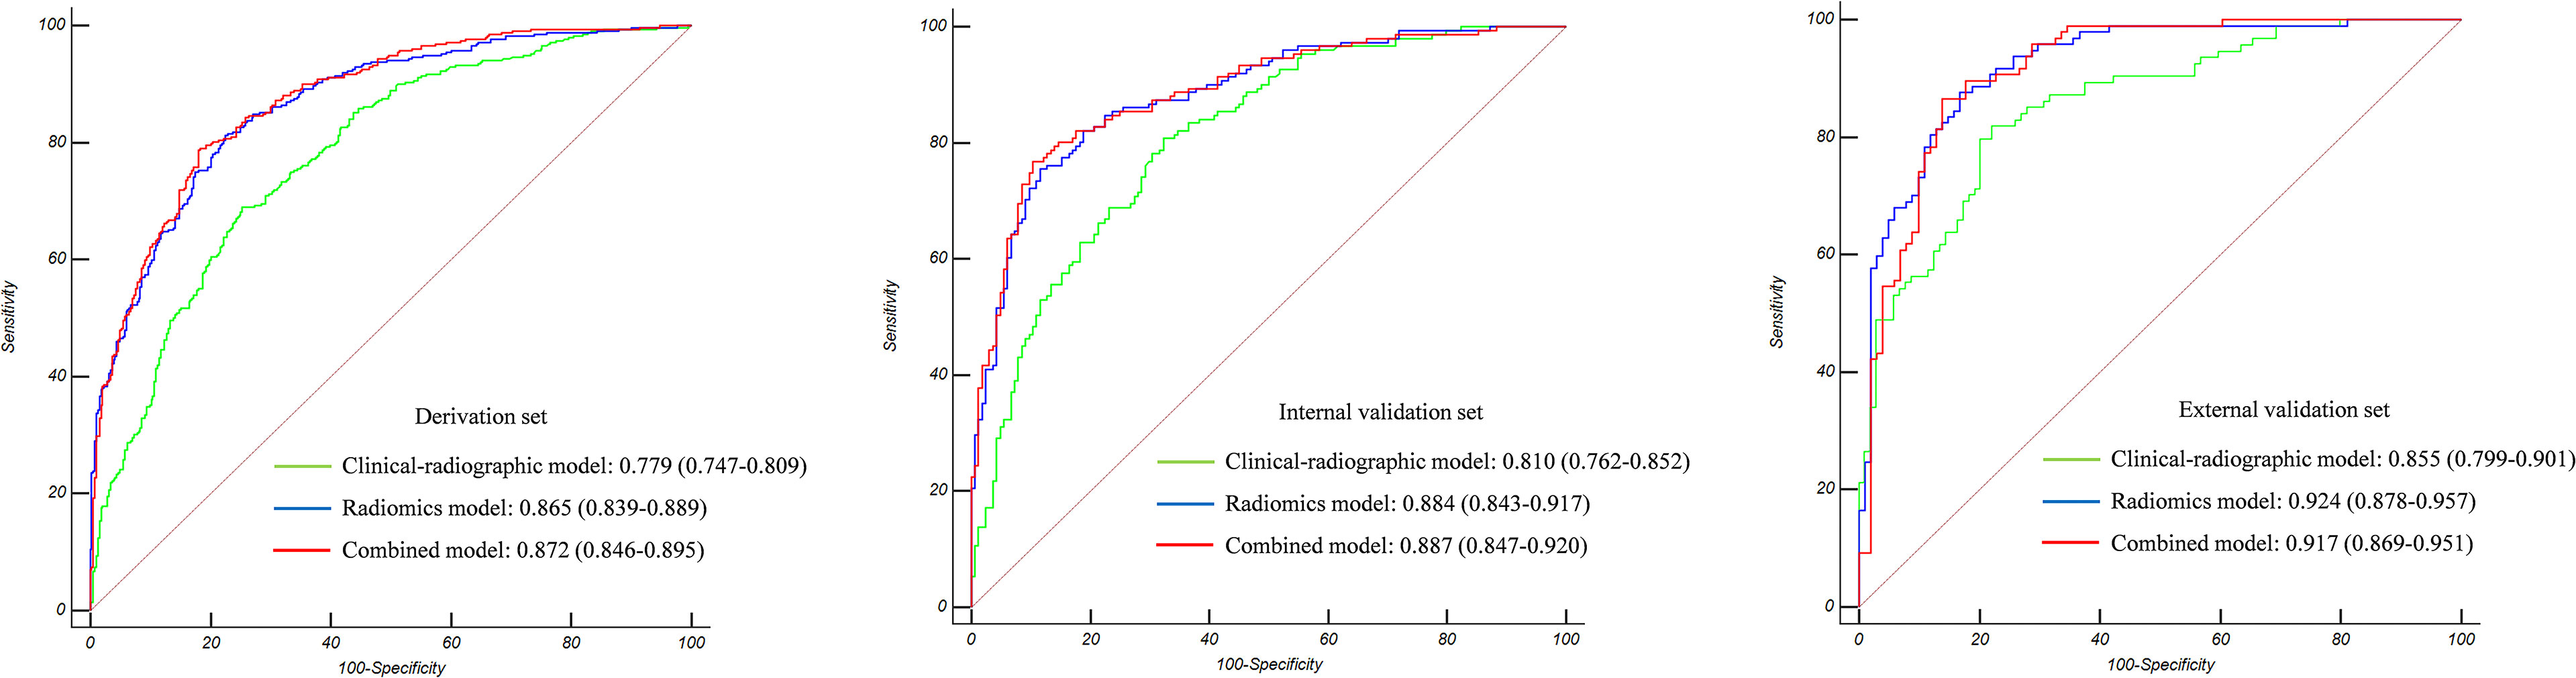
Figure 3 The Az value of the three models in the derivation set, internal validation set, and external validation set. Radiomics showed superior predictive performance than clinical-radiographic models in all sets; however, the combined models showed comparable predictive performance to the radiomics models.
The inter-observer ICCs, calculated on the basis of author #1’s first-extracted 105 features and those of author #3 ranged from 0.80 to 0.99 (Supplementary Table S3). The intra-observer ICCs, calculated based on author #1’s twice feature extraction ranged from 0.84 to 0.99 (Supplementary Table S4). Therefore, the 105 features we extracted proved robust and achieved satisfactory inter- and intra-observer reproducibility.
A Rad-score was calculated for each patient based on seven features with non-zero coefficients selected from the 105 robust radiomics features using a LASSO logistic regression model (λ = 0.039727) (Figures 4A, B).
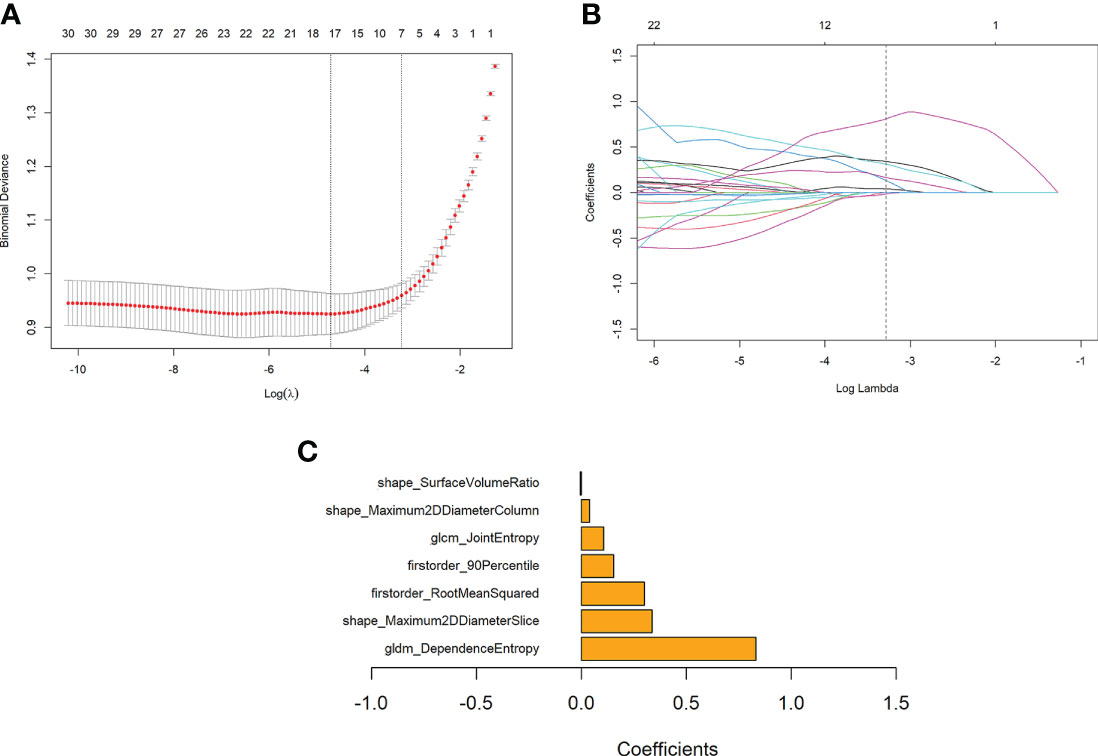
Figure 4 Features selection using the LASSO regression model and the selection of the tuning parameter λ. (A) Change of binomial deviance with log(λ). The maximum log(λ) corresponding to the binomial deviance within 1 standard error from the minimum binomial deviance was chosen for the final model. (B) Change of the number of features with non-zero coefficients with log(λ), as determined in a 10-fold validation. (C) Coefficients of the seven features retained in the model.
Rad-score = 0.831176 * gldm_DependenceEntropy
+ 0.301168 * firstorder_RootMeanSquared
- 0.004266 * shape_SurfaceVolumeRatio
+ 0.336894 * shape_Maximum2DDiameterSlice
+ 0.155065 * firstorder_90Percentile
+ 0.107055 * glcm_JointEntropy
+ 0.039099 * shape_Maximum2DDiameterColumn - 0.101629
The bar chart of the coefficients of features used in the model is shown in Figure 4C.
The Az value of the radiomics model was 0.865 (95% CI 0.839–0.889) in the derivation set, 0.884 (95% CI 0.843–0.917) in the internal validation set, and 0.924 (95% CI 0.878–0.957) in the external validation set (Figure 3).
Multivariable logistic regression analysis identified the Rad-score (OR 2,232.55, 95% CI 650.95–7656.89, p < 0.001), maximum diameter (OR 0.40, 95% CI 0.21–0.75, p = 0.004), and lesion shape (OR 1.94, 95% CI 1.23–3.06, p = 0.004) as independent predictors for IAC. All of these parameters were used to develop a prediction nomogram. Representative examples of the nomogram to predict the invasiveness are given in Figures 5.
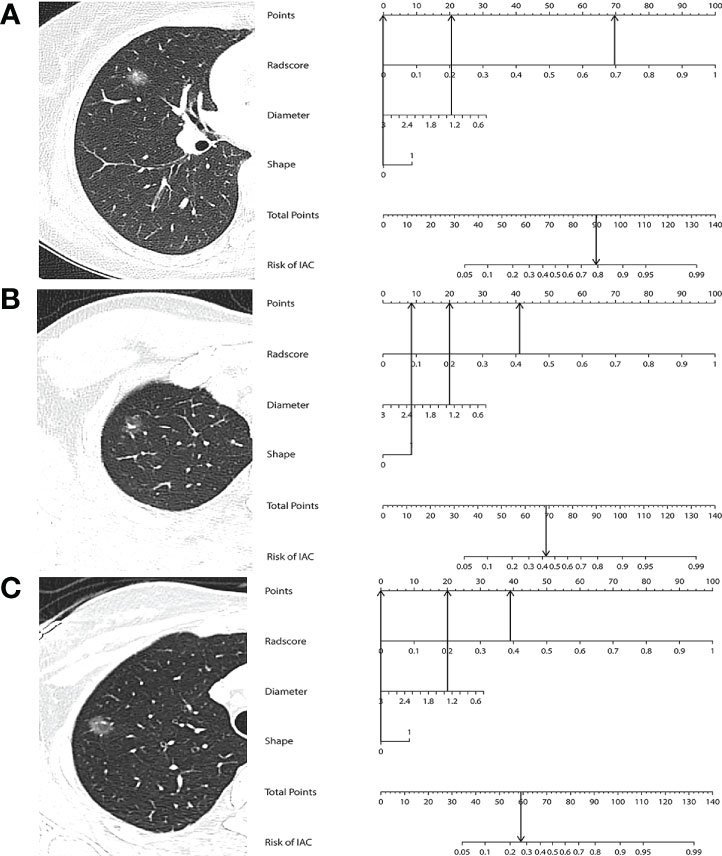
Figure 5 (A) A 45-year-old woman with IAC in the right middle lobe shows a regular shape and with a diameter of 1.26 cm. The nomogram shows that this case had a total of 90 points after summing all points (69 + 21 + 0), which corresponds to a 79.6% probability of IAC. (B) A 26-year-old woman with MIA in the right upper lobe shows an irregular shape and with a diameter of 1.32 cm. The nomogram shows that this case had a total of 69 points after summing all points (41 + 20 + 8), which corresponds to a 44.3% probability of IAC. (C) A 36-year-old woman with AIS in the right upper lobe shows a regular shape and with a diameter of 1.34 cm. The nomogram shows that this case had a total of 59 points after summing all points (39 + 20 + 0), which corresponds to a 25.9% probability of IAC.
The Az value of the combined model was 0.872 (95% CI 0.846–0.895) in the derivation set, 0.887 (95% CI 0.847–0.920) in the internal validation set, and 0.917 (95% CI 0.869–0.951) in the external validation set (Figure 3). It can be seen from the detailed metrics listed in Table 3 that the radiomics models showed superior predictive performance than the clinical-radiographic models in all sets; however, the combined models showed comparable predictive performance to the radiomics models.
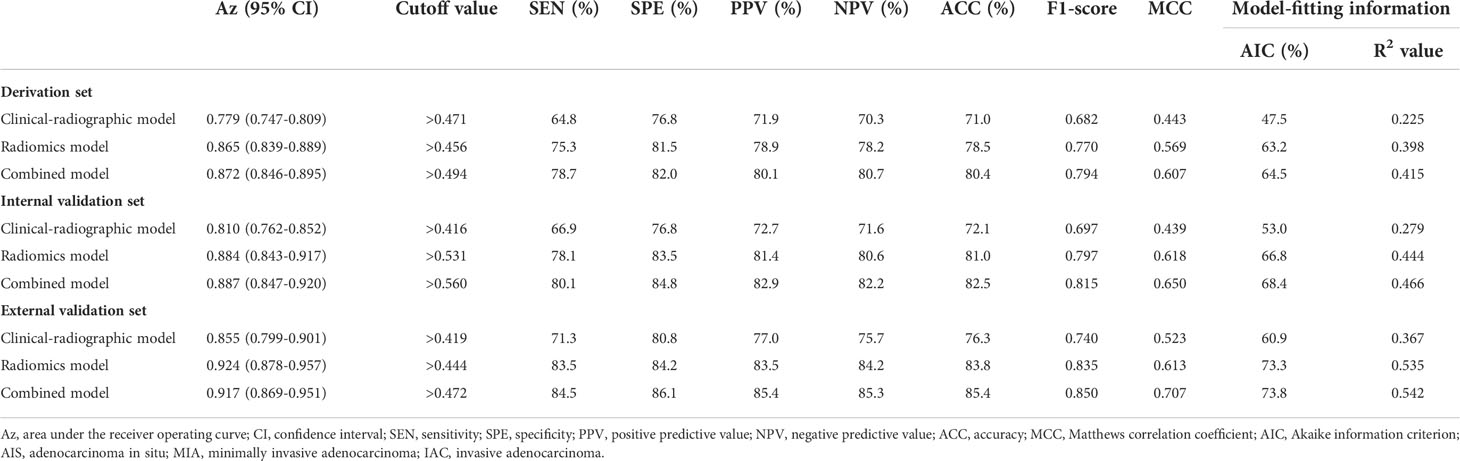
Table 3 Effectiveness of the three models in discriminating AIS-MIA from IAC in the derivation, internal validation, and external validation sets.
The calibration curve of the radiomics nomogram smoothed with bootstrapping also indicated good agreement between predicted probability and actual occurrence in the derivation, internal validation, and external validation sets (Figure 6A). The Hosmer–Lemeshow test indicated no significant difference between the combined model’s predictions and the observed values in the derivation, internal validation, and external validation sets (p = 0.779, p = 0.580, p = 0.209, respectively), implying the model’s good generalization.
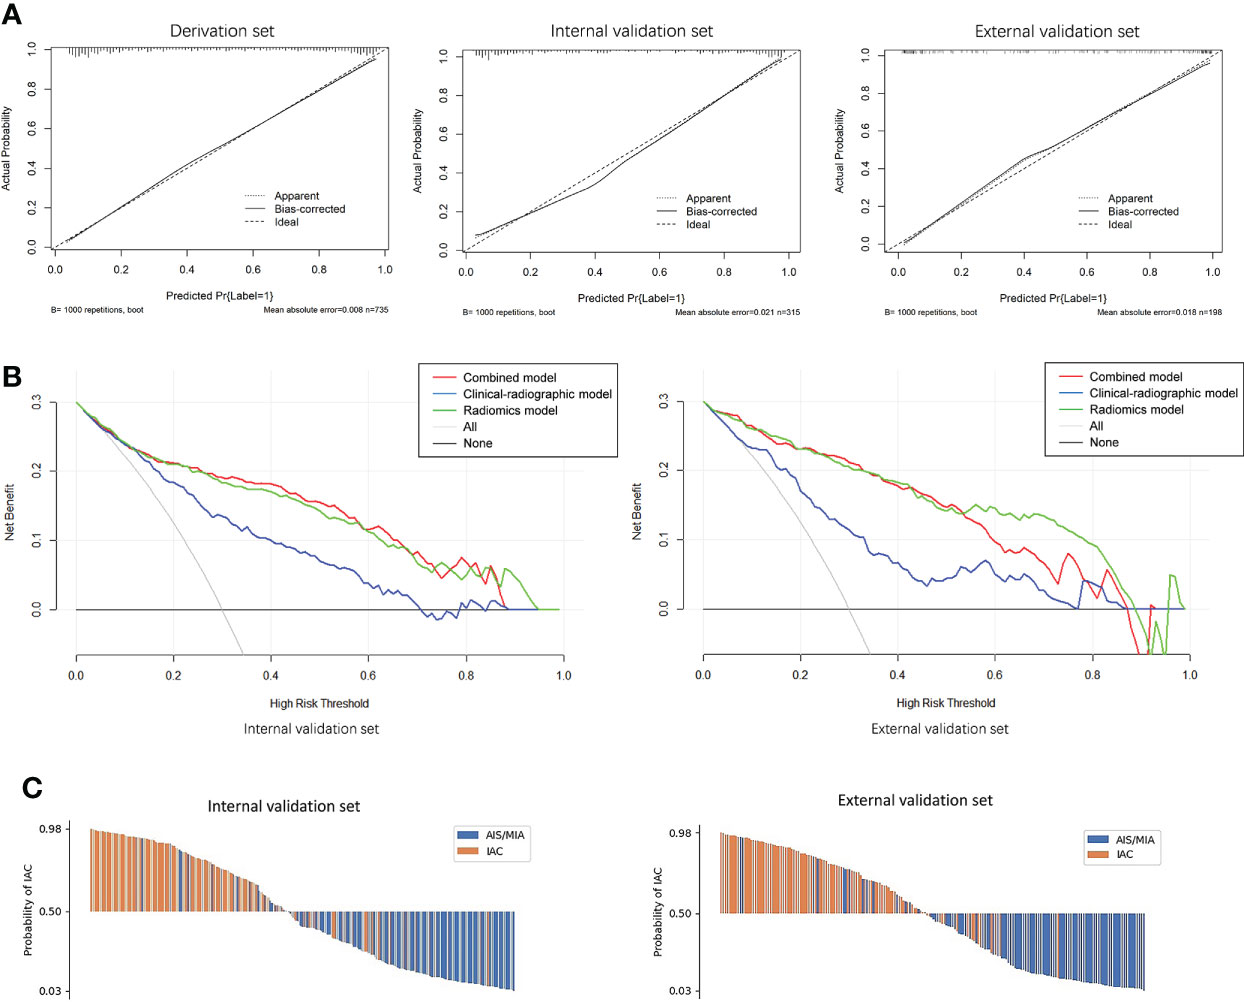
Figure 6 (A) Calibration curves of the combined model indicated good agreement between the predicted probability and actual occurrence in the derivation, internal validation, and external validation sets. (B) Decision curve analysis on both the internal and external validation sets for the models with and without Rad-score. It can be seen that if the threshold probability of a patient is in the range of 0.10~0.85, using a model with the Rad-score to predict the invasive lesion would be more beneficial than using one without the Rad-score. (C) Waterfall plot of the combined model showing the predicted probabilities of internal and external validation sets. It can be seen clearly that the combined model can differentiate IAC from AIS/MIA well.
Figure 6B showed the decision curves of the developed models on both the internal and external validation sets. It would be more beneficial to use a model with Rad-score for identifying the invasive lesions than that without the Rad-score if the threshold probability of a patient was in the range of 10%~85%.
Waterfall plots of the combined model on both the internal and external validation sets were shown in Figure 6C. The cutoff value was set by maximizing the Youden index in the derivation set. From the waterfall plots, it can be seen clearly that the combined model can differentiate IAC from AIS/MIA well.
Our research objective was to predict the invasiveness of lung adenocarcinoma manifesting as PSNs with solid components <6 mm. We confirmed that radiomics was superior to the clinical-radiographic model and showed comparable predictive performance to the combined model in differentiating IAC from AIS/MIA. It seems that radiomics can provide a simple and robust prediction method for accurate preoperative judgment of lesion invasiveness.
Our statistical analysis of the patients’ clinical data shows that the incidence of IAC increased with age, male gender, smoking history, and high CEA level, which is consistent with the results of previous studies (32). Although some studies have found that patients with COPD, history of other cancers, and family history of lung cancer were more susceptible to lung cancer (33, 34), our data show that these features have no statistical significance in predicting the invasiveness of PSNs.
Maximum diameter, lesion shape, vacuole sign, and microvascular sign were considered independent predictors for IAC in our study. The size of PSNs is significantly related to the risk of malignancy and is the leading factor in the management of PSNs. In our study, the average maximum diameter of IAC was significantly larger than that of AIS/MIA (1.42 cm vs. 1.09 cm, p < 0.001), and the predicted cutoff value for IAC was 1.18 cm. Li et al. (35) and Zhou et al. (36) confirmed that the maximum diameter is an independent predictor of the invasiveness of PSNs, and the predicted cutoff values for IAC in their studies were 1.65 and 1.96 cm, respectively, which were significantly higher than ours. This difference could be due to the fact that other studies included PSNs with solid components ≥6 mm, which may be more aggressive and have larger diameters. As the invasiveness of PSNs increased, their morphology became irregular and the probability of vacuole formation increased due to the proliferation of fibroblasts, tumor cell infiltration in the lung interstitium, and heterogeneity of growth speed inside the tumor (37). Vascular remodeling and sustained angiogenesis play an important role in the early development and progression of tumors (38). When tumor cells infiltrate the pulmonary interstitium, they will create traction on the surrounding blood vessels, causing them to stiffen, twist, and aggregate. Many previous studies have confirmed that irregular shape, vacuole sign, and microvascular sign are more frequently seen in IAC manifesting as PSNs, but no studies considered any of these features as independent predictors (32, 35, 36). The main reason may be that their predictive model was based on the comprehensive analysis of both radiographic features and quantitative parameters instead of only analyzing radiographic features as we did in our study. Zhao et al. (39) found that the mean CT value showed superior predictive performance compared with irregular shape and microvascular sign and was considered to be an independent predictor for IAC. In addition, the different findings could also be due to the exclusion of PSNs with solid components ≥6 mm from our study and the difference in sample size. At present, there are a few studies on PSNs with solid components <6 mm; hence, more studies are needed to determine which radiographic features can be used as the best predictors for invasiveness, and our research results need further verification.
Previous studies have confirmed that measuring the maximum size of solid components or comparing the CTR is more accurate than measuring the maximum diameter of lesions in predicting the invasiveness of PSNs (12, 40). Our study also confirmed that the maximum size of solid components was an independent predictor for IAC. The CTR calculated in our study showed no significant statistical difference between IAC and AIS/MIA. It may be because our study excluded PSNs with solid components ≥6 mm while maintaining the same size enrollment criteria of the lesions (5–30 mm) with previous studies. Although we can clearly identify solid components smaller than 6 mm in PSNs with the aid of automatic segmentation software, errors still exist to a certain extent in the measurement of solid components. No studies focused on the solid component analysis in PSNs with solid components <6 mm before; our research results also need further verification.
In addition to the analysis of radiographic features, there have been many studies using quantitative parameters to predict the invasiveness of PSNs. Lower kurtosis and bigger mass were confirmed as significant differentiators of IAC from AIS/MIA by Chae et al. (41). Ko et al. (27) demonstrated that the total volume and percentage solid volume measurements of PSNs helped differentiate between IAC and AIS/MIA with an accuracy of 73.2%. Therefore, although previous studies are numerous, their results vary due to differences in sample size, quantitative parameters, and analysis methods. For this reason, it is still unclear which parameters contribute the most to the prediction of invasiveness of PSNs. The classification of PSNs can still be challenging for radiologists. However, there were few pieces of research that focused on PSNs with solid component <6 mm. Qi et al. (42) illustrated that the mass of PSNs with solid component <6 mm, with the best cutoff value of 283.2 mg, was the only independent predictor for IAC, and the Az value was 0.859; sensitivity was 68.7% and specificity was 92.9%, which were lower than those achieved by the radiomics model in the external validation set of our study (Az value 0.924, sensitivity 83.5%, specificity 84.2%).
During the growth and evolution of PSNs, as the invasive components containing structural deformities of the stromal elastic fiber framework increase within a homogeneous lepidic or acinar background, the diameter and density of the lesion will increase, the shape will become irregular, and the pixel values will become inhomogeneous. In the seven selected most identifiable radiomics features in our study, gldm_DependenceEntropy and glcm_JointEntropy reflect the uniformity of texture and gray scale, higher Entropy value represents the inhomogeneous of pixels in the tumor and greater probability of IAC. Son et al. (43) reviewed 191 resected ground-glass opacity nodules with little or no solid component and identified entropy as an independent predictor for IAC, which is consistent with our results to some extent. Firstorder_RootMeanSquared and firstorder_90Percentile reflect the brightness and shape_Maximum2DdiameterSlice and shape_Maximum2DdiameterColumn reflect the maximum 2D diameter, which were all positively correlated with the significant density and diameter difference between IAC and AIS/MIA. As the invasiveness of PSNs increase, their shape will become irregular and with higher surface/volume ratio, so it is reasonable that shape_SurfaceVolumeRatio is retained in our radiomics model.
In our study, radiomics outperformed the clinical-radiographic model in predicting the invasiveness of PSNs with solid components <6 mm. In the research of Sun et al. (25), radiomics also showed superior predictive performance compared with the clinical-radiographic model in predicting the invasiveness of NSNs. However, compared with radiomics, our combined model did not demonstrate any significant improvement in predictive ability, which was different from the study of Sun et al. This difference can be explained by the fact that we can only extract finite subjective and semiquantitative information from CT images by the naked eyes, while radiomics can analyze conventional descriptive signs and transform image data into spatial data that can be mined in depth and quantitatively analyzed. Some radiographic features we analyzed are probably included in the features extracted by radiomics. Which surprised us was that both the radiomics and the combined model achieved better results in the external validation set than in the internal validation set in our study. We studied the distribution of contributing features in these datasets, and the distributions of the two most weighted features (gldm_DependenceEntropy, shape_Maximum2DDiameterSlice) were visualized with violin-box plot in Supplementary Figure S3. It can be seen that the differences between the distributions of these two features in the positive and negative samples are larger in the external validation set. Therefore, it is understandable that models using these features achieved better results over those of the external validation set.
Deep learning has also been used to predict the invasiveness of PSNs. Kim et al. (44) developed a deep learning model using 2.5D CT images and confirmed that it performed better than the size-based logistic model in distinguishing between IAC and AIS/MIA. However, a deep learning model based on 3D convolutional neural networks in the study by Park et al. (45) showed comparable classification performance with the radiologists’ measurements of solid component size in PSNs. The deep learning method learns features from data and avoids the burden of identifying the effective features manually in images without lesion segmentation. However, deep learning has its own limitations: a large number of cases are needed to train the established model and the interpretability is very limited, users cannot get an effective explanation of the classification results (46, 47). Nevertheless, after expanding the number of cases, we will try to apply the deep learning method to our studies.
Although yearly surveillance CT is recommended for PSNs with solid components <6 mm by Fleischner Society guidelines, the treatment of an individual should also be guided by the probability that the nodule is an IAC and patient preferences. Patients without risk factors (COPD history, family history of lung cancer, etc.) and lower predicted IAC possibility can be followed up routinely and avoid unnecessary surgery. But closer follow-up should be recommended for patients with risk factors and higher predicted IAC possibility. In our study, 16 IAC cases with solid components <6 mm were classified as pT2 stage because of the presence of pleural invasion. So, the accurate IAC prediction in PSNs with solid components <6 mm has important clinical value in the individualized clinical management (routine or closer follow-up, even resection for patients desire surgery) and selection of surgical methods. Our research may provide an individualized clinical management supplement to Fleischner Society guidelines to improve the diagnostic accuracy of radiologists and avoid unnecessary surgery for some patients or provide a clinical basis for some necessary surgeries.
Our study has several limitations. First, all VOIs of the lesion were automatically segmented using software, but as to the lesions with an unclear tumor–lung interface, the segment will be inaccurate and affects the result of data analysis. Manual segmentation is necessary at this time, but the process is tedious and vulnerable to readers’ subjectivity. Second, the clinical-radiographic model in our study was established by the authors #1, #3, and #9 (with 10, 7, and 16 years’ experience in chest CT imaging, respectively); it cannot represent the best diagnostic performance of all radiologists. More radiologists should be enrolled and the “reader performance study” can be performed in our future study. Lastly, numerous radiomics investigations have been published, but the robustness and generalizability of radiomics models still remain questionable and need to be verified by clinical practice. Although we have confirmed that the radiomics features we extracted achieved satisfactory inter- and intra-observer reproducibility and an external validation set from another hospital was also introduced in our study, multicenter research is still necessary in the future study.
Radiomics has been proven to achieve outstanding classification performance in classifying PSNs with solid components <6 mm. It has the potential as an independent diagnostic tool to improve the classification ability of radiologists or thoracic surgeons and save their time and effort without compromising diagnostic accuracy.
The raw data supporting the conclusions of this article will be made available by the authors, without undue reservation.
This study was reviewed and approved by the ethical committee of the first affiliated hospital of Nanjing medical university approved this retrospective study and waived the informed consent for the patients (approval number: 2021-SR-053). Written informed consent for participation was not required for this study in accordance with the national legislation and the institutional requirements.
TZ, CZ and MY: conceptualization and methodology. TZ, CZ and GY: data curation and formal analysis. MY and QZ: funding acquisition, project administration and supervision. TZ, CZ, YZ, YS and MY: investigation. TZ, CZ, HW and GY: software. TZ, CZ, HL, MY and GY: validation. TZ and CZ: writing-original draft. MY and GY: writing-review and editing. All authors contributed to the article and approved the submitted version.
This work was supported by grants from the National Nature Science Foundation of China (81801693).
The authors declare that the research was conducted in the absence of any commercial or financial relationships that could be construed as a potential conflict of interest.
All claims expressed in this article are solely those of the authors and do not necessarily represent those of their affiliated organizations, or those of the publisher, the editors and the reviewers. Any product that may be evaluated in this article, or claim that may be made by its manufacturer, is not guaranteed or endorsed by the publisher.
The Supplementary Material for this article can be found online at: https://www.frontiersin.org/articles/10.3389/fonc.2022.900049/full#supplementary-material
1. Lin KF, Wu HF, Huang WC, Tang PL, Wu MT, Wu FZ. Propensity score analysis of lung cancer risk in a population with high prevalence of non-smoking related lung cancer. BMC Pulm Med (2017) 17:120. doi: 10.1186/s12890-017-0465-8
2. Wu FZ, Huang YL, Wu CC, Tang EK, Chen CS, Mar GY, et al. Assessment of selection criteria for low-dose lung screening CT among Asian ethnic groups in Taiwan: from mass screening to specific risk-based screening for non-smoker lung cancer. Clin Lung Canc (2016) 17:e45–56. doi: 10.1016/j.cllc.2016.03.004
3. Wang YH, Chen CF, Lin YK, Chiang C, Tzao C, Yen Y. Predicting malignancy: subsolid nodules detected on LDCT in a surgical cohort of East Asian patients. J Thorac Dis (2020) 12:4315–26. doi: 10.21037/jtd-20-659
4. MacMahon H, Naidich DP, Goo JM, Lee KS, Leung ANC, Mayo JR, et al. Guidelines for management of incidental pulmonary nodules detected on CT images: from the fleischner society. Radiology (2017) 284:228–43. doi: 10.1148/radiol.2017161659
5. Kobayashi Y, Sakao Y, Deshpande GA, Fukui T, Mizuno T, Kuroda H, et al. The association between baseline clinical-radiological characteristics and growth of pulmonary nodules with ground-glass opacity. Lung Canc (2014) 83:61–6. doi: 10.1016/j.lungcan.2013.10.017
6. Kim H, Park CM, Koh JM, Lee SM, Goo JM. Pulmonary subsolid nodules: what radiologists need to know about the imaging features and management strategy. Diagn Interv Radiol (2014) 20:47–57. doi: 10.5152/dir.2013.13223
7. Travis WD, Brambilla E, Nicholson AG, Yatabe Y, Austin JHM, Beasley MB, et al. The 2015 world health organization classification of lung tumors: impact of genetic, clinical and radiologic advances since the 2004 classification. J Thorac Oncol (2015) 10:1243–60. doi: 10.1097/JTO.0000000000000630
8. Tsutani Y, Miyata Y, Nakayama H, Okumura S, Adachi S, Yoshimura M, et al. Appropriate sublobar resection choice for ground glass opacity-dominant clinical stage IA lung adenocarcinoma: wedge resection or segmentectomy. Chest (2014) 145:66–71. doi: 10.1378/chest.13-1094
9. Migliore M, Palmucci S, Nardini M, Basile A. Imaging patterns of early stage lung cancer for the thoracic surgeon. J Thorac Dis (2020) 12:3349–56. doi: 10.21037/jtd.2020.02.61
10. Lee JH, Park CM, Kim H, Hwang EJ, Park J, Goo JM. Persistent part-solid nodules with solid part of 5 mm or smaller: can the 'follow-up and surgical resection after interval growth' policy have a negative effect on patient prognosis? Eur Radiol (2017) 27:195–202. doi: 10.1007/s00330-016-4364-9
11. Zhang Y, Fu F, Chen H. Management of ground-glass opacities in the lung cancer spectrum. Ann Thorac Surg (2020) 110:1796–804. doi: 10.1016/j.athoracsur.2020.04.094
12. Saji H, Matsubayashi J, Akata S, Shimada Y, Kato Y, Kudo Y, et al. Correlation between whole tumor size and solid component size on high-resolution computed tomography in the prediction of the degree of pathologic malignancy and the prognostic outcome in primary lung adenocarcinoma. Acta Radiol (2015) 56:1187–95. doi: 10.1177/0284185114554823
13. Liu Y, Sun H, Zhou F, Su C, Gao G, Ren S, et al. Imaging features of TSCT predict the classification of pulmonary preinvasive lesion, minimally and invasive adenocarcinoma presented as ground glass nodules. Lung Canc (2017) 108:192–7. doi: 10.1016/j.lungcan.2017.03.011
14. Ahn SY, Park CM, Jeon YK, Kim H, Lee JH, Hwang EJ, et al. Predictive CT features of visceral pleural invasion by t1-sized peripheral pulmonary adenocarcinomas manifesting as subsolid nodules. AJR Am J Roentgenol (2017) 209:561–6. doi: 10.2214/AJR.16.17280
15. Travis WD, Asamura H, Bankier AA, Beasley MB, Detterbeck F, Flieder DB, et al. The IASLC lung cancer staging project: proposals for coding T categories for subsolid nodules and assessment of tumor size in part-solid tumors in the forthcoming eighth edition of the TNM classification of lung cancer. J Thorac Oncol (2016) 11:1204–23. doi: 10.1016/j.jtho.2016.03.025
16. Aokage K, Miyoshi T, Ishii G, Kusumoto M, Nomura S, Katsumata S, et al. Clinical and pathological staging validation in the eighth edition of the TNM classification for lung cancer: correlation between solid size on thin-section computed tomography and invasive size in pathological findings in the new T classification. J Thorac Oncol (2017) 12:1403–12. doi: 10.1016/j.jtho.2017.06.003
17. Naidich DP, Bankier AA, MacMahon H, Schaefer-Prokop CM, Pistolesi M, Goo JM, et al. Recommendations for the management of subsolid pulmonary nodules detected at CT: a statement from the fleischner society. Radiology (2013) 266:304–17. doi: 10.1148/radiol.12120628
18. Lee HY, Choi YL, Lee KS, Han J, Zo JI, Shim YM, et al. Ure ground-glass opacity neoplastic lung nodules: histopathology, imaging, management. AJR Am J Roentgenol (2014) 202:W224–33. doi: 10.2214/AJR.13.11819
19. Ahn H, Lee KH, Kim J, Kim J, Kim J, Lee KW. Diameter of the solid component in subsolid nodules on low-dose unenhanced chest computed tomography: measurement accuracy for the prediction of invasive component in lung adenocarcinoma. Korean J Radiol (2018) 19:508–15. doi: 10.3348/kjr.2018.19.3.508
20. Scholten ET, Jacobs C, van Ginneken B, van Riel S, Vliegenthart R, Oudkerk M, et al. Detection and quantification of the solid component in pulmonary subsolid nodules by semiautomatic segmentation. Eur Radiol (2015) 25:488–96. doi: 10.1007/s00330-014-3427-z
21. Oikonomou A, Salazar P, Zhang Y, Hwang DM, Petersen A, Dmytriw AA, et al. Histogram-based models on non-thin section chest CT predict invasiveness of primary lung adenocarcinoma subsolid nodules. Sci Rep (2019) 9:6009. doi: 10.1038/s41598-019-42340-5
22. Lee JH, Park CM. Differentiation of persistent pulmonary subsolid nodules with a solid component smaller than 6 mm: to be invasive adenocarcinoma or not to be? J Thorac Dis (2020) 12:1754–7. doi: 10.21037/jtd-20-1645
23. Thawani R, McLane M, Beig N, Ghose S, Prasanna P, Velcheti V, et al. Radiomics and radiogenomics in lung cancer: a review for the clinician. Lung Canc (2018) 115:34–41. doi: 10.1016/j.lungcan.2017.10.015
24. Khorrami M, Bera K, Leo P, Vaidya P, Patil P, Thawani R, et al. Stable and discriminating radiomic predictor of recurrence in early stage non-small cell lung cancer: multi-site study. Lung Canc (2020) 142:90–7. doi: 10.1016/j.lungcan.2020.02.018
25. Sun Y, Li C, Jin L, Gao P, Zhao W, Ma W, et al. Radiomics for lung adenocarcinoma manifesting as pure ground-glass nodules: invasive prediction. Eur Radiol (2020) 30:3650–9. doi: 10.1007/s00330-020-06776-y
26. Yuan M, Zhang YD, Pu XH, Zhong Y, Li H, Wu JF, et al. Comparison of a radiomic biomarker with volumetric analysis for decoding tumour phenotypes of lung adenocarcinoma with different disease-specific survival. Eur Radiol (2017) 27:4857–65. doi: 10.1007/s00330-017-4855-3
27. Ko JP, Suh J, Ibidapo O, Escalon JG, Li J, Pass H, et al. Lung adenocarcinoma: correlation of quantitative ct findings with pathologic findings. Radiology (2016) 280:931–9. doi: 10.1148/radiol.2016142975
28. Kim H, Goo JM, Kim YT, Park CM. Consolidation-to-tumor ratio and tumor disappearance ratio are not independent prognostic factors for the patients with resected lung adenocarcinomas. Lung Canc (2019) 137:123–8. doi: 10.1016/j.lungcan.2019.09.014
29. Huang TW, Lin KH, Huang HK, Chen YI, Ko KH, Chang CK, et al. The role of the ground-glass opacity ratio in resected lung adenocarcinoma. Eur J Cardiothorac Surg (2018) 54:229–34. doi: 10.1093/ejcts/ezy040
30. Van Griethuysen JJM, Fedorov A, Parmar C, Hosny A, Aucoin N, Narayan V, et al. Computational radiomics system to decode the radiographic phenotype. Cancer Res (2017) 77:e104–7. doi: 10.1158/0008-5472.CAN-17-0339
31. Zwanenburg A, Vallières M, Abdalah MA, Aerts HJWL, Andrearczyk V, Apte A, et al. The image biomarker standardization initiative: Standardized quantitative radiomics for high-throughput image-based phenotyping. Radiology (2020) 295:328–38. doi: 10.1148/radiol.2020191145
32. Yue X, Liu S, Liu S, Yang G, Li Z, Wang B, et al. HRCT morphological characteristics distinguishing minimally invasive pulmonary adenocarcinoma from invasive pulmonary adenocarcinoma appearing as subsolid nodules with a diameter of ≤3 cm. Clin Radiol (2018) 73:411.e7–15. doi: 10.1016/j.crad.2017.11.014
33. McWilliams A, Tammemagi MC, Mayo JR, Roberts H, Liu G, Soghrati K, et al. Probability of cancer in pulmonary nodules detected on first screening CT. N Engl J Med (2013) 369:910–9. doi: 10.1056/NEJMoa1214726
34. Donin NM, Kwan L, Lenis AT, Drakaki A, Chamie K. Second primary lung cancer in united states cancer survivors, 1992-2008. Cancer Causes Control (2019) 30:465–75. doi: 10.1007/s10552-019-01161-7
35. Li X, Zhang W, Yu Y, Zhang G, Zhou L, Wu Z, et al. CT features and quantitative analysis of subsolid nodule lung adenocarcinoma for pathological classification prediction. BMC Canc (2020) 20:60. doi: 10.1186/s12885-020-6556-6
36. Zhou QJ, Zheng ZC, Zhu YQ, Lu PJ, Huang J, Ye JD, et al. Tumor invasiveness defined by IASLC/ATS/ERS classification of ground-glass nodules can be predicted by quantitative CT parameters. J Thorac Dis (2017) 9:1190–200. doi: 10.21037/jtd.2017.03.170
37. Park CM, Goo JM, Lee HJ, Lee CH, Chun EJ, Im JG. Nodular ground-glass opacity at thin-section CT: histologic correlation and evaluation of change at follow-up. Radiographics (2007) 27:391–408. doi: 10.1148/rg.272065061
38. Hanahan D, Weinberg RA. Hallmarks of cancer: The next generation. Cell (2011) 144:646–74. doi: 10.1016/j.cell.2011.02.013
39. Zhao W, Xu Y, Yang Z, Sun Y, Li C, Jin L, et al. Development and validation of a radiomics nomogram for identifying invasiveness of pulmonary adenocarcinomas appearing as subcentimeter ground-glass opacity nodules. Eur J Radiol (2019) 112:161–8. doi: 10.1016/j.ejrad.2019.01.021
40. Hattori A, Matsunaga T, Takamochi K, Oh S, Suzuki K. Importance of ground glass opacity component in clinical stage IA radiologic invasive lung cancer. Ann Thorac Surg (2017) 104:313–20. doi: 10.1016/j.athoracsur.2017.01.076
41. Chae HD, Park CM, Park SJ, Lee SM, Kim KG, Goo JM. Computerized texture analysis of persistent part-solid ground-glass nodules: differentiation of preinvasive lesions from invasive pulmonary adenocarcinomas. Radiology (2014) 273:285–93. doi: 10.1148/radiol.14132187
42. Qi L, Lu W, Yang L, Tang W, Zhao S, Huang Y, et al. Qualitative and quantitative imaging features of pulmonary subsolid nodules: differentiating invasive adenocarcinoma from minimally invasive adenocarcinoma and preinvasive lesions. J Thorac Dis (2019) 11:4835–46. doi: 10.21037/jtd.2019.11.35
43. Son JY, Lee HY, Lee KS, Kim JH, Han JH, Jeong JY, et al. Quantitative CT analysis of pulmonary ground-glass opacity nodules for the distinction of invasive adenocarcinoma from pre-invasive or minimally invasive adenocarcinoma. PloS One (2014) 9:e104066. doi: 10.1371/journal.pone.0104066
44. Kim H, Lee D, Cho WS, Lee JC, Goo JM, Kim HC, et al. CT-based deep learning model to differentiate invasive pulmonary adenocarcinomas appearing as subsolid nodules among surgical candidates: comparison of the diagnostic performance with a size-based logistic model and radiologists. Eur Radiol (2020) 30:3295–305. doi: 10.1007/s00330-019-06628-4
45. Park S, Park G, Lee SM, Kim W, Park H, Jung K, et al. Deep learning-based differentiation of invasive adenocarcinomas from preinvasive or minimally invasive lesions among pulmonary subsolid nodules. Eur Radiol (2021) 31:6239–47. doi: 10.1007/s00330-020-07620-z
46. Kang G, Liu K, Hou B, Zhang N. 3D multi-view convolutional neural networks for lung nodule classification. PloS One (2017) 12:e0188290. doi: 10.1371/journal.pone.0188290
Keywords: radiomics, nomogram, adenocarcinoma of lung, neoplasm invasiveness, tomography, X-ray computed
Citation: Zhang T, Zhang C, Zhong Y, Sun Y, Wang H, Li H, Yang G, Zhu Q and Yuan M (2022) A radiomics nomogram for invasiveness prediction in lung adenocarcinoma manifesting as part-solid nodules with solid components smaller than 6 mm. Front. Oncol. 12:900049. doi: 10.3389/fonc.2022.900049
Received: 19 March 2022; Accepted: 20 July 2022;
Published: 11 August 2022.
Edited by:
Xinming Zhao, The Fourth Hospital of Hebei Medical University, ChinaReviewed by:
Shouliang Qi, Northeastern University, ChinaCopyright © 2022 Zhang, Zhang, Zhong, Sun, Wang, Li, Yang, Zhu and Yuan. This is an open-access article distributed under the terms of the Creative Commons Attribution License (CC BY). The use, distribution or reproduction in other forums is permitted, provided the original author(s) and the copyright owner(s) are credited and that the original publication in this journal is cited, in accordance with accepted academic practice. No use, distribution or reproduction is permitted which does not comply with these terms.
*Correspondence: Quan Zhu, emh1cXVhbkBuam11LmVkdS5jbg==; Mei Yuan, bmptdV95dWFubWVpQDE2My5jb20=
†These authors have contributed equally to this work and share first authorship
Disclaimer: All claims expressed in this article are solely those of the authors and do not necessarily represent those of their affiliated organizations, or those of the publisher, the editors and the reviewers. Any product that may be evaluated in this article or claim that may be made by its manufacturer is not guaranteed or endorsed by the publisher.
Research integrity at Frontiers
Learn more about the work of our research integrity team to safeguard the quality of each article we publish.