
95% of researchers rate our articles as excellent or good
Learn more about the work of our research integrity team to safeguard the quality of each article we publish.
Find out more
ORIGINAL RESEARCH article
Front. Oncol. , 10 June 2022
Sec. Pharmacology of Anti-Cancer Drugs
Volume 12 - 2022 | https://doi.org/10.3389/fonc.2022.897702
This article is part of the Research Topic Ferroptosis as New Therapeutic Targets in Cancer: from Molecular Mechanisms to Therapeutic Opportunities View all 18 articles
 Debo Yun1,2,3†
 Xuya Wang1,2†
 Wenbo Wang1,2†Xiao Ren1,2†
 Jiabo Li1,2Xisen Wang1,2Jianshen Liang1,2Jie Liu1,2Jikang Fan1,2Xiude Ren1,2Hao Zhang1,2
 Guanjie Shang1,2Jingzhang Sun1,2
 Lei Chen1,2
 Tao Li1,2Chen Zhang2Shengping Yu1,2Xuejun Yang1,2,4*
Background: Ferroptosis is a form of programmed cell death (PCD) that has been implicated in cancer progression, although the specific mechanism is not known. Here, we used the latest DepMap release CRISPR data to identify the essential ferroptosis-related genes (FRGs) in glioma and their role in patient outcomes.
Methods: RNA-seq and clinical information on glioma cases were obtained from the Chinese Glioma Genome Atlas (CGGA) and The Cancer Genome Atlas (TCGA). FRGs were obtained from the FerrDb database. CRISPR-screened essential genes (CSEGs) in glioma cell lines were downloaded from the DepMap portal. A series of bioinformatic and machine learning approaches were combined to establish FRG signatures to predict overall survival (OS) in glioma patients. In addition, pathways analysis was used to identify the functional roles of FRGs. Somatic mutation, immune cell infiltration, and immune checkpoint gene expression were analyzed within the risk subgroups. Finally, compounds for reversing high-risk gene signatures were predicted using the GDSC and L1000 datasets.
Results: Seven FRGs (ISCU, NFS1, MTOR, EIF2S1, HSPA5, AURKA, RPL8) were included in the model and the model was found to have good prognostic value (p < 0.001) in both training and validation groups. The risk score was found to be an independent prognostic factor and the model had good efficacy. Subgroup analysis using clinical parameters demonstrated the general applicability of the model. The nomogram indicated that the model could effectively predict 12-, 36-, and 60-months OS and progression-free interval (PFI). The results showed the presence of more aggressive phenotypes (lower numbers of IDH mutations, higher numbers of EGFR and PTEN mutations, greater infiltration of immune suppressive cells, and higher expression of immune checkpoint inhibitors) in the high-risk group. The signaling pathways enriched closely related to the cell cycle and DNA damage repair. Drug predictions showed that patients with higher risk scores may benefit from treatment with RTK pathway inhibitors, including compounds that inhibit RTKs directly or indirectly by targeting downstream PI3K or MAPK pathways.
Conclusion: In summary, the proposed cancer essential FRG signature predicts survival and treatment response in glioma.
Gliomas are common primary malignant tumors of the central nervous system (1), representing nearly half of all primary intracranial neoplasms (2) and 80% of all malignant brain tumors (3). At present, the main treatment strategy for gliomas throughout the world is surgery (4) followed by postoperative adjuvant radiotherapy and chemotherapy (5, 6). Despite therapeutic advances, glioma patients have a poor prognosis (7), especially those with high-grade tumors (8), due to high levels of tumor cell diversity, proliferation, and metastasis (9). It has been hoped that the use of molecular markers may improve glioma characterization and predict survival (10, 11) but, thus far, the results, including those of clinical trials, have been disappointing (12). The identification of markers and potential targets that can be used for prediction and treatment is thus important, not only for managing the cancer but also for drug discovery.
Ferroptosis is a recently identified form of programmed cell death that is dependent on iron (13, 14). It has been linked with the outcomes of several cancers, including hepatocellular carcinoma, breast cancer, renal cell carcinoma, lung squamous cell carcinoma, and pancreatic carcinoma (15–19). Invasive and metastatic tumor cells have been found to be susceptible to ferroptosis (20) suggesting that targeting the process may be useful for treating cancer. However, there is limited information on the feasibility of targeting FRGs in glioma. The use of CRISPR-Cas9 knockout screening can elucidate relationships between genotype and phenotype through ablation of gene expression on a genome-wide scale and the consequent phenotypic alterations, for the specific identification of genes that could be targeted for inducing tumor growth inhibition or death. Our aim was to combine the CRISPR data to construct a novel prognostic signature based on the identified glioma-essential ferroptosis-related genes to specifically predict clinical outcomes and, importantly, to suggest directions for gene-targeted therapy.
Clinical and RNA-seq transcripts per million reads (TPM) data were obtained from TCGA (https://xenabrowser.net) and CGGA-693 (http://www.cgga.org.cn). Patients with complete clinical data (age, sex, vital status, OS, PFI, IDH status, 1p-19q status, and WHO grade) were included. In all, 1170 patients were included, representing 551 in the training cohort and 619 in the validation cohort (Table 1). Ethical approval was waived as the study followed the TCGA and CGGA regulations for accessing data. Information on 388 FRGs was acquired from FerrDb (http://www.zhounan.org/ferrdb/) (Table S1) (21) and genome-wide CRISPR information on glioma cells was obtained from DepMap (https://depmap.org/portal/download/). The CERES algorithm (22) was used for the determination of dependency scores. First, genes with CERES scores below -1 in more than 75% of glioma cell lines were included. Many of these genes with known housekeeping functions that did not represent feasible targets were excluded, leaving 747 genes that were necessary for glioma cell survival in vitro (Table S2) and were termed glioma essential genes. Potentially targetable genes were identified as those falling into both FRG and CSEG categories. The flow chart of the study is illustrated in Figure 1.
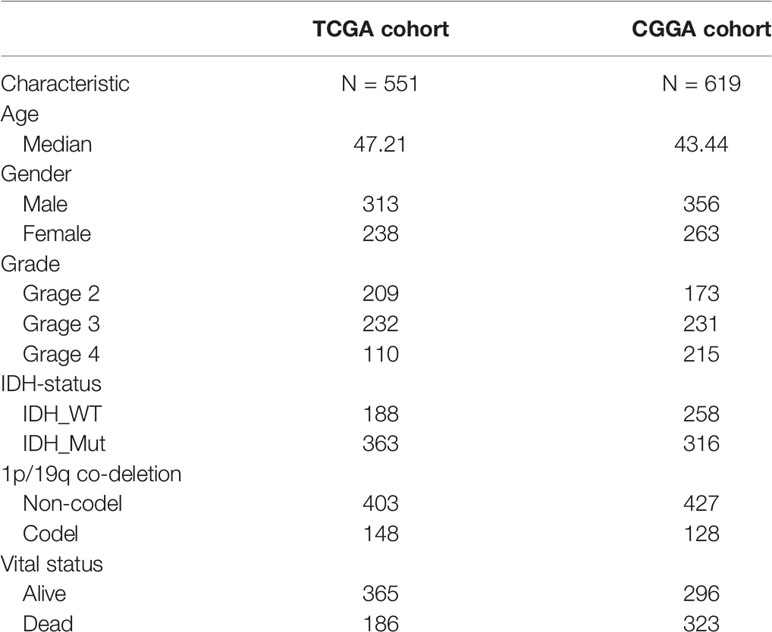
Table 1 The clinical features of TCGA cohort and CGGA cohort.
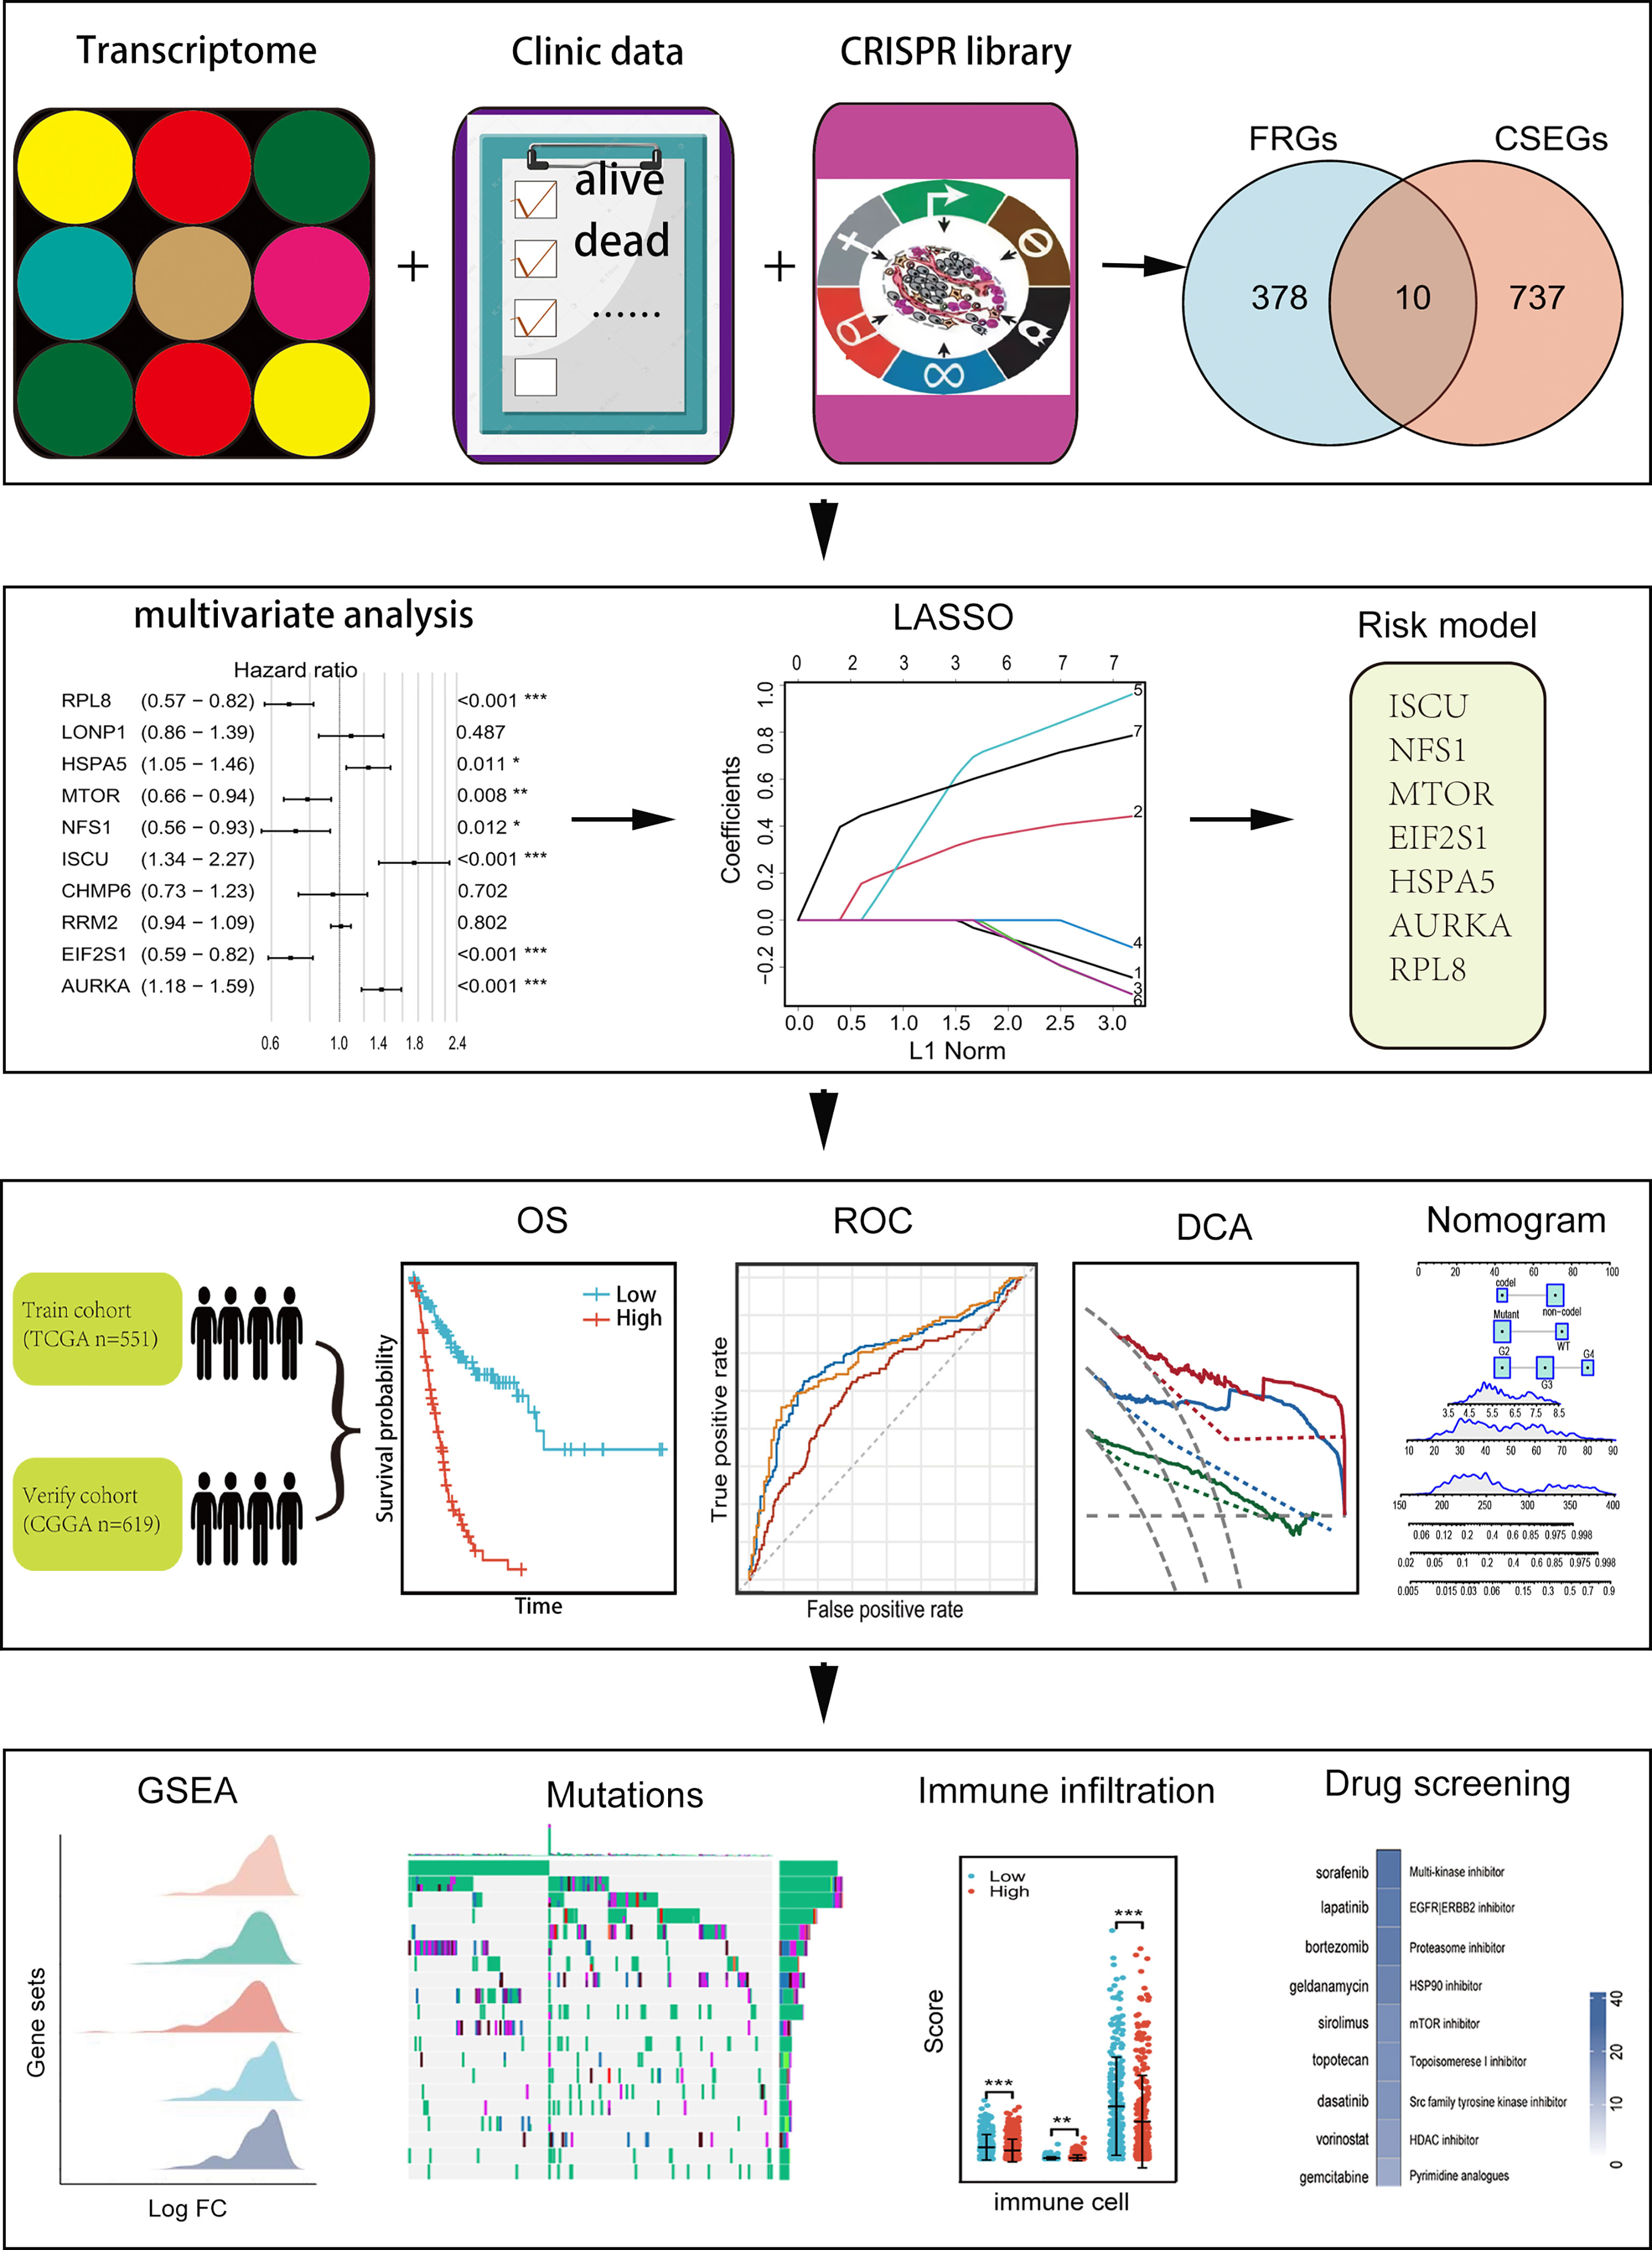
Figure 1 Flow chart showing the design of the study.
Before establishing the model, multivariate regression analysis was performed to identify potential genes related to prognosis (p < 0.05). Suitable candidate genes were identified as those with a minimal partial likelihood of deviance in LASSO regression and were used to construct the prognostic model (23). Risk scores were calculated as the sum of the products of regression coefficients and the expression of the individual genes. A cut-off value, represented by the median risk score, was used to separate both cohorts into high- and low-risk groups. The prognostic efficacy of the signature was assessed by analyzing survival. Time-dependent receiver operating characteristic (tROC) curves were used to calculate the area under the curve (AUC) for the 1-, 3-, and 5-year OS by using the R package “survivalROC” (24). Analysis of clinical correlates was performed between expression of cancer-essential FRGs and clinical characteristics using the R package “ggplot2” (25).
Mutation data were downloaded and visualized using the “maftools” R package to determine the somatic mutation landscape of glioma patients in the TCGA database, identifying distinct ferroptosis-related subtypes (26). Immune infiltration scores of glioma patients in the TCGA were downloaded from TIMER2.0 (http://timer.cistrome.org/) (27) and the patients were divided into high- and low-risk groups. The R packages “ComplexHeatmap” (28) and “ggplot2” were used to analyze and visualize the CIBERSORT algorithm data. Differentially expressed genes (DEGs) were identified using the median risk score as a threshold and the expression of the DEGs was analyzed using the R package “DESeq2” (29). Gene Set Enrichment Analysis (GSEA) was conducted on the TCGA cohort to examine the biological functions and pathways of the cancer-essential FRGs using the “clusterProfiler4.0” package in R (30).
The nomogram for glioma prognostic prediction was established using risk scores and clinical features (31). The accuracy and discriminative ability of the nomogram were assessed by calibration curves. Decision curve analysis (DCA) using the “ggDCA” and “stdca” packages (32) in R was performed to determine the survival net benefits at one, three, and five years for both OS and PFI (33).
Spearman correlation analysis was used to identify compounds negatively associated with the AUC values and glioma cell FRG scores using the GDSC1 and GDSC2 drug response datasets (https://www.cancerrxgene.org) (34) using Spearman’s r < −0.30 and P-values < 0.05 for GDSC1 or <0.1 for GDSC2. DEG expression between the high- and low-risk groups was analyzed. The 150 most upregulated or downregulated genes in the high-risk group were used for further analysis. The relationships of 978 compounds with these 150 genes were examined in CLUE (summary connectivity score) (https://clue.io/repurposing) (35) and the genes were The 150 genes were then analyzed using iLINCS (http://www.ilincs.org/ilincs/) “Pharmacogenomics transcriptional signatures” (36) connectivity algorithms.
R version 4.0.2 was used for all analyses. Differences in normally distributed data were analyzed by unpaired t-tests, and those in non-normally distributed data by the Wilcoxon test. P-values <0.05 were considered significant.
Ten genes (ISCU, NFS1, MTOR, EIF2S1, HSPA5, AURKA, RPL8, LONP1, RRM2, and CHMP6) that fell into both the FRG and CSEG categories were used for further study (Figure 2A). Multivariate Cox regression showed that seven cancer-essential FRGs (ISCU, NFS1, MTOR, EIF2S1, HSPA5, AURKA, and RPL8) were significantly associated (p<0.05) with OS (Figure 2B). LASSO was then applied to reduce the number of these genes. As the partial likelihood was minimal, all the genes were retained and used for the construction of the risk model (Figures 2C, D). The risk score of the training cohort was calculated as 0.4181306×expression of HSPA5-0.2335796×expression of MTOR-0.0372456 ×expression of NFS1 +0.8788312×expression of ISCU-0.2320588×expression of EIF2S1+ 0.7371187×expression of AURKA-0.1765609×expression of RPL8.
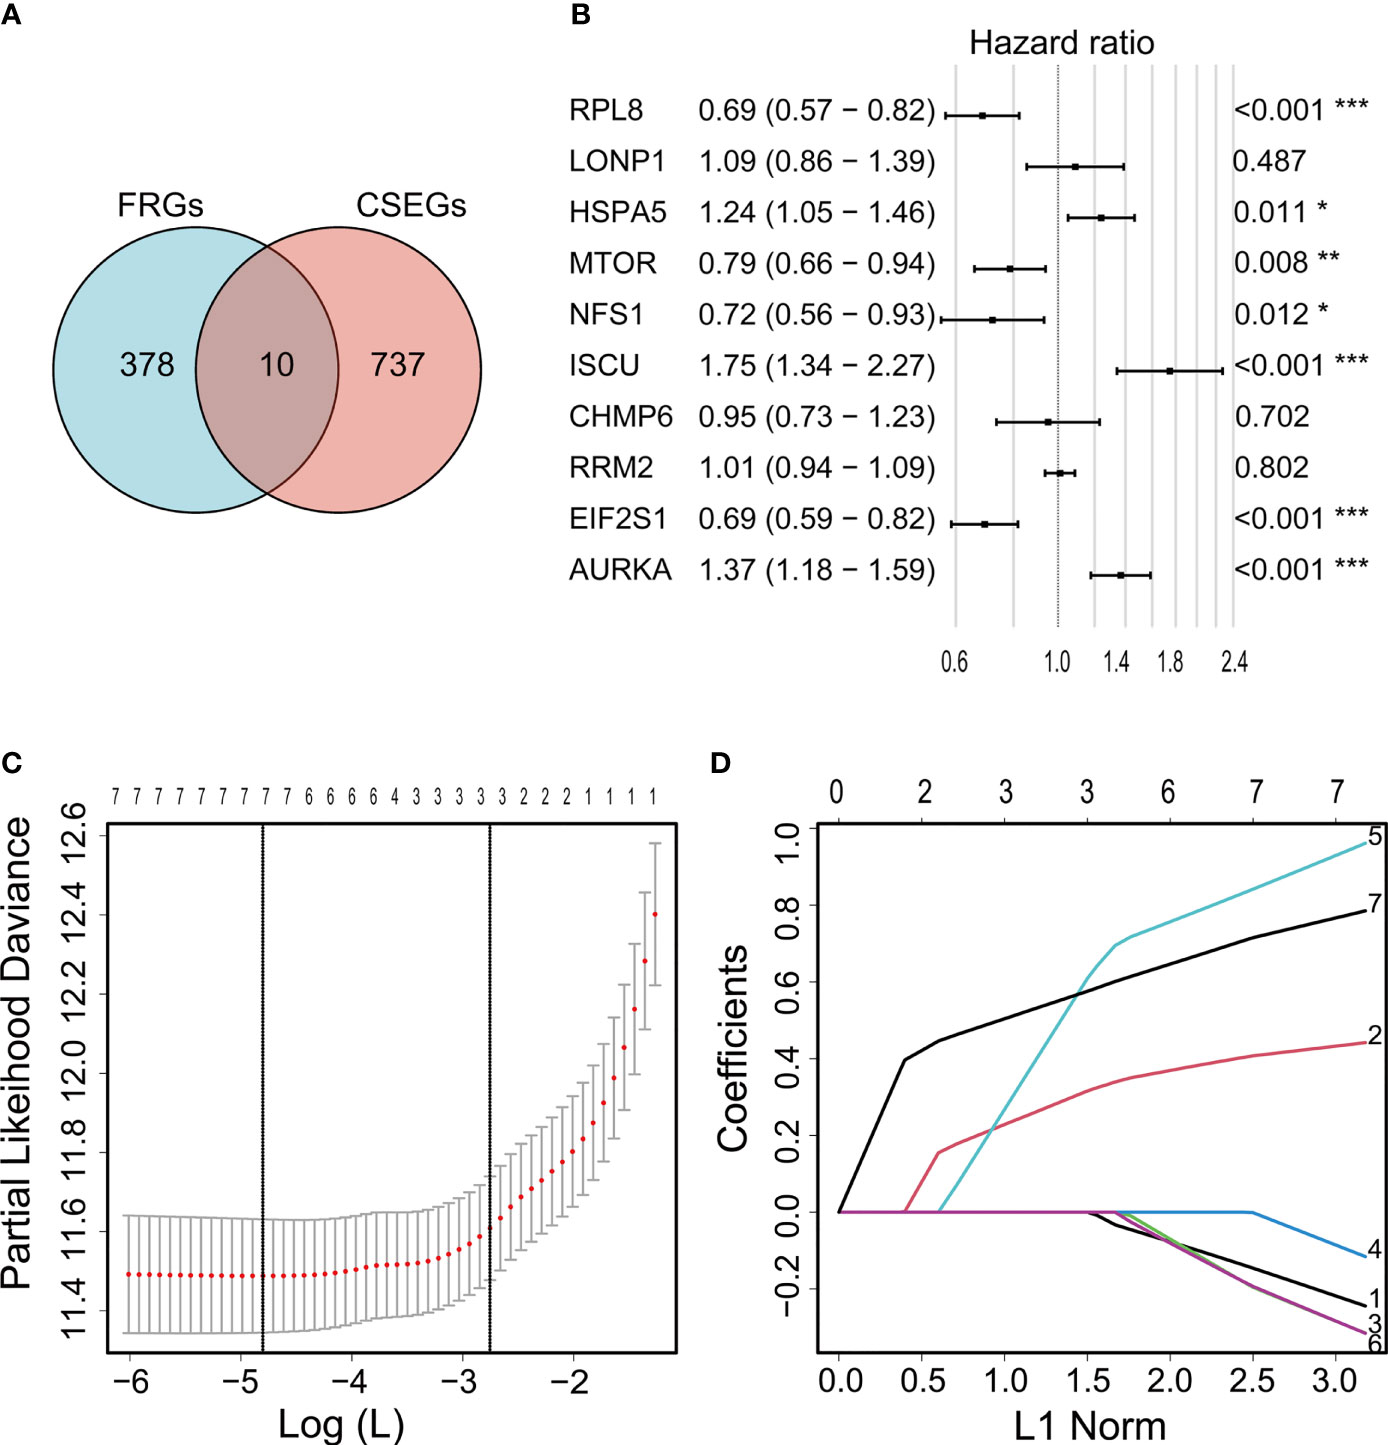
Figure 2 Venn diagram showing overlap of 10 genes between the CSEGs and FRGs (A). Top prognosis-associated candidate genes identified by Cox regression (B). Re-filtering of genes in (B) by LASSO (C, D). *p < 0.05, **p < 0.01, ***p < 0.001.
Patients in the training cohort were assigned to high- and low-risk groups according to the median risk score. Kaplan-Meier curves showed that members of the high-risk groups had significantly lower OS (p<0.001 in both cohorts) (Figures 3A, B). The AUCs for one-, three-, and five-year OS were 0.840, 0.906, and 0.833, respectively, in the training set (Figure 3C) and 0.638, 0.734, and 0.736, respectively, in the validation set (Figure 3D). The risk scores were then ranked in relation to OS and the levels of the seven cancer-essential FRGs were determined in the low- and high-risk groups, as shown in the heatmaps (Figures 3E, F). This indicated that a higher risk score was associated with lower OS for both groups, levels of the AURKA, EIF2S1, and HSPA5 genes were elevated in high-risk individuals in the training set, and all seven genes were strongly expressed in the high-risk category of the validation cohort.
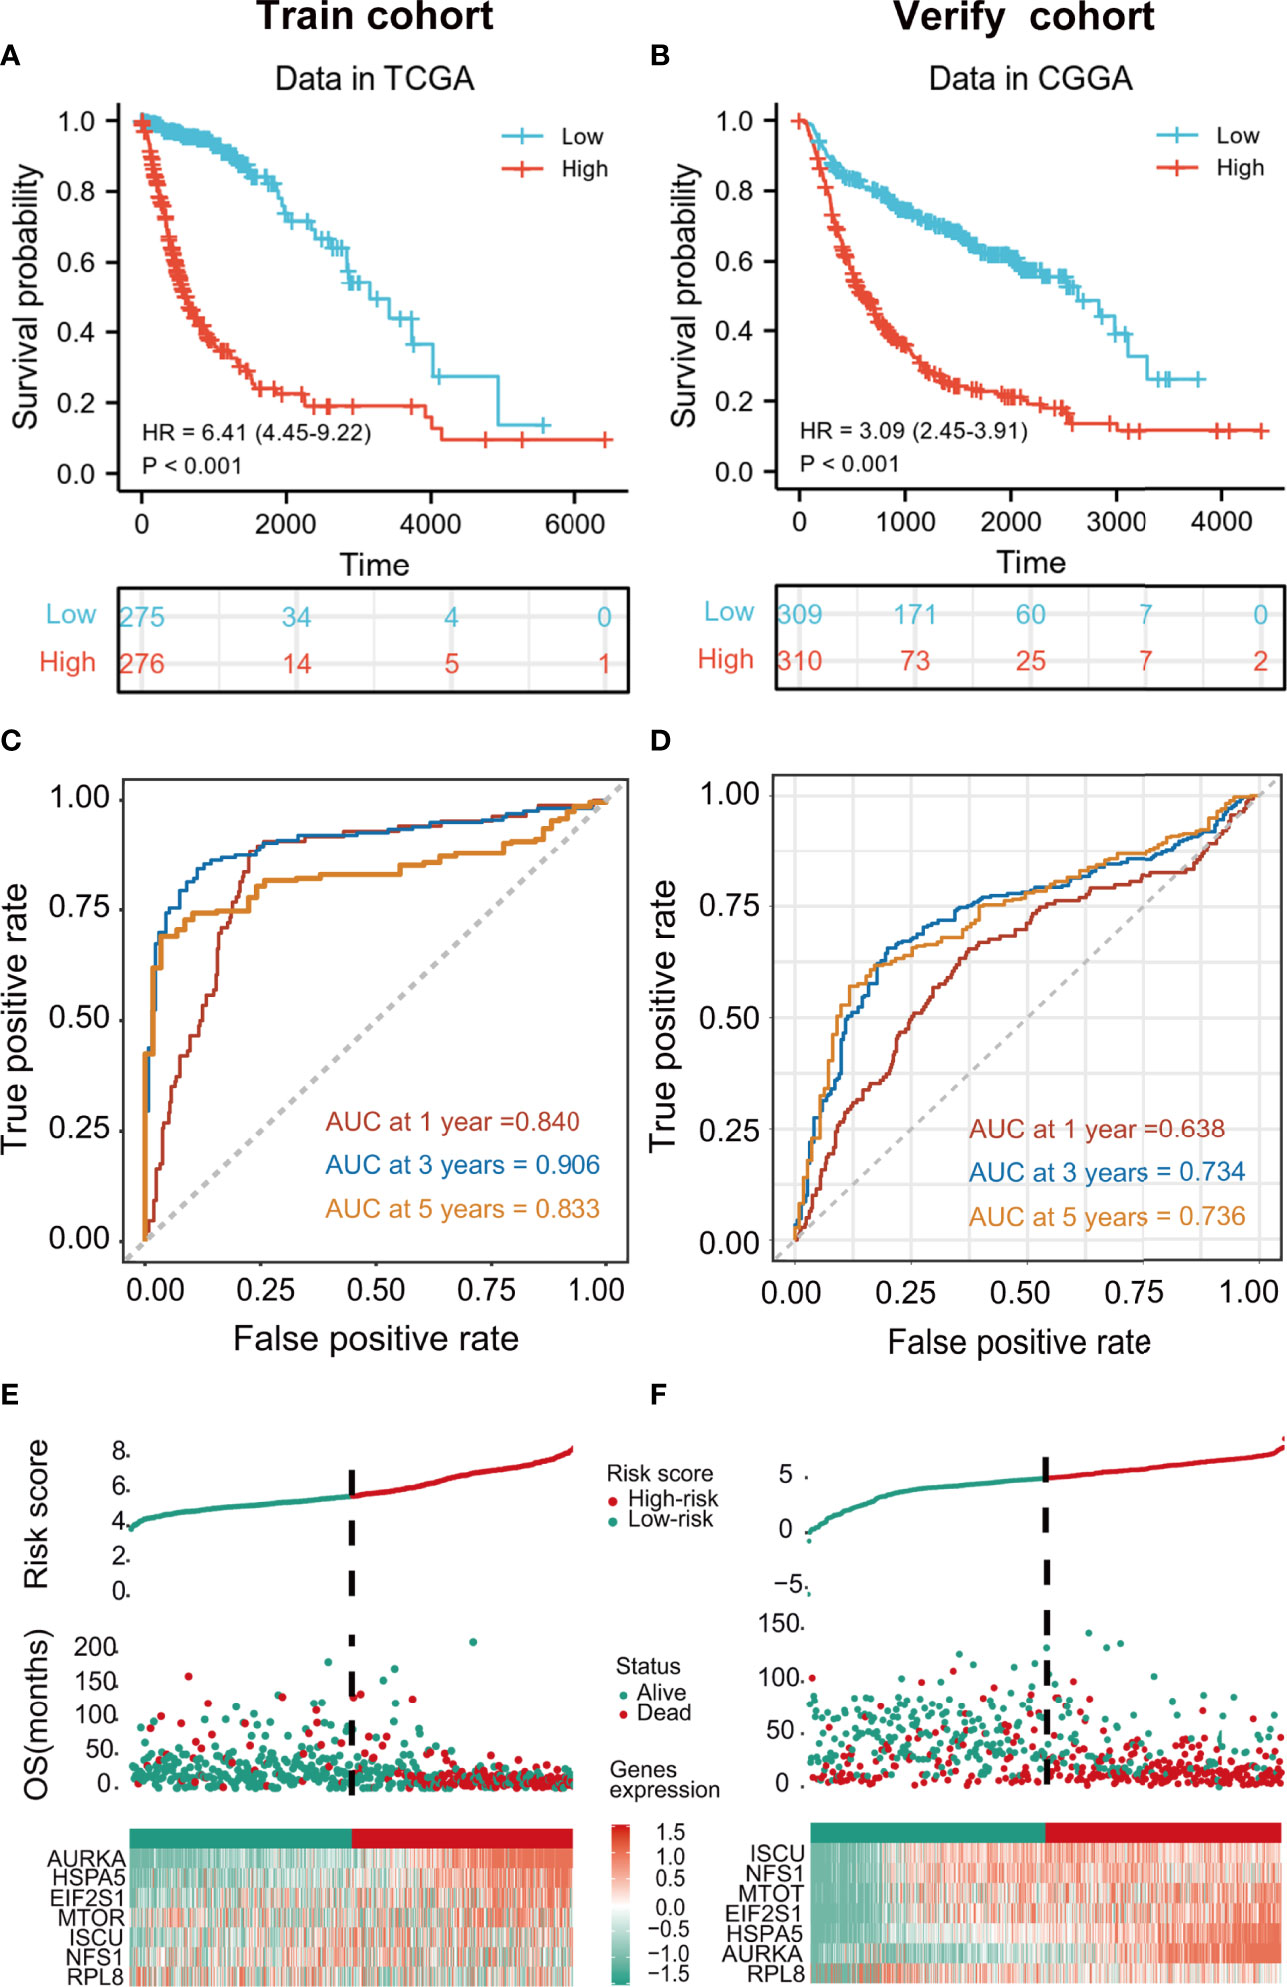
Figure 3 Kaplan-Meier curves showing risk scores of FRG signature genes in both training and validation cohorts (p < 0.001) (A, B). tROC curves for one-, three- and five-year survival (C, D). Heatmaps of risk score rankings, survival, and levels of cancer-essential FRGs in the training and validation cohorts (E, F).
m_sc_clean_body_s.tgaThe relationships between the levels of the seven signature genes and the clinical features of glioma patients from TCGA were investigated. The expression levels of these genes in tumor tissue were significantly different in comparison with those in normal tissues (Figure 4C). The levels of AURKA, EIF2S1, and HSPA5 were significantly associated with age (Figure 4A), grade (Figure 4D), the 1p/19q codeletion (Figure 4E), and isocitrate dehydrogenase (IDH) status (Figure 4F). The risk model genes were not related to sex (Figure 4B). In addition, immunohistochemical data on the risk model genes in normal and tumor specimens were downloaded from The Human Protein Atlas (https://www.proteinatlas.org/) for further verification (Figure 4G).
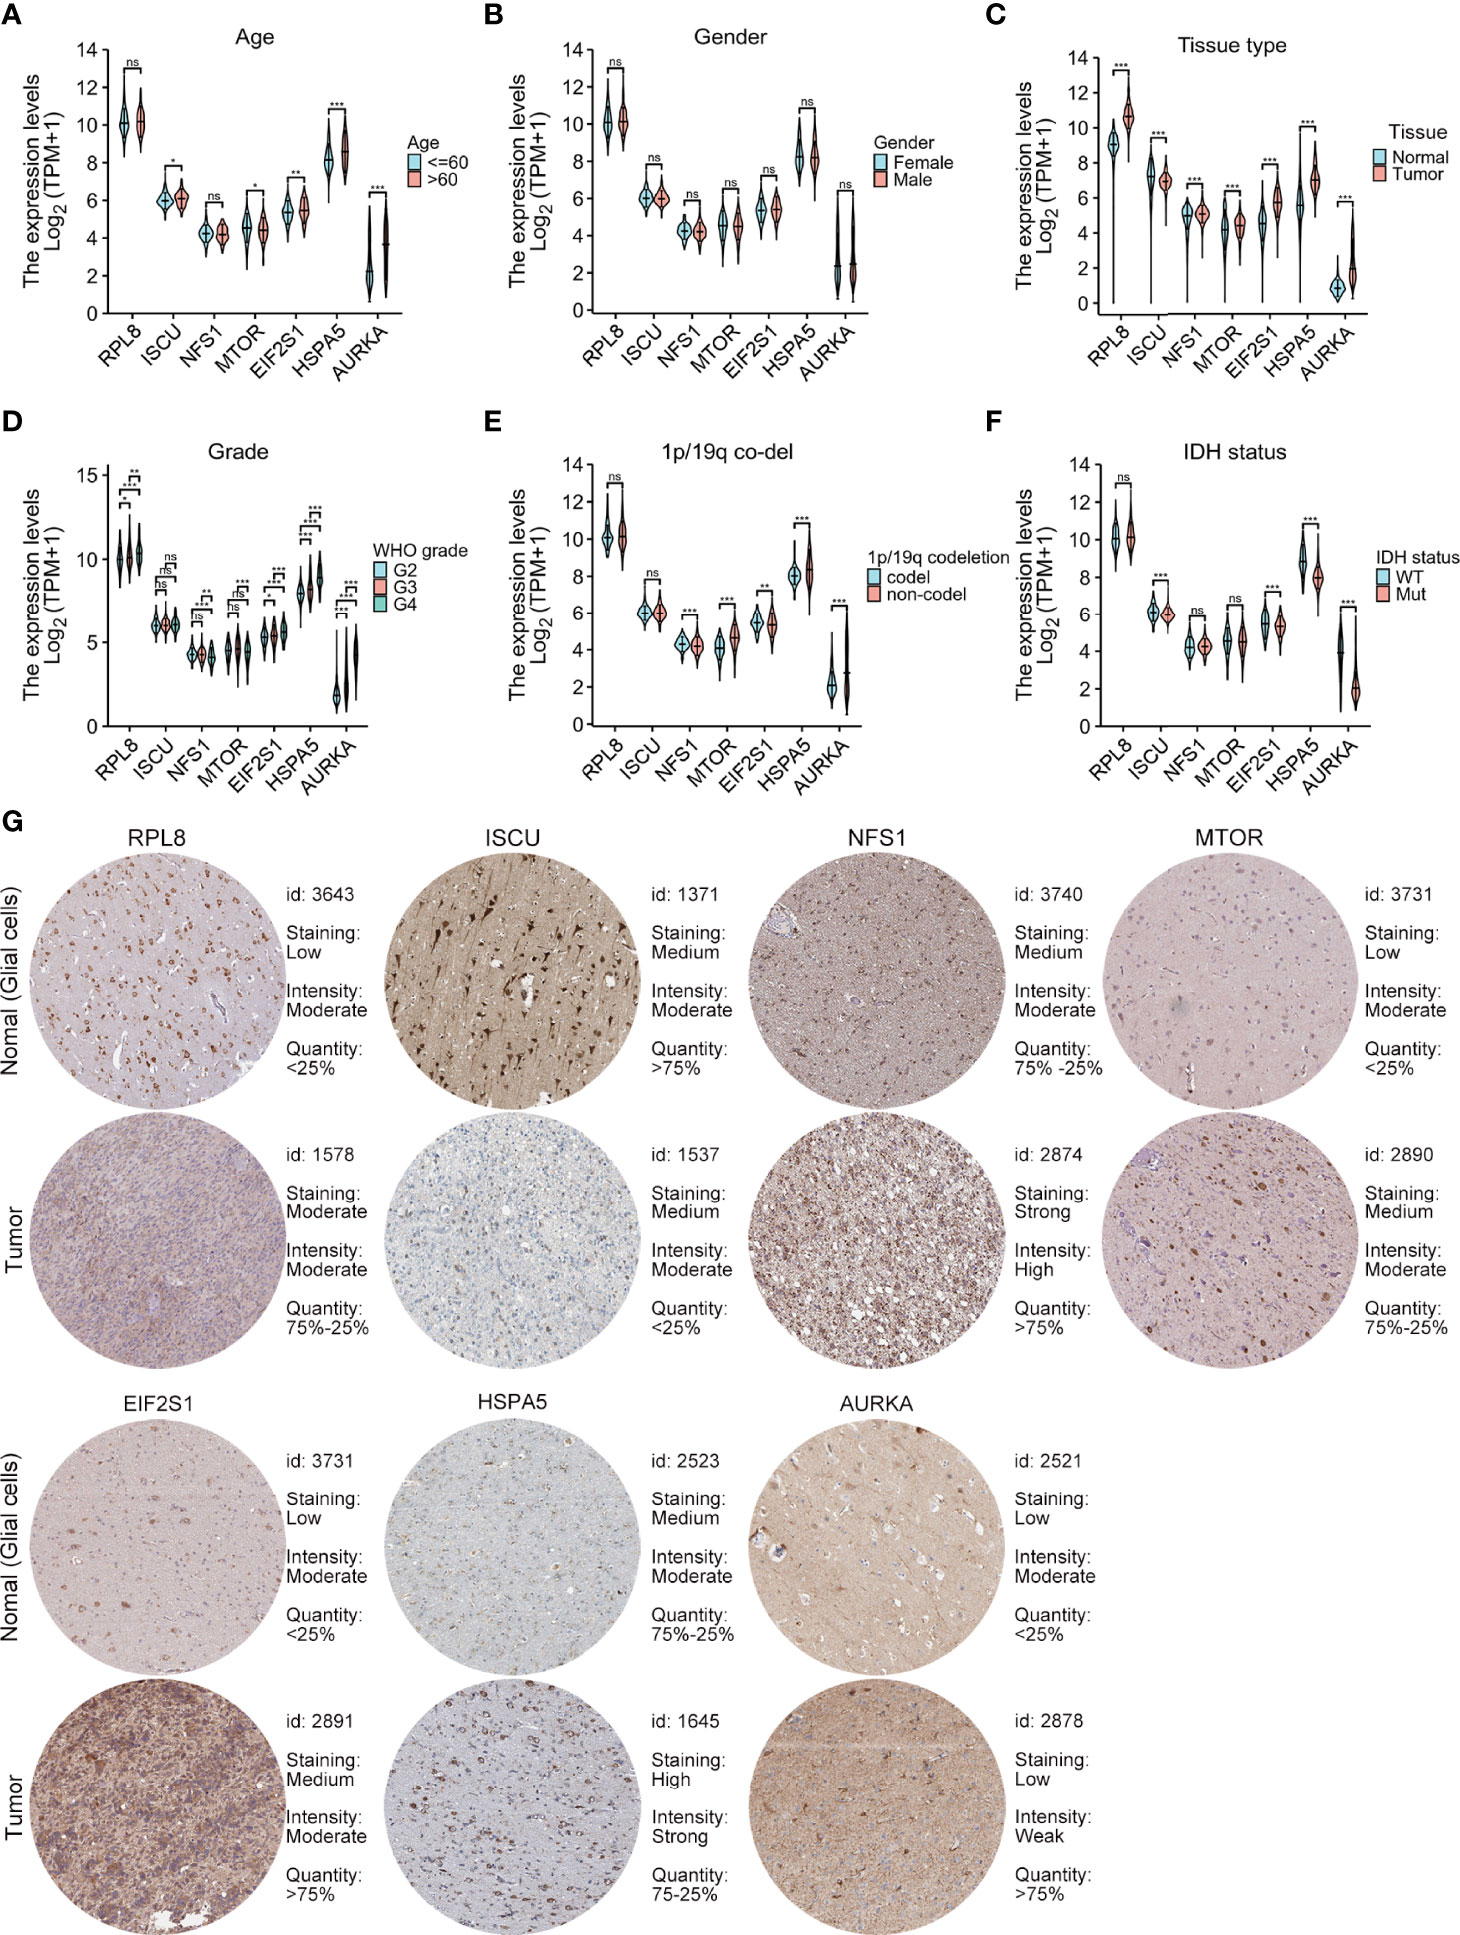
Figure 4 Relationships between the levels of the seven cancer-essential FRGs and clinical features. Age (A), sex (B), normal versus tumor tissue (C), WHO grade (D), 1p/19q co-deletion status (E), and IDH status (F). Immunohistochemistry showing the protein expression of risk model genes in normal and tumor specimens of The Human Protein Atlas (G). ns, p≥0.05, *p < 0.05, **p < 0.01, ***p < 0.001.
Patients in both the training and validation cohorts were divided into subgroups according to clinical features, including the age, sex, IDH status, 1p/19q con-deletion status, and WHO classification of the TCGA (Figure 5A) and the CGGA (Figure 5B) patients, as well as the primary/recurrent tumor types of the CGGA patients (Figure 5B). The subgroups were assessed in terms of median risk scores and survival curves were compiled for each of the clinical features. The results showed that the risk model was effective for these factors, except for patients with IDH-mut in the training cohort (Figure 5A) and those with the 1p/19q con-deletion and WHO IV in both the training and validation groups (Figures 5A, B).
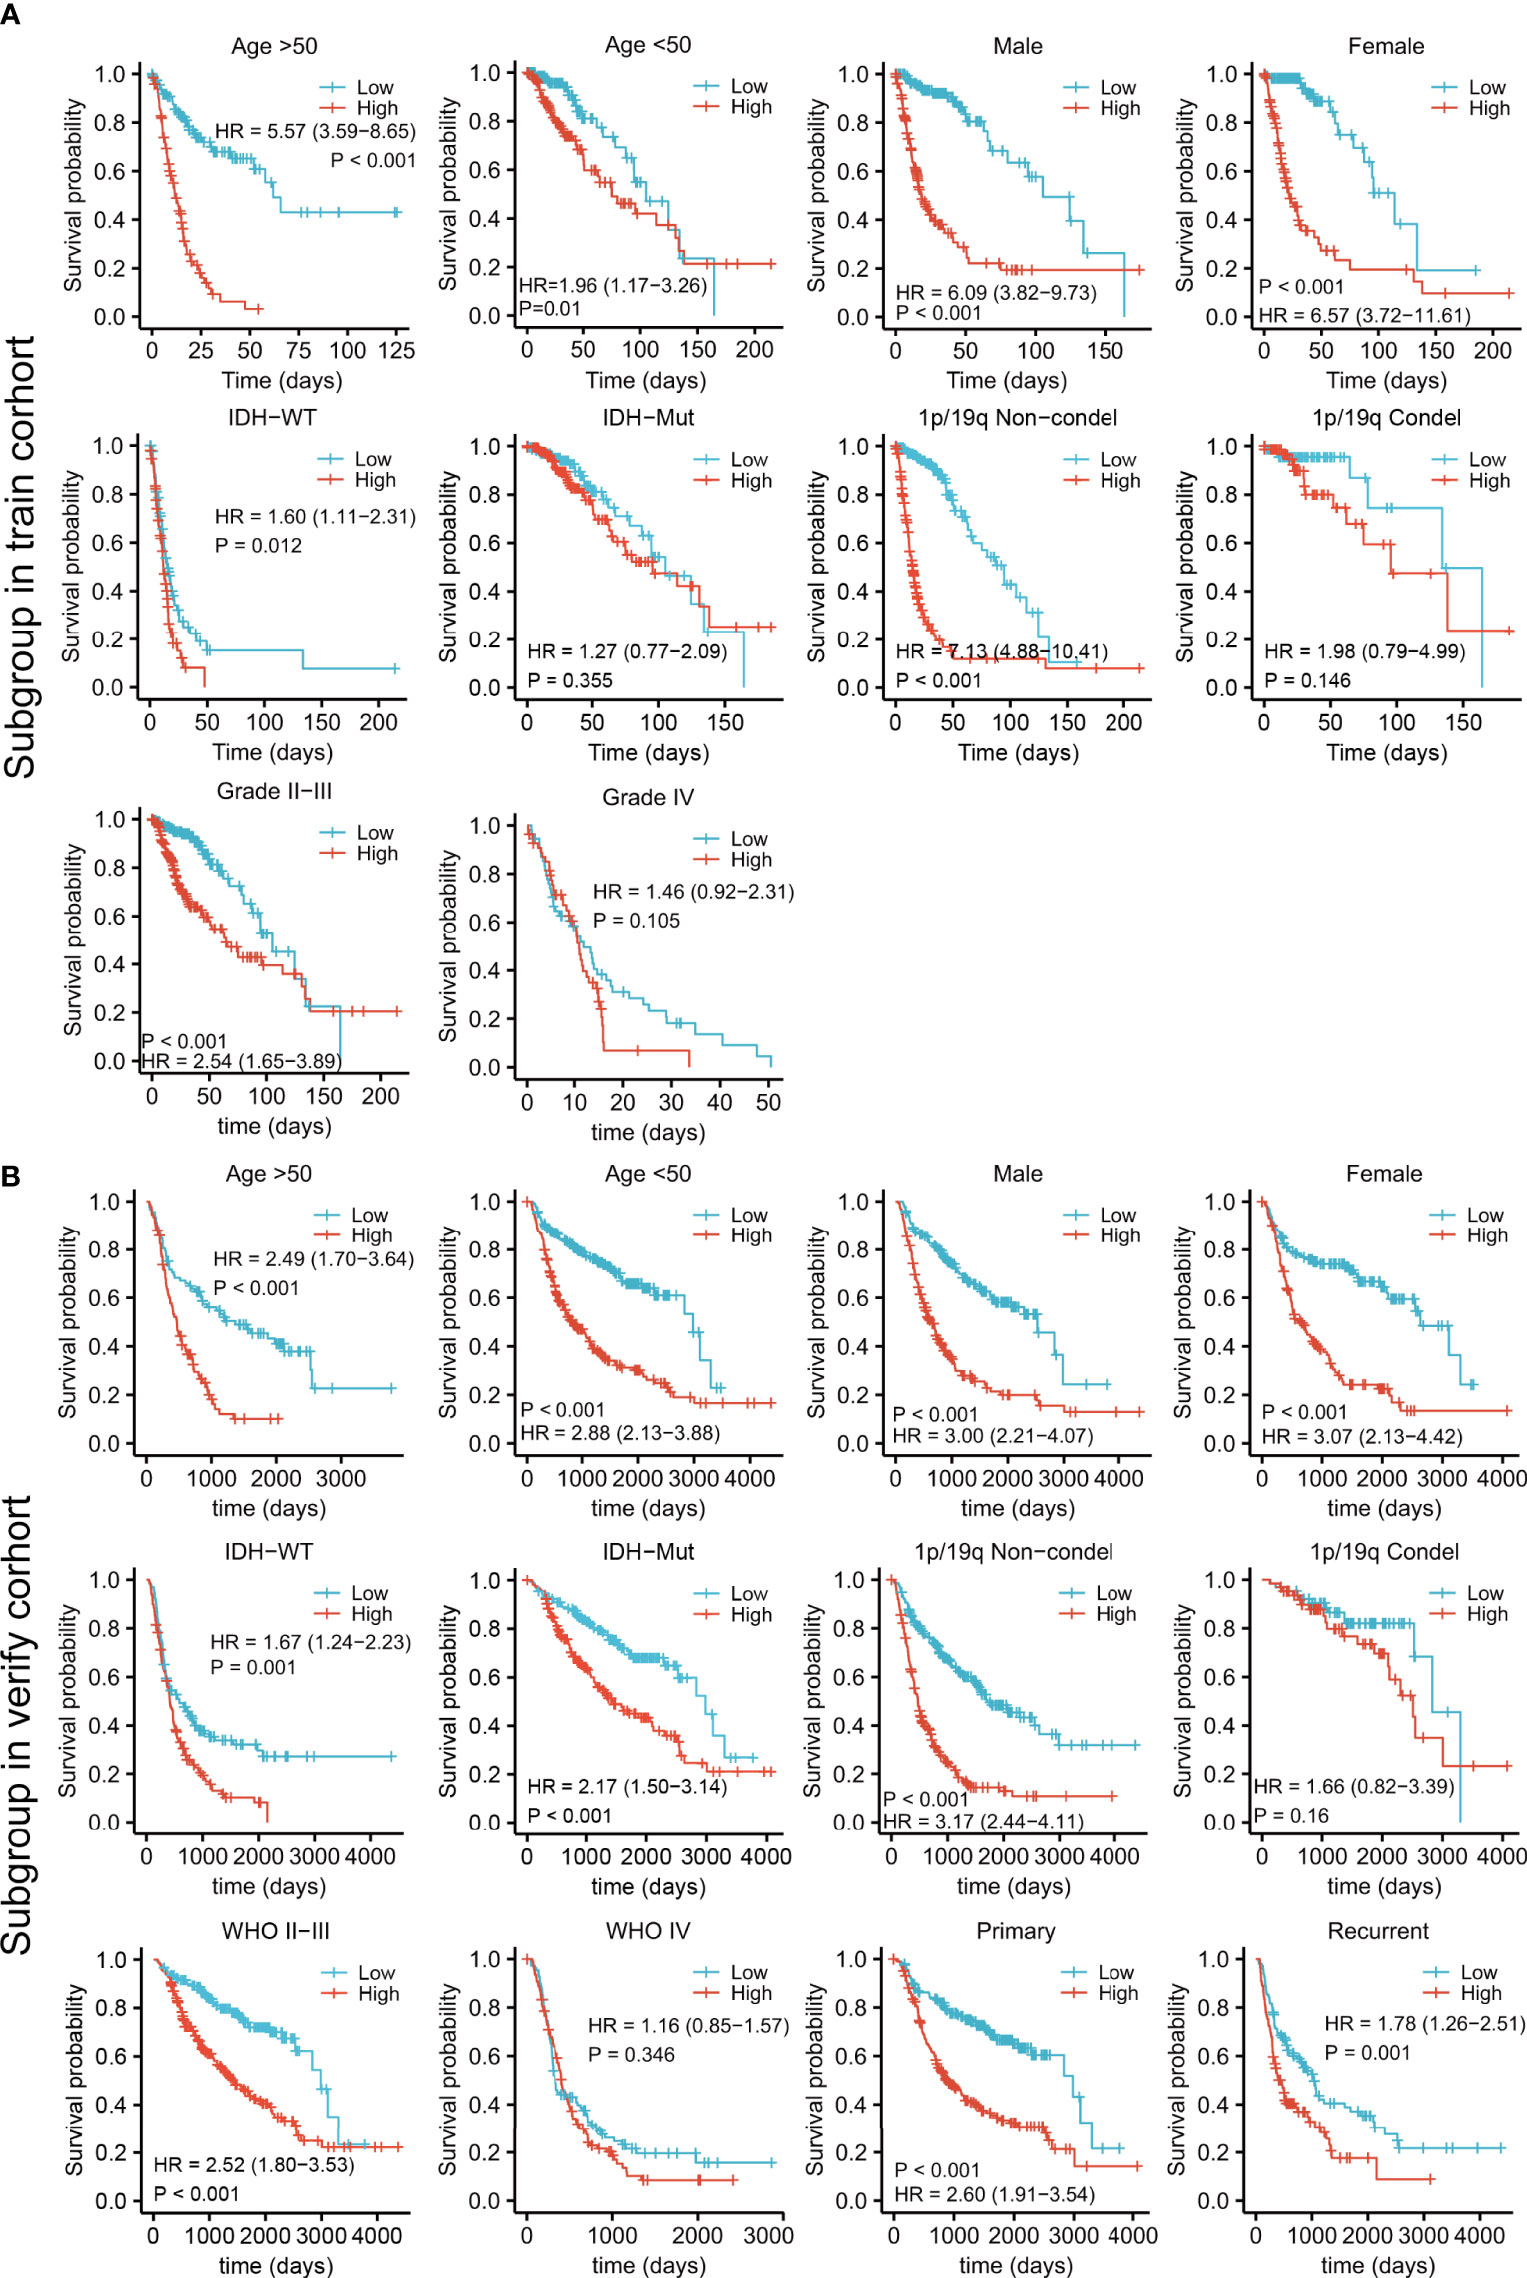
Figure 5 Survival analysis by the risk model in relation to subgroups of clinical features in the training (A) and validation cohorts (B).
Intuitively, the landscapes of somatic genetic alterations provided the 20 most frequently mutated genes in each risk cohort of TCGA samples. The results showed that 91.6% of patients in the low-risk group had IDH mutations, in contrast to only 38.5% in the high-risk group (Figures 6A, B), while PTEN and EGFR had higher rates of mutation in the high-risk group (Figure 6B). The immune cell infiltration scores of each sample were estimated using the CIBERSORT algorithm. Notably, the levels of regulatory T cells (Tregs) and M2 macrophages were higher in the high-risk group (Figures 6C, D) and the expression of immune checkpoint genes (CD274, CTLA4, CEACAM1, LAG3, TIGIT, PDCD1, and BTLA) were also higher in the high-risk group (Figure 6E). These results indicated that high-risk patients may be sensitive to PTEN or EGFR inhibition or the blocking of immune checkpoint gene expression.
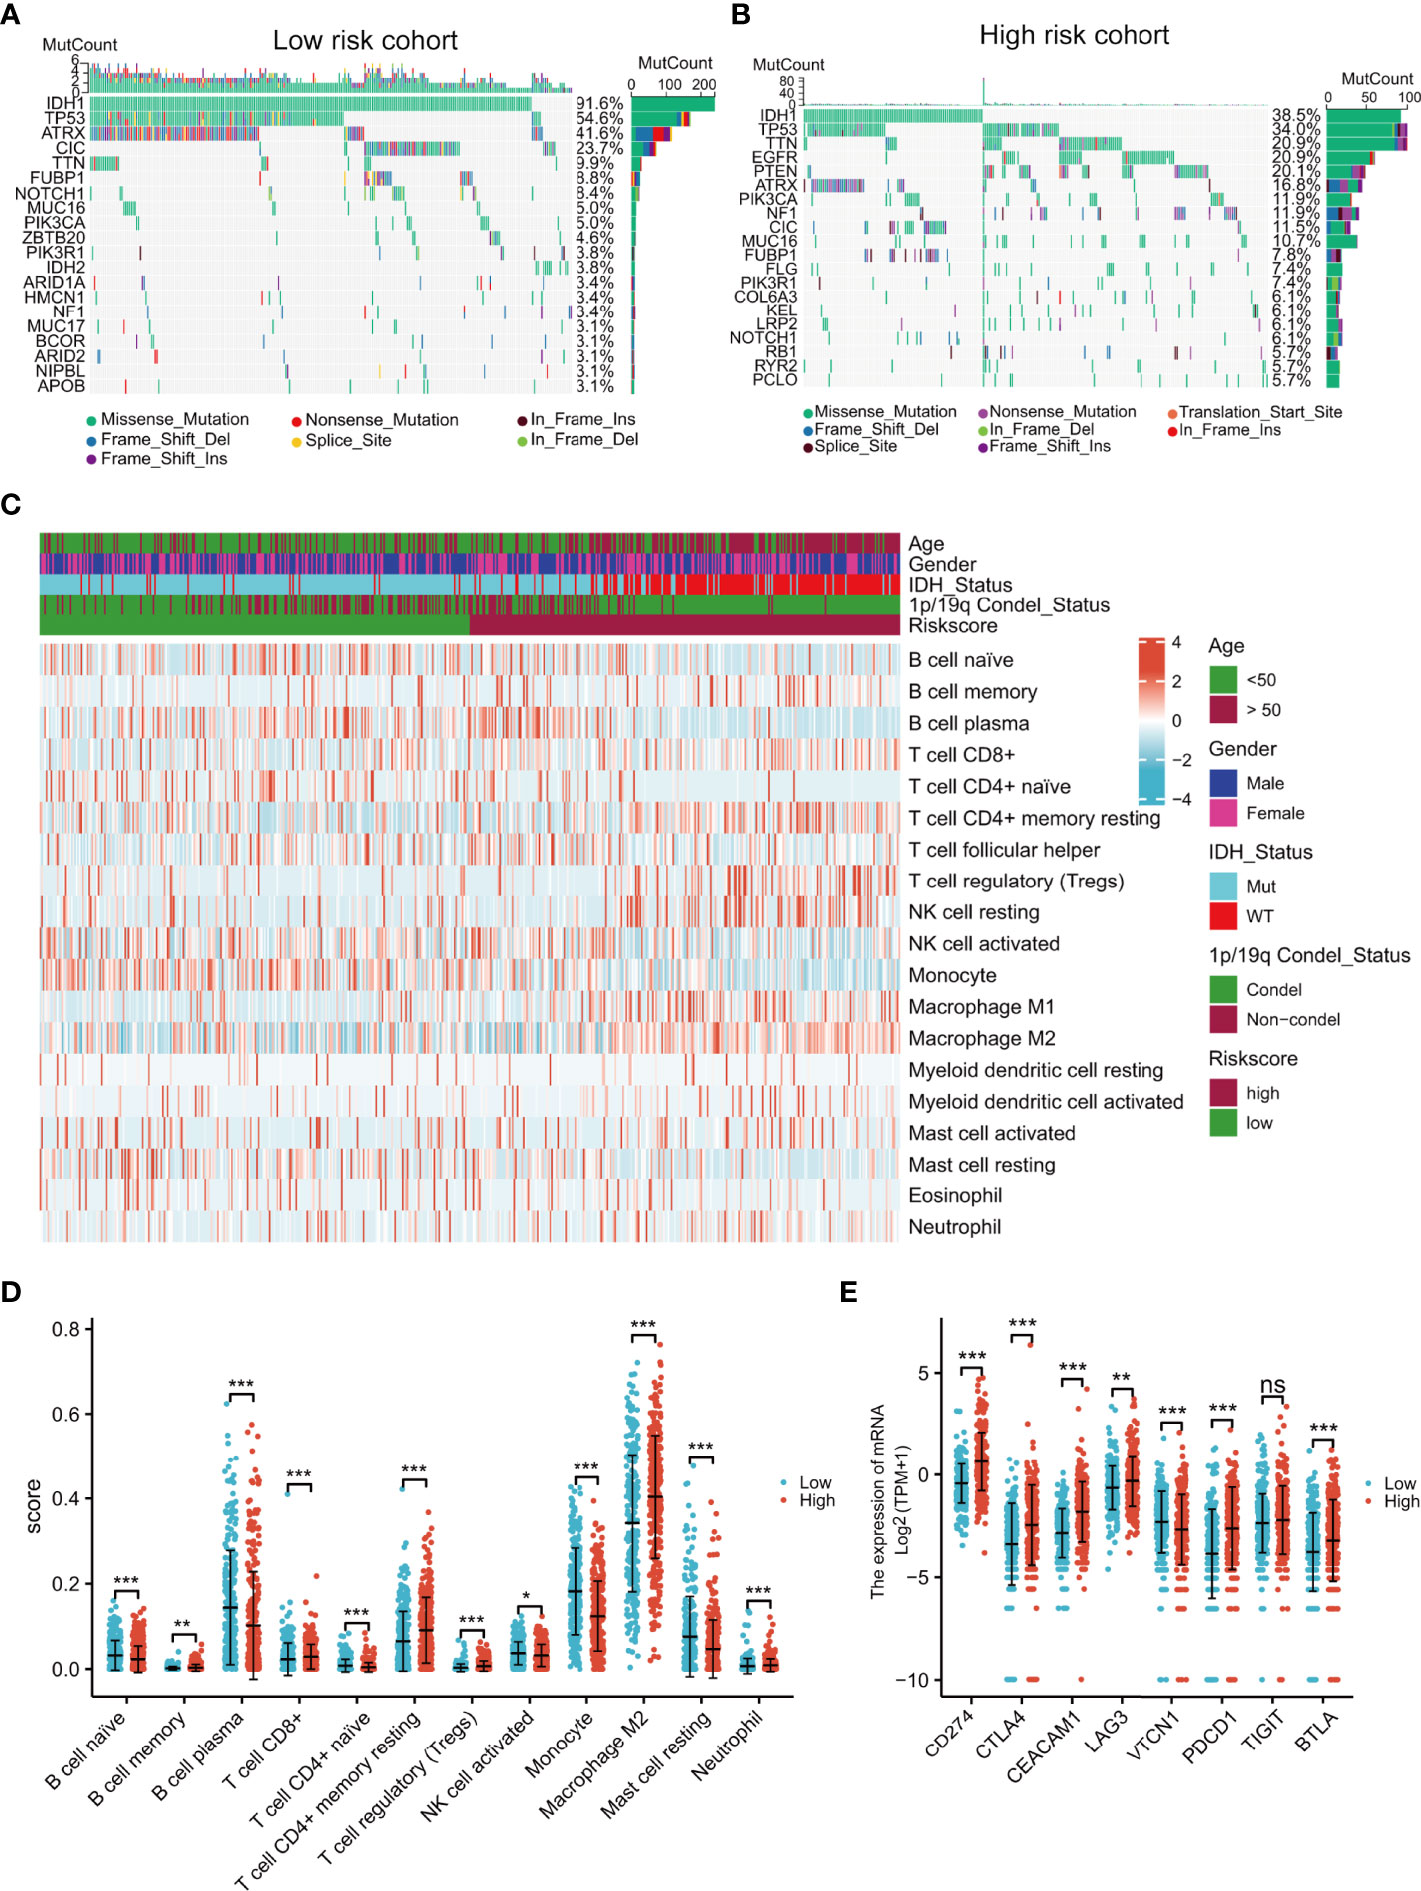
Figure 6 Comprehensive analyses of genomic alterations, immune cell infiltration, and immune checkpoint expression between the different risk groups. Distribution of sex, age, IDH status, 1p/19q condel status, and the top 20 most frequently mutated genes are illustrated for each cohort (A, B). Heatmap showing the CIBERSORT scores of different immune cell distributions in the different subgroups (C). Dot plot showing immune cell CIBERSORT scores and the expression levels of immune checkpoint gene in the high- and low-risk groups (D, E). ns, no significance,*p < 0.05, **p < 0.01, ***p < 0.001.
Univariate and multivariate analyses demonstrated that the risk score and clinical characteristics (age, grade, IDH status, and 1p/19q status) were risk factors linked to glioma prognosis in TCGA.(Figures 7A, B). The risk score was added to the nomogram prediction model for accurately predicting 12-, 36- and 60-months OS (Figure 7C) and PFI (Figures 7D). The calibration plots showed that the predicted and actual one- three- and five-year OS and PFI approximated well, indicating the good performance of the nomogram in comparison with an ideal model (Figures 7E, F). The clinical value of the nomogram was confirmed by DCA (Figures 7G, H).
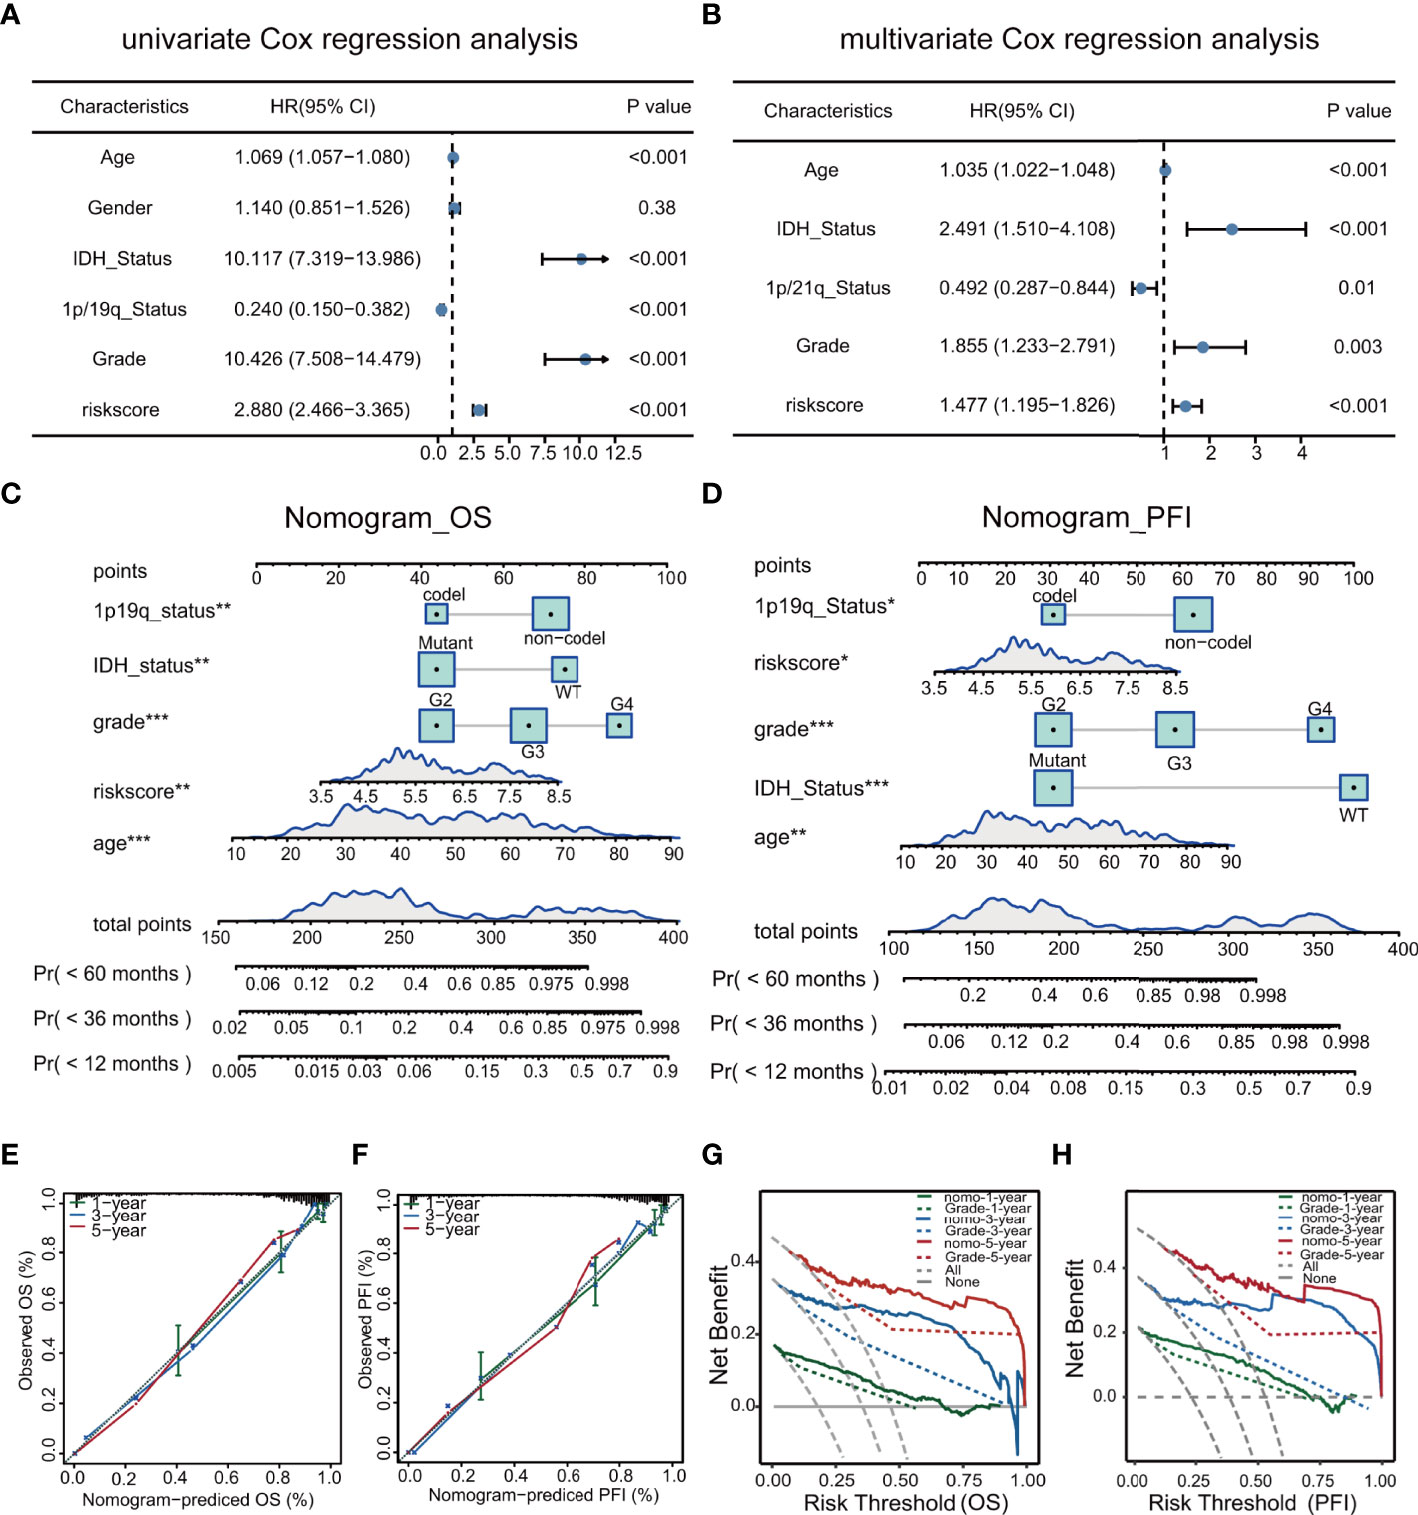
Figure 7 Univariate and multivariate analyses of clinical features in relation to prognosis (A, B). Nomograms for prediction of OS and PFI (C, D). Nomogram calibration using OS and PFI for predicted and actual one- three-, and five-year outcomes (E, F). DCA of nomograms for OS and PFI for one- three-, and five-year survival (G, H).
The expression of the DEGs in the high- and low-risk groups in the TCGA cohort was examined to investigate their functions in glioma. Further functional analysis was performed by GSEA using the HALLMARK (Figure 8A), KEGG (Figure 8B), and Reactome (Figure 8C) databases. Examination of the top 30 pathways showed that the TP53 signaling pathway was enriched in all three databases. Many of the enriched signaling pathways in the three databases were closely related to the cell cycle and DNA damage repair. Other enriched pathways were associated with tumor progression, including the IL6/JAK/STAT3, KRAS, and PI3K/AKT/mTOR signaling pathways, which corresponded to the higher mutation rate of EGFR and PTEN in high-risk patients mentioned above.
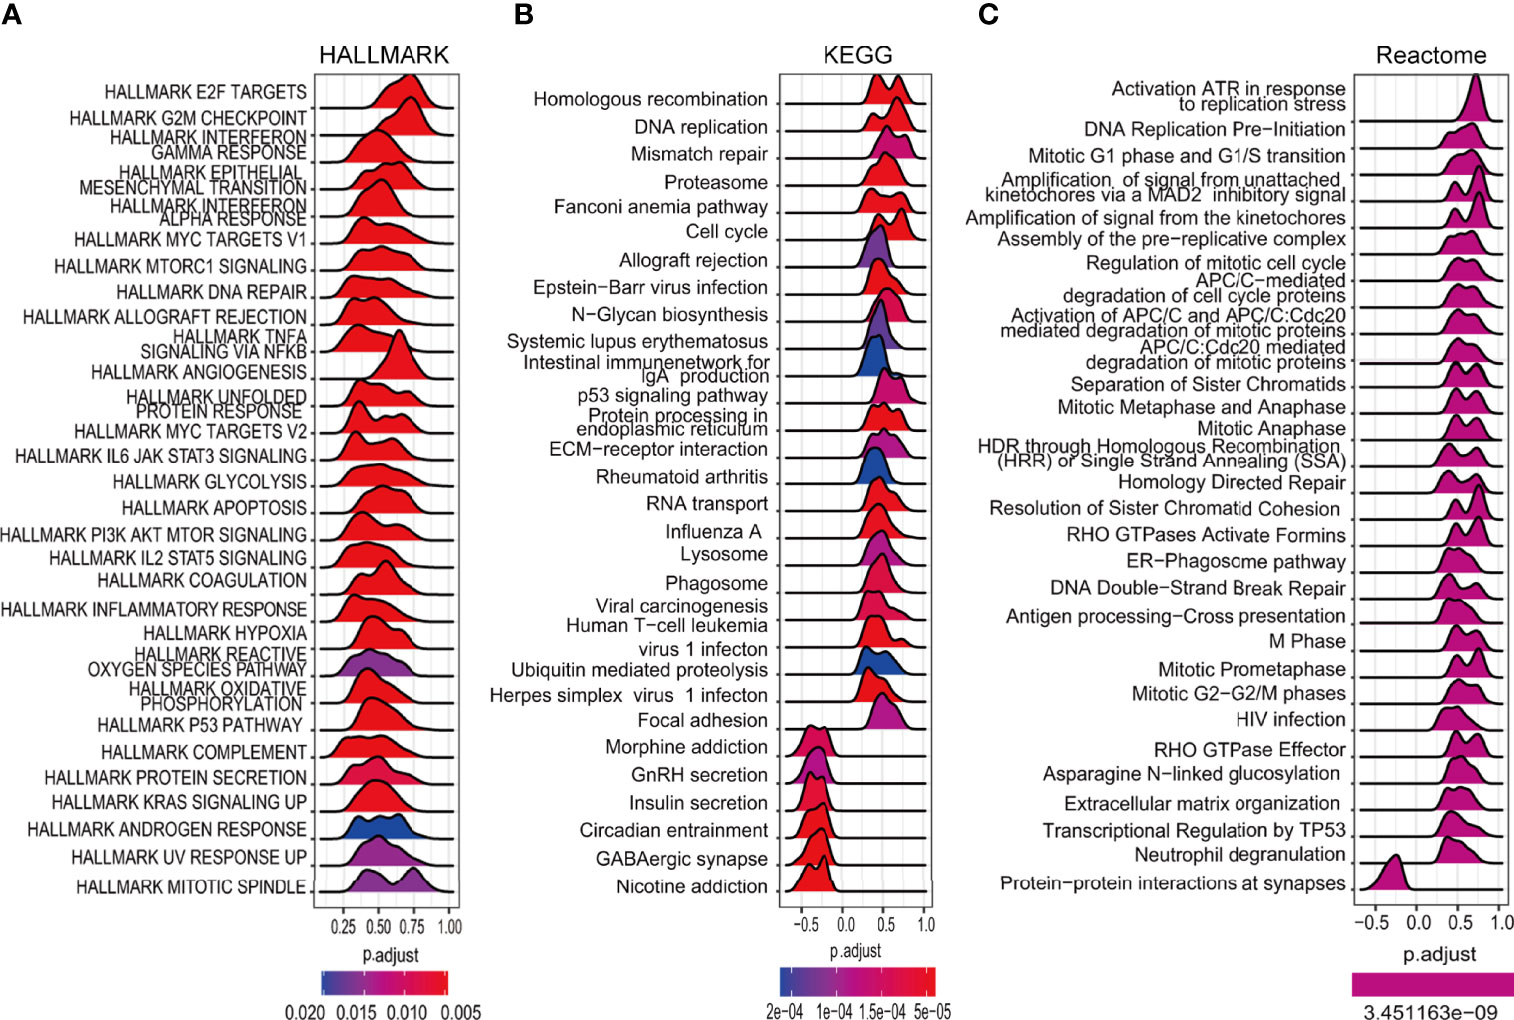
Figure 8 Enrichment analysis of cancer-essential FRG signature genes in the TCGA cohort. The top 30 gene sets of HALLMARK (A), KEGG (B), and Reactome (C).
Correlation analysis identified six GDSC1-derived compounds, namely, voxtalisib, rucaparib, trametinib, LL.Z1640.2, KU.57788, and SB.505124.1, and five GDSC2-derived compounds, namely, MIM.1, epirubicin, AZD4547, GSK1904529A, and AZD5363 (Figures 9 D, E). Although these candidate compounds showed high drug sensitivities in the high-risk group, this evidence is insufficient for supporting the conclusion that they are effective for treating gliomas. Therefore, iLINCs and CLUE were used to determine which compounds could counteract cancer- or glioma-specific gene expression (i.e., gene expression was increased in tumor tissues but decreased in response to treatment with the compound). We submitted 150 genes with the highest and lowest expression, respectively, to CLUE and 150 genes with the lowest expression to iLINCs. The CLUE results (cMAP scores) were subsequently normalized. The top 20 compounds with the potential to reverse the action of FRGs in high-risk patients are listed in Figures 9A–C. Of these, only epirubicin was found to match the GDSC2 results directly, with the other compounds showing similar matches. Thus, we concluded that patients with FRG scores may benefit more from an RTK pathway inhibitor, either by direct inhibition of the RTK or indirect inhibition through targeting downstream effectors such as the PI3K or MAPK pathways.
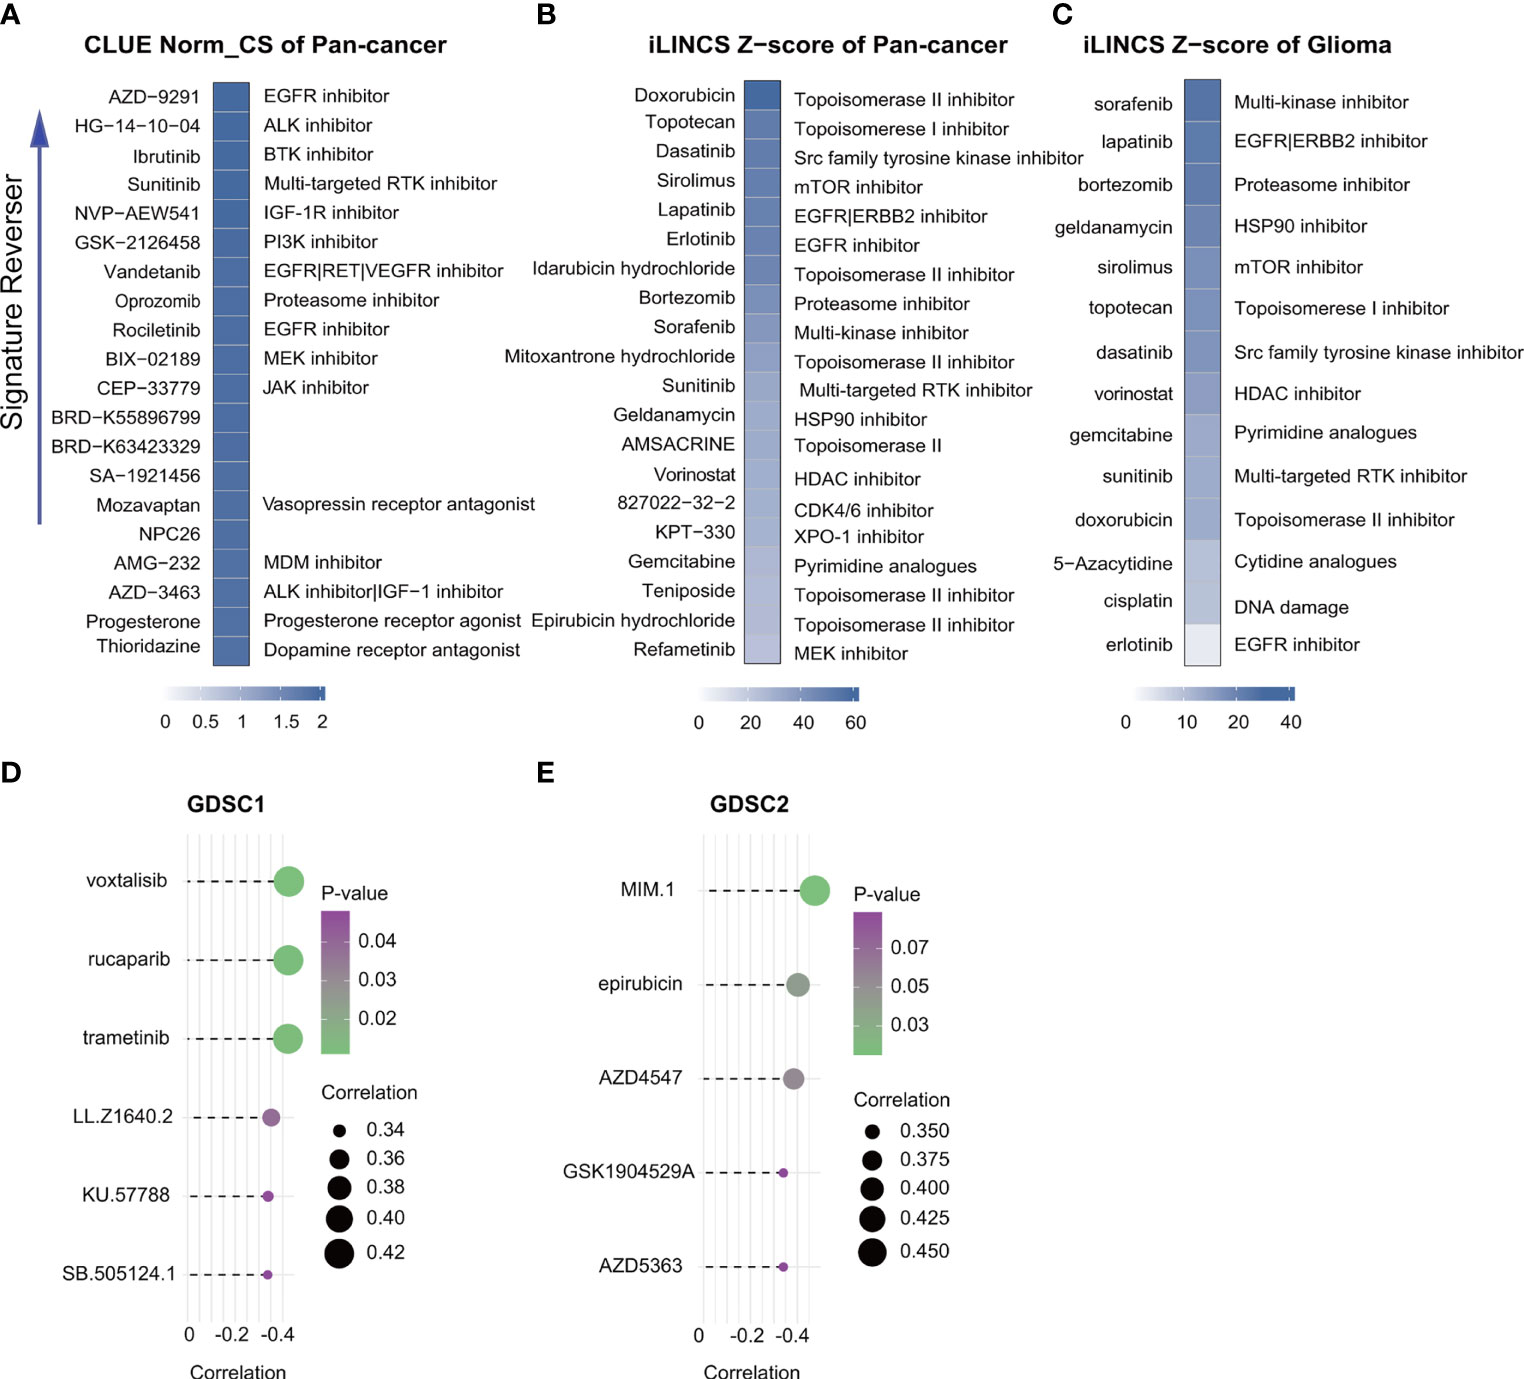
Figure 9 Drug connectivity analysis using alteration-specific transcriptional (CLUE and iLINCS). Pan-cancer in CLUE (A), pan-cancer in iLINCS (B), and glioma in iLINCS (C) identifying 20 compounds that enhance or reverse the signature (highlighted with documented mechanisms). Compounds showing negative correlations with AUC values and FRG scores for glioma cells were identified from GDSC1 and GDSC2. (D, E).
Ferroptosis is a recently described iron-dependent form of PCD, differing from other PCD types such as apoptosis and necroptosis (37). The ferrDB database contains information on all genes linked to ferroptosis and provides the latest resources for research (21). Five ferroptosis-related gene signatures are currently recognized as related to survival in glioma. Gene signatures have been constructed from the investigation of 60-80 candidate genes (9, 38, 39) identified by previous publications. When Zhou and Sun downloaded 173 and 303 FRGs, respectively, from the ferrDB database (40, 41), the overall number of candidate genes was relatively small. The numbers and functional classification of FRGs in the ferrDB are constantly updated as new information becomes available, and new analyses of ferroptosis signatures for glioma have become more necessary. In this study, we applied the latest data including 388 driver, suppressor, and marker genes from the ferrDB database (Figure 2A). At the same time, before the conventional screening of genes using univariate and multivariate Cox regression analysis, we collected data on CRISPR-screened glioma-associated genes from the DepMap portal (Figure 2A) and investigated their intersection with the FRGs. This led to the identification of 10 cancer-essential FRGs (ISCU, NFS1, MTOR, EIF2S1, HSPA5, AURKA, RPL8, LONP1, RRM2, and CHMP6) which were closely related to ferroptosis and essential for glioma cell proliferation and survival. The use of the CRISPR screening technique explored potential cancer-essential FRGs, which may shed light on the discovery of targetable FRGs in other tumors or diseases for research.
After multivariate and LASSO analyses, seven cancer-essential FRGs (ISCU, NFS1, MTOR, EIF2S1, HSPA5, AURKA, and RPL8) were used to construct the risk model (Figures 2B–D). This model was shown to have stable prognostic prediction capability in both the training and validation cohorts (Figures 3A–D) and the subgroups based on clinical features in the validation cohort (Figure 5). Further analysis showed that the risk score independently predicted survival in glioma and was effective for predicting both OS and progression-free survival (Figures 7C–D). These findings strongly implied that these seven cancer-essential FRGs play important roles in many aspects of glioma development and progression. We further examined the classifications of the risk model genes, finding that three (ISCU, NFS1, and HSPA5) were suppressors of ferroptosis, two (EIF2S1 and AURKA) were marker genes, RPL8 was classified as a driver gene, and MTOR was classified as both a driver and a suppressor gene. Thus, most of the risk model genes were ferroptosis suppressors. On the other hand, all the risk model genes had been identified by CRISPR screening as glioma-associated in glioma cell lines and thus would be involved in the promotion of proliferation (22). In terms of single gene functions, ISCU encodes part of the iron-sulfur (Fe-S) cluster scaffold that synthesizes Fe-S clusters in the mitochondria (42). It has been found that ISCU is targeted by miR-210-3p to block the growth and migration of glioma cells in vitro (43). NFS1 encodes several proteins involved in supplying S derived from cysteine to Fe-S clusters and inhibits cysteine transport, triggering ferroptosis and reducing tumor cell growth (44). HSPA5 is involved in protein folding in the endoplasmic reticulum (45), assists in fungal infection of epithelial cells (46), and has been implicated in both proliferation and apoptosis (47). Its expression is promoted by iron in the nasal epithelium (48–50) and is used as a target for >treating chemo-resistant cancers (51). mTOR plays a major role in various metabolic processes, mediating the actions of a variety of hormones, growth factors, and other signaling molecules (52–54). The risk model gene AURKA is involved in cell cycle modulation (55, 56), specifically during mitosis (57), and also regulates phosphorylation of p53/TP53, affecting cancer development (58). In terms of somatic mutation, we found that the frequency of the IDH1 mutation was greater in the low-risk group, in contrast to the higher mutation rates seen in both PTEN and EGFR in the high-risk group (Figures 6A, B), suggesting that the mutation frequencies in those genes may have different effects on ferroptosis. Previous studies have shown that IDH-mut glioma patients had a better prognosis than those with wild-type IDH, across all WHO grades (11, 40), that EGFR amplification was correlated with poor prognosis (59), and that PTEN mutations could promote the infiltration of immunosuppressive tumor-associated macrophages (TAMs) (60). This suggests that FRGs represent good indicators of malignancy-associated glioma characteristics. The analysis of immune cell infiltration showed higher scores for memory B cells, CD8+ T cells, CtD4+ naïve and memory T cells, Tregs, neutrophils, and M2 macrophages in the high-risk group. These results indicated that the patients in the two risk groups have completely different immune microenvironments. Studies have shown that CD4+ T cells, B cells, CD8+ T cells, neutrophils, and M2 macrophages play important roles in the occurrence and malignant progression of glioma (61–63) and that Tregs are closely associated with significant immune suppression in the tumor (64), thus supporting the results of our study. The expression of immune checkpoints was significantly increased in the high-risk group except for VTCN1, indicating a close relationship with glioma immune escape. Tumor immunotherapy is currently an attractive treatment and has achieved good results in other cancers, such as lung cancer. Unfortunately, these have yielded little success clinically, and all clinical trials of immunotherapy have failed. The establishment of the current model may be useful for screening patients for glioma immunotherapy. The enrichment analysis also showed that the model genes were associated with DNA replication and repair and the cell cycle, as well as several signaling pathways closely related to tumor progression (Figures 8A–C). Indeed, the high degree of DNA damage and poor repair capacity seen in glioma cells is a trademark feature of cancer and is a determining factor in the growth of tumor cell populations. The gene signature was found to be highly enriched in the cell cycle and DNA damage repair functions; thus, we speculate that these genes play significant parts in cell cycle regulation and tumor development and progression. This suggests an explanation for the influence of FRGs on patient responses, although there may be other reasons also. These genes are thus relevant for the diagnosis and treatment of cancer.
The treatment of malignant brain cancers is challenging. This is especially true of late-stage glioma which is resistant to most traditional types of therapy (65). Recently, an association between ferroptosis-related signatures and drug screening was found in liver cancer (66) and the potential of enhancing treatment efficacy by inducing ferroptosis has attracted attention. Although studies on glioma have focused on the use of ferroptosis to predict prognosis, none have investigated potential drugs (9, 36, 37). Here, we used GDSC1, GDSC2, iLINCS, and CLUE to identify molecules that might reverse the tumor signature, observing that patients with high FRG scores may benefit more from treatment with an RTK pathway inhibitor, either by direct inhibition of the RTK or indirect inhibition by targeting downstream effectors such as the PI3K or MAPK pathways (Figure 9). For primary glioblastoma, bevacizumab (a humanized monoclonal antibody against VEGF-A to block angiogenesis) combined with Stupp is a currently widely used strategy which, although it prolongs the median progression-free survival, does not appear to influence the OS. Using the gene signature for screening patients before deciding on the treatment regimen may improve the efficacy of personalized treatment of glioma.
The study has several limitations. Firstly, ferroptosis-associated pathways are not well understood, and it is possible that the signature genes may function in other pathways as well, for example, in autophagic or immune pathways. Secondly, a major limitation is that we used a public database rather than our own samples; we intend to collect our own glioma samples to further verify the reliability of the research results. Finally, further basic and clinical research is required for verification of the signature application, which will be an important direction of our future research.
To summarize, we identified a seven-gene cancer-essential FRG signature for the prediction of glioma patient prognosis. The signature was found to have an excellent prognostic capability and was utilized for calculating risk scores and drug identification. The model thus has potential in both the diagnosis and management of glioma.
The original contributions presented in the study are included in the article/Supplementary Material. Further inquiries can be directed to the corresponding author.
DY and XYW designed the study and analyzed the data. WW, XR, XSW, and JSL collected the data. DY, XR, JF, and JBL drafted and revised the manuscript. XDR, HZ, LC, TL, CZ, and SY revised the images. DY, XYW, and XY revised the manuscript. All authors contributed to the article and approved the submitted version.
This work was supported by the grants from the National Natural Science Foundation of China (No.81872063), Beijing-Tianjin-Hebei Basic Research Cooperation Project (No. 19JCZDJC64200) and Guangxi Natural Science Foundation of China (2018JJA140739).
The authors declare that the research was conducted in the absence of any commercial or financial relationships that could be construed as a potential conflict of interest.
All claims expressed in this article are solely those of the authors and do not necessarily represent those of their affiliated organizations, or those of the publisher, the editors and the reviewers. Any product that may be evaluated in this article, or claim that may be made by its manufacturer, is not guaranteed or endorsed by the publisher.
We thank the team of TCGA, CGGA, GTEx, Depmap, FerrDb, CLUE, LINCS. We also thank Editideas (www.editideas.cn) for its linguistic assistance during the preparation of this manuscript and the R packages compilers.
The Supplementary Material for this article can be found online at: https://www.frontiersin.org/articles/10.3389/fonc.2022.897702/full#supplementary-material
1. Yuan J, Levitin HM, Frattini V, Bush EC, Boyett DM, Samanamud J, et al. Single-Cell Transcriptome Analysis of Lineage Diversity in High-Grade Glioma. Genome Med (2018) 10(1):57. doi: 10.1186/s13073-018-0567-9
2. Lee J, Hoxha E, Song HR. A Novel NFIA-NFkappaB Feed-Forward Loop Contributes to Glioblastoma Cell Survival. Neuro Oncol (2017) 19(4):524–34. doi: 10.1093/neuonc/now233
3. Falk Delgado A, De Luca F, van Westen D, Falk Delgado A. Arterial Spin Labeling MR Imaging for Differentiation Between High- and Low-Grade Glioma-a Meta-Analysis. Neuro Oncol (2018) 20(11):1450–61. doi: 10.1093/neuonc/noy095
4. Qu S, Liu S, Qiu W, Liu J, Wang H. Screening of Autophagy Genes as Prognostic Indicators for Glioma Patients. Am J Transl Res (2020) 12(9):5320–31.
5. Kieran MW, Goumnerova L, Manley P, Chi SN, Marcus KJ, Manzanera AG, et al. Phase I Study of Gene-Mediated Cytotoxic Immunotherapy With AdV-Tk as Adjuvant to Surgery and Radiation for Pediatric Malignant Glioma and Recurrent Ependymoma. Neuro Oncol (2019) 21(4):537–46. doi: 10.1093/neuonc/noy202
6. Yu L, Gui S, Liu Y, Qiu X, Qiu B, Zhang X, et al. Long Intergenic non-Protein Coding RNA 00475 Silencing Acts as a Tumor Suppressor in Glioma Under Hypoxic Condition by Impairing microRNA-449b-5p-Dependent AGAP2 Up-Regulation. Ther Adv Med Oncol (2020) 12:1758835920940936. doi: 10.1177/1758835920940936
7. Xu L, Liu H, Yu J, Wang Z, Zhu Q, Li Z, et al. Methylation-Induced Silencing of Maspin Contributes to the Proliferation of Human Glioma Cells. Oncol Rep (2016) 36(1):57–64. doi: 10.3892/or.2016.4783
8. Qin EY, Cooper DD, Abbott KL, Lennon J, Nagaraja S, Mackay A, et al. Neural Precursor-Derived Pleiotrophin Mediates Subventricular Zone Invasion by Glioma. Cell (2017) 170(5):845–59.e19. doi: 10.1016/j.cell.2017.07.016
9. Chen Z, Wu T, Yan Z, Zhang M. Identification and Validaion of an 11-Ferroptosis Related Gene Signature and Its Correlation With Immune Checkpoint Molecules in Glioma. Front Cell Dev Biol (2021) 9:652599. doi: 10.3389/fcell.2021.652599
10. Stoecklein VM, Stoecklein S, Galie F, Ren J, Schmutzer M, Unterrainer M, et al. Resting-State fMRI Detects Alterations in Whole Brain Connectivity Related to Tumor Biology in Glioma Patients. Neuro Oncol (2020) 22(9):1388–98. doi: 10.1093/neuonc/noaa044
11. Tateishi K, Nakamura T, Juratli TA, Williams EA, Matsushita Y, Miyake S, et al. PI3K/AKT/mTOR Pathway Alterations Promote Malignant Progression and Xenograft Formation in Oligodendroglial Tumors. Clin Cancer Res (2019) 25(14):4375–87. doi: 10.1158/1078-0432.CCR-18-4144
12. Wang L, Babikir H, Muller S, Yagnik G, Shamardani K, Catalan F, et al. The Phenotypes of Proliferating Glioblastoma Cells Reside on a Single Axis of Variation. Cancer Discov (2019) 9(12):1708–19. doi: 10.1158/2159-8290.CD-19-0329
13. Dixon SJ, Lemberg KM, Lamprecht MR, Skouta R, Zaitsev EM, Gleason CE, et al. Ferroptosis: An Iron-Dependent Form of Nonapoptotic Cell Death. Cell (2012) 149(5):1060–72. doi: 10.1016/j.cell.2012.03.042
14. Grignano E, Birsen R, Chapuis N, Bouscary D. From Iron Chelation to Overload as a Therapeutic Strategy to Induce Ferroptosis in Leukemic Cells. Front Oncol (2020) 10:586530. doi: 10.3389/fonc.2020.586530
15. Asakawa A, Kawade G, Kurata M, Fukuda S, Onishi I, Kinowaki Y, et al. Stratification of Lung Squamous Cell Carcinoma Based on Ferroptosis Regulators: Potential for New Therapeutic Strategies Involving Ferroptosis Induction. Lung Cancer (2022) 165:82–90. doi: 10.1016/j.lungcan.2022.01.012
16. Chen J, Li X, Ge C, Min J, Wang F. The Multifaceted Role of Ferroptosis in Liver Disease. Cell Death Differ (2022) 29(3):467–80. doi: 10.1038/s41418-022-00941-0
17. Cui W, Zhang J, Wu D, Zhang J, Zhou H, Rong Y, et al. Ponicidin Suppresses Pancreatic Cancer Growth by Inducing Ferroptosis: Insight Gained by Mass Spectrometry-Based Metabolomics. Phytomedicine (2022) 98:153943. doi: 10.1016/j.phymed.2022.153943
18. Zhao R, Lv Y, Feng T, Zhang R, Ge L, Pan J, et al. ATF6alpha Promotes Prostate Cancer Progression by Enhancing PLA2G4A-Mediated Arachidonic Acid Metabolism and Protecting Tumor Cells Against Ferroptosis. Prostate (2022) 82(5):617–29. doi: 10.1002/pros.24308
19. Zhou A, Fang T, Chen K, Xu Y, Chen Z, Ning X. Biomimetic Activator of Sonodynamic Ferroptosis Amplifies Inherent Peroxidation for Improving the Treatment of Breast Cancer. Small (2022) 18(12):e2106568. doi: 10.1002/smll.202106568
20. Yee PP, Wei Y, Kim SY, Lu T, Chih SY, Lawson C, et al. Neutrophil-Induced Ferroptosis Promotes Tumor Necrosis in Glioblastoma Progression. Nat Commun (2020) 11(1):5424. doi: 10.1038/s41467-020-19193-y
21. Zhou N, Bao J. FerrDb: A Manually Curated Resource for Regulators and Markers of Ferroptosis and Ferroptosis-Disease Associations. Database (Oxford) (2020) 2020:1–8. doi: 10.1093/database/baaa021
22. Meyers RM, Bryan JG, McFarland JM, Weir BA, Sizemore AE, Xu H, et al. Computational Correction of Copy Number Effect Improves Specificity of CRISPR-Cas9 Essentiality Screens in Cancer Cells. Nat Genet (2017) 49(12):1779–84. doi: 10.1038/ng.3984
23. Friedman J, Hastie T, Tibshirani R. Regularization Paths for Generalized Linear Models via Coordinate Descent. J Stat Software (2010) 33(1):1–22. doi: 10.18637/jss.v033.i01
24. Heagerty PJ, Lumley T, Pepe MS. Time-Dependent ROC Curves for Censored Survival Data and a Diagnostic Marker. Biometrics (2000) 56(2):337–44. doi: 10.1111/j.0006-341x.2000.00337.x
25. Ceccarelli M, Barthel FP, Malta TM, Sabedot TS, Salama SR, Murray BA, et al. Molecular Profiling Reveals Biologically Discrete Subsets and Pathways of Progression in Diffuse Glioma. Cell (2016) 164(3):550–63. doi: 10.1016/j.cell.2015.12.028
26. Mayakonda A, Lin DC, Assenov Y, Plass C, Koeffler HP. Maftools: Efficient and Comprehensive Analysis of Somatic Variants in Cancer. Genome Res (2018) 28(11):1747–56. doi: 10.1101/gr.239244.118
27. Li T, Fu J, Zeng Z, Cohen D, Li J, Chen Q, et al. TIMER2.0 for Analysis of Tumor-Infiltrating Immune Cells. Nucleic Acids Res (2020) 48(W1):W509–14. doi: 10.1093/nar/gkaa407
28. Gu Z, Eils R, Schlesner M. Complex Heatmaps Reveal Patterns and Correlations in Multidimensional Genomic Data. Bioinformatics (2016) 32(18):2847–9. doi: 10.1093/bioinformatics/btw313
29. Love MI, Huber W, Anders S. Moderated Estimation of Fold Change and Dispersion for RNA-Seq Data With Deseq2. Genome Biol (2014) 15(12):550. doi: 10.1186/s13059-014-0550-8
30. Wu T, Hu E, Xu S, Chen M, Guo P, Dai Z, et al. Clusterprofiler 4.0: A Universal Enrichment Tool for Interpreting Omics Data. Innovation (NY) (2021) 2(3):100141. doi: 10.1016/j.xinn.2021.100141
31. Iasonos A, Schrag D, Raj GV, Panageas KS. How to Build and Interpret a Nomogram for Cancer Prognosis. J Clin Oncol (2008) 26(8):1364–70. doi: 10.1200/JCO.2007.12.9791
32. Zhou R, Zeng D, Zhang J, Sun H, Wu J, Li N, et al. A Robust Panel Based on Tumour Microenvironment Genes for Prognostic Prediction and Tailoring Therapies in Stage I-III Colon Cancer. EBioMedicine (2019) 42:420–30. doi: 10.1016/j.ebiom.2019.03.043
33. Liu J, Lichtenberg T, Hoadley KA, Poisson LM, Lazar AJ, Cherniack AD, et al. An Integrated TCGA Pan-Cancer Clinical Data Resource to Drive High-Quality Survival Outcome Analytics. Cell (2018) 173(2):400–16.e11. doi: 10.1016/j.cell.2018.02.052
34. Yang W, Soares J, Greninger P, Edelman EJ, Lightfoot H, Forbes S, et al. Genomics of Drug Sensitivity in Cancer (GDSC): A Resource for Therapeutic Biomarker Discovery in Cancer Cells. Nucleic Acids Res (2013) 41(Database issue):D955–61. doi: 10.1093/nar/gks1111
35. Subramanian A, Narayan R, Corsello SM, Peck DD, Natoli TE, Lu X, et al. A Next Generation Connectivity Map: L1000 Platform and the First 1,000,000 Profiles. Cell (2017) 171(6):1437–52.e17. doi: 10.1016/j.cell.2017.10.049
36. Pilarczyk M, Kouril M, Shamsaei B, Vasiliauskas J, Niu W, Mahi N, et al. Connecting Omics Signatures of Diseases, Drugs, and Mechanisms of Actions With iLINCS. BioRxiv (2019), 826271. doi: 10.1101/826271
37. Dahlmanns M, Yakubov E, Dahlmanns JK. Genetic Profiles of Ferroptosis in Malignant Brain Tumors and Off-Target Effects of Ferroptosis Induction. Front Oncol (2021) 11:783067. doi: 10.3389/fonc.2021.783067
38. Wan RJ, Peng W, Xia QX, Zhou HH, Mao XY. Ferroptosis-Related Gene Signature Predicts Prognosis and Immunotherapy in Glioma. CNS Neurosci Ther (2021) 27(8):973–86. doi: 10.1111/cns.13654
39. Zhuo S, Chen Z, Yang Y, Zhang J, Tang J, Yang K. Clinical and Biological Significances of a Ferroptosis-Related Gene Signature in Glioma. Front Oncol (2020) 10:590861. doi: 10.3389/fonc.2020.590861
40. Sun W, Yan J, Ma H, Wu J, Zhang Y. Autophagy-Dependent Ferroptosis-Related Signature is Closely Associated With the Prognosis and Tumor Immune Escape of Patients With Glioma. Int J Gen Med (2022) 15:253–70. doi: 10.2147/IJGM.S343046
41. Zhou L, Jiang Z, Shi Z, Zhao W, Lu Z, Xie Y, et al. New Autophagy-Ferroptosis Gene Signature Predicts Survival in Glioma. Front Cell Dev Biol (2021) 9:739097. doi: 10.3389/fcell.2021.739097
42. Tong WH, Rouault T. Distinct Iron-Sulfur Cluster Assembly Complexes Exist in the Cytosol and Mitochondria of Human Cells. EMBO J (2000) 19(21):5692–700. doi: 10.1093/emboj/19.21.5692
43. He H, Liu J, Li W, Yao X, Ren Q, Shen B, et al. MiR-210-3p Inhibits Proliferation and Migration of C6 Cells by Targeting Iscu. Neurochem Res (2020) 45(8):1813–24. doi: 10.1007/s11064-020-03043-w
44. Alvarez SW, Sviderskiy VO, Terzi EM, Papagiannakopoulos T, Moreira AL, Adams S, et al. NFS1 Undergoes Positive Selection in Lung Tumours and Protects Cells From Ferroptosis. Nature (2017) 551(7682):639–43. doi: 10.1038/nature24637
45. Cuevas EP, Eraso P, Mazon MJ, Santos V, Moreno-Bueno G, Cano A, et al. LOXL2 Drives Epithelial-Mesenchymal Transition via Activation of IRE1-XBP1 Signalling Pathway. Sci Rep (2017) 7:44988. doi: 10.1038/srep44988
46. Gebremariam T, Liu M, Luo G, Bruno V, Phan QT, Waring AJ, et al. CotH3 Mediates Fungal Invasion of Host Cells During Mucormycosis. J Clin Invest (2014) 124(1):237–50. doi: 10.1172/JCI71349
47. Kang JM, Park S, Kim SJ, Kim H, Lee B, Kim J, et al. KIAA1324 Suppresses Gastric Cancer Progression by Inhibiting the Oncoprotein Grp78. Cancer Res (2015) 75(15):3087–97. doi: 10.1158/0008-5472.CAN-14-3751
48. Alqarihi A, Gebremariam T, Gu Y, Swidergall M, Alkhazraji S, Soliman SSM, et al. GRP78 and Integrins Play Different Roles in Host Cell Invasion During Mucormycosis. mBio (2020) 11(3):e01087–20. doi: 10.1128/mBio.01087-20
49. Gebremariam T, Lin L, Liu M, Kontoyiannis DP, French S, Edwards JE Jr., et al. Bicarbonate Correction of Ketoacidosis Alters Host-Pathogen Interactions and Alleviates Mucormycosis. J Clin Invest (2016) 126(6):2280–94. doi: 10.1172/JCI82744
50. Liu M, Spellberg B, Phan QT, Fu Y, Fu Y, Lee AS, et al. The Endothelial Cell Receptor GRP78 Is Required for Mucormycosis Pathogenesis in Diabetic Mice. J Clin Invest (2010) 120(6):1914–24. doi: 10.1172/JCI42164
51. Huang KC, Chiang SF, Yang PC, Ke TW, Chen TW, Lin CY, et al. ATAD3A Stabilizes GRP78 to Suppress ER Stress for Acquired Chemoresistance in Colorectal Cancer. J Cell Physiol (2021) 236(9):6481–95. doi: 10.1002/jcp.30323
52. Hara K, Maruki Y, Long X, Yoshino K, Oshiro N, Hidayat S, et al. Raptor, a Binding Partner of Target of Rapamycin (TOR), Mediates TOR Action. Cell (2002) 110(2):177–89. doi: 10.1016/s0092-8674(02)00833-4
53. Kim DH, Sarbassov DD, Ali SM, King JE, Latek RR, Erdjument-Bromage H, et al. mTOR Interacts With Raptor to Form a Nutrient-Sensitive Complex That Signals to the Cell Growth Machinery. Cell (2002) 110(2):163–75. doi: 10.1016/s0092-8674(02)00808-5
54. Park IH, Bachmann R, Shirazi H, Chen J. Regulation of Ribosomal S6 Kinase 2 by Mammalian Target of Rapamycin. J Biol Chem (2002) 277(35):31423–9. doi: 10.1074/jbc.M204080200
55. Carvalhal S, Ribeiro SA, Arocena M, Kasciukovic T, Temme A, Koehler K, et al. The Nucleoporin ALADIN Regulates Aurora A Localization to Ensure Robust Mitotic Spindle Formation. Mol Biol Cell (2015) 26(19):3424–38. doi: 10.1091/mbc.E15-02-0113
56. Marumoto T, Hirota T, Morisaki T, Kunitoku N, Zhang D, Ichikawa Y, et al. Roles of Aurora-A Kinase in Mitotic Entry and G2 Checkpoint in Mammalian Cells. Genes Cells (2002) 7(11):1173–82. doi: 10.1046/j.1365-2443.2002.00592.x
57. Marumoto T, Honda S, Hara T, Nitta M, Hirota T, Kohmura E, et al. Aurora-A Kinase Maintains the Fidelity of Early and Late Mitotic Events in HeLa Cells. J Biol Chem (2003) 278(51):51786–95. doi: 10.1074/jbc.M306275200
58. Katayama H, Sasai K, Kawai H, Yuan ZM, Bondaruk J, Suzuki F, et al. Phosphorylation by Aurora Kinase A Induces Mdm2-Mediated Destabilization and Inhibition of P53. Nat Genet (2004) 36(1):55–62. doi: 10.1038/ng1279
59. Suina K, Tsuchihashi K, Yamasaki J, Kamenori S, Shintani S, Hirata Y, et al. Epidermal Growth Factor Receptor Promotes Glioma Progression by Regulating xCT and GluN2B-Containing N-Methyl-D-Aspartate-Sensitive Glutamate Receptor Signaling. Cancer Sci (2018) 109(12):3874–82. doi: 10.1111/cas.13826
60. Chen P, Hsu WH, Chang A, Tan Z, Lan Z, Zhou A, et al. Circadian Regulator CLOCK Recruits Immune-Suppressive Microglia Into the GBM Tumor Microenvironment. Cancer Discov (2020) 10(3):371–81. doi: 10.1158/2159-8290.CD-19-0400
61. Brown JM, Recht L, Strober S. The Promise of Targeting Macrophages in Cancer Therapy. Clin Cancer Res (2017) 23(13):3241–50. doi: 10.1158/1078-0432.CCR-16-3122
62. Liang J, Piao Y, Holmes L, Fuller GN, Henry V, Tiao N, et al. Neutrophils Promote the Malignant Glioma Phenotype Through S100A4. Clin Cancer Res (2014) 20(1):187–98. doi: 10.1158/1078-0432.CCR-13-1279
63. Yin W, Jiang X, Tan J, Xin Z, Zhou Q, Zhan C, et al. Development and Validation of a Tumor Mutation Burden-Related Immune Prognostic Model for Lower-Grade Glioma. Front Oncol (2020) 10:1409. doi: 10.3389/fonc.2020.01409
64. Richardson LG, Nieman LT, Stemmer-Rachamimov AO, Zheng XS, Stafford K, Nagashima H, et al. IDH-Mutant Gliomas Harbor Fewer Regulatory T Cells in Humans and Mice. Oncoimmunology (2020) 9(1):1806662. doi: 10.1080/2162402X.2020.1806662
65. Yuan J, Peng G, Xiao G, Yang Z, Huang J, Liu Q, et al. Xanthohumol Suppresses Glioblastoma via Modulation of Hexokinase 2 -Mediated Glycolysis. J Cancer (2020) 11(14):4047–58. doi: 10.7150/jca.33045
Keywords: glioma, ferroptosis, cancer essential genes, LASSO analysis, risk model, clinical outcomes, drug screening
Citation: Yun D, Wang X, Wang W, Ren X, Li J, Wang X, Liang J, Liu J, Fan J, Ren X, Zhang H, Shang G, Sun J, Chen L, Li T, Zhang C, Yu S and Yang X (2022) A Novel Prognostic Signature Based on Glioma Essential Ferroptosis-Related Genes Predicts Clinical Outcomes and Indicates Treatment in Glioma. Front. Oncol. 12:897702. doi: 10.3389/fonc.2022.897702
Received: 16 March 2022; Accepted: 05 May 2022;
Published: 10 June 2022.
Edited by:
Xu Chen, Guilin Medical University, ChinaReviewed by:
Jing Sun, Shanghai Jiao Tong University, ChinaCopyright © 2022 Yun, Wang, Wang, Ren, Li, Wang, Liang, Liu, Fan, Ren, Zhang, Shang, Sun, Chen, Li, Zhang, Yu and Yang. This is an open-access article distributed under the terms of the Creative Commons Attribution License (CC BY). The use, distribution or reproduction in other forums is permitted, provided the original author(s) and the copyright owner(s) are credited and that the original publication in this journal is cited, in accordance with accepted academic practice. No use, distribution or reproduction is permitted which does not comply with these terms.
*Correspondence: Xuejun Yang, eXhqYTAzNzI4QGJ0Y2guZWR1LmNu; eWRlbm55QDEyNi5jb20=
†These authors have contributed equally to this work
Disclaimer: All claims expressed in this article are solely those of the authors and do not necessarily represent those of their affiliated organizations, or those of the publisher, the editors and the reviewers. Any product that may be evaluated in this article or claim that may be made by its manufacturer is not guaranteed or endorsed by the publisher.
Research integrity at Frontiers
Learn more about the work of our research integrity team to safeguard the quality of each article we publish.