- Department of Radiation Oncology, The Netherlands Cancer Institute, Amsterdam, Netherlands
Purpose: Intravoxel incoherent motion (IVIM) is a promising technique that can acquire perfusion information without the use of contrast agent, contrary to the more established dynamic contrast-enhanced (DCE) technique. This is of interest for treatment response monitoring, where patients can be imaged on each treatment fraction. In this study, longitudinal correlations between IVIM- and DCE parameters were assessed in prostate cancer patients receiving radiation treatment.
Materials and Methods: 20 prostate cancer patients were treated on a 1.5 T MR-linac with 20 x 3 or 3.1 Gy. Weekly IVIM and DCE scans were acquired. Tumors, the peripheral zone (PZ), and the transition zone (TZ) were delineated on a T2-weighted scan acquired on the first fraction. IVIM and DCE scans were registered to this scan and the delineations were propagated. Median values from these delineations were used for further analysis. The IVIM parameters D, f, D* and the product fD* were calculated. The Tofts model was used to calculate the DCE parameters Ktrans, kep and ve. Pearson correlations were calculated for the IVIM and DCE parameters on values from the first fraction for each region of interest (ROI). For longitudinal analysis, the repeated measures correlation coefficient was used to determine correlations between IVIM and DCE parameters in each ROI.
Results: When averaging over patients, an increase during treatment in all IVIM and DCE parameters was observed in all ROIs, except for D in the PZ and TZ. No significant Pearson correlations were found between any pair of IVIM and DCE parameters measured on the first fraction. Significant but low longitudinal correlations were found for some combinations of IVIM and DCE parameters in the PZ and TZ, while no significant longitudinal correlations were found in the tumor. Notably in the TZ, for both f and fD*, significant longitudinal correlations with all DCE parameters were found.
Conclusions: The increase in IVIM- and DCE parameters when averaging over patients indicates a measurable response to radiation treatment with both techniques. Although low, significant longitudinal correlations were found which suggests that IVIM could potentially be used as an alternative to DCE for treatment response monitoring.
1 Introduction
Non-invasive perfusion imaging is of interest in oncology, as low perfusion is related to hypoxia which holds prognostic value (1–3). A common way to measure perfusion is by using dynamic contrast enhanced (DCE-) MRI (2, 4, 5). In addition to prognosis, DCE has been shown to have value for mid-treatment response assessment in cervix (6), esophageal (7), and head-and-neck cancer (8–10).
Acquiring quantitative MRI (qMRI) images during radiation treatment for the purpose of treatment response monitoring has become feasible with the introduction of MR-guided radiotherapy. Using MR-linacs, which consist of a linear accelerator integrated with an MRI system, qMRI sequences can be acquired on each treatment fraction, without the increase of patient burden (11–16).
Although DCE-MRI is a candidate for treatment response monitoring, acquiring a DCE scan during each treatment fraction is undesirable due to the use of contrast agent. Alternative techniques that can provide perfusion information without the use of contrast agent are needed. One such alternative is intravoxel incoherent motion (IVIM), which is an extension to diffusion weighted imaging (DWI) (17). IVIM parameters provide information about diffusion and perfusion. It is based on the concept that inside a voxel, signal from water flowing in the capillaries can be separated from diffusing water (18). In addition to the diffusion coefficient (D), the perfusion parameters f (perfusion fraction), D* (pseudo-diffusion coefficient), and the product fD* can be determined.
Previous studies have investigated correlations between IVIM and DCE-MRI parameters in different tumor sites, with conflicting results (19). These studies usually determine the correlation between IVIM and DCE parameters on a single time point. For treatment response purposes however, correlations between changes in parameters, induced by radiation treatment, are more relevant. A study performed in 21 liver tumor-bearing rabbits assessed the correlations between IVIM and DCE parameters longitudinally, while the rabbits were treated with a vascular disrupting agent (20). Interestingly, the authors did not find any significant correlations between IVIM and DCE parameters when assessing the imaging time points separately, but did find a significant longitudinal correlation. This longitudinal correlation is of importance for treatment response monitoring purposes and indicates that IVIM could be a potential substitute for DCE-MRI for this purpose.
In the current study, longitudinal correlations between IVIM- and DCE parameters are assessed in a cohort of prostate cancer patients that were imaged weekly during radiation treatment. Each week a DCE and an IVIM scan were acquired to enable longitudinal assessment. The aim of this study is to determine whether IVIM and DCE parameters correlate when measured longitudinally and whether there is potential for IVIM to substitute DCE for treatment response monitoring.
2 Materials and Methods
2.1 Patients
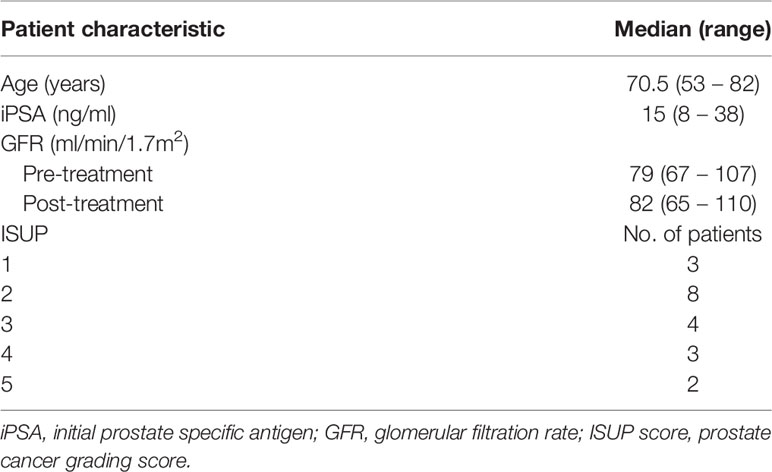
Twenty patients, with a median age of 70.5 (range 53 – 82) years with biopsy proven prostate cancer were included in this study. Only patients with an adequate renal function (glomerular filatration rate GFR > 60 ml/min/1.7m2) were included. Thirteen patients were treated with 20 x 3 Gy and due to a change in clinical practice, seven patients were treated with 20 x 3.1 Gy. Treatment took place over the course of five weeks. Patient characteristics are presented in Table 1. The study was approved by the local ethics committee and each patient gave written informed consent.
2.2 Image Acquisition
All patients were treated on a 1.5 T MR-linac (Unity, Elekta AB, Stockholm, Sweden). This is a hybrid system, where a linear accelerator is integrated with an MRI scanner to enable concurrent patient irradiation and MRI acquisition. The MRI system of the MR-linac is based on a 1.5 T Ingenia system (Philips Healthcare, Best, The Netherlands), with split gradient coils to create a window for the radiotherapy beam (21). The system uses an 8-channel radio-translucent phased array receive coil (22).
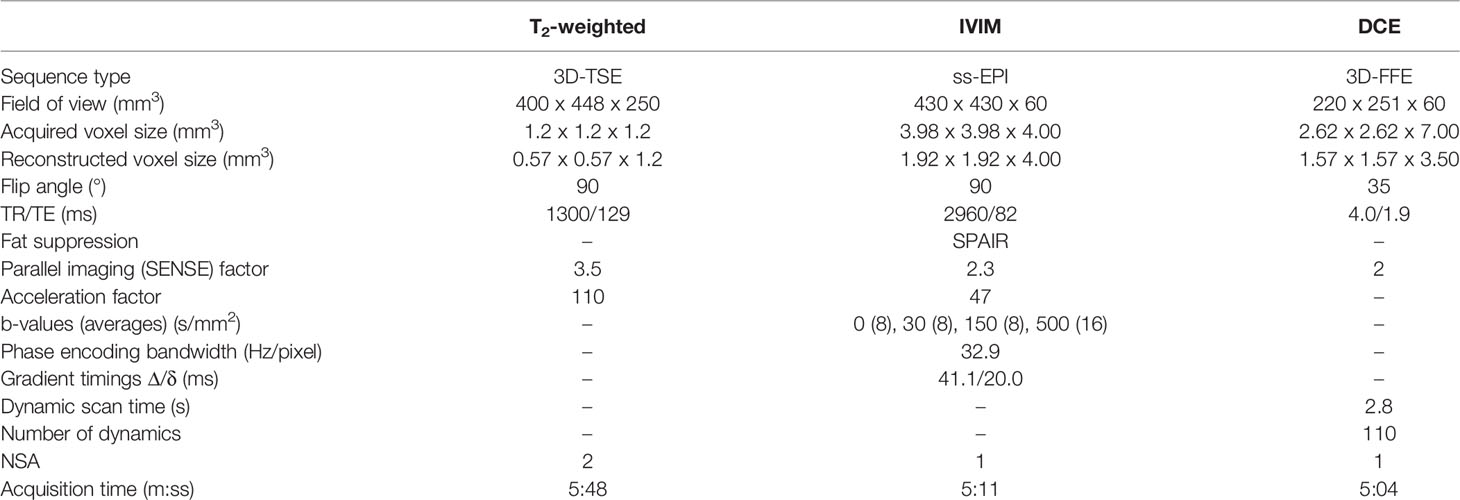
A T2-weighted anatomical scan, an IVIM scan and a DCE-MRI scan were acquired weekly over the course of five weeks, starting at the first day of treatment. Scan parameters can be found in Table 2. The IVIM sequence was optimized for the MR-linac system, which has lower gradient performance compared to diagnostic systems and lower SNR due to the simpler receive coil system (15, 23). To compensate this, the highest b-value was limited to 500 s/mm2, and a relatively large isotropic acquisition voxel size of 4 mm3 was used. To calculate contrast agent concentration values, the pre-contrast T1 was measured using the variable flip angle (VFA) method with a similar sequence as the DCE scan, but with a TR/TE of 20/4 ms and flip angles of 3, 6, 10, 20, and 30 ˚. For the DCE scan, during the fifth dynamic, 15 mmol gadoteric acid (Dotarem, Geurbet, France) was injected at a rate of 3 mL/s using a power injector followed by a 30 ml saline flush. While a study by Wang et al. demonstrated no significant effect of radiation on the chemical composition of Gadolinium based contrast agents (24), DCE scans were acquired after the radiation treatment, without repositioning of the patient to avoid interactions of the contrast agent with radiation.
2.3 Image Registration
Tumor, peripheral zone (PZ), and transition zone (TZ) were delineated on the T2-weighted scans of the first fraction. Of three patients, who received a trans-urethral resection of the prostate (TURP), the TURP cavity was delineated to be excluded from analysis. Tumors were delineated while consulting biopsy results and diagnostic images, following the PI-RADS V2.1 criteria (25).
The IVIM and DCE images were registered separately to the T2-weighted scan of the first fraction which contained the delineations using rigid registration allowing rotations and translations. For IVIM, the b = 0 s/mm2 image was used as this contains the most anatomical information. For DCE, the 100th dynamic was used as a scan with relatively high enhancement in the prostate signal. All registrations were checked visually and corrected manually when needed. After registration, the delineations were propagated to the IVIM and DCE scans, where only voxels that were fully inside the propagated delineation were included for further analysis.
IVIM scans were excluded when susceptibility artifacts were present inside any of the delineations, or when movement between b-values was present. DCE scans were excluded if patient movement occurred during the scan.
The volume of the structures was calculated by multiplying the number of voxels completely inside the delineation by the voxel size of the T2-weighted scan they were delineated on.
2.4 Image Processing
2.4.1 IVIM
The bi-exponential IVIM model, S(b) / S0 = fe –bD* + (1 - f) e -bD, was fitted using a segmented approach (26). Using the median signal intensity values from the delineations, the tissue diffusion coefficient (D) was determined first using the two highest b-values (150 and 500 s/mm2). Next the perfusion fraction (f) was calculated using this D and the b = 0 s/mm2 signal intensity. Both D and f were then used in combination with the signal intensities from the lowest two b-value images (0 and 30 s/mm2) to calculate the pseudo-diffusion coefficient D*. The parameter fD* was calculated by multiplying f with D*.
2.4.2 DCE
To extract an arterial input function (AIF), external iliac artery was delineated on all DCE scans of all patients. Due to slight variations in the B1 field (see Supplementary Figure 1), only the left external iliac artery was used. Signal intensities were converted to concentration time curves using the spoiled gradient echo equation following Schabel and Parker (27) assuming a T1 value of 1429 ms for blood at 1.5 T (28) and a contrast agent relaxivity of 3.6 L mM-1 s-1 (29). Following Georgiou et al. the maximum relative change in concentration during the DCE scan was determined for all voxels inside this delineation (30). The voxels between the 50th and 95th percentile of this relative change were averaged to obtain an AIF for each treatment fraction. Per patient, the median AIF of all five measurements, based on peak height, was used for all tracer kinetic modeling for that patient. Supplementary Figure 2 shows all AIFs of all patients.
A voxel-wise T1-map was calculated from the VFA series using a linear implementation (31). The T1 map was used to convert signal intensity to concentration values using the method of Schabel and Parker (27). The bolus arrival time was estimated for each voxel using an automated method (32). The volume transfer constant (Ktrans) and the rate constant (kep) from the standard Tofts model (33) were calculated on a voxel-basis following the approach developed by Murase (34) using and median AIF as input. The extracellular extravascular space volume fraction (ve) was then calculated on a voxel basis using (Ktrans/kep).
2.5 Statistics
Baseline values from the IVIM and DCE parameters were taken from the scans of the first fraction. To check for differences in parameters between ROIs, a one-way analysis of variance (ANOVA) was performed for each parameter, with ROI as the independent variable. ANOVA results are presented with their F-statistic including within- and between group degrees of freedom, and p-value. Pearson correlation coefficients were calculated between IVIM and DCE parameters of the first fraction for each ROI.
To determine longitudinal correlations between the IVIM and DCE parameters, the rmcorr package in R was used (35). The rmcorr package provides a repeated measures correlation (rrm), which takes into account the non-independence of repeated measures. To do so, the relationship between two continuous variables (in this case the IVIM and DCE parameters) is determined while controlling for between-patient variance. Specifically, separate parallel lines are fitted to the data of each patient using a common slope but allowing the intercept to vary per patient (35). The rrm is then calculated from the sum of squares values for the measure and the error as follows:
The sign of rrm is taken from the sign of the common slope. The degrees of freedom are calculated using N(k-1)-1, where k is the (average) number of repeated measures per participant and N is the total number of participants (35).
As IVIM and DCE measure different biological properties which are both related to perfusion, it is possible that their correlation depends on the particular tissue measured. Therefore, rrm was calculated separately for each ROI. It can be interpreted as the intra-patient correlation between IVIM and DCE parameters during radiation treatment for a given ROI. Repeated measures correlation results are presented as rrm(error degrees of freedom), p-value, and a 95% confidence interval calculated using bootstrapping with 10.000 resamples. Statistical significance was assumed for all tests when p < 0.05.
3 Results
Imaging data was acquired on five fractions for 19/20 patients and one patient was imaged four times. This resulted in a total of 99 fractions with IVIM and DCE scans. Two DCE scans were excluded due to movement during acquisition, both from the same patient. Seven IVIM scans were excluded due to susceptibility artifacts causing deformations within the delineations and two IVIM scans were excluded because the patient moved between the acquisition of images with a different b-value, leaving 97 DCE acquisitions and 90 IVIM acquisitions for further analysis.
In two of the patients, no tumor was visible on the diagnostic scans and therefore not delineated. Of one patient with a TURP all remaining tissue was treated as tumor. The median (range) volume of the ROIs were 0.9 (0.1 – 14) cm3 for the tumor, 8.9 (5.0 – 26) cm3 for the PZ, and 20 (7.2 – 66) cm3 for the TZ. An example of the delineations in two different patients is shown in Figure 1.
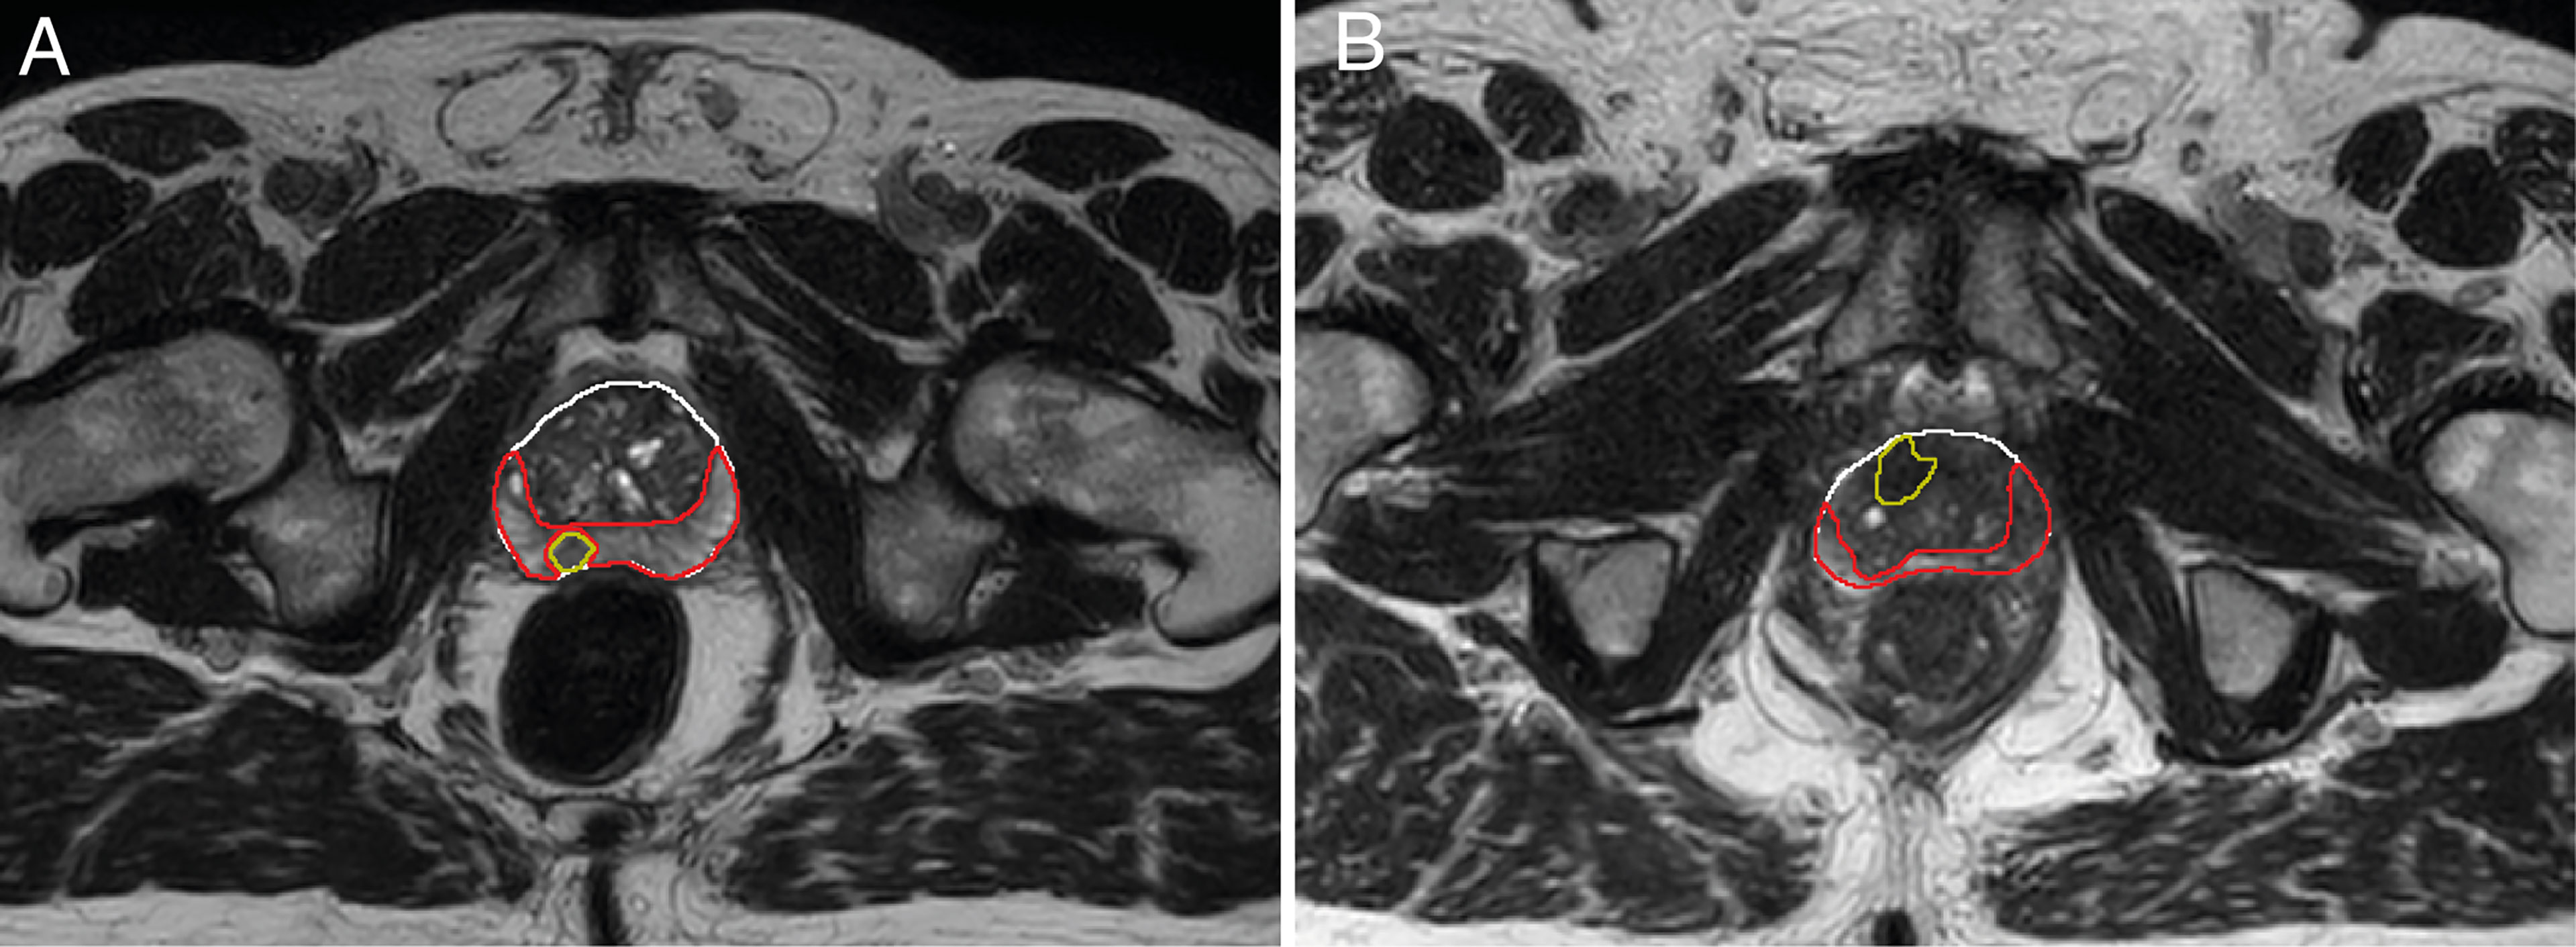
Figure 1 Example of delineations of the different prostate zones of two different patients (A, B). Delineations were made on T2-weighted scans from the first treatment fraction. The entire prostate is shown in white, the peripheral zone (PZ) in red, and the tumor in yellow. The transition zone (TZ) was extracted in post processing by subtracting the PZ from the prostate delineation. Tumor voxels were excluded from all other zones during analysis.
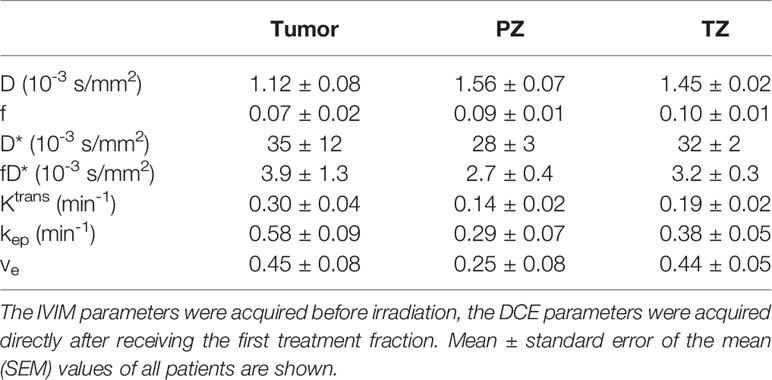
Baseline mean values with the standard error of the mean (SEM) are presented in Table 3. These are based on the IVIM scans acquired before the patients received any radiation and the DCE scans acquired directly after a single dose of 3 or 3.1 Gy. One-way ANOVA revealed a statistically significant difference between the tumor, PZ, and TZ for D (F2,44 = 15, p < 0.001), Ktrans (F2,53 = 4.3, p = 0.02) and ve (F2,53 = 3.9, p = 0.03). No statistically significant correlations were found between IVIM and DCE parameters when using values from the first fraction only.
Figure 2 shows the average time trends over all patients of the IVIM and DCE parameters. All IVIM and DCE parameters increase in all ROIs over the weeks, except for D in the PZ and TZ. The IVIM perfusion parameters increase steadily over the weeks. The DCE parameters steeply increase from the first to the second week and stabilize or slightly increase after that.
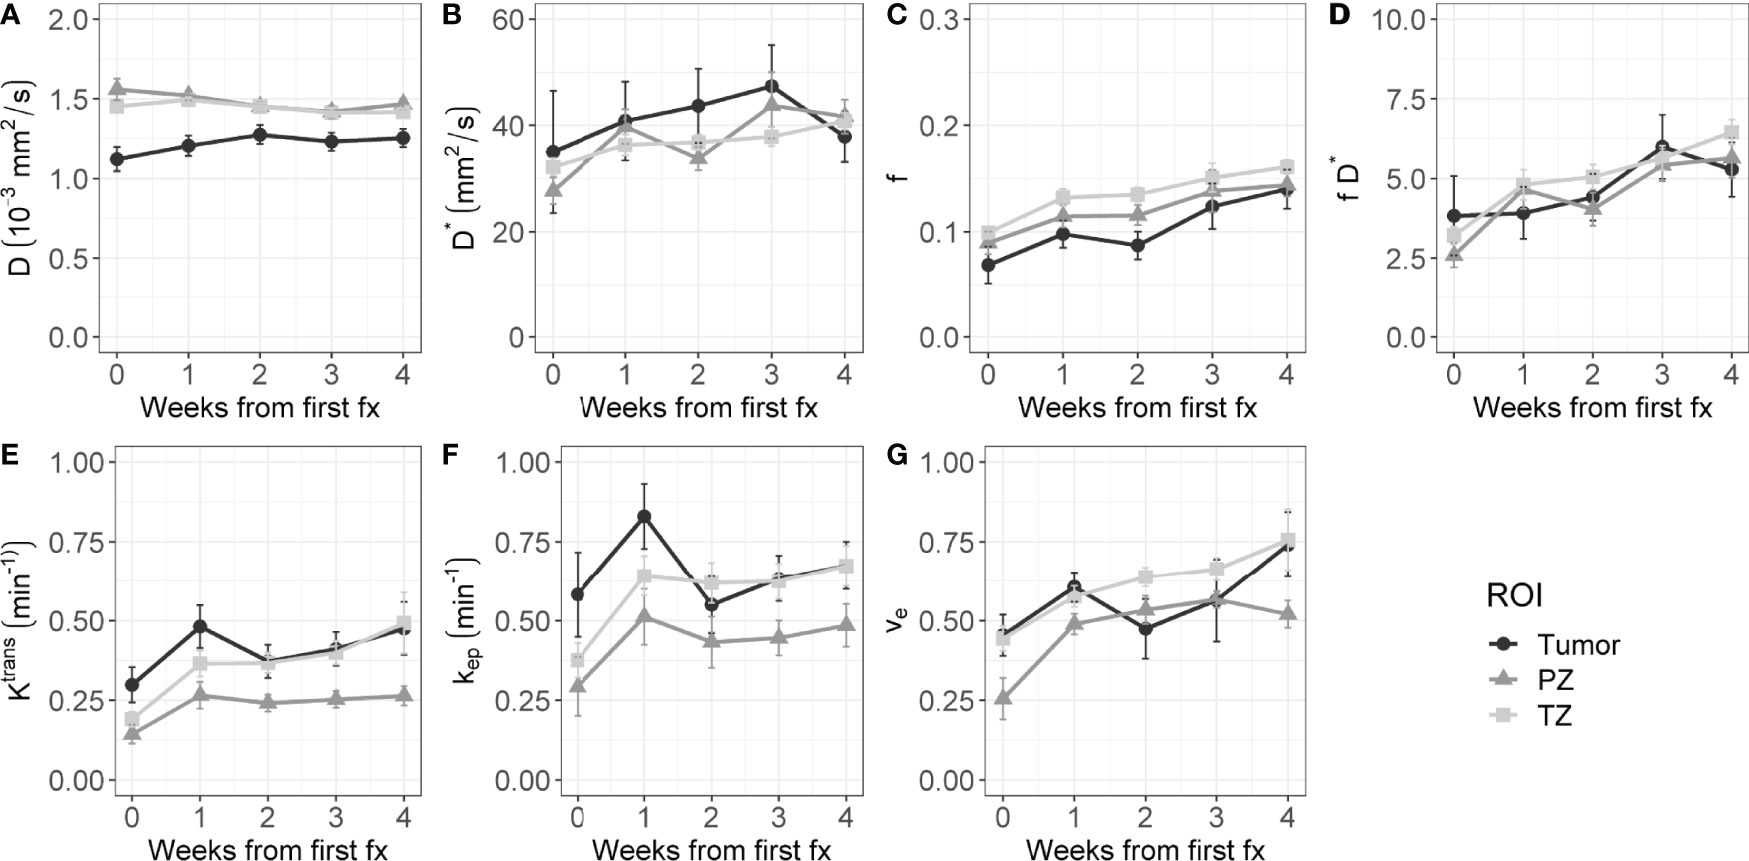
Figure 2 Evolution of intravoxel incoherent motion (IVIM, A–D) and dynamic contrast-enhanced (DCE, E–G) parameters during radiation treatment. The average value of all patients is shown for the tumor, PZ, and TZ. Error bars indicate the standard error of the mean (SEM).
The rrm calculated on the longitudinal data are presented in Table 4. No statistically significant correlations were found between any IVIM and DCE parameter in the tumor. In the PZ, statistically significant correlations were found only between D and ve and between f and ve. In the TZ, statistically significant correlations were found between f and Ktrans, f and kep, and f and ve. D* correlated significantly only with kep, while the product fD* did so with all DCE parameters. Graphs showing the common slope and the slope per patient of the significant within-subject longitudinal correlations are presented in Figure 3 for D, Figure 4 for f, Figure 5 for D*, and Figure 6 for fD*.
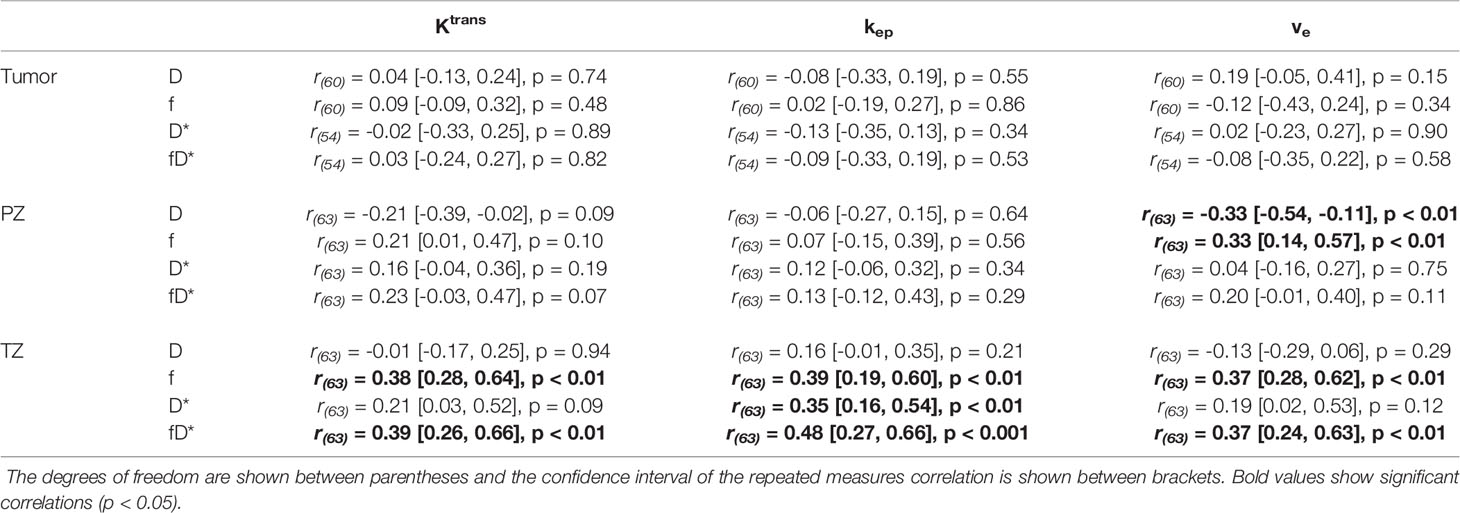
Table 4 Repeated measures correlations between IVIM and DCE parameters, separately presented for each ROI.
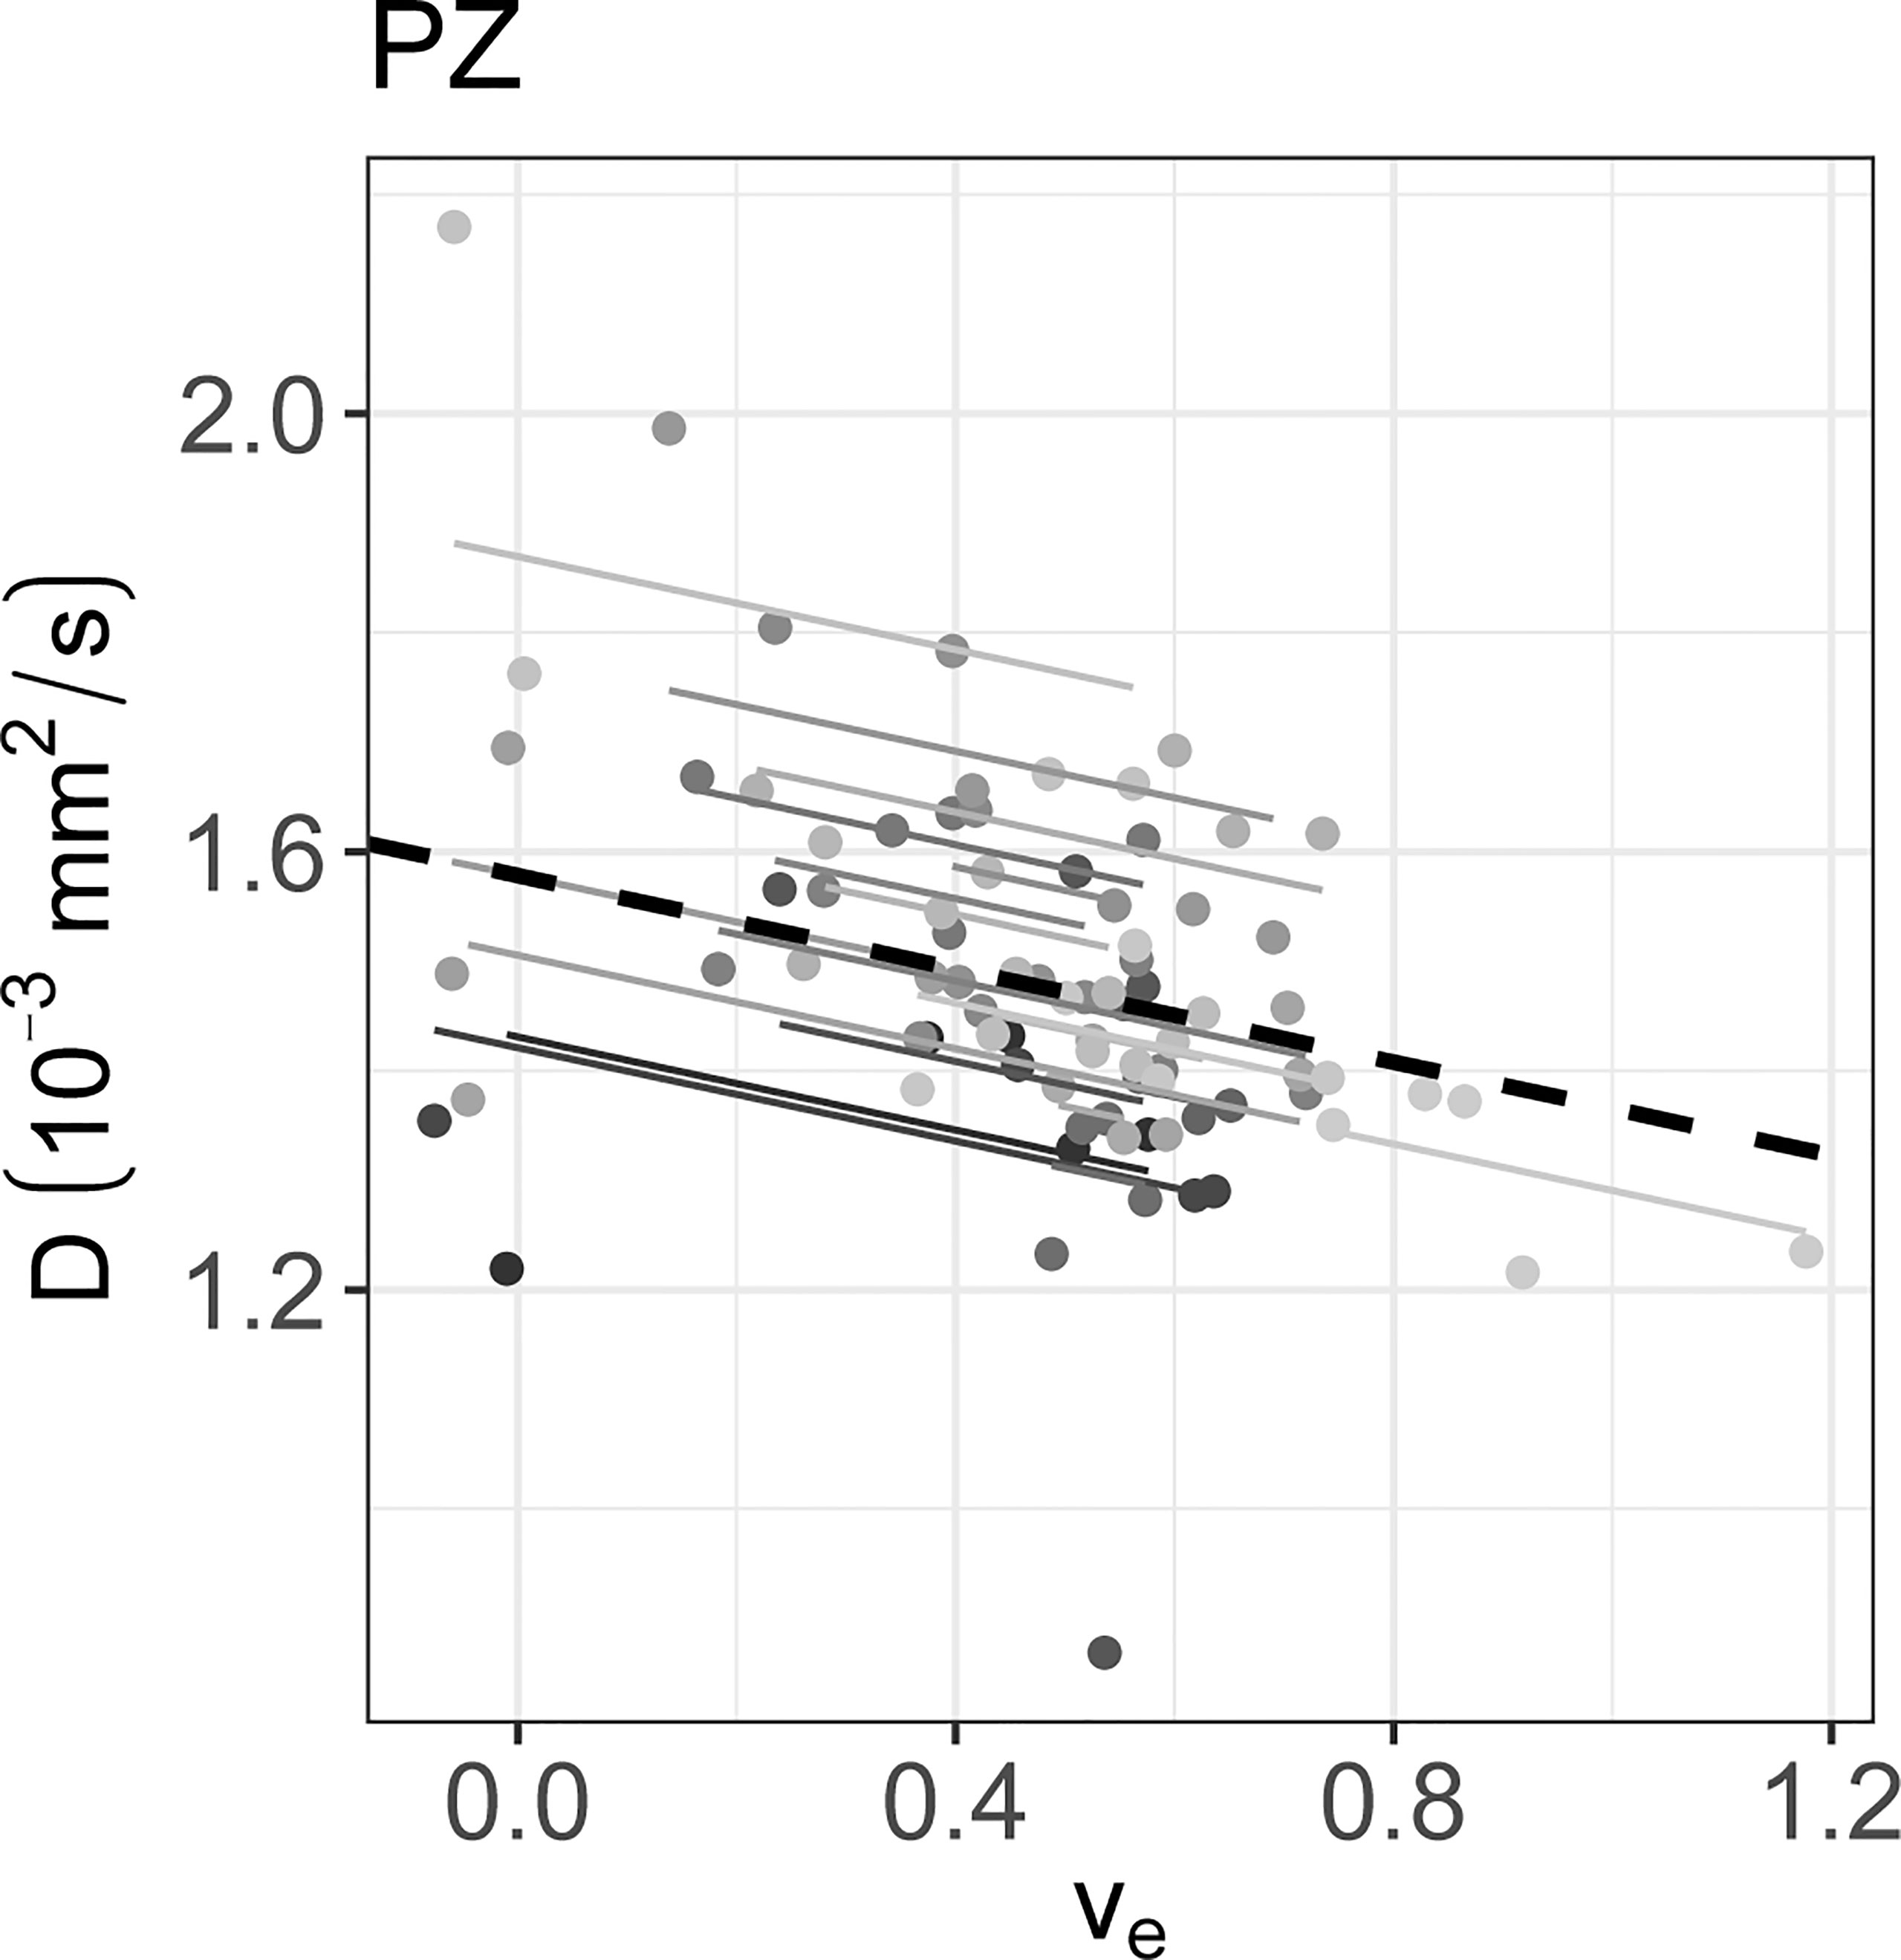
Figure 3 The significant repeated measures correlation of D with the DCE parameters are shown. D only correlated significantly with ve in the PZ. Each line shows the fit for a single patient and the dashed black line shows the overall common slope.
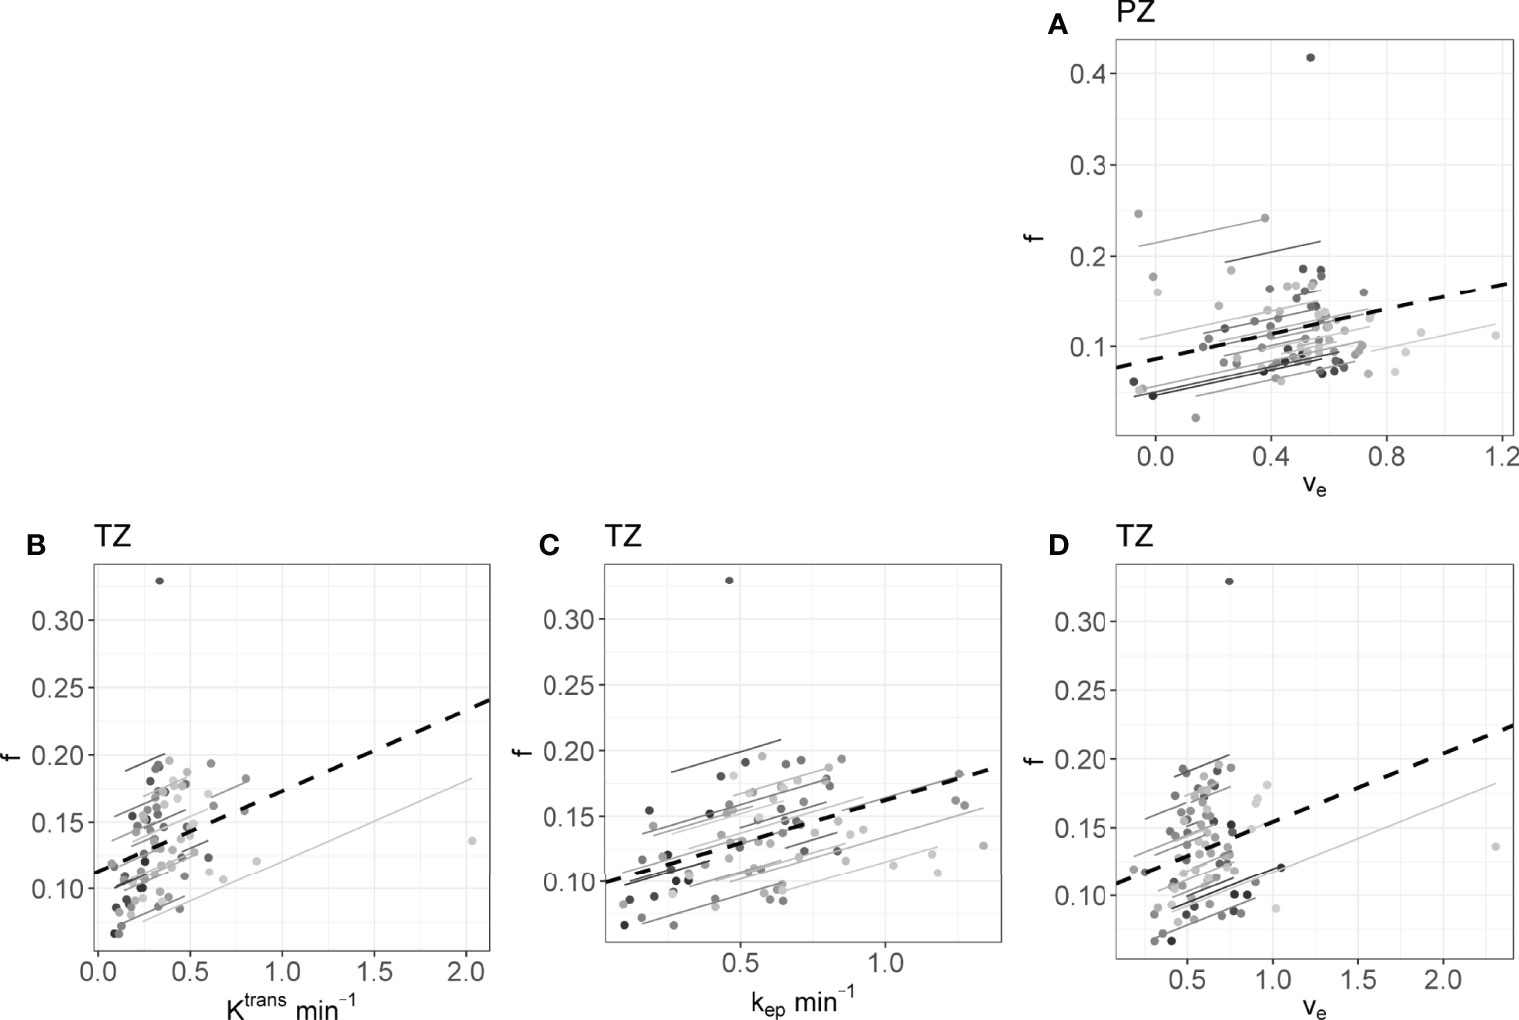
Figure 4 The significant repeated measures correlations of f with the DCE parameters are shown. (A) is the correlation between f and ve in the PZ, (B–D) are values from the TZ. Each line shows the fit for a single patient and the dashed black line shows the overall common slope.
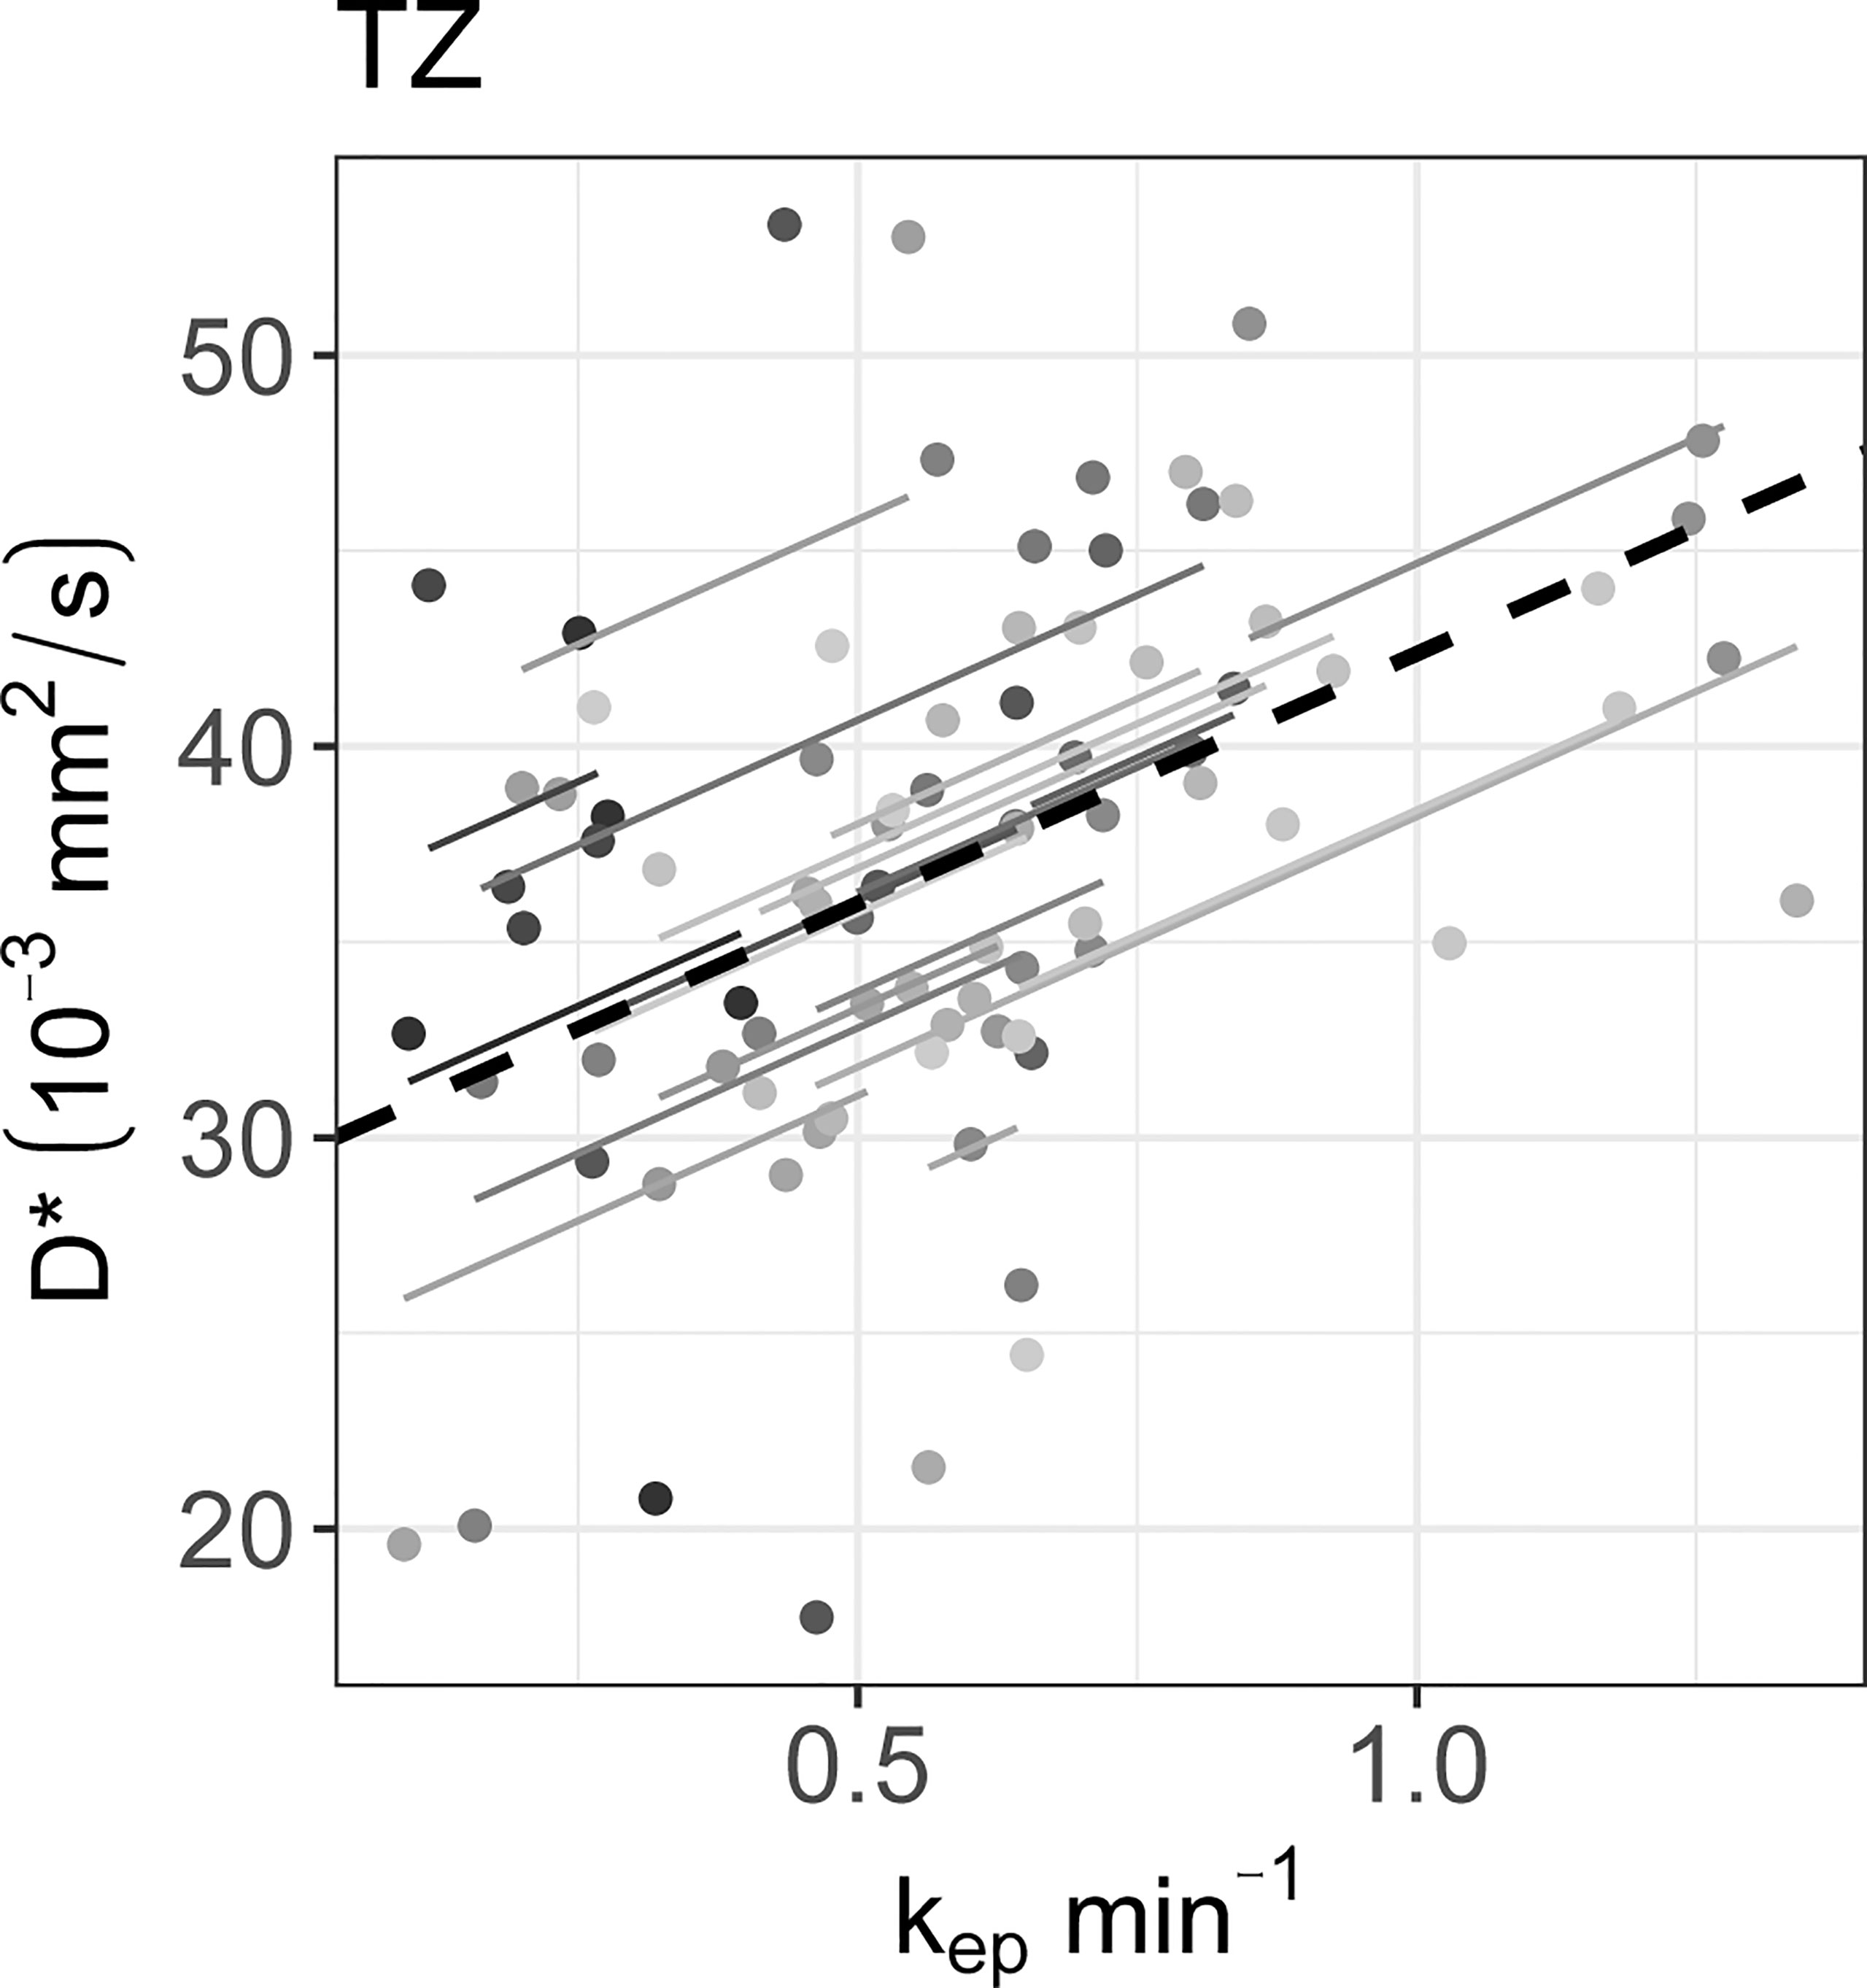
Figure 5 The significant repeated measures correlations of D* with the DCE parameters are shown. D* only correlated significantly with kep in the TZ. Each line shows the fit for a single patient and the dashed black line shows the overall common slope.

Figure 6 The significant repeated measures correlation of fD* with the DCE parameters are shown. fD* only correlated significantly with DCE parameters in the (A–C) TZ. Each line shows the fit for a single patient and the dashed black line shows the overall common slope.
4 Discussion
In this study, the longitudinal correlations between IVIM and DCE parameters in different ROIs of prostate cancer patients were assessed during radiation treatment. Weekly IVIM and DCE scans were performed and resulting correlations were tested taking into account the non-independence of repeated measurements on the same patients.
Baseline f and D* values of the IVIM parameters corresponded to values found in the literature, although the reported range is large. The baseline tumor D values found in this study (1.12 ± 0.08 10-3 mm2/s) were higher than previously found (reported range: 0.13 – 1.06 10-3 mm2/s) (36). Baseline Ktrans and ve values were consistent with those found in the literature, while the kep values were relatively low (37).
When averaging over patients, an increase in all perfusion parameters over the course of radiation treatment can be seen. In the DCE parameter values, this increase was the largest between week 0 and week 1, after which the values seemed to stabilize. This trend is also visible in the IVIM parameters D* and fD*. The similar behavior on the group level suggests that there is an overall biological response to radiation that can be measured similarly with both techniques. Previous results comparing DCE parameters before treatment to values acquired at a minimum of two years after treatment showed a decrease in Ktrans and kep in the PZ and TZ (38). Taken together with the current results, this could indicate that perfusion is increased during treatment, followed by a decline longer after treatment. The discrepancy between short-term and long-term differences highlights the importance of determining the optimal measurement time for treatment response purposes.
A possible explanation for the early increase of the perfusion parameters in all prostate zones could be an inflammatory response to the radiation treatment in the entire prostate, similar to what was found previously in cervix patients (6). Such an overall response could limit the predictive value of early perfusion for treatment response in prostate cancer patients as it could obscure more subtle changes related to outcome. To investigate this, early changes in perfusion parameters should be related to clinical outcome data. However, these data were not available yet for the current study population.
Although comparison with histology has shown that IVIM parameters provide perfusion information, the specific interpretation of IVIM parameters and their relation to DCE parameters remains unclear (19, 39). Correlations between IVIM and DCE parameters should be carefully interpreted based on the context. When the goal is to assess the ability of both techniques to differentiate between tumor and benign tissue, as done in Pang et al. for prostate cancer (40), it is appropriate to use values from both ROIs combined to determine the correlation. In that case, the correlation reflects how differences between ROIs in IVIM parameters correlate with differences between ROIs in DCE parameters. A ROI effect is clearly visible in the scatterplots presented by Pang et al. (40). However, when investigating longitudinal data, we are interested in the correlation of changes within the ROIs over time. This within-ROI correlation could be different for different ROIs, and theoretically even have an opposite sign compared to the between-ROI correlation. This effect is known as Simpsons paradox (41).
In the current study, the focus is on treatment response monitoring. To measure the longitudinal correlations the rrm was used on data from each ROI separately. The rrm can in this case be interpreted for each ROI as the intra-patient correlation between IVIM and DCE parameters while measuring during treatment, indicating the degree to which both parameters reflect the same time trends induced by irradiation.
No significant correlations were found in the tumors. A reason for this could be a low precision of the IVIM and DCE parameters as acquired in the current study. Median values were calculated per ROI, and the variance of these median values scale with 1/n, where n is the number of voxels. As prostate tumors are relatively small, the variance of the median values is relatively high. We showed previously that the test-retest repeatability coefficient of IVIM parameters in prostate tumors is high for the current imaging sequence and analysis: 0.44 10-3 mm2/s, 0.16 and 76.4 mm2/s for D, f, and D* (15). Additionally, DCE parameters are known to have poor repeatability (42–44). Within-patient coefficients of variation reported previously in prostate tumors measured on a 1.5 T system were around 20% for Ktrans, 15% for ve and 30% for kep (45). Poor repeatability in both IVIM and DCE parameters can attenuate the correlation coefficients (46). In the TZ, which is the ROI with the largest volume, significant positive correlations were found, although all were low (< 0.5).
In order to test the correlations between IVIM and DCE parameters in different ROIs, 36 statistical tests were performed with a significance threshold of α = 0.05. This means that the chance of finding at least one false positive result is 84%, because multiple testing inflates the type 1 error rate. However, since this is the first study to test the longitudinal correlation between IVIM and DCE parameters in humans undergoing radiation treatment, type I error rate is less of a concern. These correlations can be used as a direction for future studies.
In conclusion, when assessing changes in group averages over time, a clear increase in IVIM perfusion parameters was found. This increase was also present in all DCE parameters. Although low, it is encouraging that significant longitudinal correlations were found between IVIM- and DCE parameters, suggesting that IVIM could potentially be used as an alternative to DCE for treatment response monitoring purposes, in particular when repeated DCE-MRI is not feasible.
Data Availability Statement
The raw data supporting the conclusions of this article will be made available by the authors, without undue reservation.
Ethics Statement
The studies involving human participants were reviewed and approved by the medical ethics committee of The Netherlands; Cancer Institute METC19.1644/N18BREL. The patients/participants provided their written informed consent to participate in this study.
Author Contributions
EK, PH, MN, FP and UH contributed to the conception and design of the study. VP, MN, FP, and UH contributed to the acquisition of data for the study. EK, PH, and UH contributed to the analysis and interpretation of data for the study. EK wrote the first draft of the manuscript. All authors contributed to manuscript revision, read, and approved the submitted version.
Funding
This research was funded by ITEA3 project 16016 ‘STARLIT’. UH receives research support from Philips Healthcare and Elekta AB. The funder Elekta AB was not involved in the study design, collection, analysis, interpretation of data, the writing of this article or the decision to submit it for publication.
Conflict of Interest
The Netherlands Cancer Institute is a member of the Elekta MR-linac consortium, which aims to coordinate international collaborative research relating to the Elekta Unity (MR-linac). Elekta and Philips are commercial partners within the consortium. Elekta financially supports consortium member institutions with research funding and travel costs for consortium meetings.
The authors declare that the research was conducted in the absence of any commercial or financial relationships that could be construed as a potential conflict of interest.
Publisher’s Note
All claims expressed in this article are solely those of the authors and do not necessarily represent those of their affiliated organizations, or those of the publisher, the editors and the reviewers. Any product that may be evaluated in this article, or claim that may be made by its manufacturer, is not guaranteed or endorsed by the publisher.
Acknowledgments
The authors would like to thank Mutamba T. Kayembe, PhD for his input on the statistical analysis.
Supplementary Material
The Supplementary Material for this article can be found online at: https://www.frontiersin.org/articles/10.3389/fonc.2022.897130/full#supplementary-material
References
1. Zahra MA, Hollingsworth KG, Sala E, Lomas DJ, Tan LT. Dynamic Contrast-Enhanced MRI as a Predictor of Tumour Response to Radiotherapy. Lancet Oncol (2007) 8:63–74. doi: 10.1016/S1470-2045(06)71012-9
2. García-Figueiras R, Baleato-González S, Padhani AR, Luna-Alcalá A, Vallejo-Casas JA, Sala E, et al. How Clinical Imaging Can Assess Cancer Biology. Insights Into Imaging (2019) 10:28. doi: 10.1186/s13244-019-0703-0
3. Hompland T, Hakon Hole K, Ragnum HB, Aarnes E-K, Vlatkovic L, Lie AK, et al. Combined MR Imaging of Oxygen Consumption and Supply Reveals Tumor Hypoxia and Aggressiveness in Prostate Cancer Patients. Cancer Res (2018) 78:4774–86. doi: 10.1158/0008-5472.CAN-17-3806
4. O’Connor JPB, Robinson SP, Waterton JC. Imaging Tumour Hypoxia With Oxygen-Enhanced MRI and BOLD MRI. Br J Radiol (2019) 92:20180642. doi: 10.1259/bjr.20180642
5. Cao Y. The Promise of Dynamic Contrast-Enhanced Imaging in Radiation Therapy. Semin Radiat Oncol (2011) 21:147–56. doi: 10.1016/j.semradonc.2010.11.001
6. Park JJ, Kim CK, Park SY, Simonetti AW, Kim EJ, Park BK, et al. Assessment of Early Response to Concurrent Chemoradiotherapy in Cervical Cancer: Value of Diffusion-Weighted and Dynamic Contrast-Enhanced MR Imaging. Magn Reson Imaging (2014) 32:993–1000. doi: 10.1016/j.mri.2014.05.009
7. Xie T, Ye Z, Pang P, Shao G. Quantitative Multiparametric MRI May Augment the Response to Radiotherapy in Mid-Treatment Assessment of Patients With Esophageal Carcinoma. Oncol Res Treat (2019) 42:326–33. doi: 10.1159/000499322
8. Wang P, Popovtzer A, Eisbruch A, Cao Y. An Approach to Identify, From DCE MRI, Significant Subvolumes of Tumors Related to Outcomes in Advanced Head-and-Neck Cancer. Med Phys (2012) 39:5277–85. doi: 10.1118/1.4737022
9. Baer AH, Hoff BA, Srinivasan A, Galbán CJ, Mukherji SK. Feasibility Analysis of the Parametric Response Map as an Early Predictor of Treatment Efficacy in Head and Neck Cancer. Am J Neuroradiol (2015) 36:757–62. doi: 10.3174/ajnr.A4296
10. Wong KH, Panek R, Dunlop A, Mcquaid D, Riddell A, Welsh LC, et al. Changes in Multimodality Functional Imaging Parameters Early During Chemoradiation Predict Treatment Response in Patients With Locally Advanced Head and Neck Cancer. Eur J Nucl Med Mol Imaging (2018) 45:759–67. doi: 10.1007/s00259-017-3890-2
11. van Houdt PJ, Yang Y, van der Heide UA. Quantitative Magnetic Resonance Imaging for Biological Image-Guided Adaptive Radiotherapy. Front Oncol (2021) 10:615643. doi: 10.3389/fonc.2020.615643
12. van Houdt PJ, Saeed H, Thorwarth D, Fuller CD, Hall WA, McDonald BA, et al. Integration of Quantitative Imaging Biomarkers in Clinical Trials for MR-Guided Radiotherapy: Conceptual Guidance for Multicentre Studies From the MR-Linac Consortium Imaging Biomarker Working Group. Eur J Cancer (2021) 153:64–71. doi: 10.1016/j.ejca.2021.04.041
13. Gurney-Champion OJ, Mahmood F, van Schie M, Julian R, George B, Philippens MEP, et al. Quantitative Imaging for Radiotherapy Purposes. Radioth Oncol (2020) 146:66–75. doi: 10.1016/j.radonc.2020.01.026
14. Yang Y, Cao M, Sheng K, Gao Y, Chen A, Kamrava M, et al. Longitudinal Diffusion MRI for Treatment Response Assessment: Preliminary Experience Using an MRI-Guided Tri-Cobalt 60 Radiotherapy System. Med Phys (2016) 43:1369–73. doi: 10.1118/1.4942381
15. Kooreman ES, van Houdt PJ, Keesman R, van Pelt VWJ, Nowee ME, Pos F, et al. Daily Intravoxel Incoherent Motion (IVIM) In Prostate Cancer Patients During MR-Guided Radiotherapy—A Multicenter Study. Front Oncol (2021) 11:705964. doi: 10.3389/fonc.2021.705964
16. Lawrence LSP, Chan RW, Chen H, Keller B, Stewart J, Ruschin M, et al. Accuracy and Precision of Apparent Diffusion Coefficient Measurements on a 1.5 T MR-Linac in Central Nervous System Tumour Patients. Radioth Oncol (2021) 164:155–62. doi: 10.1016/j.radonc.2021.09.020
17. Le Bihan D. What Can We See With IVIM MRI? Neuroimage (2019) 187:56–67. doi: 10.1016/j.neuroimage.2017.12.062
18. Le Bihan D, Breton E, Lallemand D, Aubin ML, Vignaud J, Laval-Jeantet M. Separation of Diffusion and Perfusion in Intravoxel Incoherent Motion MR Imaging. Radiology (1988) 168:497–505. doi: 10.1148/radiology.168.2.3393671
19. Federau C. Intravoxel Incoherent Motion MRI as a Means to Measure In Vivo Perfusion: A Review of the Evidence. NMR BioMed (2017) 30:1–15. doi: 10.1002/nbm.3780
20. Joo I, Lee JM, Grimm R, Han JK, Choi BI. Monitoring Vascular Disrupting Therapy in a Rabbit Liver Tumor Model: Relationship Between Tumor Perfusion Parameters at IVIM Diffusion-Weighted MR Imaging and Those at Dynamic Contrast-Enhanced MR Imaging1. Radiology (2016) 278:104–13. doi: 10.1148/radiol.2015141974
21. Raaymakers BW, Lagendijk JJW, Overweg J, Kok JGM, Raaijmakers AJE, Kerkhof EM, et al. Integrating a 1.5 T MRI Scanner With a 6 MV Accelerator: Proof of Concept. Phys Med Biol (2009) 54:N229–37. doi: 10.1088/0031-9155/54/12/N01
22. Hoogcarspel SJ, Zijlema SE, Tijssen RHN, Kerkmeijer LGW, Jürgenliemk-Schulz IM, Lagendijk JJW, et al. Characterization of the First RF Coil Dedicated to 1.5 T MR Guided Radiotherapy. Phys Med Biol (2018) 63:025014. doi: 10.1088/1361-6560/aaa303
23. Kooreman ES, van Houdt PJ, Keesman R, Pos FJ, van Pelt VWJ, Nowee ME, et al. ADC Measurements on the Unity MR-Linac – A Recommendation on Behalf of the Elekta Unity MR-Linac Consortium. Radioth Oncol (2020) 153:106–13. doi: 10.1016/j.radonc.2020.09.046
24. Wang J, Salzillo T, Jiang Y, Mackeyev Y, David Fuller C, Chung C, et al. Stability of MRI Contrast Agents in High-Energy Radiation of a 1.5T MR-Linac. Radioth Oncol (2021) 161:55–64. doi: 10.1016/j.radonc.2021.05.023
25. Turkbey B, Rosenkrantz AB, Haider MA, Padhani AR, Villeirs G, Macura KJ, et al. Prostate Imaging Reporting and Data System Version 2.1: 2019 Update of Prostate Imaging Reporting and Data System Version 2. Eur Urol (2019) 76:340–51. doi: 10.1016/j.eururo.2019.02.033
26. Taouli B ed. Extra-Cranial Applications of Diffusion-Weighted MRI. Cambridge: Cambridge University Press (2010). doi: 10.1017/CBO9780511778070
27. Schabel MC, Parker DL. Uncertainty and Bias in Contrast Concentration Measurements Using Spoiled Gradient Echo Pulse Sequences. Phys Med Biol (2008) 53:2345–73. doi: 10.1088/0031-9155/53/9/010
28. Zhang X, Petersen ET, Ghariq E, De Vis JB, Webb AG, Teeuwisse WM, et al. In Vivo Blood T1 Measurements at 1.5 T, 3 T, and 7 T. Magn Reson Med (2013) 70:1082–6. doi: 10.1002/mrm.24550
29. Rohrer M, Bauer H, Mintorovitch J, Requardt M, Weinmann H-J. Comparison of Magnetic Properties of MRI Contrast Media Solutions at Different Magnetic Field Strengths. Invest Radiol (2005) 40:715–24. doi: 10.1097/01.rli.0000184756.66360.d3
30. Georgiou L, Wilson DJ, Sharma N, Perren TJ, Buckley DL. A Functional Form for a Representative Individual Arterial Input Function Measured From a Population Using High Temporal Resolution DCE MRI. Magn Reson Med (2019) 81:1955–63. doi: 10.1002/mrm.27524
31. Chang LC, Cheng GK, Basser PJ, Pierpaoli C. Linear Least-Squares Method for Unbiased Estimation of T1 From SPGR Signals. Magn Reson Med (2008) 60:496–501. doi: 10.1002/mrm.21669
32. Cheong LH, Koh TS, Hou Z. An Automatic Approach for Estimating Bolus Arrival Time in Dynamic Contrast MRI Using Piecewise Continuous Regression Models. Phys Med Biol (2003) 48(5):N83–N88. doi: 10.1088/0031-9155/48/5/403
33. Tofts PS, Brix G, Buckley DL, Evelhoch JL, Henderson E, Knopp MV, et al. Estimating Kinetic Parameters From Dynamic Contrast-Enhanced T1-Weighted MRI of a Diffusable Tracer: Standardized Quantities and Symbols. J Magn Reson Imag (1999) 10:223–32. doi: 10.1002/(SICI)1522-2586(199909)10
34. Murase K. Efficient Method for Calculating Kinetic Parameters Using T1-Weighted Dynamic Contrast-Enhanced Magnetic Resonance Imaging. Magn Reson Med (2004) 51:858–62. doi: 10.1002/mrm.20022
35. Bakdash JZ, Marusich LR. Repeated Measures Correlation. Front Psychol (2017) 8:456. doi: 10.3389/fpsyg.2017.00456
36. He N, Li Z, Li X, Dai W, Peng C, Wu Y, et al. Intravoxel Incoherent Motion Diffusion-Weighted Imaging Used to Detect Prostate Cancer and Stratify Tumor Grade: A Meta-Analysis. Front Oncol (2020) 10:1623. doi: 10.3389/fonc.2020.01623
37. Gao P, Shi C, Zhao L, Zhou Q, Luo L. Differential Diagnosis of Prostate Cancer and Noncancerous Tissue in the Peripheral Zone and Central Gland Using the Quantitative Parameters of DCE-MRI. Med (US) (2016) 95(52):e5715. doi: 10.1097/MD.0000000000005715
38. Dinis Fernandes C, van Houdt PJ, Heijmink SWTPJ, Walraven I, Keesman R, Smolic M, et al. Quantitative 3T Multiparametric MRI of Benign and Malignant Prostatic Tissue in Patients With and Without Local Recurrent Prostate Cancer After External-Beam Radiation Therapy. J Magn Reson Imaging (2019) 50:269–78. doi: 10.1002/jmri.26581
39. Le Bihan D, Turner R. The Capillary Network: A Link Between IVIM and Classical Perfusion. Magn Reson Med (1992) 27:171–8. doi: 10.1002/mrm.1910270116
40. Pang Y, Turkbey B, Bernardo M, Kruecker J, Kadoury S, Merino MJ, et al. Intravoxel Incoherent Motion MR Imaging for Prostate Cancer: An Evaluation of Perfusion Fraction and Diffusion Coefficient Derived From Different B -Value Combinations. Magn Reson Med (2013) 69:553–62. doi: 10.1002/mrm.24277
41. Blyth CR. On Simpson’s Paradox and the Sure-Thing Principle. J Am Stat Assoc (1972) 67:364–6. doi: 10.1080/01621459.1972.10482387
42. Shukla-Dave A, Obuchowski NA, Chenevert TL, Jambawalikar S, Schwartz LH, Malyarenko D, et al. Quantitative Imaging Biomarkers Alliance (QIBA) Recommendations for Improved Precision of DWI and DCE-MRI Derived Biomarkers in Multicenter Oncology Trials. J Magn Reson Imaging (2019) 49:e101–21. doi: 10.1002/jmri.26518
43. Klawer EME, van Houdt PJ, Simonis FFJ, van den Berg CAT, Pos FJ, Heijmink SWTPJ, et al. Improved Repeatability of Dynamic Contrast-Enhanced MRI Using the Complex MRI Signal to Derive Arterial Input Functions: A Test-Retest Study in Prostate Cancer Patients. Magn Reson Med (2019) 81:3358–69. doi: 10.1002/mrm.27646
44. Klawer EME, Houdt PJ, Simonis FFJ, den Berg CAT, Pos FJ, Heijmink SWTPJ, et al. Erratum to: Improved Repeatability of Dynamic Contrast-Enhanced MRI Using the Complex MRI Signal to Derive Arterial Input Functions: A Test-Retest Study in Prostate Cancer Patients (Magn Reson Med. 2019; 81: 3358–3369). Magn Reson Med (2021) 85:2334–6. doi: 10.1002/mrm.28606
45. Alonzi R, Taylor NJ, Stirling JJ, D’Arcy JA, Collins DJ, Saunders MI, et al. Reproducibility and Correlation Between Quantitative and Semiquantitative Dynamic and Intrinsic Susceptibility-Weighted MRI Parameters in the Benign and Malignant Human Prostate. J Magn Reson Imaging (2010) 32:155–64. doi: 10.1002/jmri.22215
Keywords: DCE, IVIM, prostate cancer, treatment response, repeated measures, correlations, perfusion
Citation: Kooreman ES, van Pelt V, Nowee ME, Pos F, van der Heide UA and van Houdt PJ (2022) Longitudinal Correlations Between Intravoxel Incoherent Motion (IVIM) and Dynamic Contrast-Enhanced (DCE) MRI During Radiotherapy in Prostate Cancer Patients. Front. Oncol. 12:897130. doi: 10.3389/fonc.2022.897130
Received: 15 March 2022; Accepted: 03 May 2022;
Published: 07 June 2022.
Edited by:
Davide Cusumano, Agostino Gemelli University Polyclinic (IRCCS), ItalyReviewed by:
Kee Howe Wong, Royal Marsden NHS Foundation Trust, United KingdomRadka Stoyanova, University of Miami, United States
Copyright © 2022 Kooreman, van Pelt, Nowee, Pos, van der Heide and van Houdt. This is an open-access article distributed under the terms of the Creative Commons Attribution License (CC BY). The use, distribution or reproduction in other forums is permitted, provided the original author(s) and the copyright owner(s) are credited and that the original publication in this journal is cited, in accordance with accepted academic practice. No use, distribution or reproduction is permitted which does not comply with these terms.
*Correspondence: Petra J. van Houdt, cC52LmhvdWR0QG5raS5ubA==
 Ernst S. Kooreman
 Vivian van Pelt
 Marlies E. Nowee
 Uulke A. van der Heide
 Petra J. van Houdt