 Chao Li
 Shaoyan Wang1
 Yafu Yin
 Fang Feng
 Hui Wang
 Suyun Chen
94% of researchers rate our articles as excellent or good
Learn more about the work of our research integrity team to safeguard the quality of each article we publish.
Find out more
ORIGINAL RESEARCH article
Front. Oncol., 24 October 2022
Sec. Cancer Imaging and Image-directed Interventions
Volume 12 - 2022 | https://doi.org/10.3389/fonc.2022.896593
This article is part of the Research TopicAdvances and New Insights into Cancer Characterization: When Novel Imaging Meets Quantitative Imaging Biomarkers Vol. IIView all 10 articles
Purpose: The substratification of high-risk neuroblastoma is challenging, and new predictive imaging biomarkers are warranted for better patient selection. The aim of the study was to evaluate the prognostic role of PET-based intratumor heterogeneity and its potential ability to improve risk stratification in neuroblastoma.
Methods: Pretreatment 18F-FDG PET/CT scans from 112 consecutive children with newly diagnosed neuroblastoma were retrospectively analyzed. The primary tumor was segmented in the PET images. SUVs, volumetric parameters including metabolic tumor volume (MTV) and total lesion glycolysis (TLG), and texture features were extracted. After the exclusion of imaging features with poor and moderate reproducibility, the relationships between the imaging indices and clinicopathological factors, as well as event-free survival (EFS), were assessed.
Results: The median follow-up duration was 33 months. Multivariate analysis showed that PET-based intratumor heterogeneity outperformed clinicopathological features, including age, stage, and MYCN, and remained the most robust independent predictor for EFS [training set, hazard ratio (HR): 6.4, 95% CI: 3.1–13.2, p < 0.001; test set, HR: 5.0, 95% CI: 1.8–13.6, p = 0.002]. Within the clinical high-risk group, patients with a high metabolic heterogeneity showed significantly poorer outcomes (HR: 3.3, 95% CI: 1.6–6.8, p = 0.002 in the training set; HR: 4.4, 95% CI: 1.5–12.9, p = 0.008 in the test set) compared to those with relatively homogeneous tumors. Furthermore, intratumor heterogeneity outran the volumetric indices (MTVs and TLGs) and yielded the best performance of distinguishing high-risk patients with different outcomes with a 3-year EFS of 6% vs. 47% (p = 0.001) in the training set and 9% vs. 51% (p = 0.004) in the test set.
Conclusion: PET-based intratumor heterogeneity was a strong independent prognostic factor in neuroblastoma. In the clinical high-risk group, intratumor heterogeneity further stratified patients with distinct outcomes.
Neuroblastoma is the most common extracranial solid tumor in children and is remarkable for its heterogeneity (1). Risk stratification using a combination of clinical and biological factors, such as age at diagnosis, stage, histology, and MYCN status, is of paramount importance to effectively inform therapeutic approaches. At the time of presentation, about 60% of children are classified as high risk (2). The incorporation of intensive multimodality therapy has increased the 5-year survival for high-risk neuroblastoma from less than 20% to ~50% (3). However, a notable subset of patients do not respond to induction therapy and have a dismal outcome, with a long-term survival of less than 15% (4). The improved outcome for the survivors has come at a cost of significant early or long-term toxicity. The early identification of these different subsets of patients may facilitate a more precisely tailored treatment, which remains an important unmet need.
Intratumor heterogeneity, resulting from subclonal genetic diversity within a tumor, manifests in spatial variation in stromal architecture and consumption of oxygen and glucose (5). It has been associated with poor prognosis and predisposes patients to inferior response to anticancer therapies (6). Medical images can depict the spatial heterogeneity in individual tumors andquantify the overall functional characteristics. Various approaches for the assessment of intratumor heterogeneity in PET images have been investigated, including simple visual analysis, histogram quantifying voxel distributions, and texture features quantifying spatial complexity (7, 8). A growing body of evidence suggests that PET-based intratumor heterogeneity might have predictive or prognostic value in various malignancies (9, 10).
123I-meta-iodobenzylguanidine (mIBG) scan has been the main imaging modality for neuroblastoma. For high-risk diseases, however, the limited prognostic value of pretreatment mIBG score was reported (11, 12). On the other hand, 18F-FDG PET/CT is increasingly used in neuroblastoma, particularly in tumors not taking up mIBG. SUVmax has been reported to correlate with MYCN amplification (13) and may serve as a prognostic biomarker in neuroblastoma (14, 15). Volumetric parameters derived from 18F-FDG PET, including metabolic tumor volume (MTV) and total lesion glycolysis (TLG), were previously reported as significant prognostic factors in neuroblastoma (16). To date, there is limited evidence regarding the role of intratumor metabolic heterogeneity in neuroblastoma.
Our key objectives were to investigate the prognostic role of PET-based intratumor heterogeneity and whether it could be used to further risk-stratify neuroblastoma.
This study included 129 consecutive pediatric patients with histologically proven neuroblastoma between October 2011 and September 2020. The inclusion criteria were as follows: 1) newly diagnosed neuroblastoma with no previous anticancer treatment, 2) underwent baseline 18F-FDG PET/CT scan, 3) not accompanied by other malignancies, and 4) at least 6 months of follow-up. Patients were excluded if they had primary intracranial neuroblastoma, ganglioneuroma, no predominant primary tumor site, refused treatment, or had received chemotherapy before the PET scan (Figure 1). Clinicopathological prognostic indices, such as age, stage, risk stratification, MYCN, lactate dehydrogenase (LDH), and ferritin, were collected. This retrospective study was approved by the institutional review board, and the requirement for informed consent was waived.
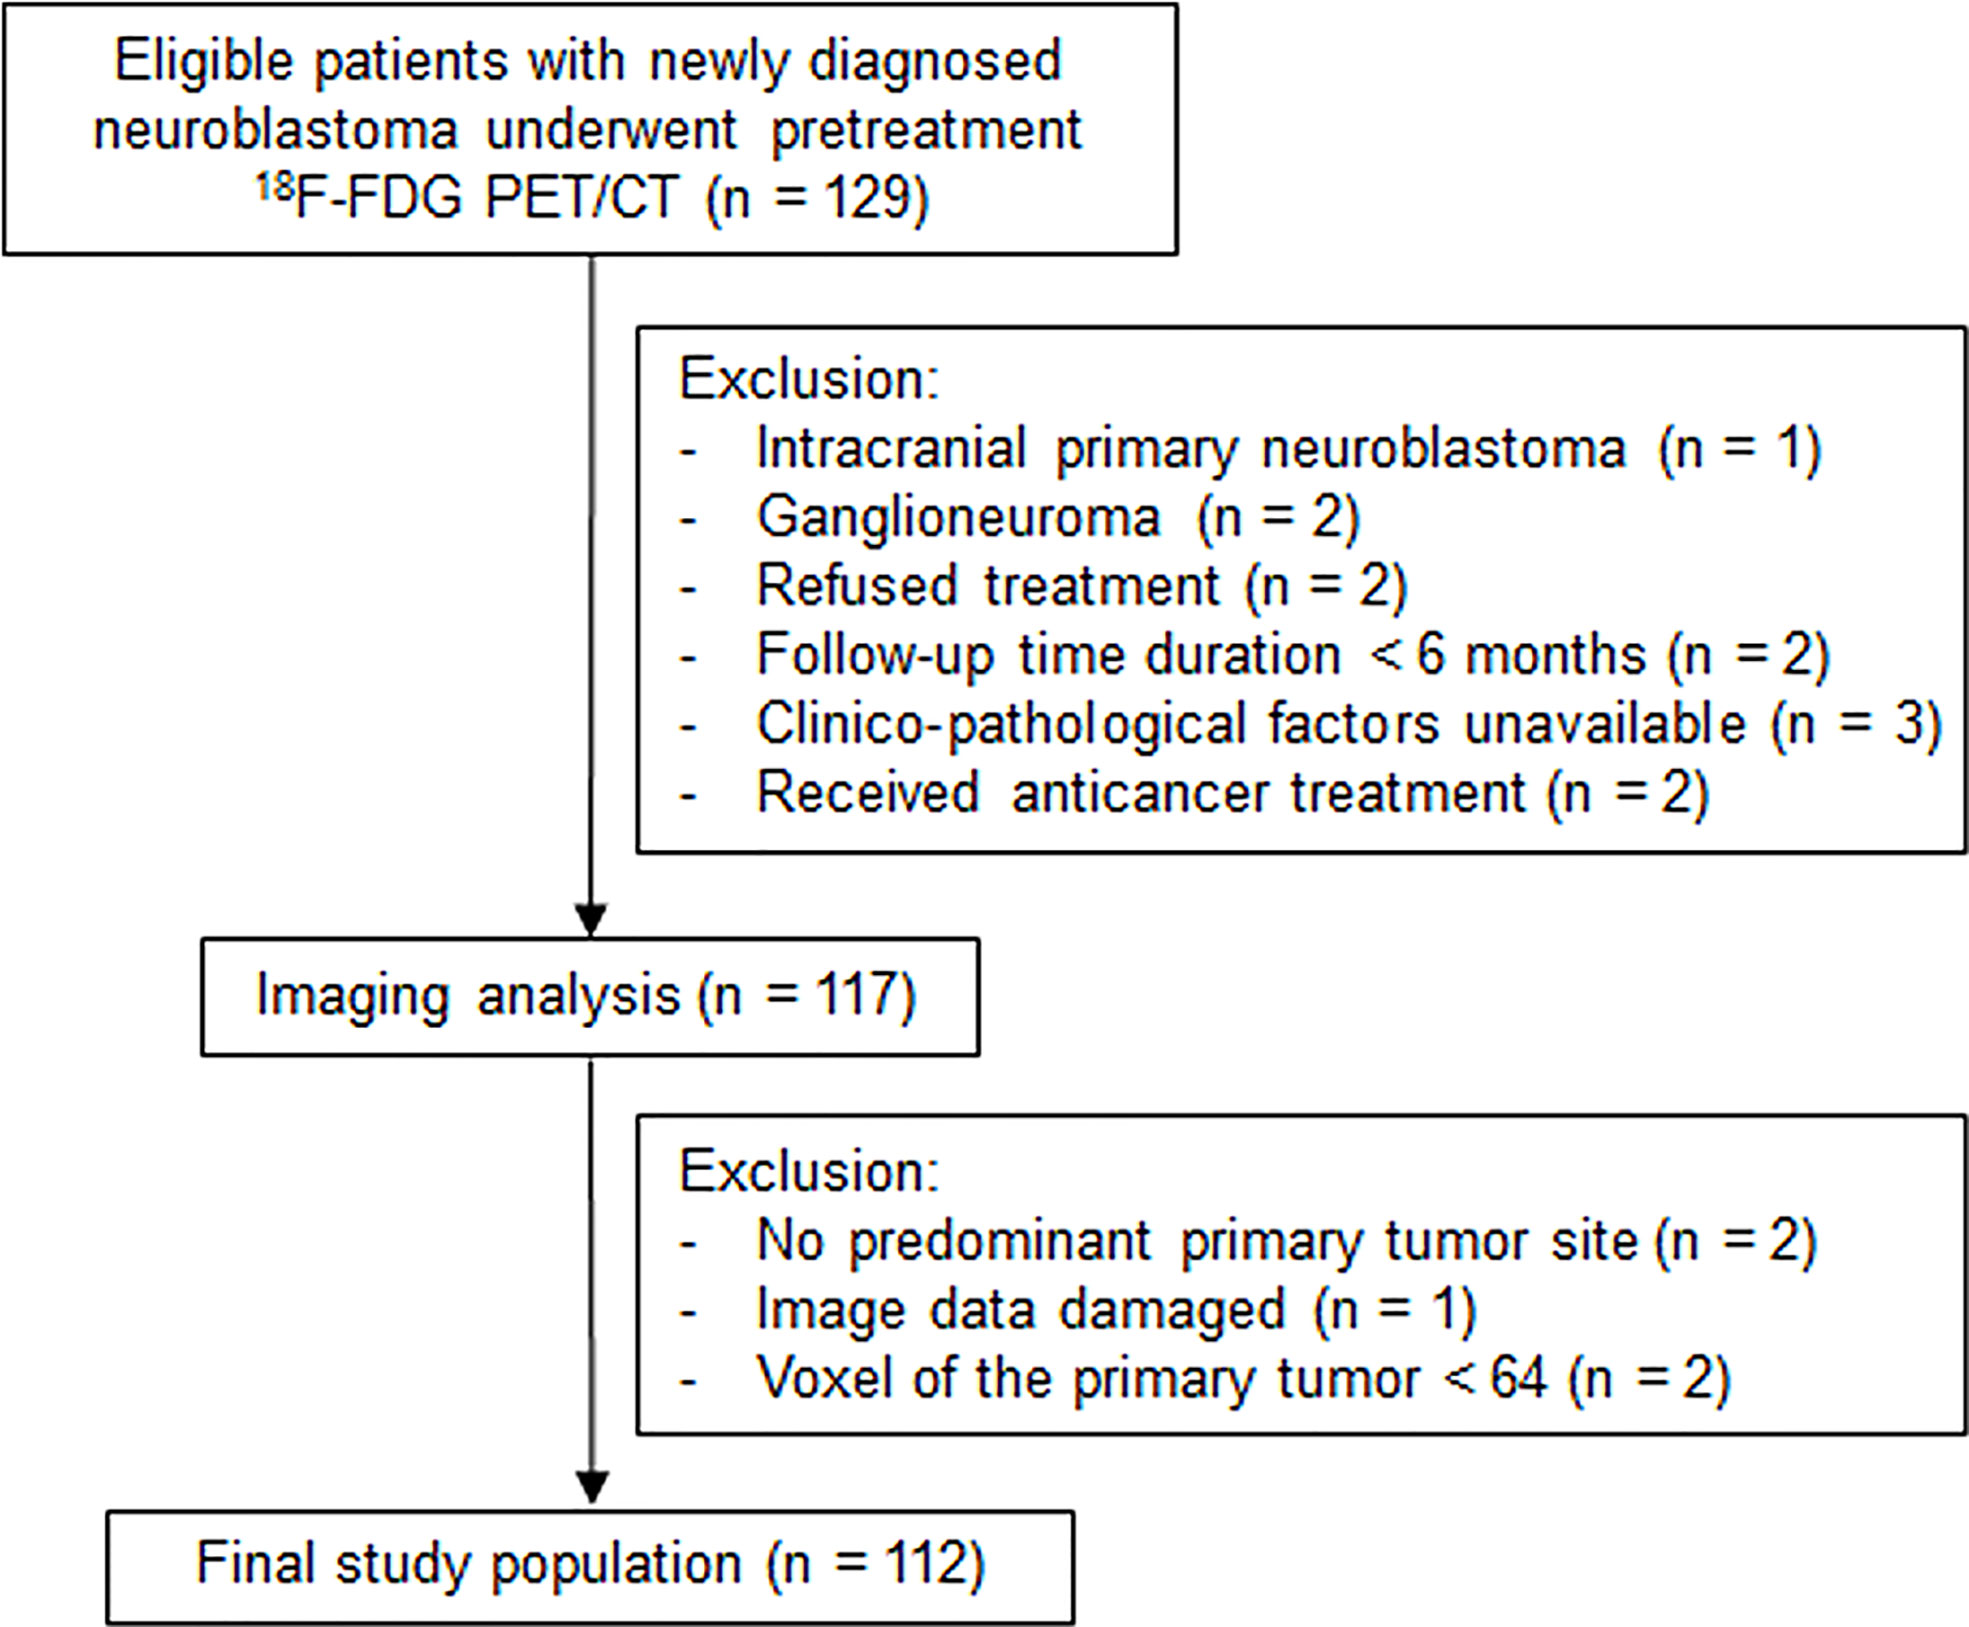
Figure 1 Flowchart shows study population selection, with exclusion criteria.
18F-FDG was administered at a dose of 5.18 MBq/kg after at least 4–6 h of fasting. PET/CT scans from the skull to the proximal thigh were acquired about 60 min after injection using a Biograph mCT-64 scanner (Siemens). When metastasis was suspected to involve the extremities, imaging from the vertex to the toes including the arms was performed. Chloral hydrate sedation (50 mg/kg) was used 30 min before scanning for children unable to follow instructions. PET images were reconstructed using 3D ordered subset expectation maximization (3 iterations, 24 subsets). CT scans were acquired with 100-kV tube voltage, automated tube current modulation, 3-mm slice thickness, and a pitch of 1.5.
Segmentation and feature extraction were performed using the LIFEx software (Version 6.31, http://www.lifexsoft.org). To investigate the voxel relationships inside the entire tumor, volumes of interest (VOIs) covering the whole primary tumor were delineated manually in PET images by a nuclear medicine physician with more than 11 years of PET/CT experience without knowledge of clinical information. In some cases, the primary tumor fused with the metastatic lesions and was delineated with reference to recent contrast-enhanced CT or MRI images. As PET has relatively large voxels compared with CT and MRI, each VOI must contain at least 64 contiguous voxels according to the LIFEx user guide. Two patients were excluded due to small voxels. Imaging indices were computed after a resampling step using 64 bins (size bin of 0.3) without spatial resampling. MTV and TLG with a threshold of 41% of SUVmax (MTV41%, TLG41%), which has been reported to correspond best with the actual dimensions of the tumor for tumor boundary delineation (17), were extracted from the same VOIs.
Event-free survival (EFS) was calculated as the time from the start date of cancer treatment to the date of relapse, progression, or death from any cause. All the patients received risk-adapted treatment according to the Chinese Children Cancer Group-NB-2009/2014. The risk categorization schema was consistent with the Children’s Oncology Group protocol (2). Briefly, patients were classified into low-, intermediate-, and high-risk categories based on age, stage, and other histopathological factors. High-risk disease was defined as ≥18 months of age and either disseminated disease or localized disease with unfavorable markers, such as MYCN amplification.
To determine robust features, half of the patients were selected randomly and segmented independently by another nuclear medicine physician with 6 years of PET/CT experience. We evaluated the reproducibility of features using a two-way random, absolute agreement intraclass correlation coefficient (ICC). Using the lower bounds of the 95% confidence interval (CI) of the ICC value (ICClb95%) (18), the reproducibility of each feature was categorized as follows: poor, ICClb95% <0.50; moderate, ICClb95% of 0.50–0.75; good, ICClb95% of 0.75–0.90; and excellent, ICClb95% ≥0.90. Robust features with good or excellent reproducibility were qualified for further analysis.
The Mann–Whitney U test and chi-squared test were used for comparing variables between groups. The Benjamini–Hochberg stepwise method was performed to control the false discovery rate and adjusted p-values were calculated. Correlations among the parameters were determined by the Pearson and Spearman rank correlation. To avoid redundancy, factors with poorer predictive validity in the pairs of indices that showed correlation coefficient (r) ≥0.8 were omitted (19, 20). Logistic regression analyses with forward selection were performed to evaluate the relationship between imaging indices and MYCN amplification. Then, the entire cohort was randomly split into a training set (n = 77) and a test set (n = 35). Prognostic factors were identified by univariate and multivariable Cox regression analyses in the training set and then validated in the test set. Receiver-operating characteristic curve (ROC) analyses and the Youden index were used to determine the optimal cutoff values. Survival estimates were evaluated by the Kaplan–Meier analysis and log-rank test. All statistical analyses were performed using SPSS 25.0 (IBM, Chicago, IL, USA), except that the adjusted p-values were obtained on R software (Version 4.0.3, http://www.r-project.org/). A two-sided p-value <0.05 was considered statistically significant.
As a result, a total of 112 children were identified. The patient characteristics are summarized in Table 1. There were 39 girls (median age 34 months, range 1–153 months) and 73 boys (median age 36 months, range 2–150 months). Ninety patients had neuroblastoma and 22 had ganglioneuroblastoma (GNB). Most of them presented disseminated disease (2 with stage 4S, 79 with stage 4). With a median follow-up of 33 months, 51 disease relapse/progression and 34 deaths occurred. The 3-year EFS rate was 47%.
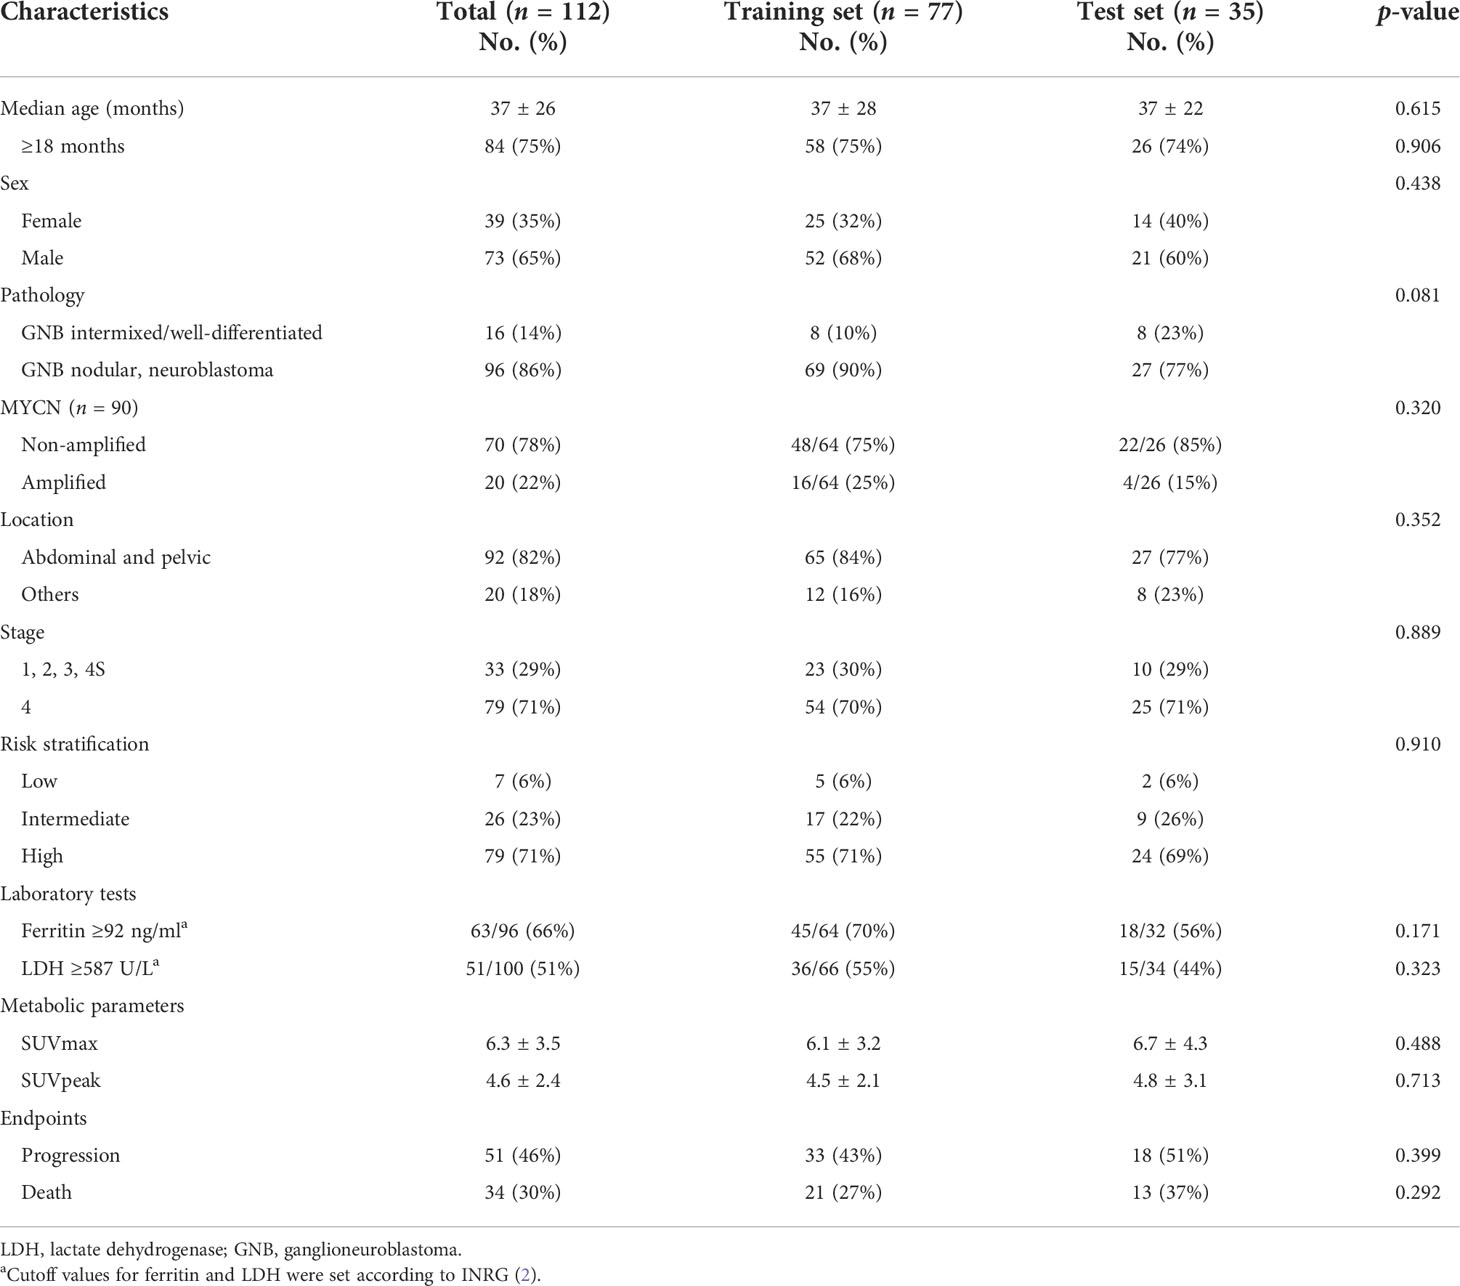
Table 1 Patient characteristics.
All the patients had an FDG-avid primary tumor with a median SUVmax of 5.8 (range 1.6–26.5). Seven tumors had SUVmax lower than 2.5 (1.6–2.4), all of which were higher than the liver background. High-risk neuroblastoma showed significantly higher FDG uptake (SUVmax and SUVpeak, p < 0.001) and volumetric values (MTV, TLG, and TLG41%, all p < 0.001; MTV41%, p = 0.040) than those with non-high-risk disease (Figure S1).
Sixty-nine imaging features were obtained per VOI. The steps used to reduce feature dimension are summarized in Table S1. The ICC revealed that most of the imaging features could be reproduced well (Table S2). Fifty-one out of the 59 feature pairs had ICClb95% ≥0.75 (excellent reproducibility in 39 and good reproducibility in 12) and were qualified for subsequent analyses.
MYCN status was available in 90 patients and was amplified in 20 patients. The majority of imaging features (44/51) were significantly different between the MYCN-amplified and the non-amplified groups (Table S3). After false discovery correction, 34 remained statistically significant. For example, FDG uptake was significantly higher in the MYCN-amplified tumor (SUVmax: 7.9, 95% CI: 6.7–9.9 vs. 5.1, 95% CI: 4.9–6.6, p < 0.001, adjusted p = 0.005).
The ROC analysis showed that all of the above 34 features had AUCs higher than 0.7 to predict MYCN amplification. Histogram_Kurtosis, which reflects the shape of the histogram distribution relative to a normal distribution, yielded the highest AUC of 0.853 (p < 0.001). After multicollinearity reduction, nine features were entered into multivariate logistic regression analysis. A radiomic model composed of two features [Histogram_Kurtosis and gray-level non-uniformity from gray-level zone length matrix (GLZLM_GLNU), which reflects the non-uniformity of the gray levels of the homogeneous zones in 3D] was built subsequently, resulting in an AUC of 0.871 (Figure 2, p < 0.001) with the following equation:
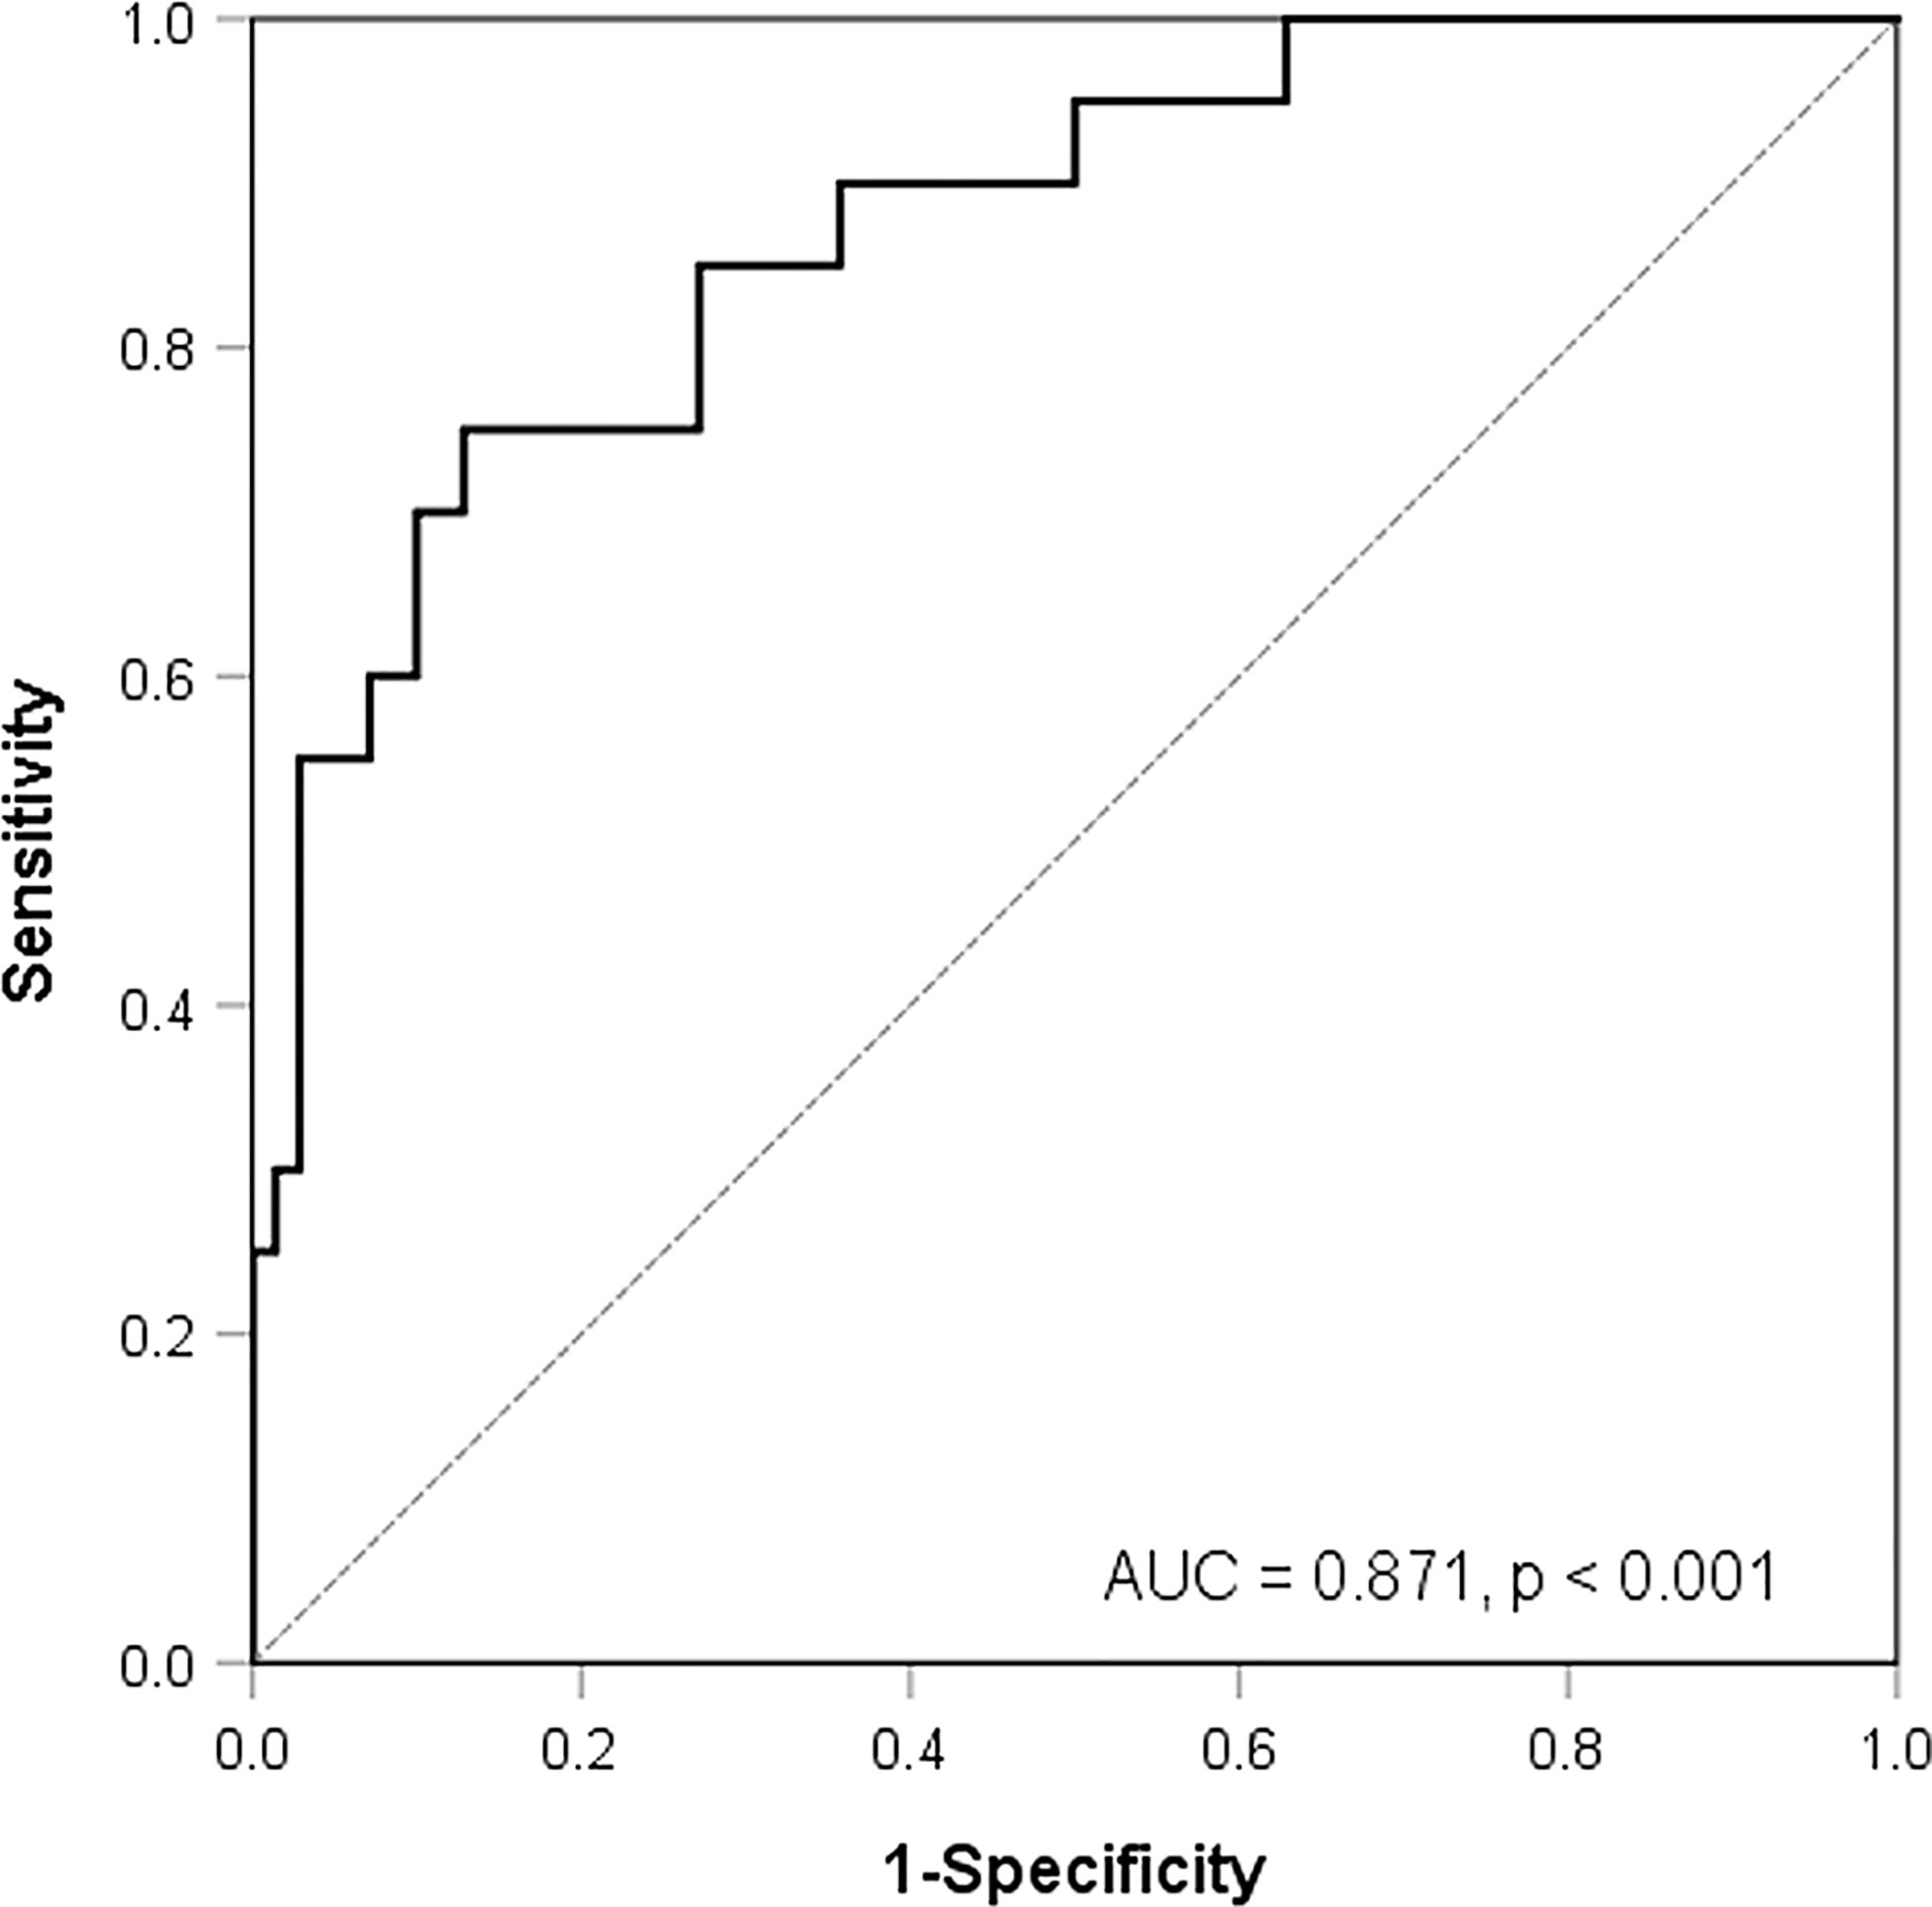
Figure 2 Receiver-operating characteristic curve analysis for the prediction of MYCN amplification according to a model composed of two texture features.
Predicted probability = EXP (−0.287 − 0.228 × Histogram_Kurtosis + 0.021 × GLZLM_GLNU)/(1 + EXP (−0.287 − 0.228 × Histogram_Kurtosis + 0.021 × GLZLM_GLNU).
The distribution of key variables including age, stage, MYCN, and conventional metabolic parameters was similar between the training and test sets (Table 1). In the training set, univariate Cox regression analysis revealed that 14 first-order and 8 second-order indices correlated with EFS (p < 0.05). After feature dimension reduction, two first-order indices, namely, SUVmax and Histogram_Entropy reflecting the randomness of the voxel distribution, were retained (Table 2). Three second-order indices retained were as follows: one from the gray-level co-occurrence matrix (GLCM): GLCM_energy, which reflects the uniformity of gray-level voxel pairs; two from the gray-level run-length matrix (GLRLM), namely, the gray-level non-uniformity (GLRLM_GLNU), which measures the non-uniformity of the gray levels, and run-length non-uniformity (GLRLM_RLNU), which quantifies the non-uniformity of the length of the homogeneous runs. The AUCs for SUVmax, Histogram_Entropy, GLCM_energy, GLRLM_GLNU, and GLRLM_RLNU to predict progression were 0.611, 0.666, 0.645, 0.689, and 0.733, respectively. Multivariate Cox regression analyses revealed that GLRLM_RLNU with a cutoff value of 1,828 and Histogram_Entropy with a cutoff value of 3.3 outperformed other imaging indices and were significant to predict events. In addition, imaging features extraction was performed in the high-risk group separately, and the results are presented in the Supplementary Materials (Supplementary Data and Figure S2).
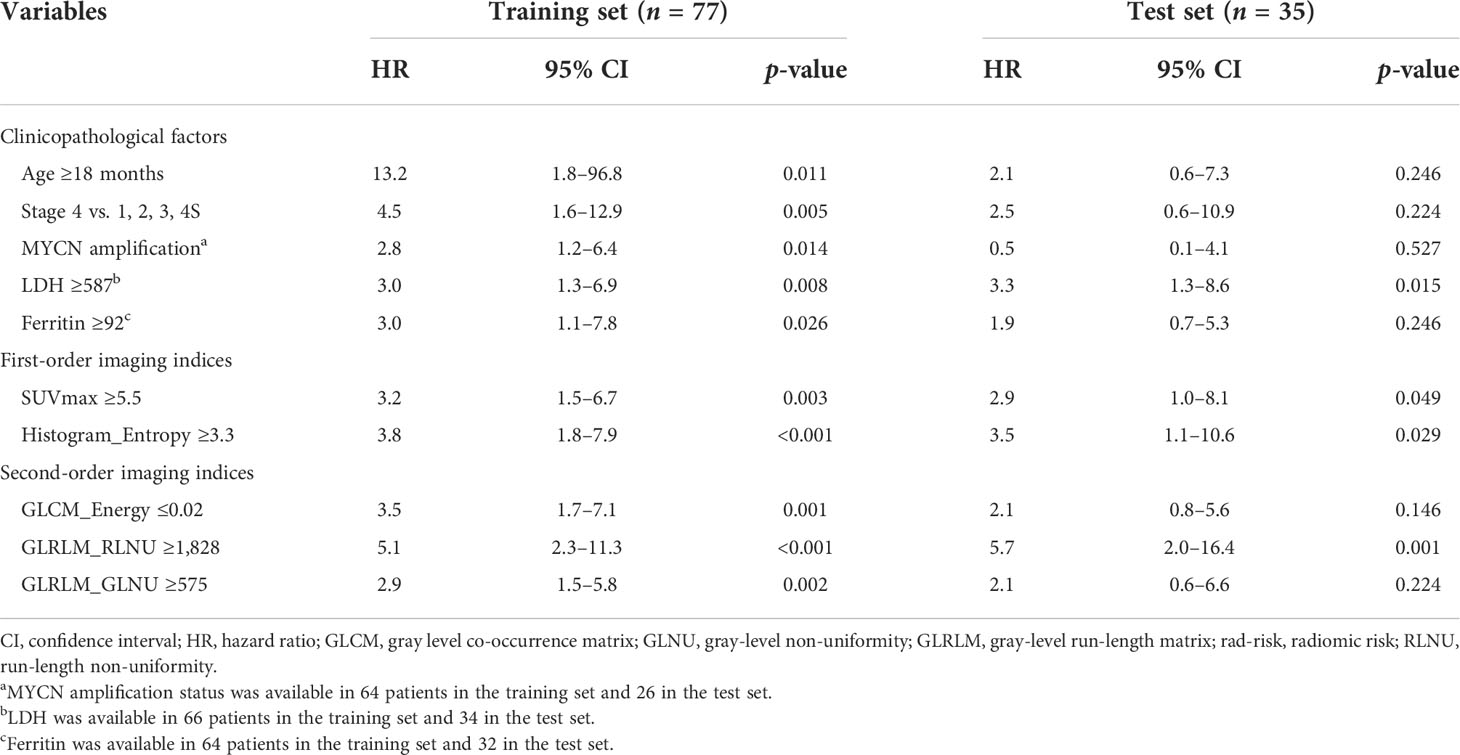
Table 2 Univariate Cox regression analyses for event-free survival.
Then, patients in the training set and the test set were divided into three groups according to whether GLRLM_RLNU ≥1,828 and Histogram_Entropy ≥3.3: patients with neither of these two risk factors, those with either one of the factors, and those with both. Patients with neither or either one of these factors demonstrated similar survival curves both in the training set and test set (Figure 3A, p = 0.697; Figure 3B, p = 0.383) and, thus, were combined and categorized as low rad-risk. Patients with both factors had a significantly worse prognosis (training set, HR: 6.4, 95% CI: 3.1–13.2, p < 0.001; test set, HR: 5.0, 95% CI: 1.8–13.6, p = 0.002) and were categorized as high rad-risk. The 3-year EFS of low vs. high rad-risk was 71% vs. 6% in the training set and 69% vs. 17% in the test set, respectively (both p < 0.001).
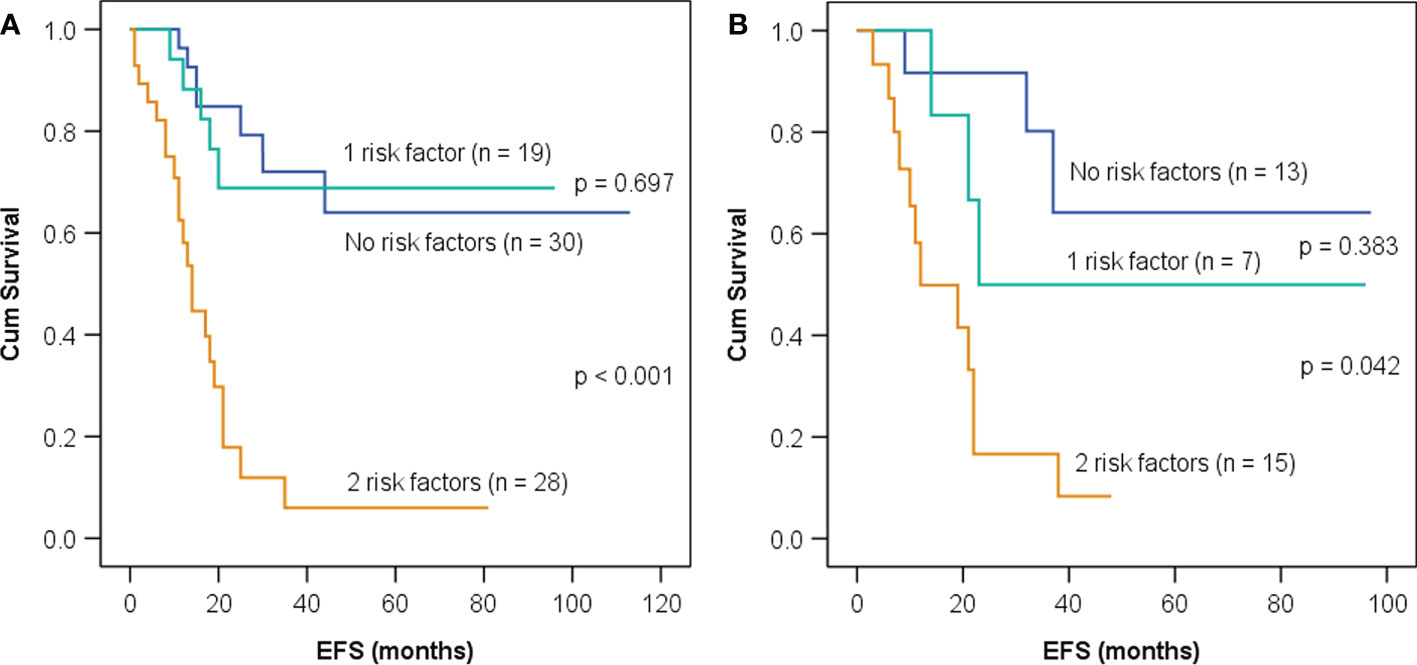
Figure 3 Kaplan–Meier event-free survival (EFS) curves in children with neuroblastoma having neither, one, or both imaging risk factors—GLRLM_RLNU ≥1,828 and Histogram_Entropy ≥3.3—in the training set (A) and the test set (B).
Clinicopathological factors including age, stage, MYCN, LDH, and ferritin significantly correlated with EFS in the training set (Table 2). As MYCN status, LDH, and ferritin were unavailable in several patients, we firstly integrated rad-risk with age and stage into the multivariate analysis. After adjustment for clinical covariates (Table 3), rad-risk obtained independent significance with HR of 4.3 (95% CI: 2.0–9.1, p < 0.001), while age showed marginal significance (HR: 6.8, 95% CI: 0.9–52.5, p = 0.066). After incorporating MYCN into the model, only rad-risk remained significant (HR: 8.8, 95% CI: 3.7–21.0, p < 0.001). Furthermore, we integrated LDH and ferritin into the multivariate analyses separately or together, and rad-risk was the only factor that retained significance.
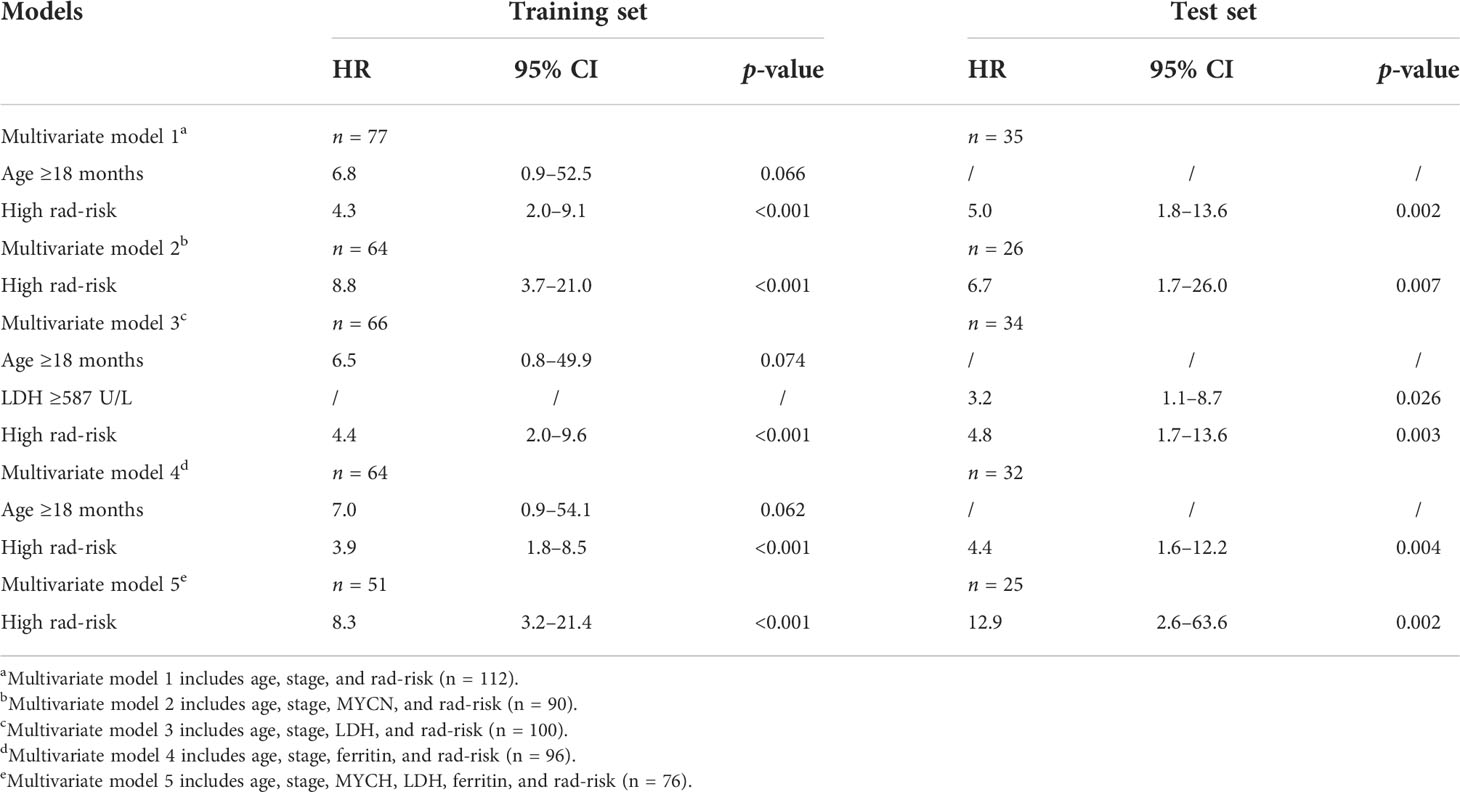
Table 3 Multivariate Cox regression analyses for event-free survival.
Similarly, after adjusting for clinicopathological variables separately or together in the multivariate analysis, high rad-risk was confirmed to be the most significant factor to predict EFS in the test set (Table 3).
None of the seven patients with clinical low-risk diseases had a high rad-risk, and only 2 of the 26 patients with clinical intermediate-risk diseases had a high rad-risk, indicating that the majority of patients with clinical non-high-risk had a relatively homogeneous tumor. Due to limited cases with a high rad-risk in the clinical non-high-risk group, the significance of rad-risk in the risk substratification in this group could not be statistically analyzed.
Seventy-nine patients had high-risk neuroblastoma: 55 patients in the training set and 24 in the test set. We further evaluated whether adding rad-risk could refine risk stratification and compared it with volumetric indices, including MTV, MTV41%, TLG, and TLG41%. In the training set, ROC analyses were performed (Figure S3) and optimal cutoff values were determined to be 120 ml for MTV, 65 ml for MTV41%, 426 g for TLG, and 141 g for TLG41%, respectively.
As shown in Figure 4, all of the five imaging indices significantly correlated with EFS in the training set. The 3-year EFS for patients with high vs. low MTV, MTV41%, TLG, and TLG41% were 17% vs. 61% (p = 0.013), 14% vs. 53% (p = 0.015), 18% vs. 40% (p = 0.014), and 16% vs. 61% (p = 0.025), respectively. However, the volumetric features failed to retain significance in the test set, except TLG (Figure 5). Rad-risk yielded the best performance to distinguish high-risk patients with different outcomes, with a 3-year EFS of 6% vs. 47% (p = 0.001, Figure 4E) in the training set and 9% vs. 51% (p = 0.004, Figure 5E) in the test set. High rad-risk was associated with a 2.3–3.4 times higher risk of progression (HR: 3.3, 95% CI: 1.6–6.8, p = 0.002 in the training set; HR: 4.4, 95% CI: 1.5–12.9, p = 0.008 in the test set). Two patients with high-risk neuroblastoma and a high or low rad-risk are presented in Figure 6.
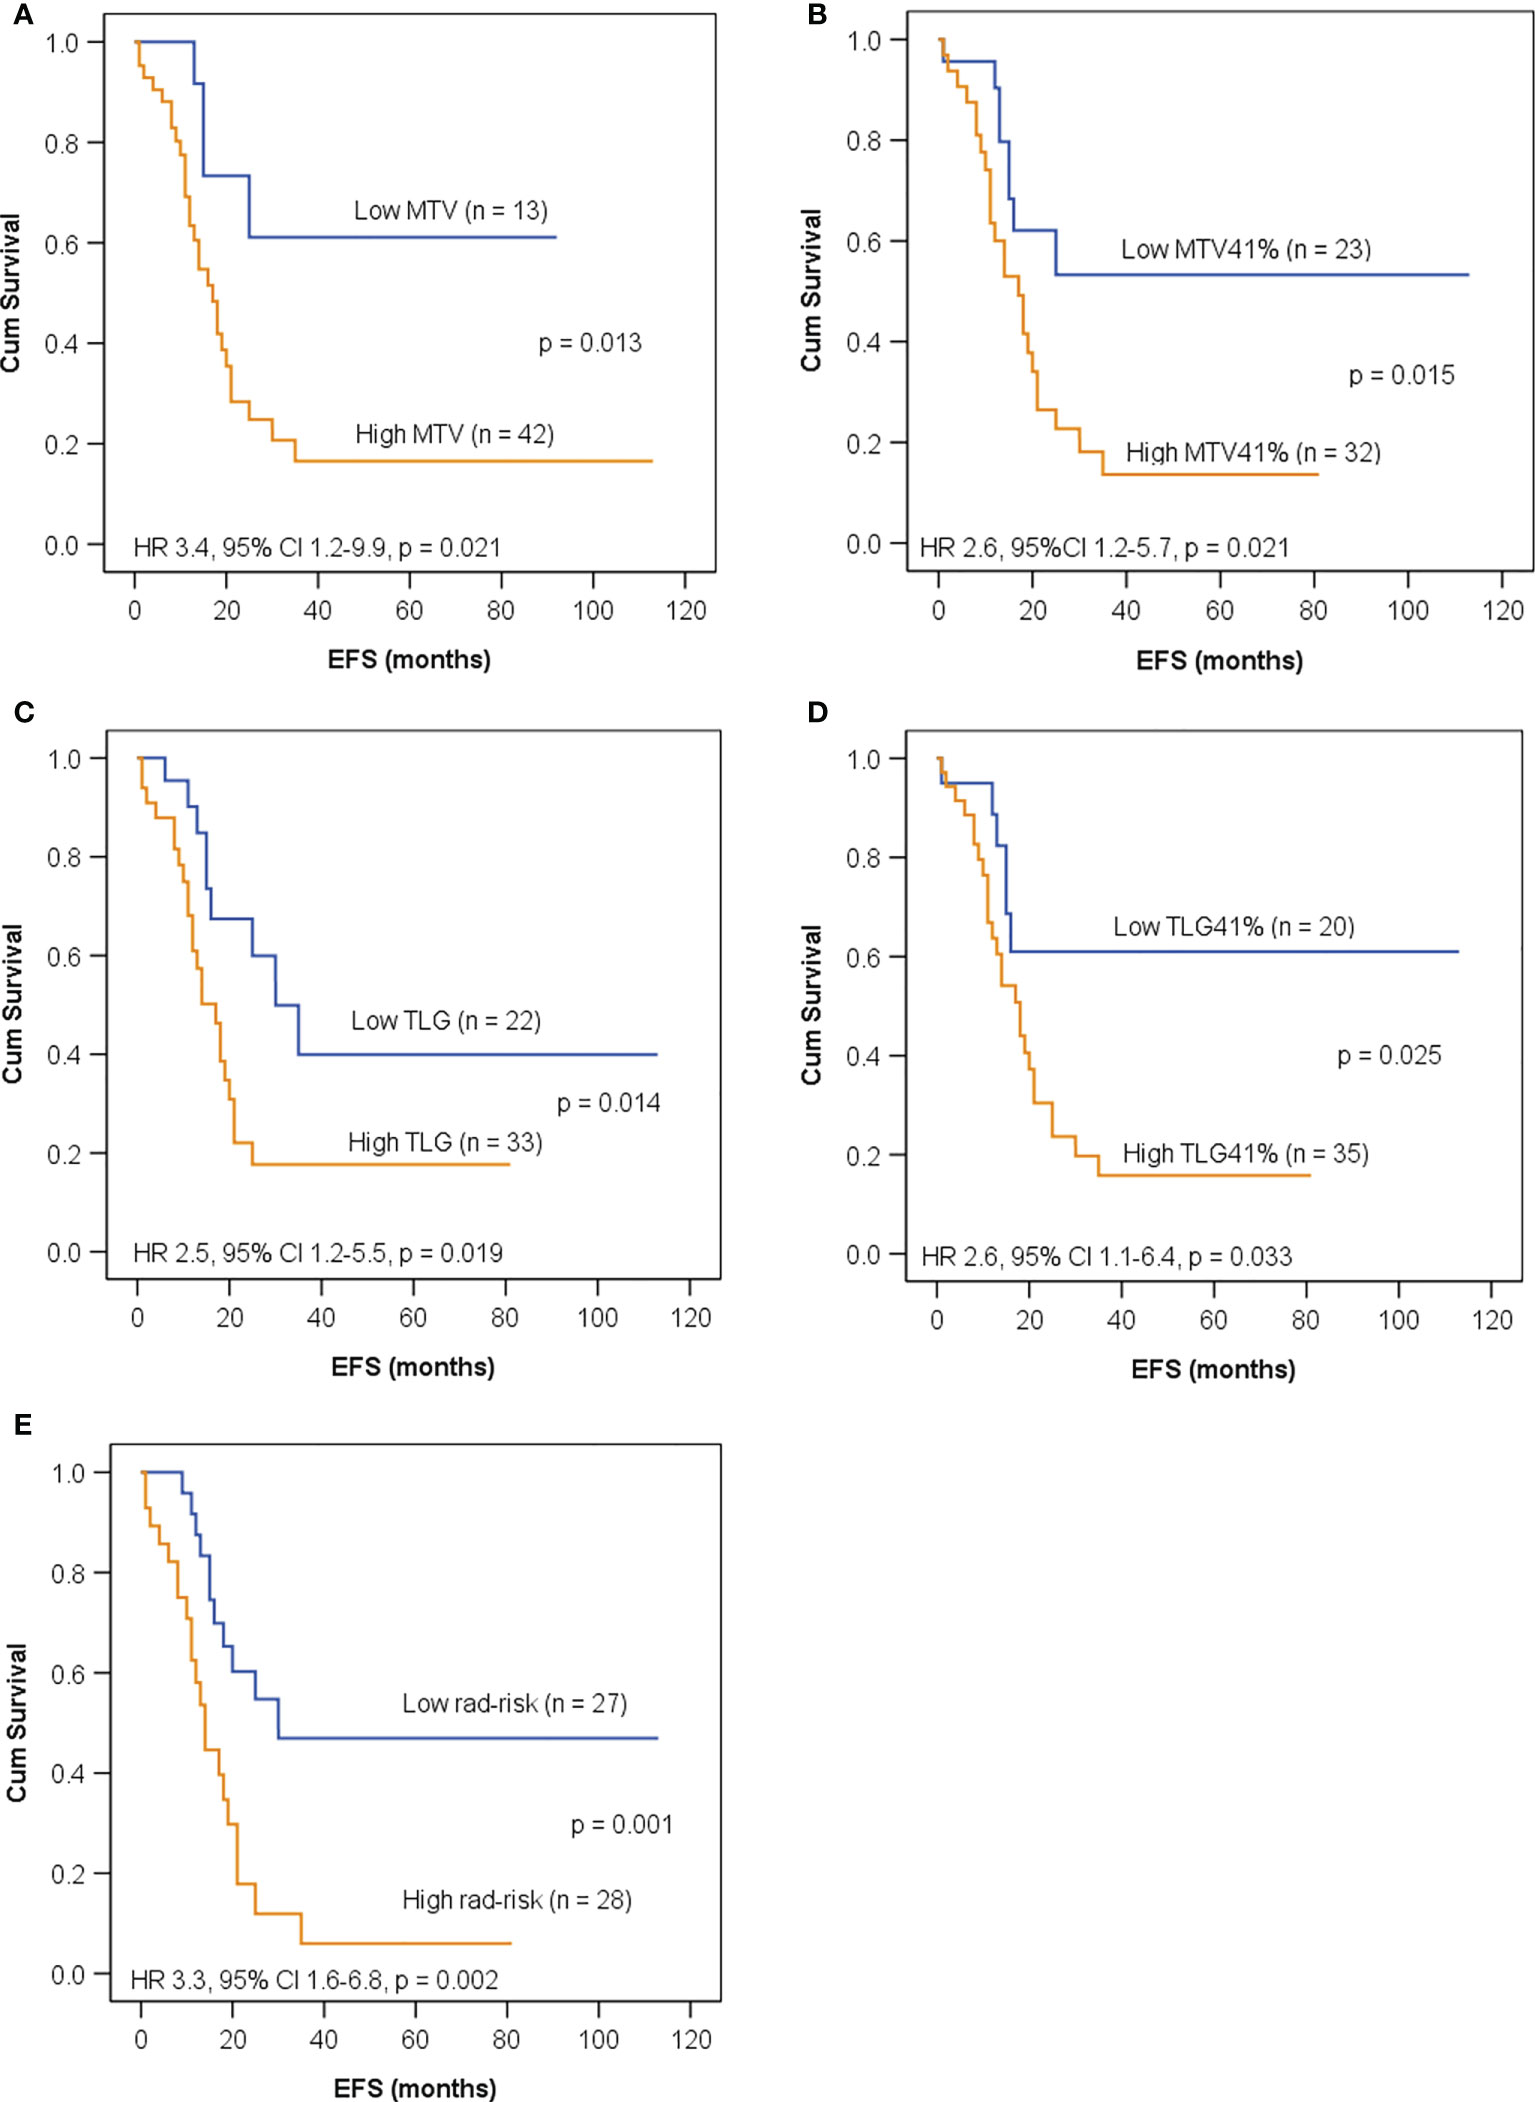
Figure 4 Kaplan–Meier curves for EFS in children with high-risk neuroblastoma in the training set according to (A) metabolic tumor volume (MTV) with a cutoff value of 120 ml; (B) MTV41% with a cutoff value of 65 ml; (C) total lesion glycolysis (TLG) with a cutoff value of 426 g; (D) TLG41% with a cutoff value of 141 g; (E) rad-risk.
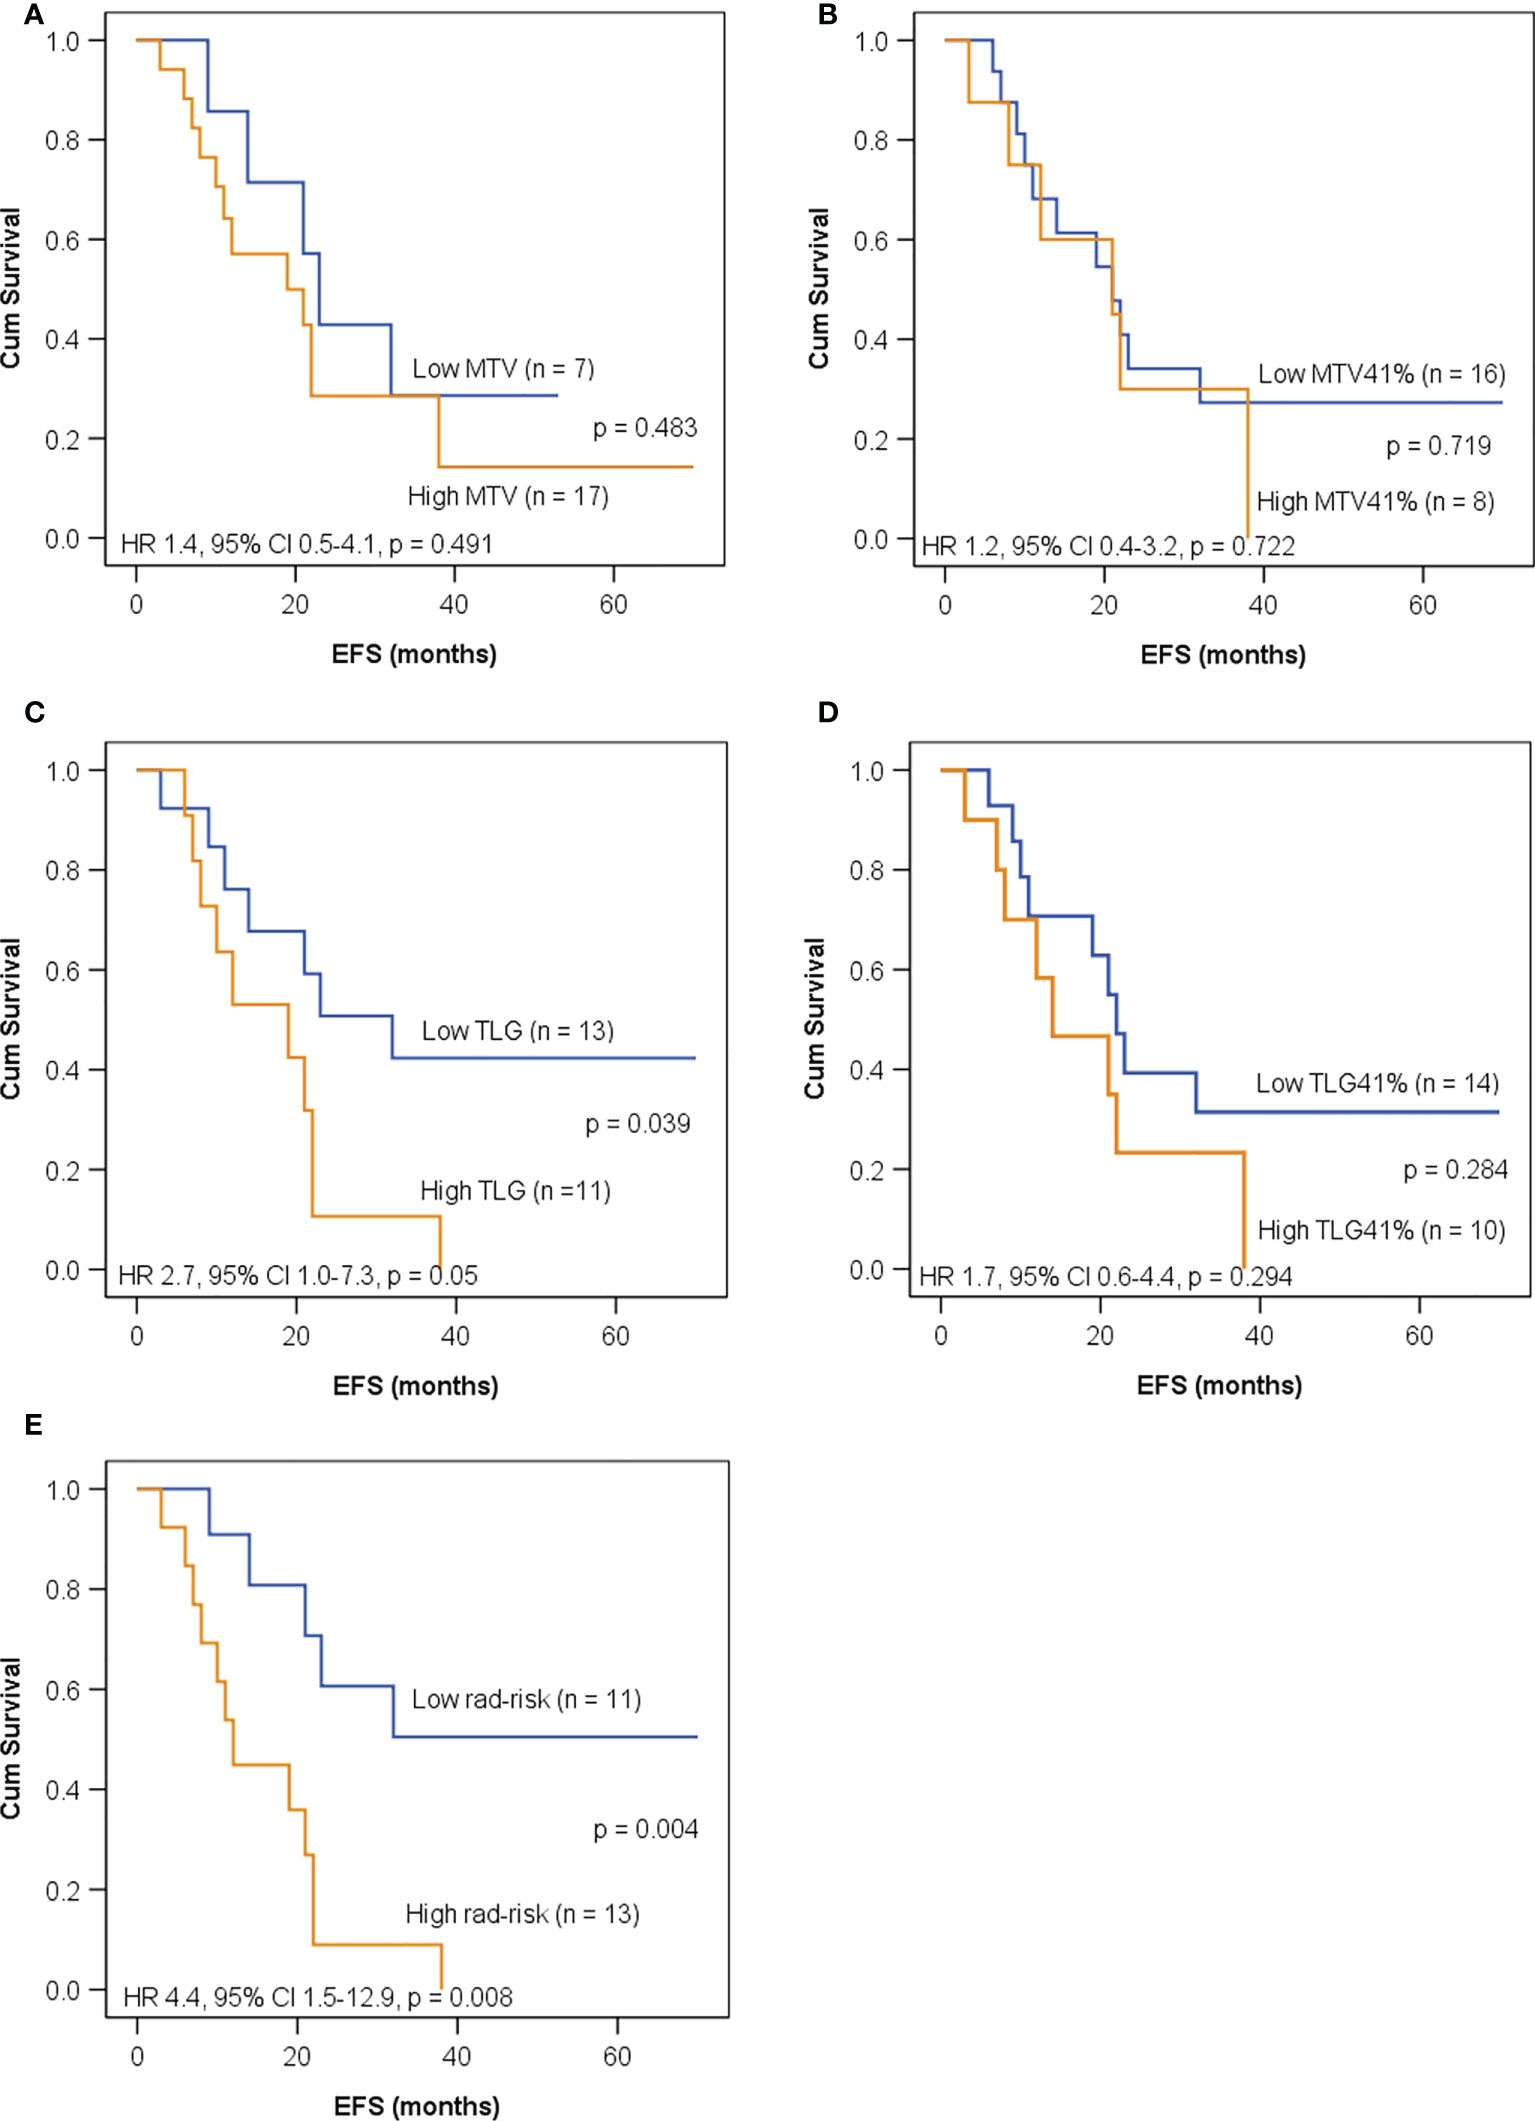
Figure 5 Kaplan–Meier curves for EFS in children with high-risk neuroblastoma in the test set according to (A) MTV with a cutoff value of 120 ml; (B) MTV41% with a cutoff value of 65 ml; (C) TLG with a cutoff value of 426 g; (D) TLG41% with a cutoff value of 141 g; (E) rad-risk.
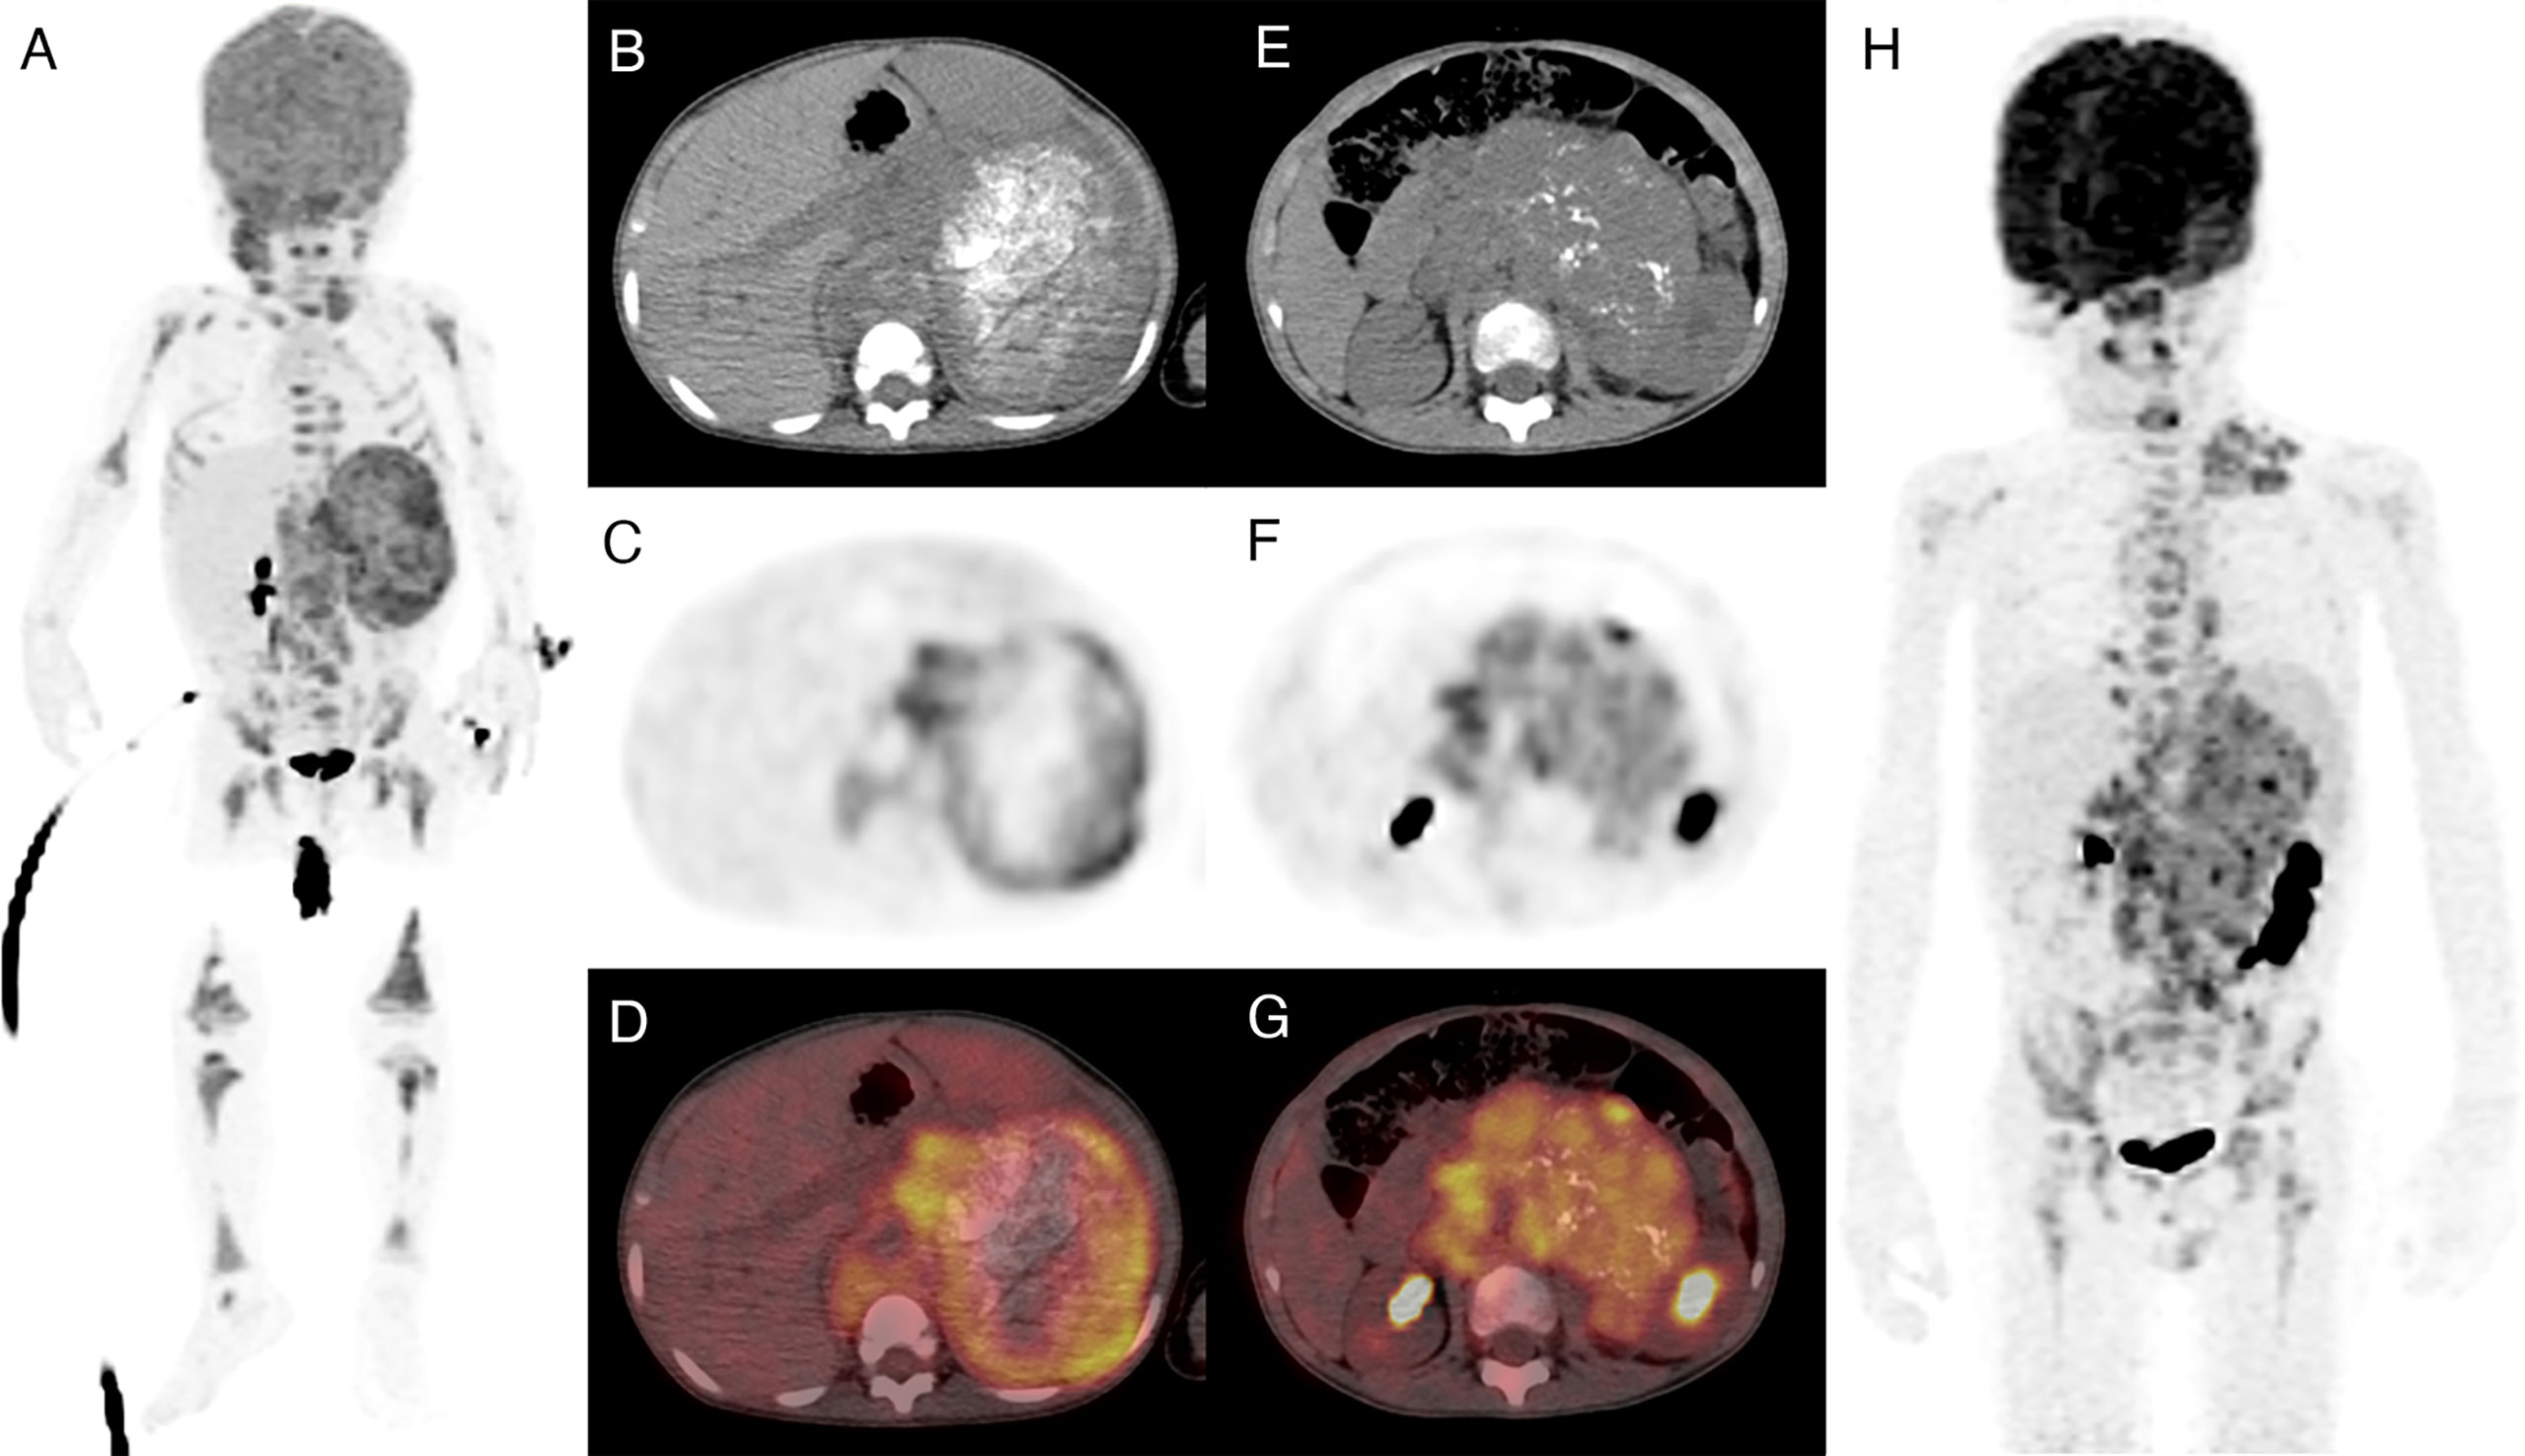
Figure 6 Two patients with a high-risk neuroblastoma and high or low intratumor heterogeneity. Both patients had amplified MYCN and stage 4 diseases. (A–D) A 20-month-old girl with a highly heterogeneous FDG uptake in the primary tumor (high rad-risk). She progressed 21 months after diagnosis. (E–H) A 5-year-old boy with a relatively homogeneous FDG uptake (low rad-risk). The patient remained recurrence free within 5 years of follow-up.
The substratification of high-risk neuroblastoma is challenging, and new predictive biomarkers are warranted for better patient selection. In this study, we confirmed that PET-based intratumor heterogeneity independently correlated with EFS in neuroblastoma both in the training set and the test set. It further improved the risk stratification in high-risk neuroblastoma, with a 3-year EFS of 6%–9% for the highly heterogeneous tumors compared to 47%–51% for the relatively homogeneous ones.
Radiomics, extracting quantitative features from medical images, has rapidly evolved throughout these years. Compared to histological biopsy only capturing a small proportion of tumor tissue that could underestimate the mutational burden (21), a great advantage of radiomics is its ability to visualize the characteristics of the whole tumor non-invasively. It fully depicts spatial intratumor heterogeneity, which has been associated with poor prognosis. Studies showed that radiomic features in PET images correlated with heterogeneity at the cellular and genomic levels and had significant prognostic value in various malignancies (22–24). On the other hand, tumor necrosis results from increased tumor size, intratumor hypoxia, and nutrient deprivation. Both the presence and the extent of necrosis correlated with poor prognosis (25, 26). A necrotic core appears as non-FDG-avid area within the tumor. To investigate the spatial voxel relationships inside the entire tumor, the current study examined the VOI covering the whole mass (including the necrotic region) instead of putting a threshold of SUVmax on VOI segmentation. Our results partly confirmed previous studies that texture features significantly correlated with tumor size or volume (27, 28). We found four second-order indices reflecting tumor heterogeneity, including GLRLM_RLNU, highly correlated with volumetric indices. The latter is usually considered a reflection of tumor burden, while texture features correlate with tumor heterogeneity. A larger tumor results in a higher level of intratumor hypoxia and necrosis and leads to higher spatial complexity and heterogeneity (27). Hatt et al. found that radiomic heterogeneity quantification provided valuable complementary information for large tumors (>10 cm3) (27). In our study, only one patient had a tumor volume less than 10 ml. The median volume for our whole cohort was 160 ml.
MYCN amplification is the most common genomic alteration in neuroblastoma, occurring in approximately 20% of the patients (29). It is highly associated with advanced stage and poor prognosis; thus, it has been incorporated into the mostly used neuroblastoma protocol. Radiomic models derived from contrast-enhanced CT have been shown to accurately predict MYCN amplification (30–32). Wu et al. (31) suggested that three-phase CT had a higher value than non-contrast CT scan, which could be explained by tumor angiogenesis promoted by MYCN amplification. Different from the density heterogeneous and vascular structure complexity depicted by CT scans, PET imaging semi-quantifies the glucose consumption of tumor parenchyma and reflects the uneven spatial distribution of cellular metabolism, hypoxia, necrosis, and proliferation. In our study, MYCN amplification occurred in 22% of the patients. Two patients had divergent MYCN results, potentially resulting from the heterogeneity of the tumor or underestimation of the mutational burden by biopsy bias. In line with a prior study by Sung et al. (33), we found that SUVmax and TLG had the potential to predict MYCN with AUCs of 0.771 and 0.776, respectively. However, histogram metrics and several second-order indices showed superior performance. Consequently, a radiomic model containing two PET features, namely, Histogram_Kurtosis and GLZLM_GLNU, was built and showed the strongest predictive power with an AUC of 0.871. Histogram_Kurtosis reflects the shape of the histogram distribution relative to a normal distribution. GLZLM_GLNU reflects the non-uniformity of the gray levels of the homogeneous zones in 3D. These two features have been proven to be promising parameters as biomarkers of tumor heterogeneity in various malignancies (34–36). A higher GLZLM_GLNU and a lower Histogram_Kurtosis, which indicate higher spatial heterogeneity, correlated with a higher possibility of MYCN amplification. Recently, Qian et al. reported that the radiomic signature containing both PET and CT features had a good ability to predict MYCN amplification (37). However, the majority of the features were obtained from wavelet transformed images, which decompose an image by using spatially oriented frequency filters but require intensive computation and may suffer from low reproducibility (38). Despite the methodology differences, we both showed that a high intratumor heterogeneity was associated with MYCN amplification. Since neuroblastoma is remarkably heterogeneous, which might require at least two solid tumor areas to provide a more accurate genomic diagnosis (39), texture features fully portraying the entire tumor might provide important complementary information about molecular profiling.
Our second step was to evaluate whether intratumor heterogeneity could provide prognostic information in pretreatment neuroblastoma. A recent study reported that high intratumor metabolic heterogeneity on 18F-FDG PET/CT was a strong prognostic factor in 38 children with newly diagnosed neuroblastoma (40), and it was the first report identifying metabolic heterogeneity as a prognostic biomarker of neuroblastoma. The authors used the area under the curve of the cumulative SUV-volume histograms (AUC-CSHs), which is a histogram-based first-order feature that describes the percentage of total tumor volume above the percent threshold of SUVmax, as an intratumor heterogeneity index. Lower AUC-CSH indicated higher heterogeneity of the tumor and poorer outcomes. Although the histogram analysis appears promising and simple, the major pitfalls of the histogram analysis are the lack of information on the spatial organization of tumors and that it is not straightforward which might lead to errors (34, 41). In another recently published study of 18 children with high-risk neuroblastoma, Fiz et al. demonstrated that intratumor heterogeneity on 18fluorine-dihydroxyphenylalanine (18F-DOPA) PET/CT was closely associated with metastatic burden and had certain prognostic value (42). In the current study, we further expanded that intratumor heterogeneity was a prognostic biomarker in neuroblastoma, with a much larger cohort and a higher order of texture analysis, which further improves quantitative histogram approaches by introducing the spatial dimension. Multivariate analysis identified GLRLM_RLNU and Histogram_Entropy as the independently significant predictors for EFS. GLRLM_RLNU gives the size of homogeneous runs for each gray level. A similar run length results in low values of GLRLM_RLNU. On the contrary, a high value is indicative of heterogeneity. Studies have reported that GLRLM_RLNU extracted from PET had the potential for predicting treatment response and prognosis (43, 44). On the other hand, Histogram_Entropy measures the randomness of voxel distribution and has been established as an important biomarker reflecting heterogeneity in various MRI and PET studies (43, 45). In accordance with previous studies (40, 42), we found that high rad-risk, defined as patients with both a high GLRLM_RLNU and a high Histogram_Entropy, indicating a high intratumor heterogeneity, was the most significant independent factor for EFS after adjusting for clinicopathological factors.
To further evaluate the ability of rad-risk in the refinement of risk stratification, we incorporated rad-risk into the existing risk stratification schema and compared it to volumetric indices. The results showed that the majority of patients with clinical non-high risk had a low rad-risk, indicating a relatively homogeneous tumor. Among high-risk neuroblastoma, rad-risk effectively distinguished patients with distinct outcomes both in the training and test sets. In addition, despite that intratumor heterogeneity highly correlated with MTV and TLG, rad-risk outperformed the volumetric indices and showed the highest ability to predict the outcome. These findings indicate that PET-based intratumor heterogeneity might have independent prognostic information, which may help substratify neuroblastoma patients for more refined risk-adapted treatment approaches in the future.
The limitations of this study are as follows: first, this is a retrospective study with a relatively small sample size in a single center. Second, 123I-mIBG scans were not performed in our cohort, since 123I-MIBG is not yet available in our country. The disadvantages of the 123I-mIBG scan, including limited spatial resolution and lower sensitivity in soft tissue lesions or small lesions, limit its value in radiomic analysis in neuroblastoma. Future efforts in PET-based texture features using novel radiopharmaceuticals such as 18F-fluorometaguanidine and 124I-mIBG might yield important predictive or prognostic information. Third, this study evaluated the features of primary tumor and captured less information outside the primary site, such as metastatic lesions or metastatic burden, which could be of important prognostic value. An additional limitation is that no separate cohort was used for validation regarding the prediction of MYCN amplification due to the limited number of patients with amplified MYCN. A large cohort with external validation should be warranted in the future.
In summary, PET-based intratumor heterogeneity could serve as a powerful and non-invasive approach to predict MYCN amplification and survival outcome in newly diagnosed neuroblastoma, providing a potential approach to refine the risk stratification in children with high-risk diseases. Further validation with a larger cohort is required.
The original contributions presented in the study are included in the article/Supplementary Material. Further inquiries can be directed to the corresponding authors.
This retrospective study was approved by the Ethics Committee of Xin Hua Hospital Affiliated to Shanghai Jiao Tong University School of Medicine and the requirement for informed consent was waived.
ChL, HW, and SC contributed to the conception and design of the study. ChL and SC organized the database. ChL and SC performed the statistical analysis. CaL, SW, YY, FF, and HF performed the data analysis and interpretation. ChL and SC wrote the first draft of the manuscript. CaL, SW, YY, FF, and HF wrote sections of the manuscript. ChL, HW, and SC edited the manuscript. All authors contributed to manuscript revision, read, and approved the submitted version.
This study has been supported by the National Natural Science Funds (81801731 and 81901775).
The authors declare that the research was conducted in the absence of any commercial or financial relationships that could be construed as a potential conflict of interest.
All claims expressed in this article are solely those of the authors and do not necessarily represent those of their affiliated organizations, or those of the publisher, the editors and the reviewers. Any product that may be evaluated in this article, or claim that may be made by its manufacturer, is not guaranteed or endorsed by the publisher.
The Supplementary Material for this article can be found online at: https://www.frontiersin.org/articles/10.3389/fonc.2022.896593/full#supplementary-material
1. van Groningen T, Koster J, Valentijn LJ, Zwijnenburg DA, Akogul N, Hasselt NE, et al. Neuroblastoma is composed of two super-enhancer-associated differentiation states. Nat Genet (2017) 49(8):1261–6. doi: 10.1038/ng.3899
2. Cohn SL, Pearson AD, London WB, Monclair T, Ambros PF, Brodeur GM, et al. The international neuroblastoma risk group (INRG) classification system: An INRG task force report. J Clin Oncol (2009) 27(2):289–97. doi: 10.1200/JCO.2008.16.6785
3. Siegel RL, Miller KD, Fuchs HE, Jemal A. Cancer statistics, 2021. CA Cancer J Clin (2021) 71(1):7–33. doi: 10.3322/caac.21654
4. Tadeo I, Berbegall AP, Castel V, Garcia-Miguel P, Callaghan R, Pahlman S, et al. Extracellular matrix composition defines an ultra-high-risk group of neuroblastoma within the high-risk patient cohort. Br J Cancer (2016) 115(4):480–9. doi: 10.1038/bjc.2016.210
5. Junttila MR, de Sauvage FJ. Influence of tumour micro-environment heterogeneity on therapeutic response. Nature (2013) 501(7467):346–54. doi: 10.1038/nature12626
6. Meacham CE, Morrison SJ. Tumour heterogeneity and cancer cell plasticity. Nature (2013) 501(7467):328–37. doi: 10.1038/nature12624
7. Chicklore S, Goh V, Siddique M, Roy A, Marsden PK, Cook GJ. Quantifying tumour heterogeneity in 18F-FDG PET/CT imaging by texture analysis. Eur J Nucl Med Mol Imaging (2013) 40(1):133–40. doi: 10.1007/s00259-012-2247-0
8. van Velden FH, Cheebsumon P, Yaqub M, Smit EF, Hoekstra OS, Lammertsma AA, et al. Evaluation of a cumulative SUV-volume histogram method for parameterizing heterogeneous intratumoural FDG uptake in non-small cell lung cancer PET studies. Eur J Nucl Med Mol Imaging (2011) 38(9):1636–47. doi: 10.1007/s00259-011-1845-6
9. Yoo SH, Kang SY, Cheon GJ, Oh DY, Bang YJ. Predictive role of temporal changes in intratumoral metabolic heterogeneity during palliative chemotherapy in patients with advanced pancreatic cancer: A prospective cohort study. J Nucl Med (2020) 61(1):33–9. doi: 10.2967/jnumed.119.226407
10. Pinho DF, King B, Xi Y, Albuquerque K, Lea J, Subramaniam RM. Value of intratumoral metabolic heterogeneity and quantitative (18)F-FDG PET/CT parameters in predicting prognosis for patients with cervical cancer. AJR Am J roentgenol (2020) 214(4):908–16. doi: 10.2214/AJR.19.21604
11. Yanik GA, Parisi MT, Shulkin BL, Naranjo A, Kreissman SG, London WB, et al. Semiquantitative mIBG scoring as a prognostic indicator in patients with stage 4 neuroblastoma: A report from the children's oncology group. J Nucl Med (2013) 54(4):541–8. doi: 10.2967/jnumed.112.112334
12. Katzenstein HM, Cohn SL, Shore RM, Bardo DM, Haut PR, Olszewski M, et al. Scintigraphic response by 123I-metaiodobenzylguanidine scan correlates with event-free survival in high-risk neuroblastoma. J Clin Oncol (2004) 22(19):3909–15. doi: 10.1200/JCO.2004.07.144
13. Liu CJ, Lu MY, Liu YL, Ko CL, Ko KY, Tzen KY, et al. Risk stratification of pediatric patients with neuroblastoma using volumetric parameters of 18F-FDG and 18F-DOPA PET/CT. Clin Nucl Med (2017) 42(3):e142–e8. doi: 10.1097/RLU.0000000000001529
14. Lee JW, Cho A, Yun M, Lee JD, Lyu CJ, Kang WJ. Prognostic value of pretreatment FDG PET in pediatric neuroblastoma. Eur J Radiol (2015) 84(12):2633–9. doi: 10.1016/j.ejrad.2015.09.027
15. Papathanasiou ND, Gaze MN, Sullivan K, Aldridge M, Waddington W, Almuhaideb A, et al. 18F-FDG PET/CT and 123I-metaiodobenzylguanidine imaging in high-risk neuroblastoma: Diagnostic comparison and survival analysis. J Nucl Med (2011) 52(4):519–25. doi: 10.2967/jnumed.110.083303
16. Li C, Zhang J, Chen S, Huang S, Wu S, Zhang L, et al. Prognostic value of metabolic indices and bone marrow uptake pattern on preoperative 18F-FDG PET/CT in pediatric patients with neuroblastoma. Eur J Nucl Med Mol Imaging (2018) 45(2):306–15. doi: 10.1007/s00259-017-3851-9
17. Boellaard R, Delgado-Bolton R, Oyen WJ, Giammarile F, Tatsch K, Eschner W, et al. FDG PET/CT: EANM procedure guidelines for tumour imaging: version 2.0. Eur J Nucl Med Mol Imaging (2015) 42(2):328–54. doi: 10.1007/s00259-014-2961-x
18. Peerawaranun P, Landier J, Nosten FH, Nguyen TN, Hien TT, Tripura R, et al. Intracluster correlation coefficients in the greater Mekong subregion for sample size calculations of cluster randomized malaria trials. Malar J (2019) 18(1):428. doi: 10.1186/s12936-019-3062-x
19. Dissaux G, Visvikis D, Da-Ano R, Pradier O, Chajon E, Barillot I, et al. Pretreatment (18)F-FDG PET/CT radiomics predict local recurrence in patients treated with stereotactic body radiotherapy for early-stage non-small cell lung cancer: A multicentric study. J Nucl Med (2020) 61(6):814–20. doi: 10.2967/jnumed.119.228106
20. Mukaka MM. Statistics corner: A guide to appropriate use of correlation coefficient in medical research. Malawi Med J (2012) 24(3):69–71.
21. Gerlinger M, Rowan AJ, Horswell S, Math M, Larkin J, Endesfelder D, et al. Intratumor heterogeneity and branched evolution revealed by multiregion sequencing. N Engl J Med (2012) 366(10):883–92. doi: 10.1056/NEJMoa1113205
22. Basler L, Gabrys HS, Hogan SA, Pavic M, Bogowicz M, Vuong D, et al. Radiomics, tumor volume, and blood biomarkers for early prediction of pseudoprogression in patients with metastatic melanoma treated with immune checkpoint inhibition. Clin Cancer Res (2020) 26(16):4414–25. doi: 10.1158/1078-0432.CCR-20-0020
23. Sun R, Limkin EJ, Vakalopoulou M, Dercle L, Champiat S, Han SR, et al. A radiomics approach to assess tumour-infiltrating CD8 cells and response to anti-PD-1 or anti-PD-L1 immunotherapy: An imaging biomarker, retrospective multicohort study. Lancet Oncol (2018) 19(9):1180–91. doi: 10.1016/S1470-2045(18)30413-3
24. Moon SH, Kim J, Joung JG, Cha H, Park WY, Ahn JS, et al. Correlations between metabolic texture features, genetic heterogeneity, and mutation burden in patients with lung cancer. Eur J Nucl Med Mol Imaging (2019) 46(2):446–54. doi: 10.1007/s00259-018-4138-5
25. Minervini A, Di Cristofano C, Gacci M, Serni S, Menicagli M, Lanciotti M, et al. Prognostic role of histological necrosis for nonmetastatic clear cell renal cell carcinoma: Correlation with pathological features and molecular markers. J Urol (2008) 180(4):1284–9. doi: 10.1016/j.juro.2008.06.036
26. Rakheja R, Makis W, Tulbah R, Skamene S, Holcroft C, Nahal A, et al. Necrosis on FDG PET/CT correlates with prognosis and mortality in sarcomas. AJR Am J Roentgenol (2013) 201(1):170–7. doi: 10.2214/AJR.12.9795
27. Hatt M, Majdoub M, Vallières M, Tixier F, Le Rest CC, Groheux D, et al. 18F-FDG PET uptake characterization through texture analysis: investigating the complementary nature of heterogeneity and functional tumor volume in a multi-cancer site patient cohort. J Nucl Med (2015) 56(1):38–44. doi: 10.2967/jnumed.114.144055
28. Pfaehler E, Mesotten L, Zhovannik I, Pieplenbosch S, Thomeer M, Vanhove K, et al. Plausibility and redundancy analysis to select FDG-PET textural features in non-small cell lung cancer. Med Phys (2021) 48(3):1226–38. doi: 10.1002/mp.14684
29. Matthay KK, Maris JM, Schleiermacher G, Nakagawara A, Mackall CL, Diller L, et al. Neuroblastoma. Nat Rev Dis Primers (2016) 2:16078. doi: 10.1038/nrdp.2016.78
30. Chen X, Wang H, Huang K, Liu H, Ding H, Zhang L, et al. CT-based radiomics signature with machine learning predicts MYCN amplification in pediatric abdominal neuroblastoma. Front Oncol (2021) 11:687884. doi: 10.3389/fonc.2021.687884
31. Wu H, Wu C, Zheng H, Wang L, Guan W, Duan S, et al. Radiogenomics of neuroblastoma in pediatric patients: CT-based radiomics signature in predicting MYCN amplification. Eur Radiol (2021) 31(5):3080–9. doi: 10.1007/s00330-020-07246-1
32. Di Giannatale A, Di Paolo PL, Curione D, Lenkowicz J, Napolitano A, Secinaro A, et al. Radiogenomics prediction for MYCN amplification in neuroblastoma: A hypothesis generating study. Pediatr Blood Cancer (2021) 68(9):e29110. doi: 10.22541/au.161144128.80677267/v1
33. Sung AJ, Weiss BD, Sharp SE, Zhang B, Trout AT. Prognostic significance of pretreatment (18)F-FDG positron emission tomography/computed tomography in pediatric neuroblastoma. Pediatr Radiol (2021) 51(8):1400–5. doi: 10.1007/s00247-021-05005-y
34. Just N. Improving tumour heterogeneity MRI assessment with histograms. Br J Cancer (2014) 111(12):2205–13. doi: 10.1038/bjc.2014.512
35. Acar E, Turgut B, Yigit S, Kaya G. Comparison of the volumetric and radiomics findings of 18F-FDG PET/CT images with immunohistochemical prognostic factors in local/locally advanced breast cancer. Nucl Med Commun (2019) 40(7):764–72. doi: 10.1097/MNM.0000000000001019
36. Toyama Y, Hotta M, Motoi F, Takanami K, Minamimoto R, Takase K. Prognostic value of FDG-PET radiomics with machine learning in pancreatic cancer. Sci Rep (2020) 10(1):17024. doi: 10.1038/s41598-020-73237-3
37. Qian L, Yang S, Zhang S, Qin H, Wang W, Kan Y, et al. Prediction of MYCN amplification, 1p and 11q aberrations in pediatric neuroblastoma via pre-therapy 18F-FDG PET/CT radiomics. Front Med (Lausanne) (2022) 9:840777. doi: 10.3389/fmed.2022.840777
38. van Griethuysen JJM, Fedorov A, Parmar C, Hosny A, Aucoin N, Narayan V, et al. Computational radiomics system to decode the radiographic phenotype. Cancer Res (2017) 77(21):e104–e7.
39. López-Carrasco A, Berbegall AP, Martín-Vañó S, Blanquer-Maceiras M, Castel V, Navarro S, et al. Intra-tumour genetic heterogeneity and prognosis in high-risk neuroblastoma. Cancers (Basel) (2021) 13(20):5173. doi: 10.3390/cancers13205173
40. Liu J, Si Y, Zhou Z, Yang X, Li C, Qian L, et al. The prognostic value of (18)F-FDG PET/CT intra-tumoural metabolic heterogeneity in pretreatment neuroblastoma patients. Cancer Imaging (2022) 22(1):32. doi: 10.1186/s40644-022-00472-4
41. Rose CJ, O'Connor JP, Cootes TF, Taylor CJ, Jayson GC, Parker GJ, et al. Indexed distribution analysis for improved significance testing of spatially heterogeneous parameter maps: Application to dynamic contrast-enhanced MRI biomarkers. Magn Reson Med (2014) 71(3):1299–311. doi: 10.1002/mrm.24755
42. Fiz F, Bottoni G, Bini F, Cerroni F, Marinozzi F, Conte M, et al. Prognostic value of texture analysis of the primary tumour in high-risk neuroblastoma: An (18) f-DOPA PET study. Pediatr Blood Cancer (2022): e29910. doi: 10.1002/pbc.29910
43. Aerts HJ, Velazquez ER, Leijenaar RT, Parmar C, Grossmann P, Carvalho S, et al. Decoding tumour phenotype by noninvasive imaging using a quantitative radiomics approach. Nat Commun (2014) 5:4006. doi: 10.1038/ncomms5006
44. Chen SW, Shen WC, Lin YC, Chen RY, Hsieh TC, Yen KY, et al. Correlation of pretreatment (18)F-FDG PET tumor textural features with gene expression in pharyngeal cancer and implications for radiotherapy-based treatment outcomes. Eur J Nucl Med Mol Imaging (2017) 44(4):567–80. doi: 10.1007/s00259-016-3580-5
45. Atkinson C, Ganeshan B, Endozo R, Wan S, Aldridge MD, Groves AM, et al. Radiomics-based texture analysis of (68)Ga-DOTATATE positron emission tomography and computed tomography images as a prognostic biomarker in adults with neuroendocrine cancers treated with (177)Lu-DOTATATE. Front Oncol (2021) 11:686235. doi: 10.3389/fonc.2021.686235
Keywords: pediatric, neuroblastoma, 18F-FDG, PET/CT, intratumor heterogeneity, radiomics
Citation: Li C, Wang S, Li C, Yin Y, Feng F, Fu H, Wang H and Chen S (2022) Improved risk stratification by PET-based intratumor heterogeneity in children with high-risk neuroblastoma. Front. Oncol. 12:896593. doi: 10.3389/fonc.2022.896593
Received: 15 March 2022; Accepted: 20 September 2022;
Published: 24 October 2022.
Edited by:
Kyung Hyun Sung, UCLA Health System, United StatesReviewed by:
Guoqiang Shao, Nanjing Medical University, ChinaCopyright © 2022 Li, Wang, Li, Yin, Feng, Fu, Wang and Chen. This is an open-access article distributed under the terms of the Creative Commons Attribution License (CC BY). The use, distribution or reproduction in other forums is permitted, provided the original author(s) and the copyright owner(s) are credited and that the original publication in this journal is cited, in accordance with accepted academic practice. No use, distribution or reproduction is permitted which does not comply with these terms.
*Correspondence: Hui Wang, d2FuZ2h1aUB4aW5odWFtZWQuY29tLmNu; Suyun Chen, bnV5dXNAb3V0bG9vay5jb20=
†These authors share last authorship
Disclaimer: All claims expressed in this article are solely those of the authors and do not necessarily represent those of their affiliated organizations, or those of the publisher, the editors and the reviewers. Any product that may be evaluated in this article or claim that may be made by its manufacturer is not guaranteed or endorsed by the publisher.
Research integrity at Frontiers
Learn more about the work of our research integrity team to safeguard the quality of each article we publish.