- 1Departments of Oncology, Chongqing University Jiangjin Hospital, Chongqing, China
- 2Departments of Oncology, Jiangjin Central Hospital of Chongqing, Chongqing, China
In prior reports, extracellular matrix protein 1 (ECM1) upregulation has been reported in colorectal cancer (CRC) patient tumor tissues, and has been suggested to be related to the metastatic progression of CRC, although the underlying mechanisms have yet to be clarified. In this study, we found that ECM1 was overexpressed in both CRC tissues and cell lines. Upregulation of ECM1 was correlated with tumor size, lymph node status and TNM stage in CRC patients. Knocking down ECM1 suppressed CRC cell growth, migration and invasion, in addition to reducing the expression of Vimentin and increasing E-cadherin expression. The overexpression of ECM1, in contrast, yielded the opposite phenotypic outcomes while also promoting the expression of p-AKT, p-GSK3β, and Snail, which were downregulated when ECM1 was knocked down. Treatment with LY294002 and 740 Y-P reversed the impact upregulation and downregulation of ECM1 on CRC cell metastasis and associated EMT induction. In vivo analyses confirmed that ECM1 overexpression was able to enhance EMT induction and CRC tumor progression. In conclusion, ECM1 influences CRC development and progression in an oncogenic manner, and regulates CRC metastasis and EMT processes via the PI3K/AKT/GSK3β/Snail signaling axis.
Introduction
One of the most prevalent gastrointestinal malignancies in the world is colorectal cancer (CRC) (1). While 5-year survival rates for individuals with early-stage CRC are 80-90%, they decrease significantly to 40-60% among individuals with advanced-stage disease, and decline further to 5-10% for cases of metastatic CRC (2). Clarifying the molecular strategies governing the metastatic progression of CRC is thus crucial to identifying novel approaches to diagnosing this disease during its early stages and preventing its aggressive spread in patients.
The secretory glycoprotein, extracellular matrix protein 1 (ECM1), is associated with physiological processes including angiogenesis, the proliferation of epithelial cells, and skin differentiation, in addition to playing a role in tumor progression (3, 4). Recent studies have detected ECM1 overexpression in bladder cancer (5), glioblastoma (6), thyroid cancer (7), cholangiocarcinoma (8), and other epithelial malignancies (9), and the overexpression of ECM1 has also been shown to be related to the poor prognosis of cancer patients, such as pancreatic cancer (10), breast cancer (11), gastric cancer (12) and hepatocellular cancer patients (13). In prior reports, ECM1 mRNA and protein levels have been shown to be increased in CRC cancer tissue samples relative to normal tissues, with this upregulation being more pronounced in CRC patients exhibiting lymph node metastases (14, 15). The mechanisms underlying such upregulation, however, have yet to be clarified.
In the present study, we confirmed that ECM1 was overexpressed in CRC cancer tissues and cell lines. To further clarify the role of ECM1 in CRC, we performed in vitro and in vivo assays after the knockdown or overexpression of ECM1. We additionally explore the mechanisms whereby ECM1 regulates the growth, invasion, and migration of CRC cells and associated metastatic changes. Through this approach, we found that the regulation of the occurrence and progression of CRC by ECM1 was mediated through the PI3K/AKT/GSK3β/Snail signaling pathway.
Methods
Oncomine Data Collection
Oncomine (www.oncomine.org) was used to compare ECM1 expression levels between CRC tissues and normal tissues.
Patient Recruitment and Sample Collection
Tissue samples were obtained from CRC patients undergoing radical surgical treatment at Jiangjin Central Hospital of Chongqing between January 2020 and June 2021, with 65 CRC tumor tissue samples and 60 paired paracancerous tissue samples being collected, formalin-fixed, and paraffin-embedded. In addition, 10 fresh pairs of CRC patient tissues were collected between August 2021 and December 2021 and were stored at -80°C. Samples were obtained from patients with histologically confirmed diagnoses that had not undergone preoperative surgical, immunotherapeutic, or chemotherapeutic treatment. The Institutional Ethics Committee of Jiangjin Central Hospital approved present study(KY20200010), with all contributors having presented the letter of informed consent to participate.
Immunohistochemistry
Formalin-fixed paraffin-embedded tissues were sliced to prepare 3 μm thick sections. Antigen retrieval was conducted using citrate buffer (pH = 6; ZSGB-BIO, ZLI-9064) based on the protocols included in an IHC staining kit (ZSGB-BIO, PV-9000). Slides were probed overnight with primary anti-ECM1(1:250; Abcam) at 4°C, followed by incubation with an appropriate secondary antibody at room temperature for 30 min. In negative control sections, PBS was employed in lieu of primary antibody. As per a previous study (12), IHC scoring was conducted by assessing the percentage of stained cells (1 = < 25%, 2 = 25-50%, 3 = 51-75%, and 4 = >75%) and multiplying this score by the staining intensity (0, 1, 2, or 3) for a final possible score of 0-12. Scores < 4 were considered to indicate low levels of ECM1 expression, while all other scores were indicative of high expression. Two experienced pathologists blinded to patient characteristics independently scored all samples.
Cell Culture
NCM460, HCT116, HCT15, HT29, SW480, 293T, and SW620 were purchased from BeNa Culture Collection (Beijing, China). NCM460 and 293T cells were grown in HG media (Gibco), while SW620, HCT116, HT29, SW480, and HCT15 cells were grown in RPMI-1640 (Gibco) including penicillin/streptomycin (Gibco) and 10% FBS (Gibco). All cells were cultured in a humidified 5% CO2 incubator at 37°C.
Transfection
Cells were added to 6-well plates (2× 10⁵/well) and grown to 40-60% confluence, at which time Lipofectamine 2000 (Invitrogen) was used to transfect cells with appropriate siRNAs (Genepharma), followed by incubation for 6 h in serum-free media, after which media was exchanged for media containing 10% FBS. Following an additional 24 h incubation, qPCR was performed to assess ECM1 knockdown efficiency, with Western blotting and cell functional assays being performed at 48 h post-transfection.
siRNA NC sense: 5’-UUCUCCGAACGUGUCACGUTT-3’, antisense: 5’-ACGUGACACGUUCGGAGAATT-3’; siRNA-1 sense: 5’-GAAGCAAUGAGCCGAUUCUTT-3’, antisense: 5’-AGAAUCGGCUCAUUGCUUCTT-3’; siRNA-2 sense: 5’-GUGGAAACCAAAGAGUUCUTT-3’, antisense: 5’-AGAACUCUUUGGUUUCCACTT-3’; siRNA-3 sense: 5’-GAGGAGAAAUUAACCUUCATT-3’, antisense: 5’-UGAAGGUUAAUUUCUCCUCTT-3’.
Lentiviral Transduction
HEK293T cells were co-transfected with the pLVX-CMV-IRES-EGFP-puro empty vector or pLVX-CMV-IRES-EGFP-puro-ECM1 vector along with lentiviral packaging plasmids (psPAX2 and pMD2.G). After 72 h, supernatants were collected, centrifuged for 20 min at 3000 rpm, filtered, centrifuged at 4°C for 20 min at 5000 rmp and concentrated. The resultant lentiviral concentrates were then used to infect cells, generating cell lines expressing ECM1 or the empty vector control.
qRT-PCR
The Tsingzol RNA Extraction Reagent (Tsingke, TSP401) was utilized to extract RNA from cells and tissue samples, after which cDNA was produced with a ReverTra Ace® qPCR RT Kit (TOYOBO, FSQ-101). Subsequent qPCR reactions were performed employing SYBR® Green Realtime PCR Master Mix (TOYOBO, QPK-201) with an Applied Biosystems 7300Plus Real-Time PCR Instrument (Applied Biosystems, MA, USA). The 2-ΔΔCt approach was utilized for the assessment of relative gene expression, with analyses being conducted in triplicate. Utilized primers are as follows: β-actin-F: 5’-ACCCCGTGCTGCACCGAG-3’, β-actin-R: 5’-TCCCGGCCAGCCAGGTCCA-3’; ECM1-F: 5’-CCTGGGCTGATCCACAACAT-3’; ECM1-R:5’-TTGGCGTTCTCAGTGTCTCC-3’.
Western Blotting
RIPA Buffer (Beyotime Biotechnology, China) containing 1% PMSF (Thermo, USA) was used to extract protein from cell and tissue samples, after which a BCA Kit (Beyotime) was employed to measure protein concentrations. Equal protein amounts from individual samples (cells: 30 ug; tissues: 60 ug) were subsequently separated via 10% SDS-PAGE and transferred to PVDF membranes (Millipore) that were then blocked for 2 h with 5% non-fat milk at room temperature, followed by overnight incubation with primary antibodies diluted in TBST containing 5% non-fat milk at 4°C. Blots were then incubated at room temperature with HRP-conjugated anti-rabbit or anti-mouse IgG (ZSBIO, China), after which a chemiluminescent imaging system was used for protein band detection. Primary antibodies included antibodies specific for the following, all of which were diluted at 1:1000 before use: ECM1 (Abcam, UK), E-cadherin (CST, USA), Vimentin (CST, USA), Snail (CST, USA), AKT (CST, USA), p-AKT (Ser473) (CST, USA), GSK3β (Novus, USA), p-GSK3β (Ser9) (Novus, USA), GAPDH (CST, USA). Image J was used for quantitative analyses.
Cell Proliferation Assays
CCK-8 and colony formation assays were used to appraise cellular proliferation. Briefly, cells were added to 96-well plates (5000 cells/well in 100 uL) and incubated until adherent. CCK-8 reagent (10 uL; CK04, Tongren Company, Japan) was then added to each well after 0, 24, 48, or 72 h, followed by an additional 2 h incubation at 37°C. Absorbance at 450 nm was subsequently analyzed with a microplate reader (FLUOstar Omega, BMG LABTECH).
Colony Formation Assay
Cells were added to 6-well plates (1000/well) and cultured until colony formation was evident, at which time 4% paraformaldehyde was used to fix colonies which were then stained for 1 min with 0.2% crystal violet at ambient temperature. Colonies were then counted using ImageJ.
Cell Cycle and Apoptosis
To assess cell cycle progression, cells were added to 6-well plates (3× 10⁵/well) and cultivated for 24 h, at which time they were harvested using trypsin, rinsed with PBS, and fixed for 24 h with 70% ethanol at 4°C. Cells were subsequently stained with an AnnexinV/PI double staining kit (BD, USA) based on provided directions, followed by analysis via flow cytometry (BD, USA). Apoptotic cell death was assessed by plating cells under the same conditions, and then harvesting and rinsing these cells three times using PBS prior to resuspension in 100 uL of binding buffer. Cells were next stained with 5 uL of Annexin V-FITC and 10 uL of PI for 15 min on ice, after which 400 uL of binding buffer was added. Cells were analyzed within 1 h via flow cytometry (BD, USA).
Transwell Assays
Transwell polycarbonate inserts (8 μm pore size) that were or were not coated with Matrigel (plain RPMI-1640:Matrigel = 9:1; BD) were used with 24-well plates to assess cellular migration and invasion. Cells (2x10⁵ in 200 uL) were added to the upper chamber of each well, while 600 uL of RPMI-1640 contaning 20%FBS was added to the lower chamber. Following culture for 24 h, cells were fixed with 4% paraformaldehyde for 30 min, stained for 1 min with crystal violet, and non-migratory/invasive cells were eliminated with a cotton swab. Those cells bound to the lower chamber surface were then imaged via microscopy, with three random fields of view per sample being assessed.
Wound-Healing Assays
Cells were added to 6-well plates (1×10⁶/well) and were grown until 90% confluent, at which time a 200 uL pipette tip was used to generate a scratch wound in the monolayer surface. Cells were then rinsed with PBS and cultured in RPMI-1640 containing 1%FBS for 24 h, with the rate of wound healing (%) being determined by measuring the area between the two sides of the wound using ImageJ. Wound healing rate = (area at 0 h - area at 24 h)/area at 0 h.
Xenograft Mouse Model
Male BALB/c nude mice (4 weeks old, Laboratory Animal Center of Shanghai, Shanghai, China) were housed in a temperature-controlled facility with a natural day/night cycle and free access to water and food. Laboratory Animal Welfare and Ethics Committee of Chongqing University approved all animal studies, which were performed in a manner consistent with the Guide for the Care and Use of Laboratory Animals. A xenograft tumor model was established by subcutaneously injecting mice in the right flank with HCT116-NC or HCT116-ECM1 cells (2×10⁶ cells/50ul). On day 25 post-inoculation, mice were anesthetized and humanely euthanized, at which time tumors were weighed and collected for downstream analyses.
Statistics Analysis
Statistical analyses were performed using SPSS 26.0, GraphPad Prism 9.0, and ImageJ. Differences were compared between groups using two-tailed t-tests, while the relationships between ECM1 expression and clinicopathological characteristics were evaluated via Pearson χ2 analyses. In vitro studies were repeated in triplicate and reported as means ± standard deviation (x ± s). *P<0.05, **P<0.01, ***P<0.001, and ****P<0.0001.
Results
ECM1 Is Upregulated in CRC Tumor Tissues and Cell Lines
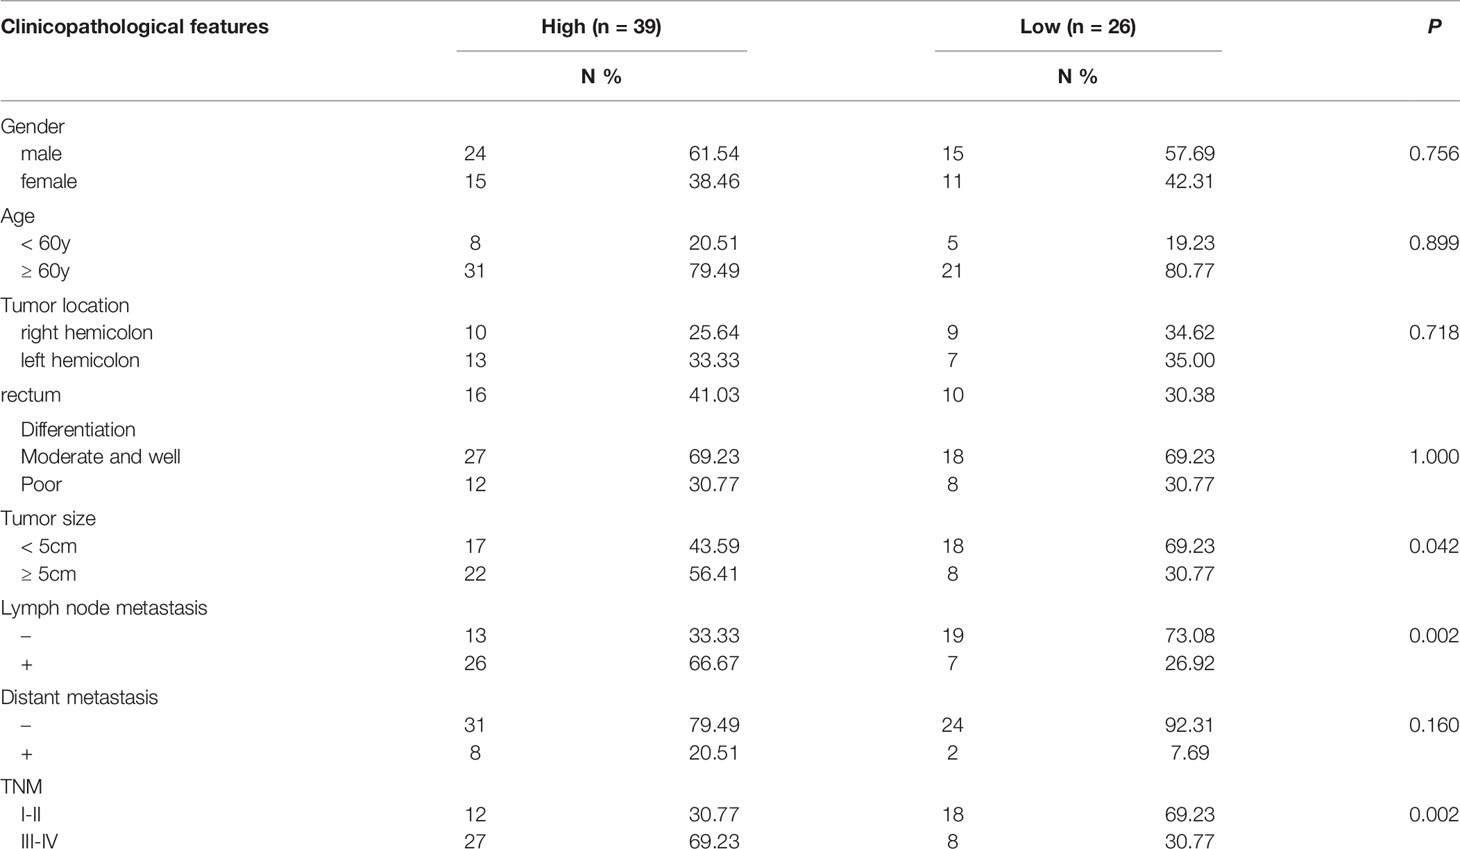
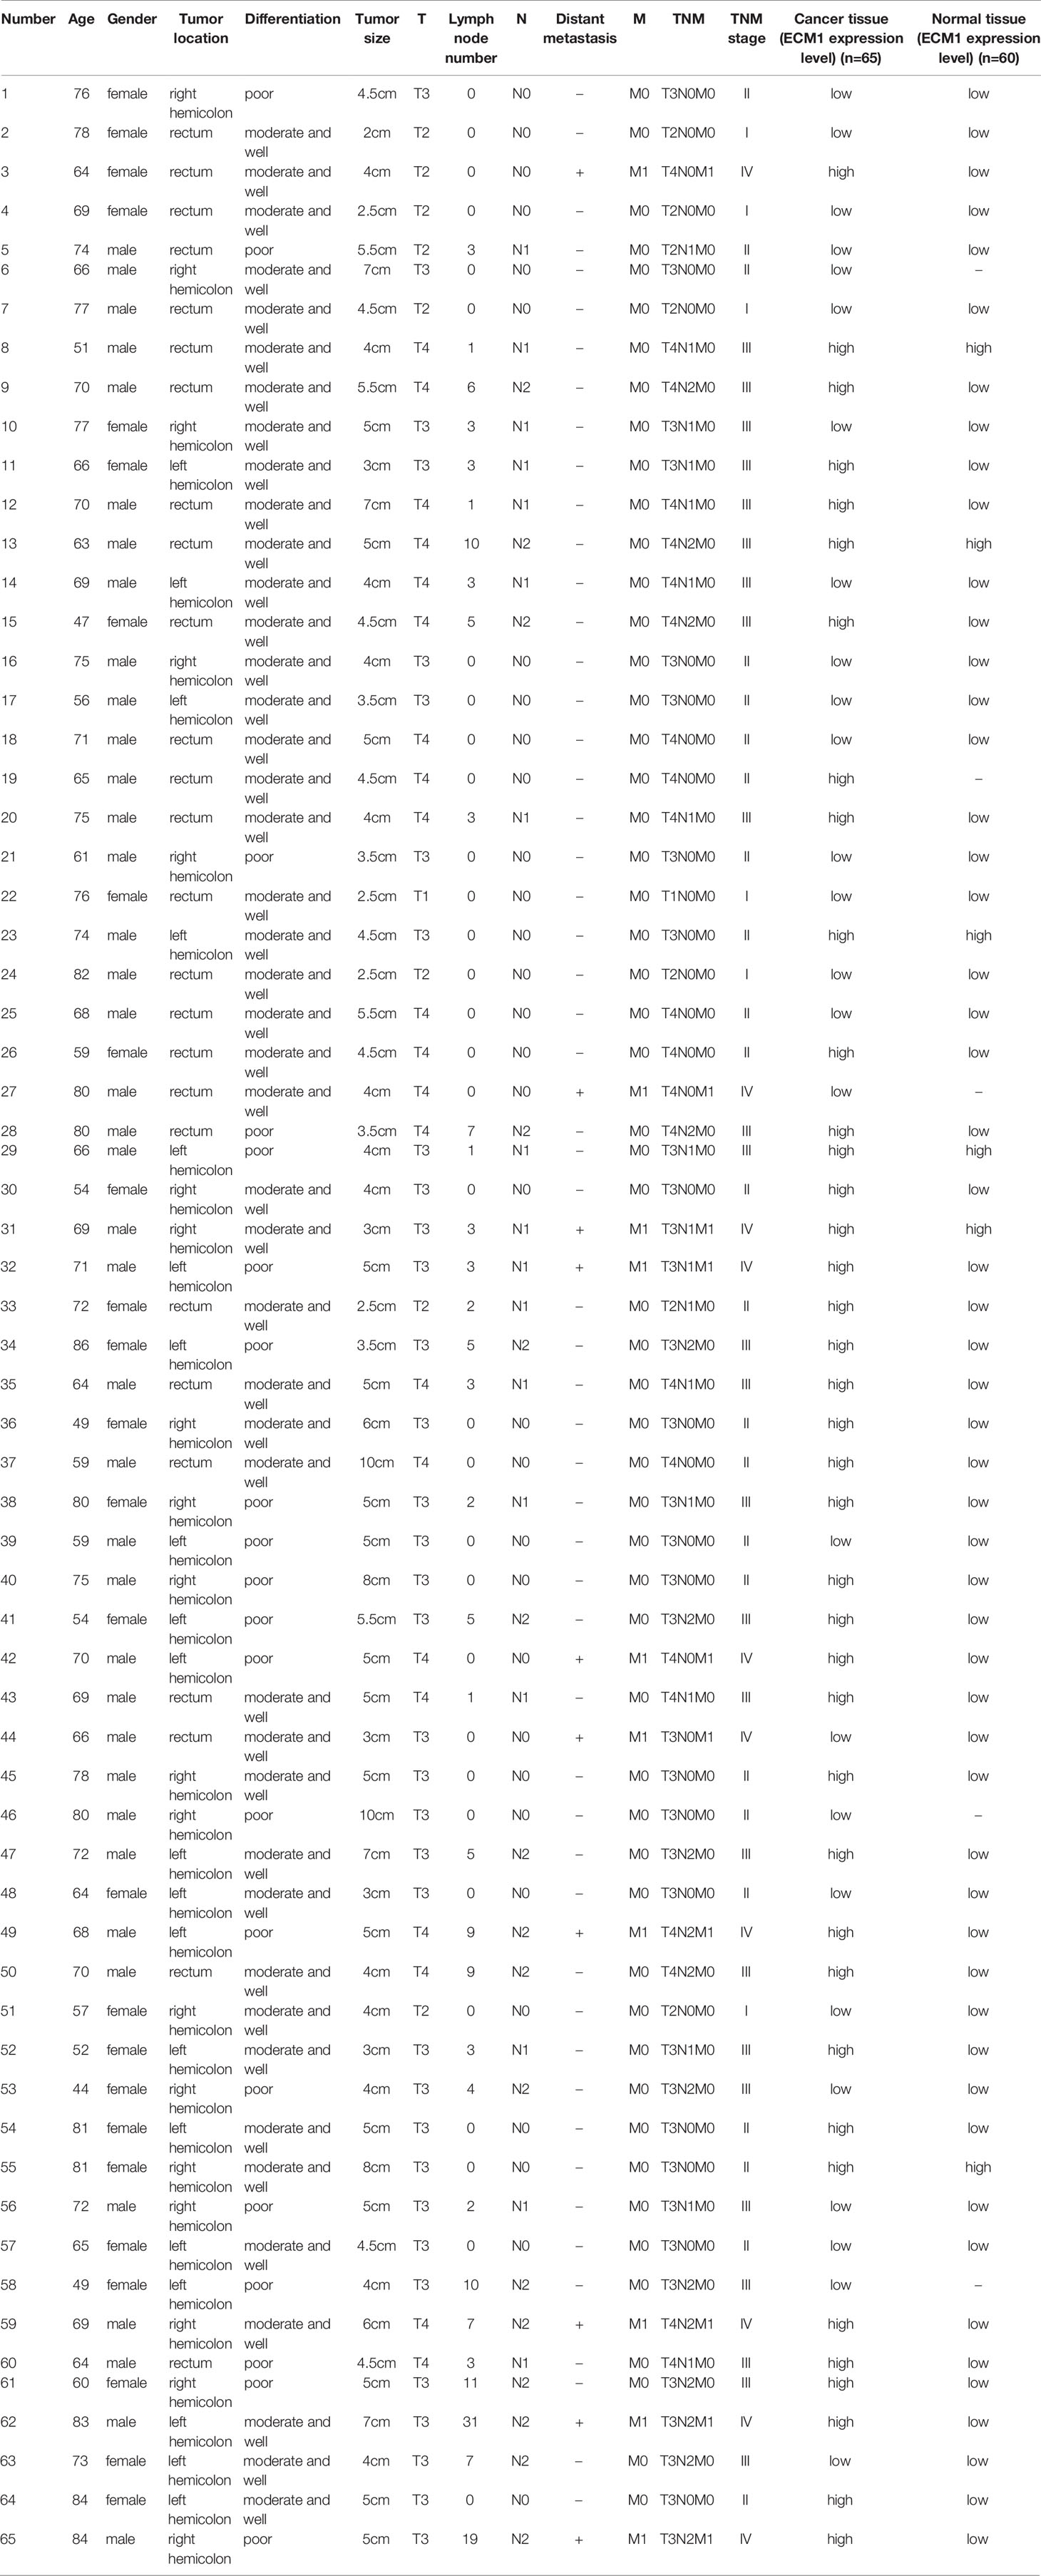
An initial analysis of the Oncomine database revealed ECM1 to be highly upregulated in CRC patient tumor tissues as compared to normal tissue samples (Figure 1A). Subsequent IHC, qPCR, and Western blotting analyses similarly confirmed the upregulation of ECM1 in CRC tumors relative to normal paracanceorus tissues (Table 1 and Figures 1B–D). IHC scores were then employed to evaluate the association between ECM1 expression and CRC patient clinicopathological features, revealing the expression of ECM1 to be significantly associated with CRC patient TNM staging (P<0.001), lymph node metastasis (P<0.001), and tumor size (P<0.05) (Tables 2, 3). Consistent with the above results, higher levels of ECM1 expression were observed in CRC cell lines (SW480, HT29, HCT15, HCT116, SW620) relative to those in normal colonic epithelial cells (NCM460) at both the protein and mRNA levels (Figures 1E, F).
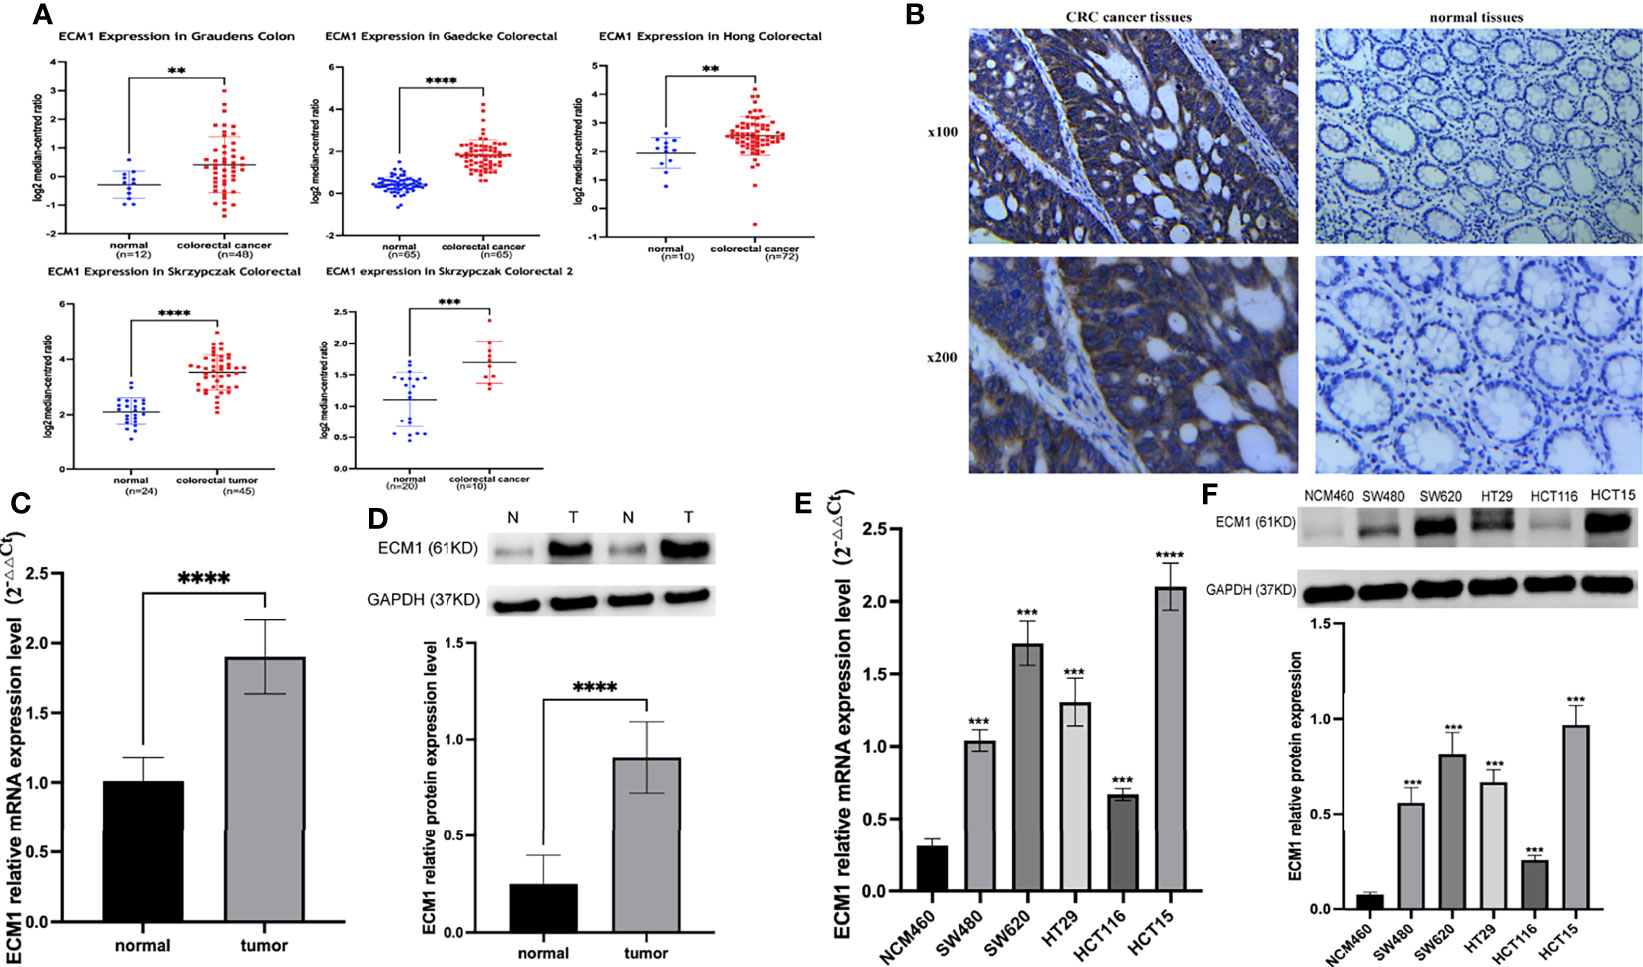
Figure 1 Analysis of ECM1 expression in CRC tumors and cell lines. (A) ECM1 levels in CRC patient tumors and adjacent normal tissue samples were analyzed using the Oncomine database. (B) Representative IHC staining results for CRC patient tumor and paracancerous tissues. (C) ECM1 mRNA expression in CRC tumors and paracancerous tissues. (D) ECM1 protein levels in CRC tumors and paracancerous tissues. (E) ECM1 mRNA levels in CRC and colonic epithelial cell lines. (F) ECM1 protein levels in CRC (SW480, SW620, HT29, HCT116, HCT15) and colonic epithelial (NCM460) cell lines. Data are means ± SD (**P < 0.01, ***P < 0.001, ****P < 0.0001).
ECM1 Regulates the In Vitro Proliferation of CRC Cells
As the highest and lowest levels of ECM1 were respectively observed in HCT15 and HCT116 cells, ECM1 was next knocked down and overexpressed in these respective cell lines. Both qPCR and Western blotting were used to confirm effective knockdown using three different ECM1-specific siRNA constructs (Figures 2A, B), with siRNA-1 being used for subsequent studies. Similarly, qPCR and Western blotting were used to confirm the efficiency of ECM1 overexpression, (Figures 2C, D). Colony formation and CCK-8 assays were then conducted to assess cellular proliferation, revealing that ECM1 knockdown significantly impaired the proliferative ability of these CRC cells, whereas its overexpression enhanced such proliferation relative to that observed for control cells (Figures 2E–H). Together, the achieved findings suggest that ECM1 is able to promote the in vitro proliferation of CRC cells.
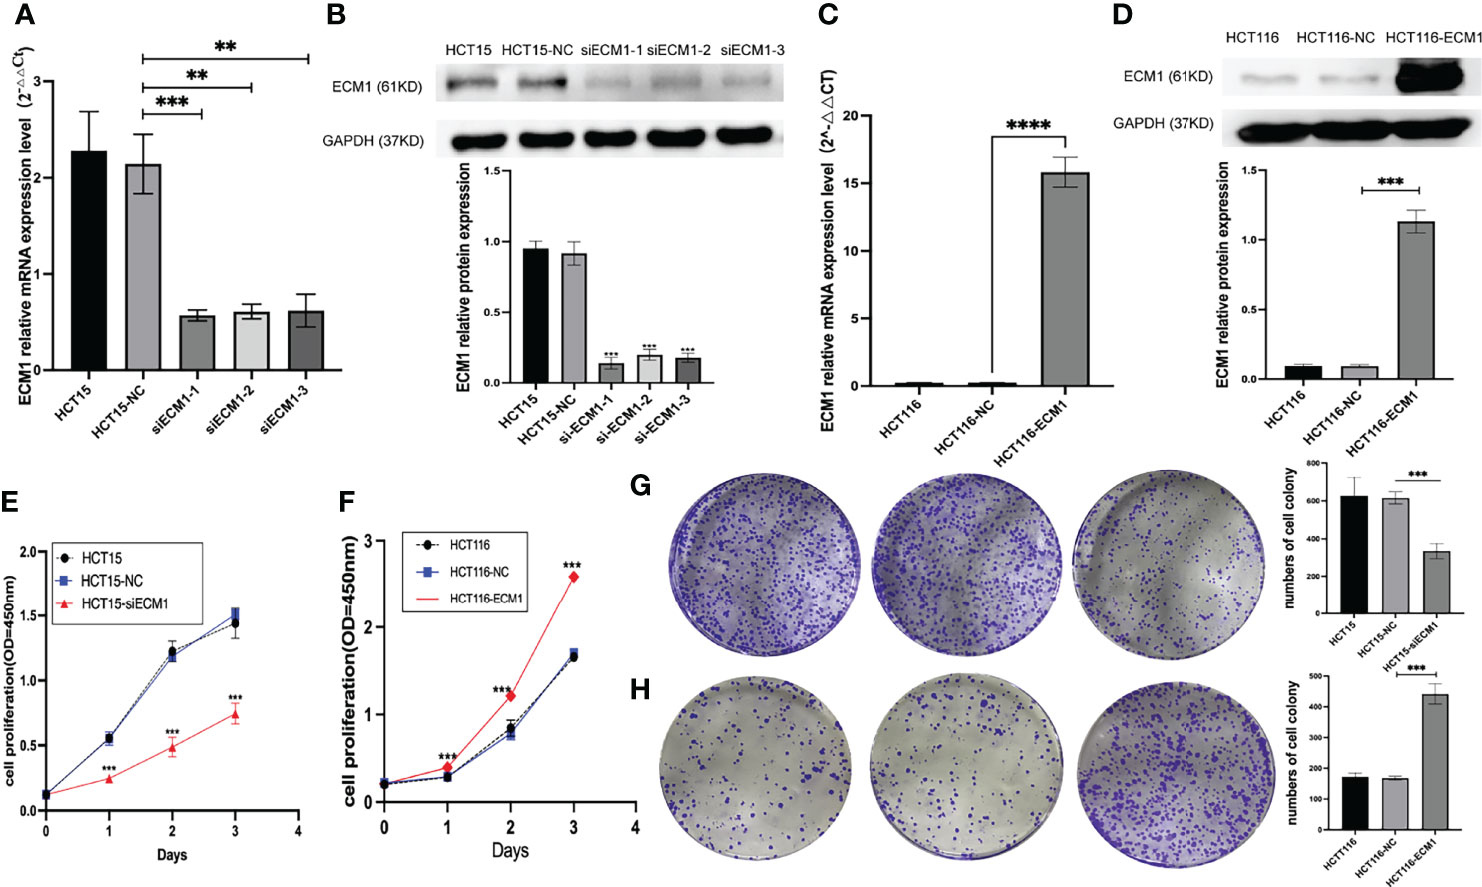
Figure 2 ECM1 regulates proliferative activity in CRC cells. (A, B). Western blotting and qPCR were performed to assess ECM1 knockdown. (C, D). Western blotting and qPCR were employed to assess ECM1 expression in CRC cells following its overexpression. CCK-8 and colony formation assays were used to assess cellular proliferation, revealing that (E, G) ECM1 knockdown suppressed HCT15 cell proliferation relative to control cells, while (F, H) ECM1 overexpression enhanced HCT116 cell proliferation. Data are means ± SD (**P < 0.01, ***P < 0.001, ****P < 0.0001).
ECM1 Influences In Vitro CRC Cell Apoptosis and Cell Cycle Progression
The ability of ECM1 to regulate cell cycle and apoptotic death in CRC cells was next evaluated via flow cytometry. In these assays, ECM1 knockdown enhanced the frequency of cells in the G1 phase while reducing the frequency of cells in the S phase (Figure 3A), with a increase in the rate of apoptotic death among HCT15-siECM1 cells as compared to HCT15 and HCT15-NC cells (Figure 3B). These results thus confirmed that ECM1 knockdown was readily able to suppress in vitro CRC cell growth. In contrast, ECM1 upregulation enhanced the proliferative activity of these cells while reducing the frequency of apoptotic death (Figures 3C, D). Together, these data thus confirmed that ECM1 can serve as a regulator of cell cycle progression and apoptotic death in this cancer type.
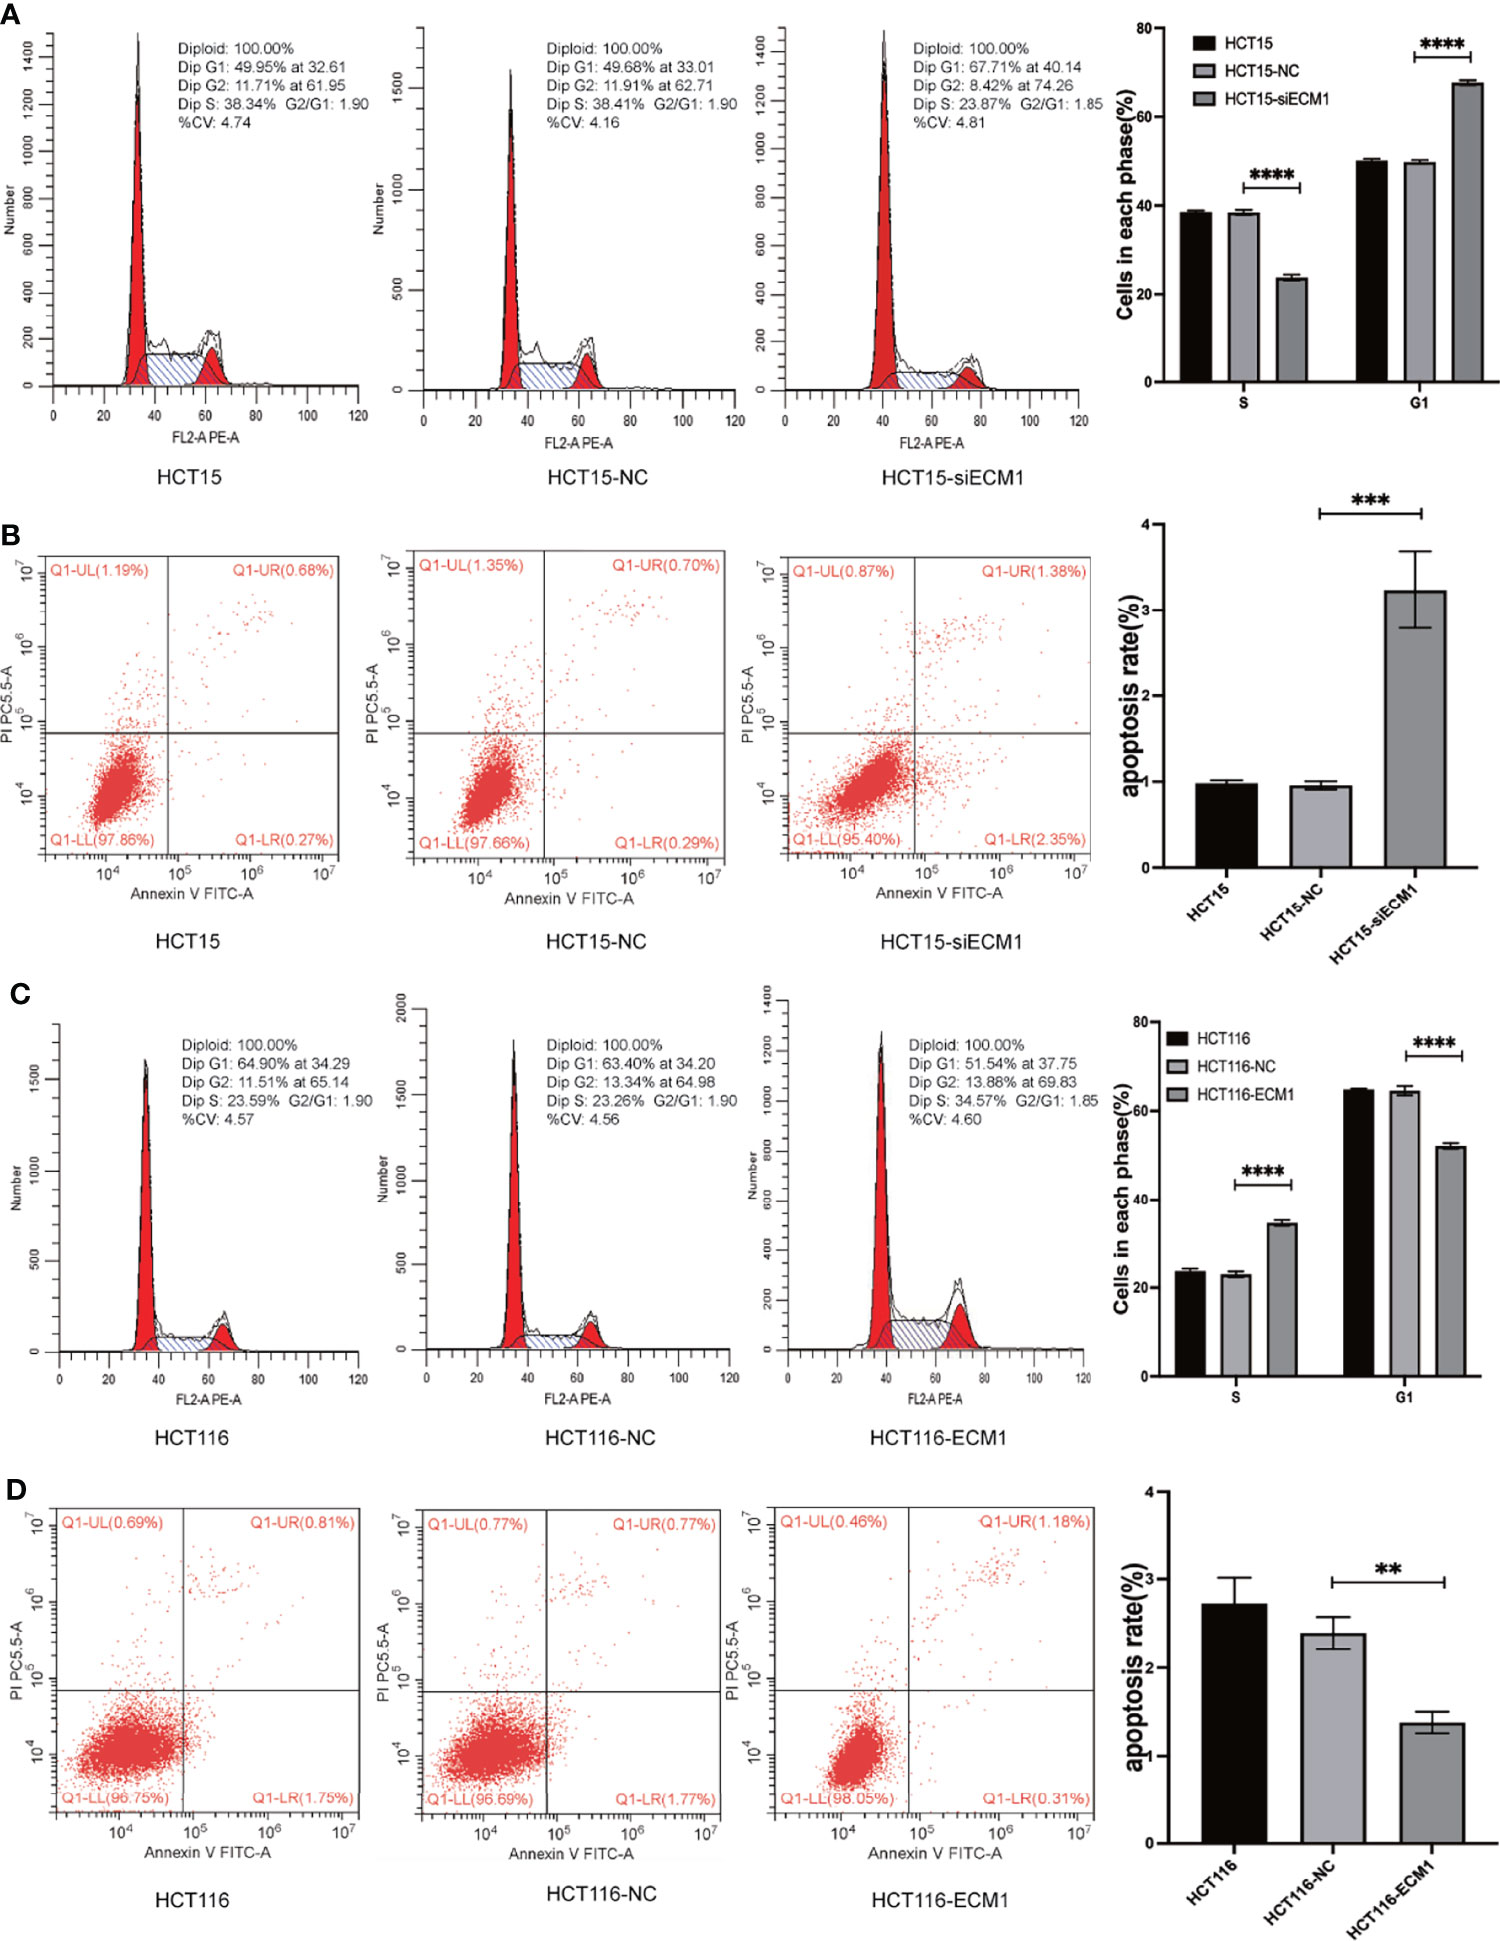
Figure 3 ECM1 regulates the progression of the cell cycle and apoptotic death in CRC cells. Following ECM1 knockdown or overexpression, apoptosis and cell cycle progression were analyzed via flow cytometry. (A, B) Changes in the progression of the cell cycle and apoptotic cell death following the knockdown of ECM1. (C, D) Changes in the progression of the cell cycle and apoptotic cell death following ECM1 overexpression. Data are means ± SD (**P < 0.01, ***P < 0.001, ****P < 0.0001).
ECM1 Regulates the In Vitro Invasivity and Migratory Activity of CRC Cells
Next, the role of ECM1 as a regulator of migratory and invasive activity was assessed through Transwell and wound healing assays. These analyses revealed HCT15 cell invasivity and migratory activity to be significantly suppressed upon ECM1 knockdown relative to control HCT15 and HCT15-NC cells (Figures 4A–C), whereas the opposite phenotype was observed upon ECM1 overexpression (Figures 4D–F). These results thus indicated that ECM1 can promote CRC cell invasivity and migration in addition to enhancing their cell growth.
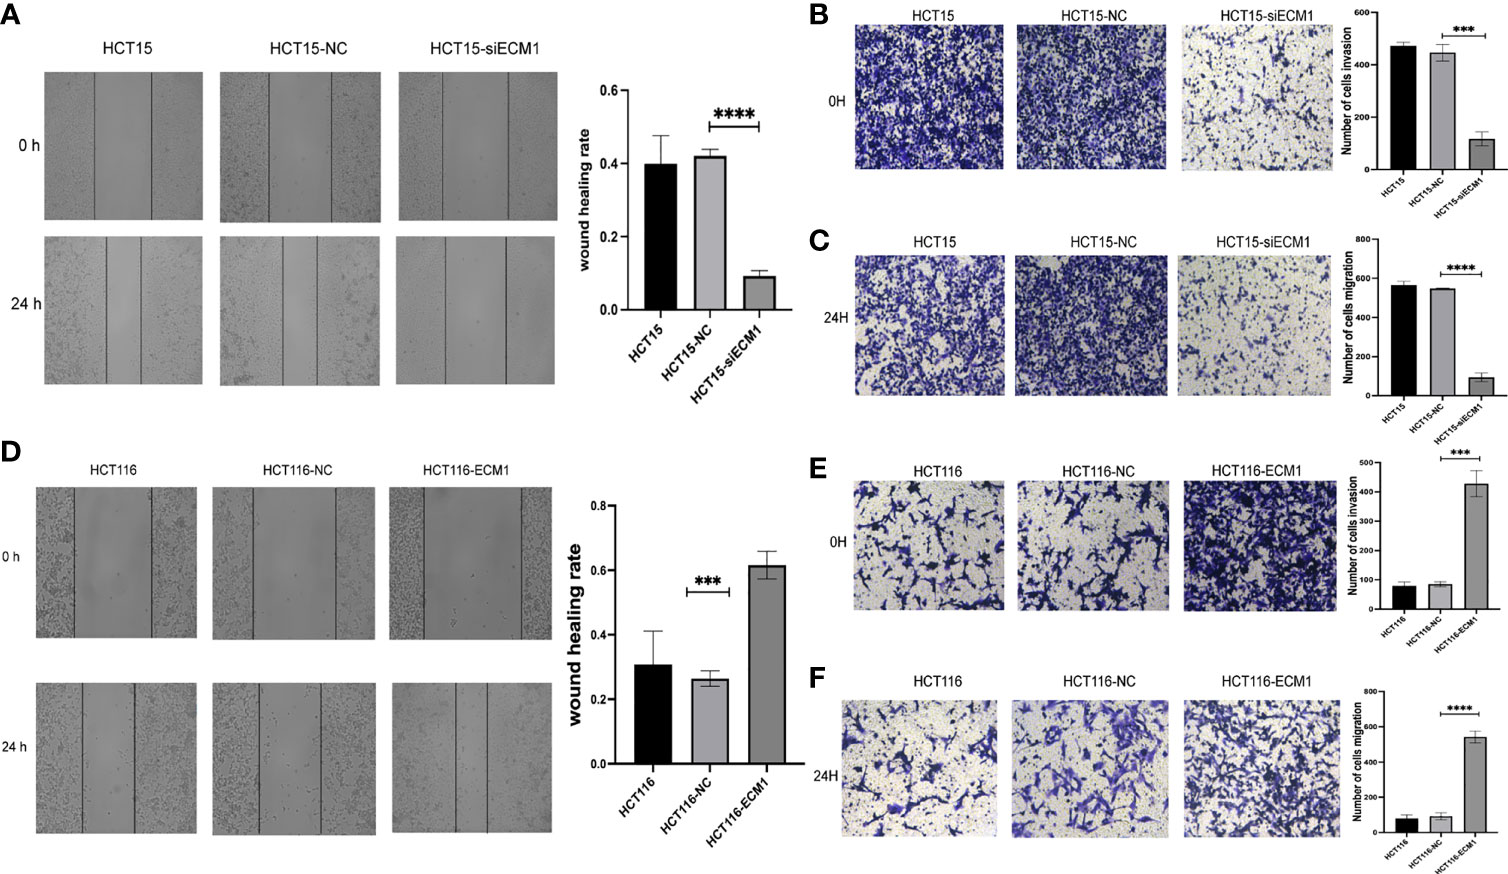
Figure 4 ECM1 regulates CRC cell invasion and migration. CRC cell migratory and invasive activity were scrutinized through Transwell and wound healing assessments following ECM1 knockdown (A–C) or upregulation (D–F). Data are means ± SD (***P < 0.001, ****P < 0.0001).
ECM1 Is Associated With EMT Induction
The EMT process plays a key role in promoting metastatic tumor progression. To analyze the link between ECM1 and this process, we conducted Western blotting assays examining EMT marker protein expression in CRC cells, revealing ECM1 knockdown to enhance E-cadherin expression while suppressing Vimentin expression (Figures 5A–C), whereas the opposite changes were observed upon ECM1 overexpression (Figures 5D–F). As such, ECM1 may regulate CRC progression at least in part via regulating EMT induction.
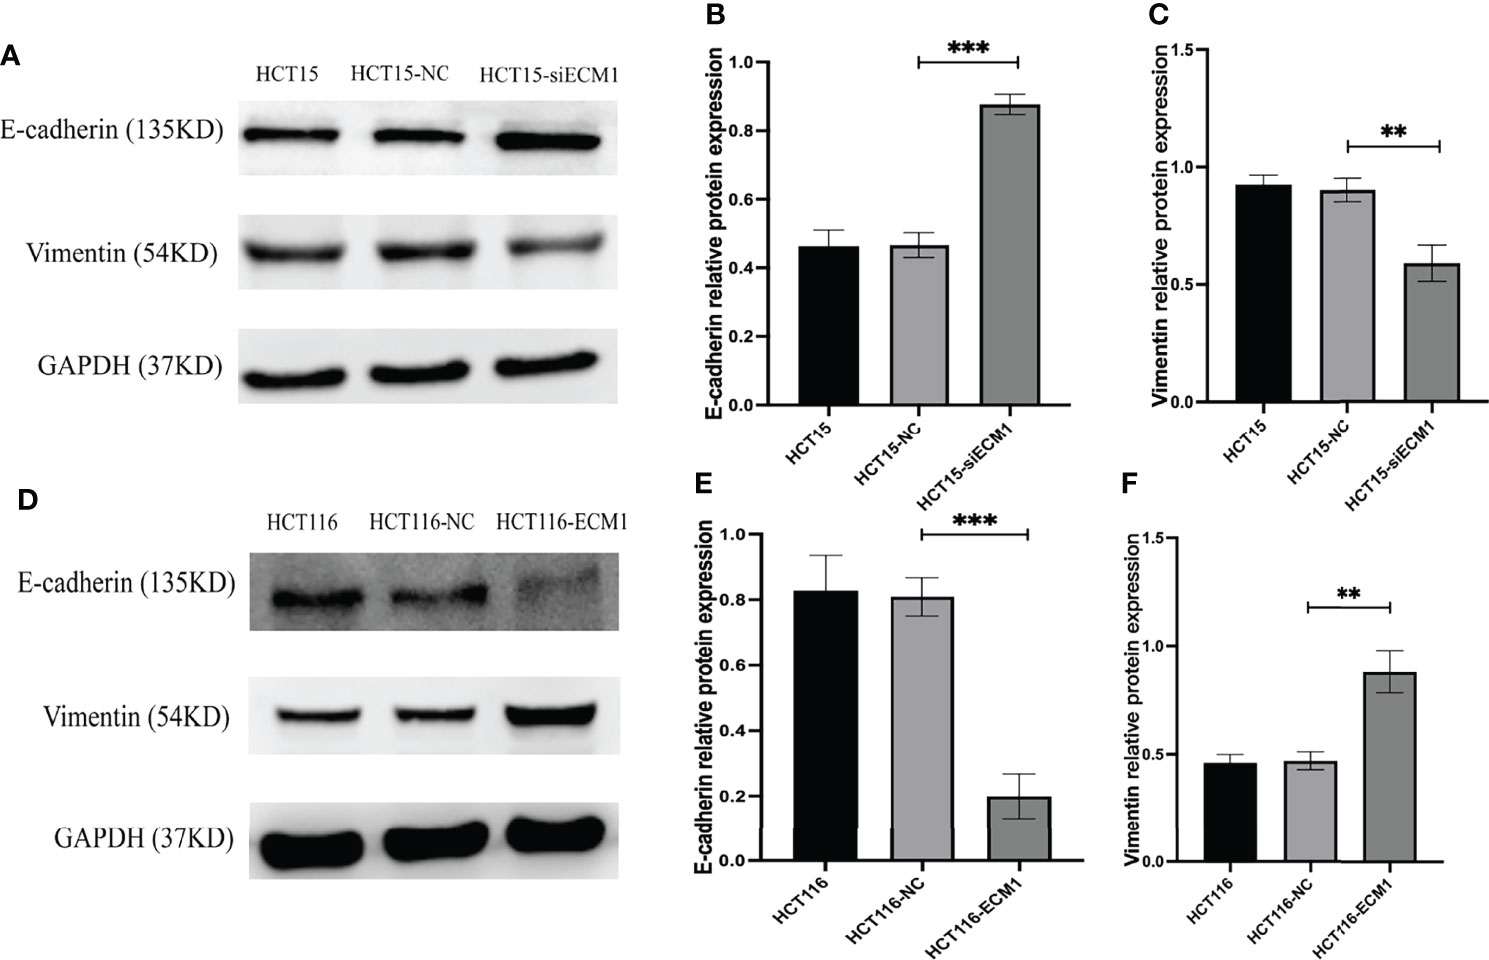
Figure 5 ECM1 regulates CRC cell EMT induction. EMT-related protein expression was analyzed following the knockdown or upregulation of ECM1. (A–C) Vimentin and E-cadherin protein levels were assessed in HCT15, HCT15-NC, and HCT15-siECM1 cells. (D–F) Vimentin and E-cadherin protein levels were investigated in HCT116, HCT116-NC, and HCT116-ECM1 cells. Data are means± SD (**P < 0.01, ***P < 0.001).
ECM1 Modulates the PI3K/AKT/GSK3β/Snail Signaling Axis in CRC Cells
In prior reports, signaling through the PI3K/AKT/GSK3β/Snail axis has been reported to be integral to EMT induction and consequent tumor progression. To further interrogate the mechanistic link between ECM1 and EMT induction in CRC cells, we thus analyzed the levels of AKT, GSK3β, p-AKT, p-GSK3β, and Snail following ECM1 knockdown or upregulation. Knocking down ECM1 reduced the phosphorylation of AKT and GSK3β as well as Snail expression without impacting total AKT or GSK3β expression (Figures 6A, B). In contrast, significant increases in p-AKT, p-GSK3β, and Snail levels were observed upon ECM1 upregulation (Figures 6C, D).
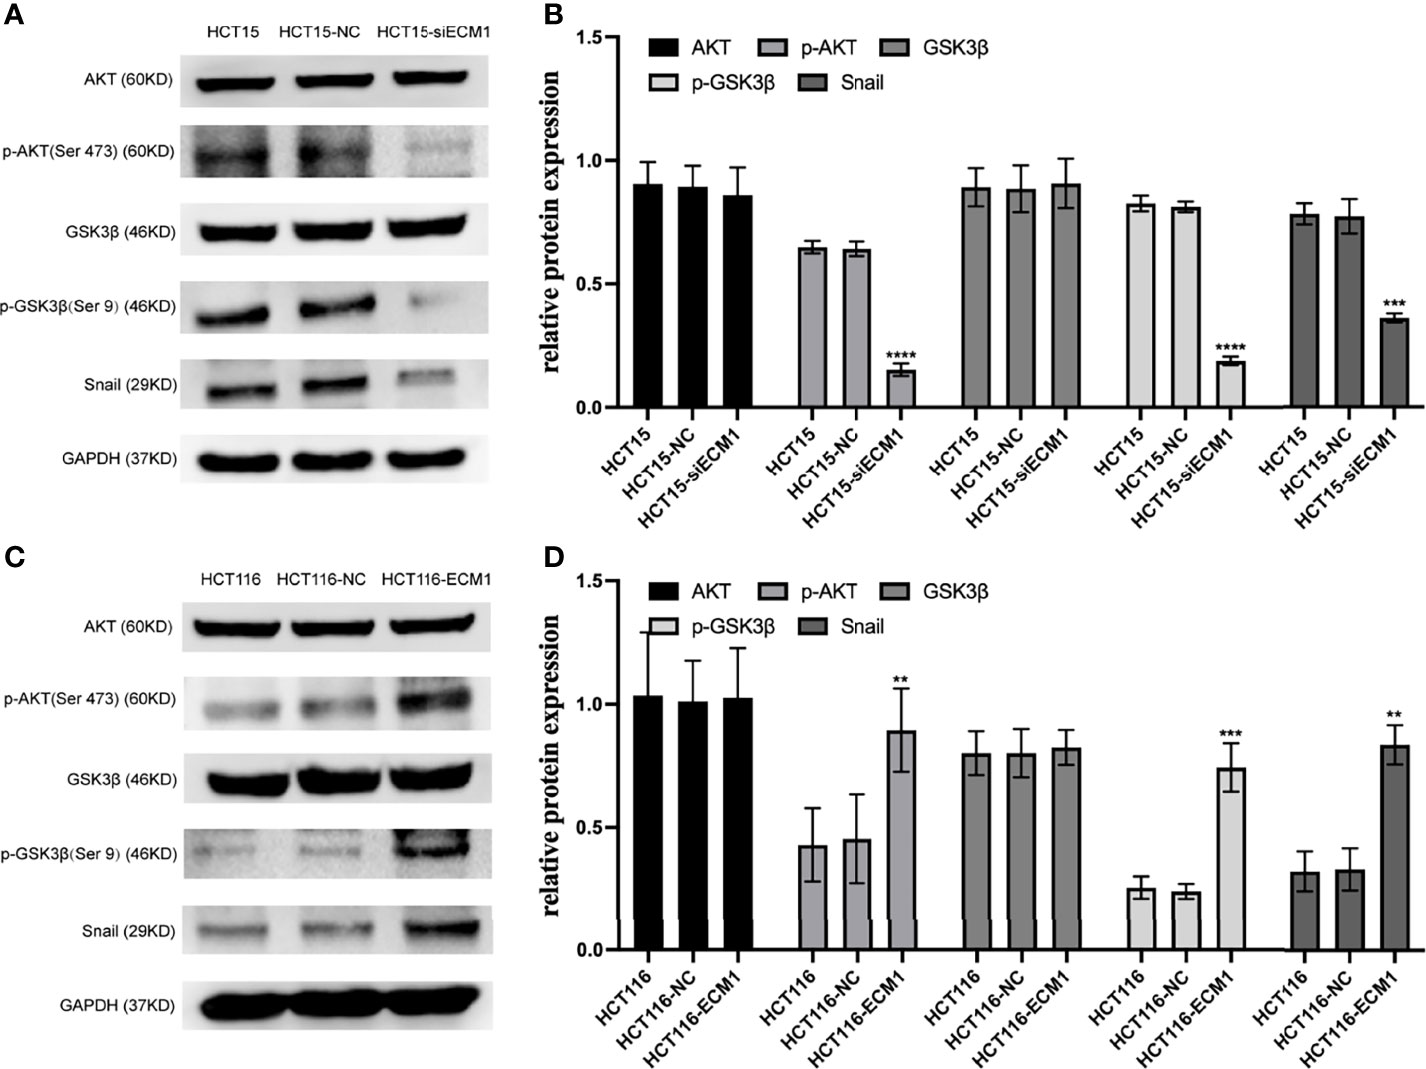
Figure 6 ECM1 regulates signaling via the PI3K/AKT/GSK3β/Snail axis within CRC cells. Western blotting was used to assess AKT, p-AKT, GSK, pGSK3β, and Snail levels in CRC cells following (A, B) ECM1 knockdown or (C, D) ECM1 overexpression. Data are means ± SD (**P < 0.01, ***P< 0.001, ****P < 0.0001).
PI3K/AKT Agonist and Inhibitor Treatment Can Reverse the Effects of Altered ECM1 Expression on CRC Cells
Next, CRC cells were treated with the PI3K/AKT inhibitor LY294002 to determine whether the ability of ECM1 to mediate EMT induction is tied to PI3K/AKT/GSK3β/Snail signaling pathway activation. Western blotting was used to detect changes in signaling-related protein levels (Figures 7A, C). These analyses revealed that the LY294002 treatment of HCT116-ECM1 cells suppressed their invasive and migratory activity in Transwell and wound healing assays (Figures 7E–G), and PI3K/AKT inhibitor treatment further suppressed EMT induction in these cells (Figure 7H). In contrast, the opposite changes were observed when HCT15-siECM1 cells were treated with PI3K/AKT agonist 740 Y-P (Figures 7B, D, I–L). Together, these results thus demonstrate the ability of ECM1 to induce CRC metastatic progression via the PI3K/AKT/GSK3β/Snail pathway.
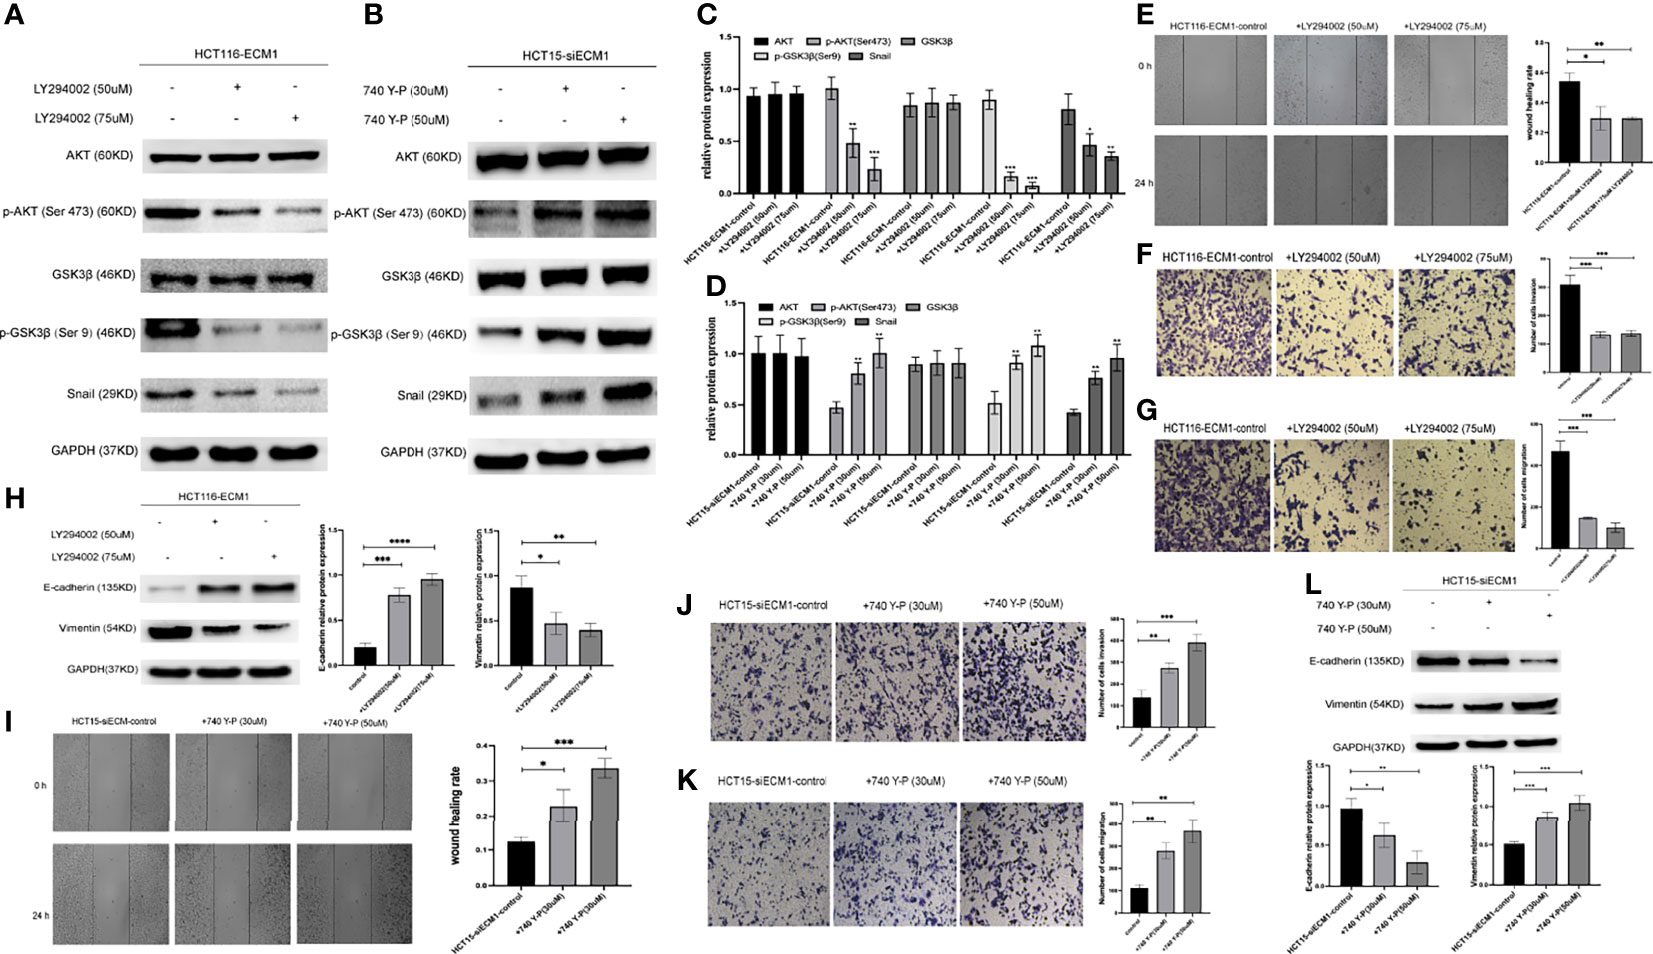
Figure 7 PI3K/AKT agonist and inhibitor treatment can reverse the effects of altered ECM1 expression on CRC cells. HCT116-ECM1 were treated for 24 h with LY294002 (50 or 75 uM), or HCT15-siECM1 were treated 24 h with 740 Y-P (30 or 50 uM), after which invasive and migratory activity were assessed through Transwell and wound healing assays (E–G, I–K), while Western blotting was used to assess AKT, p-AKT, GSK, pGSK, Snail, E-cadherin, and Vimentin expression (A–D, H,L). Data are means ± SD (*P < 0.05, **P < 0.01, ***P < 0.001, ****P <0.0001).
ECM1 Influences the in vivo Growth and EMT Induction of CRC Tumor Xenografts
Lastly, to examine the mechanisms whereby ECM1 influences in vivo CRC tumor growth, we generated a xenograft model system using nude mice implanted with HCT116, HCT116-NC, or HCT116-ECM1 cells (n=5 mice/group). ECM1 upregulation was associated with a significant increase in both tumor volume and weight (Figures 8A–C), while Western blotting revealed increased Vimentin expression and reduced E-cadherin expression in ECM1-overexpressing tumors (Figures 8D–G). These data thus confirmed that the upregulation of ECM1 can promote CRC progression and EMT induction in vivo.
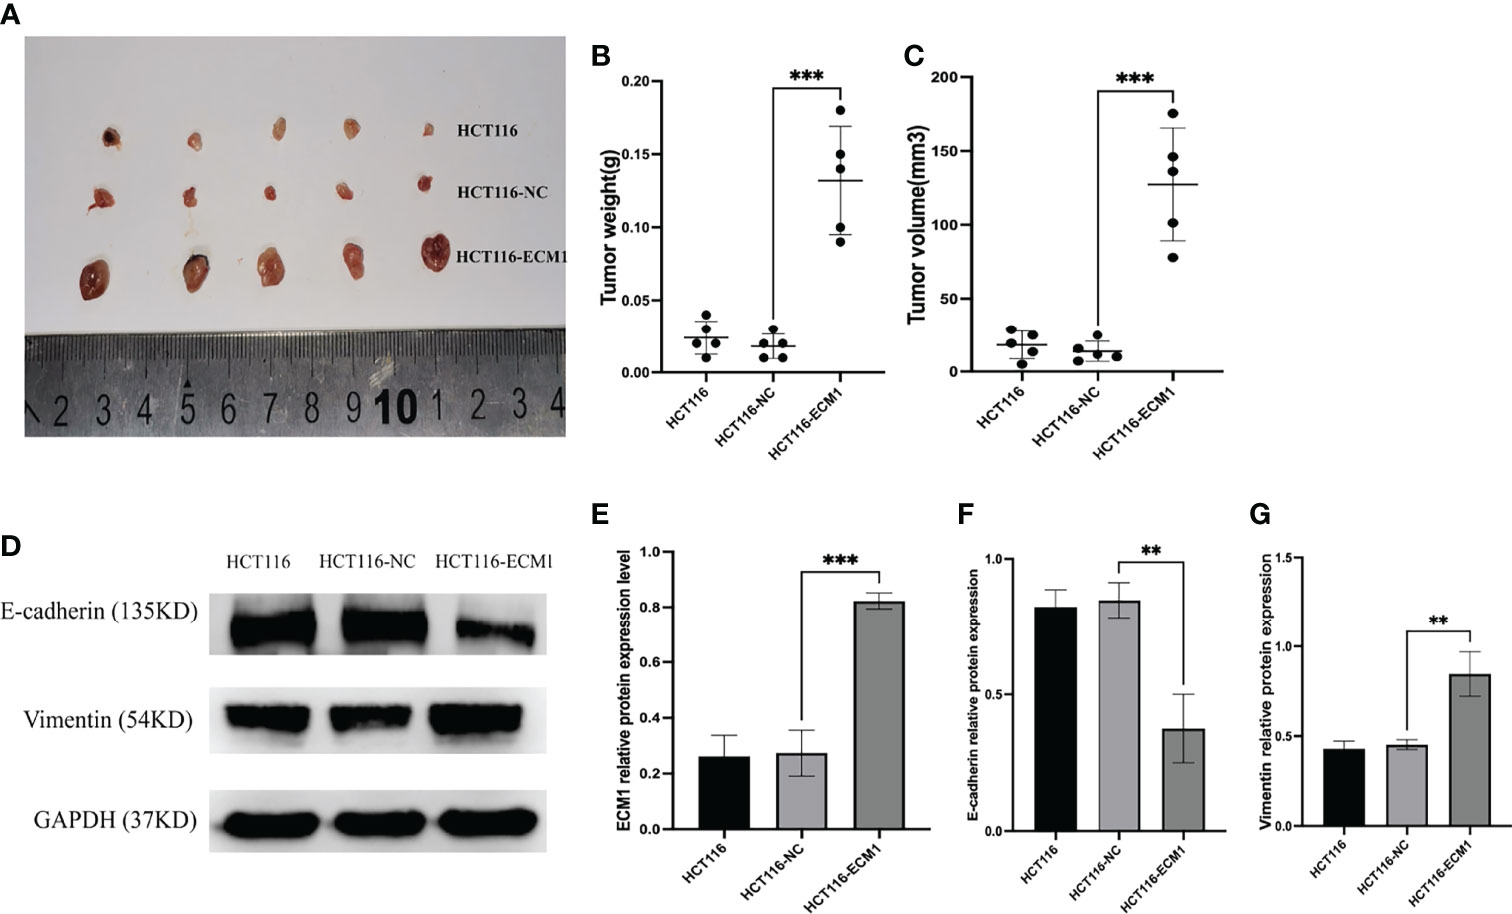
Figure 8 ECM1 promotes in vivo CRC tumor growth. (A–C) ECM1 enhanced in vivo tumor growth, as determined through measurements of tumor weight and volume at 25 days post-implantation. (D–G) ECM1, Vimentin, and E-cadherin expression levels in xenograft tumors were assessed via Western blotting. Data are means ± SD (**P < 0.01, ***P < 0.001)
Discusion
At present, tumor metastasis and recurrence are the leading drivers of mortality among CRC patients (16, 17). However, the molecular mechanisms that govern the invasivity and migratory activity of CRC cells have yet to be fully clarified, underscoring the importance of analyzing novel regulators that can influence malignant tumor development and progression in an effort to highlight new approaches to the early diagnosis and treatment of this deadly tumor type.
The 85 kDa glycoprotein ECM1 was initially identified as a factor secreted by the MN7 murine osteogenic stromal cell line (18). More recent studies, however, have emphasized the functional importance of ECM1 as a regulator of tumor development, progression, and recurrence. Consistently, we herein analyzed the Oncomine database and found ECM1 to be upregulated in CRC patient tissues relative to normal tissues, with this finding subsequently being confirmed in an independent set of patient samples through qPCR, Western blotting, and IHC staining. Moreover, we found ECM1 to be closely correlated with CRC patient tumor size, TNM staging and lymph node metastasis. In line with these results, we observed ECM1 upregulation in CRC tumor cells relative to colonic epithelial cells at the mRNA and protein levels, and found that the overexpression of ECM1 was associated with enhanced CRC cell proliferative activity in CCK-8 and colony formation assays, whereas knocking down ECM1 yielded the opposite phenotypes. Subsequent flow cytometry analyses indicated that ECM1 knockdown increased the frequency of cells in the G1 cell cycle phase while reducing the frequency of cells in the S phase, with a corresponding increase in the frequency of apoptotic cell death. In contrast, overexpressing ECM1 suppressed apoptotic cell death while driving enhanced cell growth. Finally, we established a subcutaneous CRC tumor xenograft model system which demonstrated the ability of ECM1 overexpression to promote enhanced in vivo tumor growth, suggesting that ECM1 functions in an oncogenic manner in CRC.
The EMT process is central to in the metastatic progression of tumors of epithelial origin (19). Through EMT induction, epithelial cells undergo cytoskeletal reorganization, engage in extracellular matrix (ECM) remodeling, and become more mobile and invasive, detaching from surrounding cells and the ECM (20). These changes coincide with a reduction in the expression of epithelial marker proteins and the upregulation of mesenchymal marker proteins including Vimentin and N-cadherin, with this process being regulated by key transcription factors including members of the TWIST, SNAIL, and ZEB families (21, 22). Prior studies have shown ECM1 to play a role in this EMT process in several epithelial malignancies, thereby promoting metastatic progression. In gastric cancer, for example, ECM1 can promote ITGB4/GSK3β/SOX2/HIF-1α signaling and associated EMT induction (23), while in breast cancer it has been posited to stabilize β-catenin via MUC1, ultimately contributing to the EMT induction, the reinforcement of cancer stem cell phenotypes and associated tumor metastasis (24). As such, we hypothesize that ECM1 may similarly enhance CRC cell invasivity and migratory activity through EMT-associated mechanisms. To test this hypothesis, we conducted Transwell and wound healing assays which revealed ECM1 overexpression to promote enhanced migratory and invasive activity, whereas the opposite outcome was observed upon ECM1 downregulation. When EMT-related proteins were further evaluated via Western blotting, ECM1 overexpression was found to enhance and reduce the expression of Vimentin and E-cadherin, respectively. Through the establishment of ECM1-overexpressing tumor xenograft mouse models, we further confirmed that ECM1 overexpression in HCT116 cells in vivo was associated with consistent increases in Vimentin expression together with E-cadherin downregulation, suggesting that ECM1 can regulate the EMT process and thereby promote CRC cell metastatic progression in vitro and in vivo.
We additionally assessed the mechanisms whereby ECM1 can regulate metastatic activity in CRC cells. PI3K/AKT signaling axis is integral to tumor progression owing to its ability to enhance mobility and reduce intercellular adhesion (25). The EMT process and associated loss of epithelial cell phenotypes can be regulated in response to particular extracellular signaling molecules, with cell surface receptors and transcription factors ultimately transducing these signals to alter cellular characteristics (26, 27). The PI3K/AKT/GSK3β/Snail signaling has previously been shown to be critical to tumor metastasis via the modulation of EMT induction in multiple cancers (28–30). As such, we herein assessed the ability of ECM1 to affect the migratory and invasive activity of CRC cells via this signaling pathway, revealing that ECM knockdown was associated with decreases in p-AKT, p-GSK3β, and Snail expression in CRC cells, whereas ECM overexpression yielded the opposite outcome. When ECM1-overexpressing cells were treated with the PI3K/AKT inhibitor LY294002, this was additionally sufficient to suppress their migratory and invasive activity with concomitant vimentin downregulation and E-cadherin upregulation. In contrast, the opposite changes were observed when HCT15-siECM1 cells were treated with PI3K/AKT agonist 740 Y-P.
Conclusion
In summary, we herein found ECM1 to be overexpressed in CRC patient tumors and CRC cell lines, with the expression of this oncogenic factor being related to patient TNM staging, lymph node metastasis, and tumor size. ECM1 overexpression was able to enhance CRC cell growth, migration, and invasion, whereas the opposite changes were observed upon ECM1 knockdown. Mechanistically, ECM1 was found to promote CRC metastatic progression via modulating EMT induction, potentially through regulating the PI3K/AKT/GSK3β/Snail signaling axis. Together, these results suggest ECM1 to be a promising candidate biomarker in CRC that has the potential to guide patient management, in addition to representing a viable therapeutic target in individuals with metastatic CRC.
Data Availability Statement
The original contributions presented in the study are included in the article/supplementary material. Further inquiries can be directed to the corresponding authors.
Ethics Statement
The studies involving human participants were reviewed and approved by The Institutional Ethics Committee of Jiangjin District Central Hospital. The patients/participants provided their written informed consent to participate in this study. The animal study was reviewed and approved by Laboratory Animal Welfare and Ethics Committee of Chongqing University. Written informed consent was obtained from the owners for the participation of their animals in this study.
Author Contributions
GS and DX conceived and designed the study. JW and FW collected clinical data and analyzed it. SL performed experiments, analyzed data and wrote this manuscript. All authors contributed to the article and approved the submitted version.
Funding
This study was supported by grants from The General project of Chongqing Natural Science Foundation (Cstc2019jcyj-msxmX0627, Cstc2020jcyj-msxmX0183) and The Talents project of Chongqing, China (CQYC202103063).
Conflict of Interest
The authors declare that the research was conducted in the absence of any commercial or financial relationships that could be construed as a potential conflict of interest.
Publisher’s Note
All claims expressed in this article are solely those of the authors and do not necessarily represent those of their affiliated organizations, or those of the publisher, the editors and the reviewers. Any product that may be evaluated in this article, or claim that may be made by its manufacturer, is not guaranteed or endorsed by the publisher.
Acknowledgments
Some results of this study are based on ONCOMINE database. We acknowledge ONCOMINE for providing their platforms and contributors for such meaningful data. We also thank Department of Pathology of Jiangjin Central Hospital of Chongqing and Laboratory of Genemine for providing platforms and supports for our experiments.
References
1. Bray F, Ferlay J, Soerjomataram I, Siegel RL, Torre LA, Jemal A. Global Cancer Statistics 2018: GLOBOCAN Estimates of Incidence and Mortality Worldwide for 36 Cancers in 185 Countries. CA Cancer J Clin (2018) 68(6):394–424. doi: 10.3322/caac.21492
2. Oki E, Ando K, Nakanishi R, Sugiyama M, Nakashima Y, Kubo N, et al. Recent Advances in Treatment for Colorectal Liver Metastasis. Ann Gastroenterol Surg (2018) 2(3):167–75. doi: 10.1002/ags3.12071
3. Mongiat M, Fu J, Oldershaw R, Greenhalgh R, Gown AM, Iozzo RV. Perlecan Protein Core Interacts With Extracellular Matrix Protein 1 (ECM1), a Glycoprotein Involved in Bone Formation and Angiogenesis. J Biol Chem (2003) 278(19):17491–9. doi: 10.1074/jbc.M210529200
4. Gao D, Ma X, Lian P, Zhou S, Chen J. Pathogenetic Mechanism of Lipoid Proteinosis Caused by Mutation of the Extracellular Matrix Protein 1 Gene. Mol Med Rep (2018) 17(6):8087–90. doi: 10.3892/mmr.2018.8928
5. Wang Z, Zhou Q, Li A, Huang W, Cai Z, Chen W. Extracellular Matrix Protein 1 (ECM1) is Associated With Carcinogenesis Potential of Human Bladder Cancer. Onco Targets Ther (2019) 12:1423–32. doi: 10.2147/OTT.S191321
6. Dai Z, Cai L, Chen Y, Wang S, Zhang Q, Wang C, et al. Brusatol Inhibits Proliferation and Invasion of Glioblastoma by Down-Regulating the Expression of ECM1. Front Pharmacol (2021) 12:775680. doi: 10.3389/fphar.2021.775680
7. Jeong S, Lee SG, Kim H, Lee G, Park S, Kim IK, et al. Simultaneous Expression of Long Non-Coding RNA FAL1 and Extracellular Matrix Protein 1 Defines Tumour Behaviour in Young Patients With Papillary Thyroid Cancer. Cancers (Basel) (2021) 13(13):3223. doi: 10.3390/cancers13133223
8. Xiong GP, Zhang JX, Gu SP, Wu YB, Liu JF. Overexpression of ECM1 Contributes to Migration and Invasion in Cholangiocarcinoma Cell. Neoplasma (2012) 59(4):409–15. doi: 10.4149/neo_2012_053
9. Wang L, Yu J, Ni J, Xu XM, Wang J, Ning H, et al. Extracellular Matrix Protein 1 (ECM1) is Over-Expressed in Malignant Epithelial Tumors. Cancer Lett (2003) 200(1):57–67. doi: 10.1016/s0304-3835(03)00350-1
10. Huang W, Huang Y, Gu J, Zhang J, Yang J, Liu S, et al. miR-23a-5p Inhibits Cell Proliferation and Invasion in Pancreatic Ductal Adenocarcinoma by Suppressing ECM1 Expression. Am J Transl Res (2019) 11(5):2983–94.
11. Lal G, Hashimi S, Smith BJ, Lynch CF, Zhang L, Robinson RA, et al. Extracellular Matrix 1 (ECM1) Expression is a Novel Prognostic Marker for Poor Long-Term Survival in Breast Cancer: A Hospital-Based Cohort Study in Iowa. Ann Surg Oncol (2009) 16(8):2280–7. doi: 10.1245/s10434-009-0533-2
12. Liu LQ, Hu L, Hu XB, Xu J, Wu AM, Chen H, et al. MiR-92a Antagonized the Facilitation Effect of Extracellular Matrix Protein 1 in GC Metastasis Through Targeting its 3'UTR Region. Food Chem Toxicol (2019) 133:110779. doi: 10.1016/j.fct.2019.110779
13. Chen H, Jia W, Li J. ECM1 Promotes Migration and Invasion of Hepatocellular Carcinoma by Inducing Epithelial-Mesenchymal Transition. World J Surg Oncol (2016) 14(1):195. doi: 10.1186/s12957-016-0952-z
14. Hou YQ, Lou JT, Peng L, Zhou L, Ni J, Kong XT, et al. Detection and Clinical Significance of ECM1 Gene Expression in Colorectal Cancer Tissue. World Chin J Digestol (2007) 17):1960–4. doi: 10.3969/j.issn.1009-3079.2007.17.015
15. Hou YQ, Zhong RQ, Peng L, Kong XT. Expression and Diagnosis Value of ECM1 in Colorectal Cancer Tissues. Shandong Med J (2009) 49(52):1–2. doi: 10.3969/j.issn.1002-266X.2009.52.001
16. Engstrand J, Nilsson H, Strömberg C, Jonas E, Freedman J. Colorectal Cancer Liver Metastases - A Population-Based Study on Incidence, Management and Survival. BMC Cancer (2018) 18(1):78. doi: 10.1186/s12885-017-3925-x
17. Dekker E, Tanis PJ, Vleugels JLA, Kasi PM, Wallace MB. Colorectal Cancer. Lancet (2019) 394(10207):1467–80. doi: 10.1016/S0140-6736(19)32319-0
18. Mathieu E, Meheus L, Raymackers J, Merregaert J. Characterization of the Osteogenic Stromal Cell Line MN7: Identification of Secreted MN7 Proteins Using Two-Dimensional Polyacrylamide Gel Electrophoresis, Western Blotting, and Microsequencing. J Bone Miner Res (1994) 9(6):903–13. doi: 10.1002/jbmr.5650090616
19. Yuan S, Norgard RJ, Stanger BZ. Cellular Plasticity in Cancer. Cancer Discov (2019) 9(7):837–51. doi: 10.1158/2159-8290.CD-19-0015
20. Puisieux A, Brabletz T, Caramel J. Oncogenic Roles of EMT-Inducing Transcription Factors. Nat Cell Biol (2014) 16(6):488–94. doi: 10.1038/ncb2976
21. Dong B, Wu Y. Epigenetic Regulation and Post-Translational Modifications of SNAI1 in Cancer Metastasis. Int J Mol Sci (2021) 22(20):11062. doi: 10.3390/ijms222011062
22. Dongre A, Weinberg RA. New Insights Into the Mechanisms of Epithelial-Mesenchymal Transition and Implications for Cancer. Nat Rev Mol Cell Biol (2019) 20(2):69–84. doi: 10.1038/s41580-018-0080-4
23. Gan L, Meng J, Xu M, Liu M, Qi Y, Tan C, et al. Extracellular Matrix Protein 1 Promotes Cell Metastasis and Glucose Metabolism by Inducing Integrinβ4/FAK/SOX2/HIF-1α Signaling Pathway in Gastric Cancer. Oncogene (2018) 37(6):744–55. doi: 10.1038/onc.2017.363
24. Lee KM, Nam K, Oh S, Lim J, Kim RK, Shim D, et al. ECM1 Regulates Tumor Metastasis and CSC-Like Property Through Stabilization of β-Catenin. Oncogene (2015) 34(50):6055–65. doi: 10.1038/onc.2015.54
25. Song M, Bode AM, Dong Z, Lee MH. AKT as a Therapeutic Target for Cancer. Cancer Res (2019) 79(6):1019–31. doi: 10.1158/0008-5472.CAN-18-2738
26. He Y, Sun MM, Zhang GG, Yang J, Chen KS, Xu WW, et al. Targeting PI3K/Akt Signal Transduction for Cancer Therapy. Sig Transduct Target Ther (2021) 6(1):425. doi: 10.1038/s41392-021-00828-5
27. Noorolyai S, Shajari N, Baghbani E, Sadreddini S, Baradaran B. The Relation Between PI3K/AKT Signalling Pathway and Cancer. Gene (2019) 698:120–8. doi: 10.1016/j.gene.2019.02.076
28. Jin J, Zhang Z, Zhang S, Chen X, Chen Z, Hu P, et al. Fatty Acid Binding Protein 4 Promotes Epithelial-Mesenchymal Transition in Cervical Squamous Cell Carcinoma Through AKT/Gsk3β/Snail Signaling Pathway. Mol Cell Endocrinol (2018) 461:155–64. doi: 10.1016/j.mce.2017.09.005
29. Zhao GX, Xu YY, Weng SQ, Zhang S, Chen Y, Shen XZ, et al. CAPS1 Promotes Colorectal Cancer Metastasis via Snail Mediated Epithelial Mesenchymal Transformation. Oncogene (2019) 38(23):4574–89. doi: 10.1038/s41388-019-0740-7
Keywords: Extracellular matrix protein 1, colorectal cancer, metastasis, epithelial-mesenchymal transition, PI3K/AKT/GSK3β/Snail signaling pathway
Citation: Long S, Wang J, Weng F, Xiang D and Sun G (2022) Extracellular Matrix Protein 1 Regulates Colorectal Cancer Cell Proliferative, Migratory, Invasive and Epithelial-Mesenchymal Transition Activities Through the PI3K/AKT/GSK3β/Snail Signaling Axis. Front. Oncol. 12:889159. doi: 10.3389/fonc.2022.889159
Received: 03 March 2022; Accepted: 30 March 2022;
Published: 27 April 2022.
Edited by:
Amr Amin, The University of Chicago, United StatesReviewed by:
Gehan Heeba, Minia University, EgyptMatjaz Rokavec, Ludwig Maximilian University of Munich, Germany
Copyright © 2022 Long, Wang, Weng, Xiang and Sun. This is an open-access article distributed under the terms of the Creative Commons Attribution License (CC BY). The use, distribution or reproduction in other forums is permitted, provided the original author(s) and the copyright owner(s) are credited and that the original publication in this journal is cited, in accordance with accepted academic practice. No use, distribution or reproduction is permitted which does not comply with these terms.
*Correspondence: Debing Xiang, eGRiODZAaG90bWFpbC5jb20=; Guiyin Sun, c3VucmlzZW9rQDEyNi5jb20=
 Sirui Long
 Jie Wang1,2
