 Shan-peng Liu1
 Ze-feng Xie
- 1Thoracic Surgery Department, The First Affiliated Hospital of Shantou University Medical College, Shantou, China
- 2Breast Surgery Clinics, Guangdong Province Women and Children Hospital, Guangzhou, China
Esophageal cancer (ESCA) is a common malignant tumor with poor prognosis. Accumulating evidence indicates an important role of lysosomal-associated membrane protein 2 (LAMP2) in the progression and development of various cancers. In this study, we obtained RNA-sequencing raw count data and the corresponding clinical information for ESCA samples from The Cancer Genome Atlas and Gene Expression Omnibus databases. We comprehensively investigated the expression and prognostic significance of LAMP2 and relationships between LAMP2 expression and prognosis, different clinicopathological parameters, and immune cell infiltration in ESCA. We also obtained the differentially expressed genes between the high LAMP2 expression and low LAMP2 expression groups in ESCA and performed a functional enrichment analysis of the 250 linked genes most positively related to LAMP2 expression. Moreover, we performed the pan-cancer analysis of LAMP2 to further analyze the role of LAMP2 in 25 commonly occurring types of human cancer. We also verified and compared the expression of LAMP2 in 40 samples of human ESCA tissue and adjacent tissues. The results indicated that LAMP2 expression was significantly upregulated in ESCA and various human cancers. In addition, LAMP2 expression was associated with certain clinicopathological parameters, prognosis, and immune infiltration in ESCA and the other types of cancer. Our study represents a comprehensive pan-cancer analysis of LAMP2 and supports the potential use of the modulation of LAMP2 in the management of ESCA and various cancers.
Introduction
Esophageal cancer (ESCA), which includes esophageal squamous cell carcinoma (ESCC) and esophageal adenocarcinoma (EAC), is a leading cause of cancer-related mortality worldwide (1). Currently, the diagnosis and prognosis of ESCA depend on various factors, including the clinicopathological stage, histological type, tumor size, age, and treatment sensitivity. Early clinical symptoms in patients with ESCA are usually insidious and mild (2, 3). Most patients have a locally advanced or metastatic disease at the time of diagnosis. Despite recent advances in the treatment of ESCA, including molecular-marker-based diagnosis, radiomics, targeted therapies, and immunotherapy, long-term survival rates remain relatively low (4–6). Therefore, it will be of great clinical value to understand the molecular mechanisms underlying the occurrence and progression of ESCA in order to explore effective and novel biomarkers and improve the diagnosis and prognosis of patients with ESCA.
The metabolic function of lysosomes is extremely important and increasingly recognized. The role of lysosomes was not novel in the degradation of cellular machinery (3). Previous research has shown that the functional status and spatial distribution of lysosomes are associated with the proliferation, energy metabolism, invasion and metastasis, immune escape, drug resistance, and tumor-associated angiogenesis of cancer cells (7–9). The LAMP2 gene encodes lysosomal-associated membrane protein 2 (LAMP2), which is a single transmembrane protein located at the limiting membrane of lysosomes and late nuclear endosomes. LAMP2 has three isoforms, LAMP2a, 2b, and 2c, which are involved in autophagy (10). Accumulating evidence indicates that lysosomes play an important part in various cancers; this has raised interest in the role of LAMP2 in cancer progression. For example, the absence of glycolytic metabolism and vascularization produces an acidic microenvironment in the early stages of in situ breast cancer, leading to an increase in LAMP2 on the plasma membrane and tumor progression (11). In addition, LAMP2 expression on the plasma membrane promotes the adhesion of cancer cells to the extracellular matrix, basement membrane, and endothelium, as well as the migration potential of cancer cells during metastasis (12). LAMP2 is also highly expressed in poorly differentiated human colorectal cancer, prostate cancer, hepatocellular carcinoma, adenoid cystic carcinoma, and lung adenocarcinoma and represents a novel molecular biomarker for these cancer types (13–17). Therefore, whether LAMP2 could also be a pan-cancer molecular biomarker, especially in ESCA, is worth further study.
In this study, the expression of LAMP2 in ESCA was investigated using The Cancer Genome Atlas (TCGA) (18) and Gene Expression Omnibus (GEO) (19) databases. Subsequently, we explored the correlations between LAMP2 expression and various clinicopathological features and between LAMP2 expression and the prognostic value in different clinicopathological features. The differentially expressed genes (DEGs) between high LAMP2 expression and low LAMP2 expression groups in ESCA were obtained. We investigated the association between the expression of the top 50 related genes and LAMP2 expression, followed by a functional enrichment analysis of the top 250 linked genes most positively related to LAMP2 using Gene Ontology (GO) terms and Kyoto Encyclopedia of Genes and Genomes (KEGG) pathways. We also analyzed the relationships between immune infiltration parameters and different expression levels of LAMP2 in ESCA. To further analyze whether LAMP2 followed the same expression rules in other tumors, LAMP2 expression in 25 types of human common cancer was obtained from TCGA. Moreover, we analyzed the relationships between LAMP2 expression and prognostic value, different immune infiltration parameters, and different clinicopathological features in other human cancers. Our results may help to find novel immunotherapy treatments for patients with ESCA and other cancers, as well as provide new ideas and directions for clinical research on pan-cancer therapy.
Materials and Methods
Data Collection
The RNA-sequencing (RNA-seq) data and relevant clinical data across 33 tumor types and normal tissues of 15,776 samples were downloaded from The Cancer Genome Atlas (http://cancergenome.nih.gov) and the Genotype-Tissue Expression (GTEx) database (https://www.gtexportal.org/home/-index.html), which contained the extraction of ESCA: GTEx normal (n=653); TCGA paraneoplastic (n=13); and TCGA tumor (n=182). Furthermore, the GSE23400 (n=208) (20), GSE33426 (n=71) (21), GSE53625 (n=358) (22), and GSE45670 (n=38) (23) datasets were used for the validation of the expression difference analysis. The samples with missing expression data were excluded from the study. In addition, the downloaded data were used to explore the relationship of LAMP2 with various clinicopathological parameters (including the pathologic stage, N stage, M stage, and residual tumor), diagnosis [receiver operating characteristic (ROC)], prognosis [overall survival (OS), progression-free interval (PFI), and disease-specific survival (DSS)], and gene coexpression and bioenrichment [GO, KEGG, and gene set enrichment analysis (GSEA)] in ESCA (ESCC and EAC).
The following tumor types were included: bladder urothelial carcinoma (BLCA); breast-invasive carcinoma (BRCA); cervical squamous cell carcinoma and endocervical adenocarcinoma (CESC); cholangiocarcinoma (CHOL); colon adenocarcinoma (COAD); rectum adenocarcinoma (READ); lymphoid neoplasm diffuse large B-cell lymphoma (DLBC); glioblastoma multiforme (GBM); glioma (GBMLGG); head and neck squamous cell carcinoma (HNSC); kidney chromophobe (KICH); kidney renal clear cell carcinoma (KIRC); kidney renal papillary cell carcinoma (KIRP); acute myeloid leukemia (LAML); brain lower-grade glioma (LGG); liver hepatocellular carcinoma (LIHC); lung adenocarcinoma (LUAD); lung squamous cell carcinoma (LUSC); mesothelioma (MESO); ovarian serous cystadenocarcinoma (OV); pancreatic adenocarcinoma (PAAD); prostate adenocarcinoma (PRAD); rectal adenocarcinoma (READ); sarcoma (SARC); skin cutaneous melanoma (SKCM); stomach adenocarcinoma (STAD); testicular germ cell tumors (TGCTs); thyroid carcinoma (THCA); thymoma (THYM); uterine corpus endometrial carcinoma (UCEC); and oral squamous cell carcinoma (OSCC).
Tumor Immune Estimation Resource 2.0
Tumor Immune Estimation Resource 2.0 (TIMER 2.0; http://timer.cistrome.org/) is an updated interactive web server that allows the investigation and visualization of tumor immunity. TIMER 2.0 assists in finding the associations between gene expression, mutations, immune infiltration, and survival characteristics in the TCGA cohort (24). In this study, the expression of LAMP2 in multiple cancer types was assessed using the “Exploration-Gene_DE” model. The “Immune-Gene” module was employed to explore the relationship between LAMP2 expression and the infiltration levels of immune cells (neutrophils, macrophages, dendritic cells, B cells, CD8+ T cells, and CD4+ T cells) on a pan-cancer basis.
Gene Expression Profiling Interactive Analysis 2
Gene Expression Profiling Interactive Analysis 2 (GEPIA2; http://gepia2.cancer-pku.cn/#index) is a free web portal for the differential gene expression analysis of TCGA and GTEx data (25). In the present study, LAMP2 expression was analyzed using the TCGA-ESCA dataset. LAMP2 expression in ESCA and paraneoplastic tissue samples was studied using the “Expression DIY” module in GEPIA2.
UALCAN
The UALCAN database (http://ualcan.path.uab.edu/index.html) can be used to analyze online data (TCGA, The MET500 metastatic cancer cohort, and Clinical Proteomic Tumor Analysis Consortium) and clinical data with respect to the differential gene expression between tumor and normal tissues (26). UALCAN was used here to study LAMP2 expression and its pan-cancer relationships with protein expression in the following 10 subtypes: k1 overexpression of proteasome complex proteins, glycolysis proteins, and pentose phosphate pathway proteins), k2 (adaptive immune system related; associated with T-cell activation; expression of major histocompatibility complex proteins), k3 (innate immune system related; overexpression of complement system proteins; involvement of eosinophils, neutrophils, mast cells, and macrophages; hypoxia signature), k4 (represents basal-like breast cancer; overexpression of YAP1 and MYC targets), k5 (epithelial signature; normoxia signature; overexpression of YAP1 and MYC targets; overexpression of oxidative phosphorylation and the tricarboxylic acid (TCA) cycle proteins), k6 (stromal related; overexpression of matrix metallopeptidases; Wnt and Notch pathway signatures; hypoxia signature), k7 (stromal related; overexpression of collagen VI proteins; Wnt and Notch pathway signatures), k8 (overexpression of Golgi apparatus-related proteins; Ras pathway signature), k9 (found in KIRC cases only; overexpression of hemoglobin complex proteins), and k10 (overexpression of endoplasmic reticulum (ER)-related proteins and steroid biosynthesis pathway proteins).
PrognoScan
PrognoScan (http://dna00.bio.kyutech.ac.jp/PrognoScan/index.html) is a database for the meta-analysis of the prognostic value of genes (27). It was used here to validate the use of LAMP2 in prognosis in cancers using the GEO dataset.
TISIDB
TISIDB (http://cis.hku.hk/TISIDB/) is a website for exploring tumor-immune system interactions that integrates numerous data types (28). In this study, TISIDB was used to construct a heat map showing the correlations among immunomodulators, lymphocytes, chemokines (or receptors), and gene expression. In addition, TISIDB was used to explain the correlations of LAMP2 expression with immune subtypes and molecular subtypes of tumors.
Tumor Immune Dysfunction and Exclusion
The tumor immune dysfunction and exclusion (TIDE) algorithm (http://tide.dfci.harvard.edu/query/) provides data to support the studies of T-cell dysfunction and immunotherapy resistance in cancer based on large clinical datasets (29). In this study, the general predictive ability of LAMP2 with respect to treatment response in different cancer types was compared with those of nine standardized biomarkers for tumor immune response using the “Biomarker Evaluation” model, including TIDE, the microsatellite instability (MSI) score, tumor mutational burden (TMB), cluster of differentiation 274 (CD274), cluster of differentiation 8 (CD8), interferon-γ (IFNG), T-cell clonality (T.Clonality), B-cell clonality (B.Clonality), and Merck18 (29, 30). p < 0.05 was defined as statistically significant.
OncoLnc
OncoLnc (http://www.oncolnc.org/) is a tool that allows the interactive exploration of survival correlations based on the survival data of 8,647 patients from 21 cancer studies conducted in TCGA (31). In this work, the survival analysis for LAMP2 in ESCA was performed using OncoLnc.
Analysis of LAMP2-Interacting Genes and Proteins
The LAMP2 interaction network was constructed using the GeneMANIA database (32) (http://www.genemania.org). The STRING online database (33) (https://string-db.org/) was used to construct the LAMP2 protein–protein interaction network.
GO and KEGG Pathway Analysis and Gene Set Enrichment Analysis
To predict the function of LAMP2 and its associated pathways, we performed a correlation analysis between LAMP2 and other genes in ESCA using TCGA data. GO analysis is an efficient bioinformatics tool for identifying the biological processes, cellular components, and molecular functions linked to the gene of interest. GSEA is a computational method for determining statistical differences in the expression status of a set of genes between two organisms (34). GSEA was used to investigate the potential mechanism of LAMP2. We further explored potential functional pathways based on the top 250 genes using the clusterProfiler R package (35) (Version 3.14.3). Adjusted P < 0.05 was considered to indicate the meaningful enrichment of a pathway.
Tissue Preparation and Immunohistochemistry
Tumor specimens were obtained from 40 consecutive patients undergoing a single surgical resection in the First Affiliated Hospital of Shantou University from 2020 to 2021. None of the patients had received preoperative chemotherapy or radiotherapy. Ethical approval was granted by the clinical research ethics committee of the First Affiliated Hospital of Shantou University. Tumor tissues were fixed in 10% formalin and embedded in paraffin. Paraffin-embedded 4 µm thick tissue sections were automatically immunohistochemically stained using a Ventana BenchMark XT immunostainer (Ventana Medical Systems, Tucson, AZ, United States) with a basic Diaminobenzidine (DAB) Kit (Ventana Cat, Tucson, USA). The specimens were diluted to 1:400 with a prediluted polyclonal anti-lamp2 Rabbit polyclonal antibody (pAb) (Wanleibio, Shenyang, China) and incubated for 24 min. Specimens were restained with hematoxylin.
Immunohistochemical sections were visualized and analyzed after full-slide digitization using the Panoramic Scan and Image Pro-Plus (IPP) software. The density means and integrated optical density (IOD) of IPP are representative parameters for assessing immunostaining quantification, allowing for an increased sensitivity of scoring and enabling a more reliable and reproducible protein expression analysis. To further compare the expression of LAMP2 in other cancers, the expression of LAMP2 in five tumor types and the corresponding normal tissues was validated using The Human Protein Atlas (THPA) (https://www.proteinatlas.org/) database (36). Three pairs of samples (cancer and normal tissue) were downloaded for each type of cancer. The density means and IOD of IPP were calculated. The GraphPad Prism software (version 5.0) was used to perform unpaired t-tests (Student’s t-test) on the average IOD values obtained from the cancer and normal tissues. p < 0.05 was defined as statistically significant.
Statistical Analysis
The R package (version 3.6.3) was used for performing all statistical tests, and the ggplot2 package (3.3.3 version) was used for visualization. Kaplan–Meier survival analyses were performed with the “survival R” and “survminer R” packages in the R software. The ROC analysis was performed with the qROC package (version 1.17.0.1). The immune infiltration algorithm (ssGSVA) in the GSVA package (version 1.34.0) was used to calculate immune scores (37). LAMP2 differential expression analysis was performed using the DESeq2 package (38) (version 1.26.0). t-test or Wilcoxon rank sum test was used for continuous variables and Pearson’s chi-square test for categorical variables. p < 0.05 was considered to indicate statistical significance (ns, p ≥ 0.05; ∗p < 0.05; ∗∗p < 0.01; ∗∗∗p < 0.001).
Results
LAMP2 Showed Significantly Higher Expression in ESCA and ESCC
LAMP2 expression was identified using the data from different GEO datasets. The expression of LAMP2 was higher in ESCC tissues than in adjacent normal tissues in the GSE33426 (Figure 1A), GSE45670 (Figure 1B), GSE53625 (Figure 1C), and GSE23400 (Figure 1D) datasets. Furthermore, based on TCGA data, LAMP2 protein expression was higher in EAC (Figure 1E) and ESCA (Figures 1F, G) compared with adjacent normal tissues. The statistical analyses performed on ESCA samples and adjacent normal tissue samples from TCGA showed that LAMP2 expression had an effective predictive value (area under the curve [AUC] = 0.939) (Figure 1H). These findings indicate that LAMP2 expression is upregulated in ESCA and suggest an important regulatory role of LAMP2 in ESCA progression.
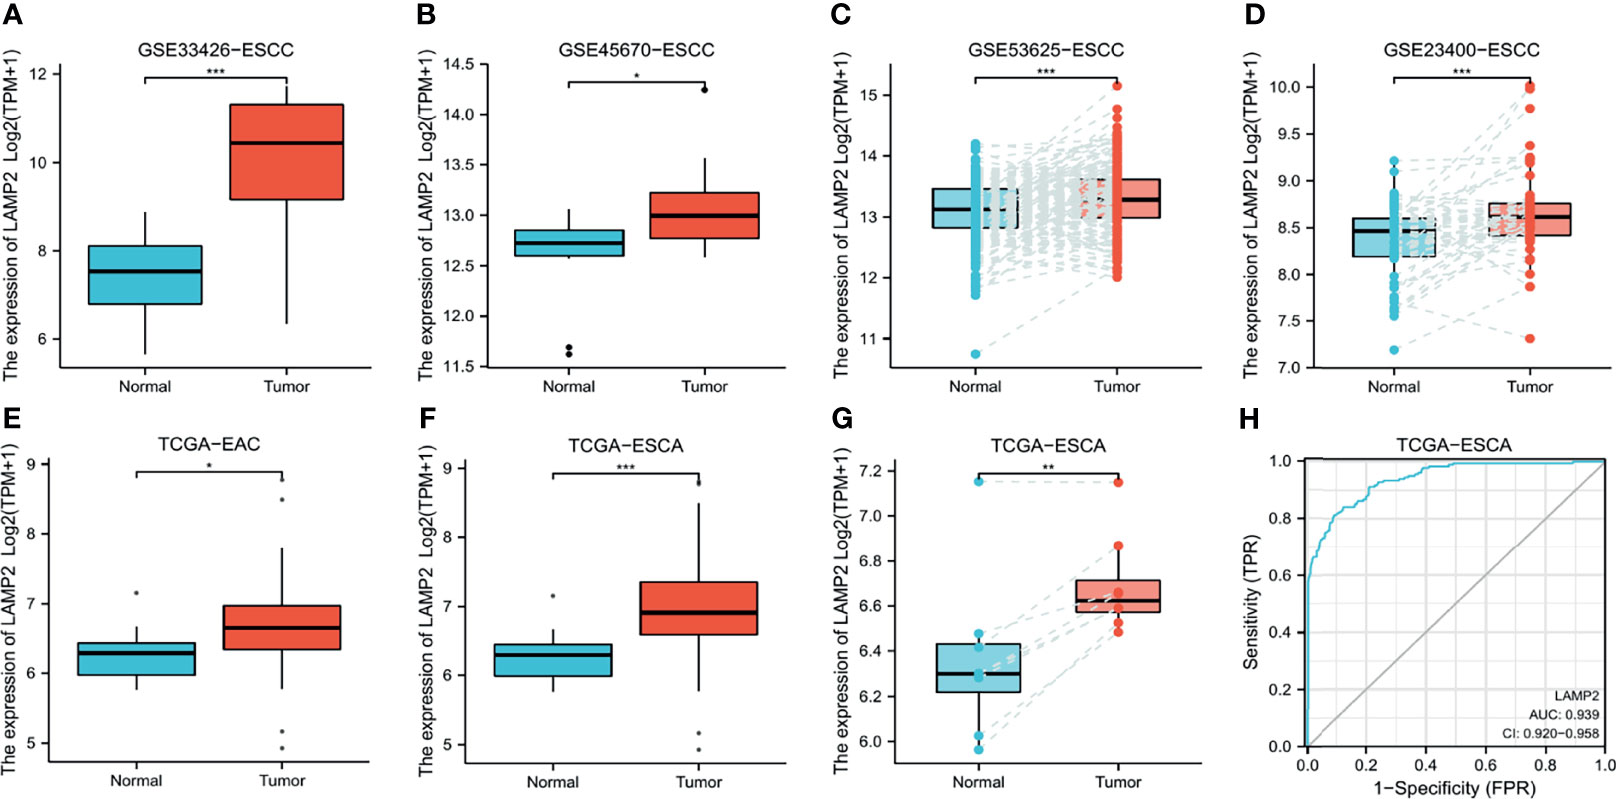
Figure 1 LAMP2 expression in esophageal cancer. The disparity expression of LAMP2 based on the GEO database. LAMP2 mRNA levels in ESCC tumor tissues and normal tissues in the (A) GSE33426 (N:12 vs. T:59), (B) GSE45670 (N: 10 vs. T: 28), (C) GSE53625 (N: 179 vs. T: 179), and (D) GSE23400 (N: 53 vs. T: 53) datasets. (E) Analysis of LAMP2 expression in EAC and adjacent normal tissues was examined in the TCGA database (N: 10 vs. T: 80). (F) Analysis of LAMP2 expression in TCGA tumors and normal tissues with the data of the GTEx database as controls (N: 666 vs. T: 182). (G) TCGA database and statistical analyses of LAMP2 expression in 8 pairs of ESCA tissues and adjacent normal tissues. (H) ROC curve for LAMP2 expression in TCGA with GTEx (N: 666 vs. T: 182), respectively. TPM, transcript per million; N, normal, T, tumor; *P < 0.05, **P < 0.01, ***P < 0.001.
Correlations Between LAMP2 Expression and Clinicopathology
We investigated the correlations between LAMP2 expression and clinicopathological features in ESCA including the pathologic stages, N stage, M stage, residual tumor, primary therapy outcome, gender, race, age, body mass index (BMI), histological type, radiation therapy, tumor central location, Barrett’s esophagus, columnar metaplasia, and T stage. A high expression of LAMP2 was significantly associated with pathologic stages II and III (Figure 2A), N0 and N1 stages (Figure 2B), M0 and M1 stages (Figure 2C), residual tumor (R0, R1, and R2) (Figure 2D), complete response (Figure 2E), gender (female, male) (Figure 2F), race (Asian, White, Black, or African-American) (Figure 2G), age (≤60, >60) (Figure 2H), BMI (≤25, >25) (Figure 2I), histological type (squamous cell carcinoma) (Figure 2J), radiation therapy (Figure 2K), tumor central location (distal, mid, proximal) (Figure 2L), Barrett’s esophagus (no) (Figure 2M), columnar metaplasis (no) (Figure 2N) and T2 stage (Figure 2O). These correlations of LAMP2 expression with various clinicopathological features highlight that more attention should be paid to the patients with certain concomitant clinical traits, such as an age over 60 years, the absence of Barrett’s esophagus, or distal central location of the tumor.
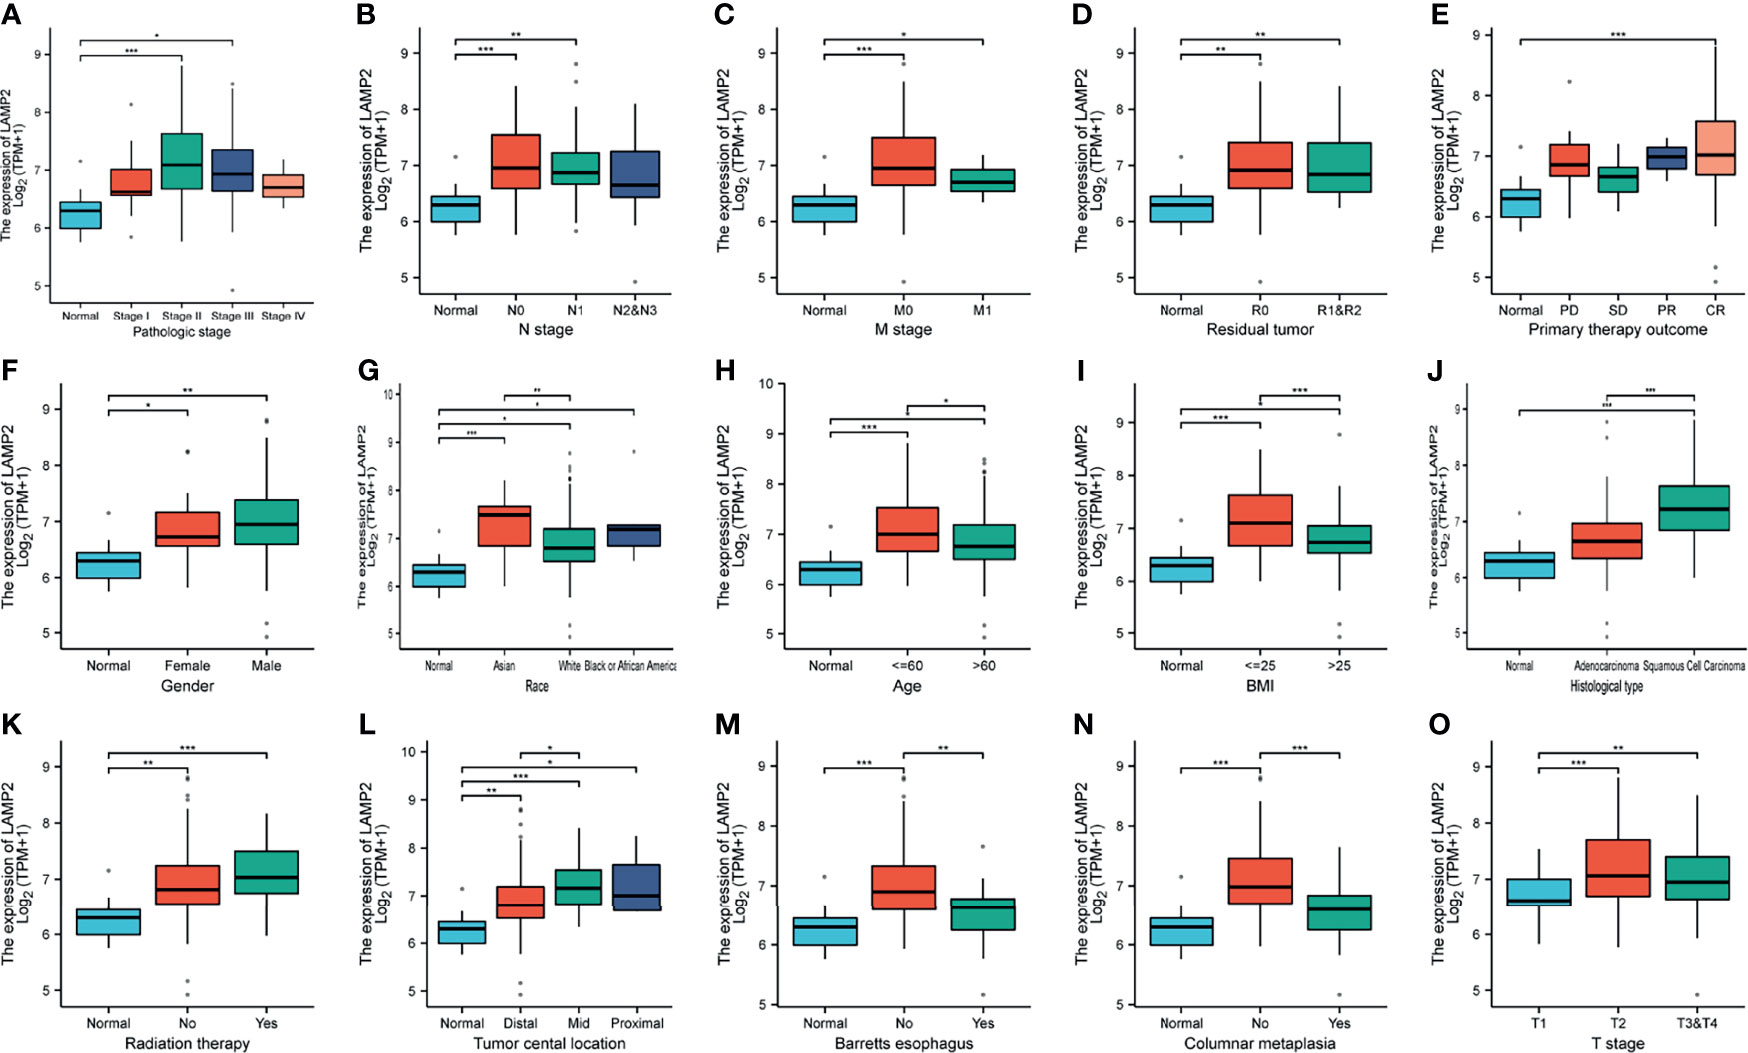
Figure 2 Box plots evaluating LAMP2 expression among different groups of patients based on clinical parameters using the TCGA database. Analysis is shown for pathologic stage (A), N stage (B), M stage (C), residual tumor (D), primary therapy outcome (E), gender (F), race (G), age (H), BMI (I), histological type (J), radiation therapy (K), tumor central location (L), Barrett’s esophagus (M), columnar metaplasis (N), and T stage (O). PD, progressive disease; SD, stable disease; PR, partial response; CR, complete response; BMI, body mass index; TPM, transcript per million; *P < 0.05, **P < 0.01, ***P < 0.001.
Correlation Analysis Between LAMP2 Expression and Prognostic Value
Next, we downloaded prognostic information for patients with EAC and ESCA from TCGA to analyze the prognostic value of LAMP2. A high expression of LAMP2 in patients with EAC was significantly associated with worse OS (Figure 3A), PFI (Figure 3B), and DSS (Figure 3C). Subsequently, the prognostic information of patients with ESCA was obtained from TCGA, GEPIA2, and Oncolnc to analyze the prognostic value of LAMP2. We investigated the relationship between LAMP2 expression and prognosis in patients with ESCA. The results showed that a high expression of LAMP2 was significantly related to worse DSS (Figure 3D) in patients with ESCA from TCGA. In the GEPIA2 and Oncolnc data, we found that a high expression of LAMP2 was associated with worse OS in patients with ESCA (Figures 3E, F). These results suggest that LAMP2 is significantly associated with the prognosis of ESCA.
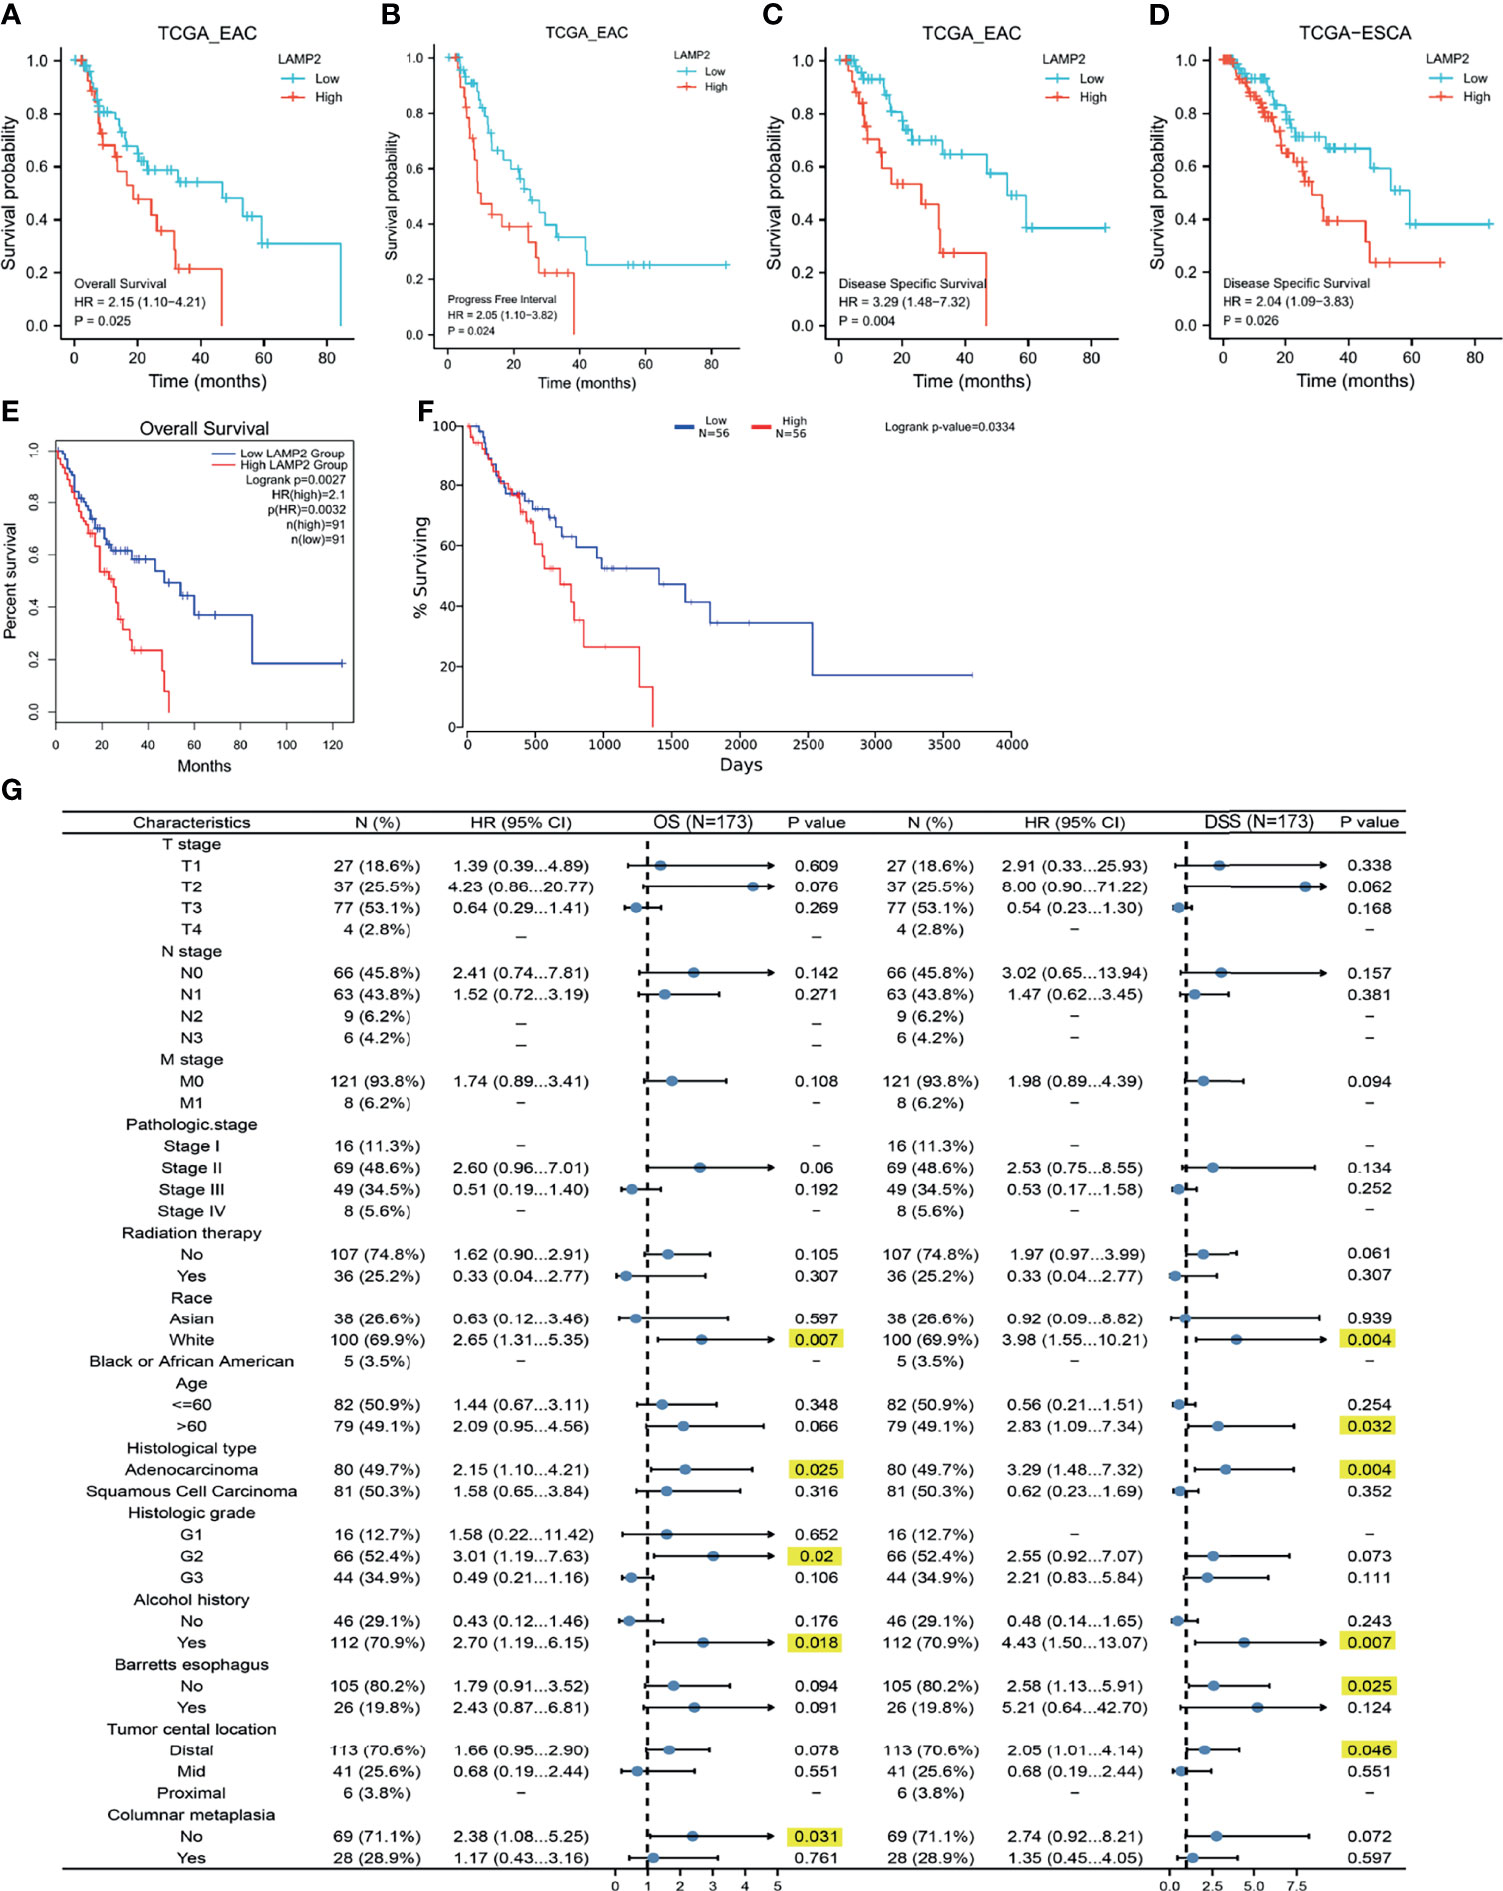
Figure 3 Correlations between LAMP2 expression and the prognosis (OS, PFI, and DSS) of cancers. (A–C) LAMP2 expression on OS, PFI, and DSS in EAC based on the TCGA database. (D) LAMP2 expression on DSS in ESCA based on the TCGA database. (E) LAMP2 expression on OS in ESCA based on the GEPIA2 database. (F) Kaplan plot for LAMP2 in ESCA based on the OncoLnc. (G) Forest plots based on the TCGA database showing LAMP2 expression and clinicopathological parameters in OS and DSS of ESCA patients. OS, overall survival; PFI, progression-free interval; DSS, disease-specific survival.
Validation of the Prognostic Value of LAMP2 Based on a Variety of Clinicopathological Features
Kaplan–Meier analysis was used to better understand and explore the correlations of LAMP2 expression with various clinical characteristics in patients with ESCA. As shown in Figure 3G, high LAMP2 expression, adenocarcinoma, and a history of alcohol use were significantly correlated with worse OS and DSS (Figure 3G). Moreover, we found that LAMP2 expression was significantly associated with poor DSS in ESCA patients >60 years of age or without Barrett’s esophagus or a distal tumor central location (Figure 3G). The upregulation of LAMP2 expression was only associated with poorer OS in patients with histological grade 2 and those without columnar metaplasia (Figure 3G). These results suggest that LAMP2 expression has a prognostic value in ESCA.
Identification of LAMP2-Interacting Genes and Proteins
GeneMANIA was used to construct a gene–gene interaction network for LAMP2. As shown in Figure 4A, the 20 genes closely related to LAMP2 were identified, including LAMP1, CD60, IMPDH1, LAMP3, and LAMP5 (Figure 4A). A protein–protein interaction network for LAMP2 was established using the STRING database (Figure 5B). There were 27 edges and 11 nodes, including SLC40A1, TFR2, and HFE (P<0.001) (Figure 4B).
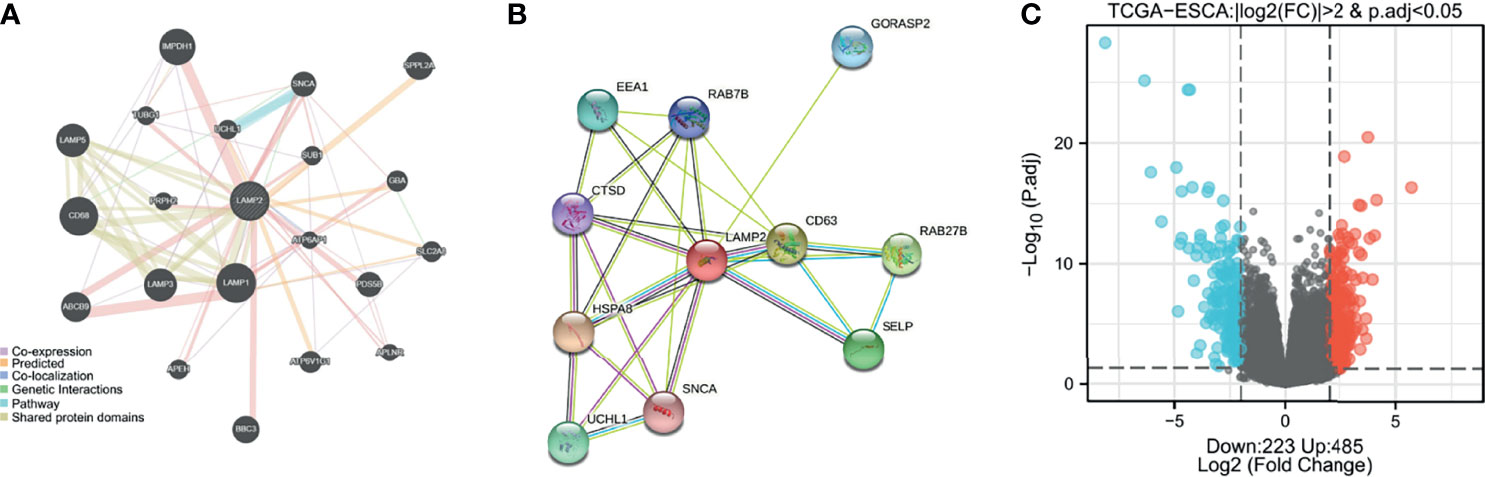
Figure 4 Identification of LAMP2-interacting genes, proteins and DEGs. (A) The gene–gene interaction network of LAMP2 was constructed using GeneMania. (B) A visual network of LAMP2- binding protein interactions was obtained based on the STRING database. (C) Volcano map of differentially expressed genes, with 485 upregulated genes and 223 downregulated genes. Normalized expression levels are shown in descending order from blue to red.
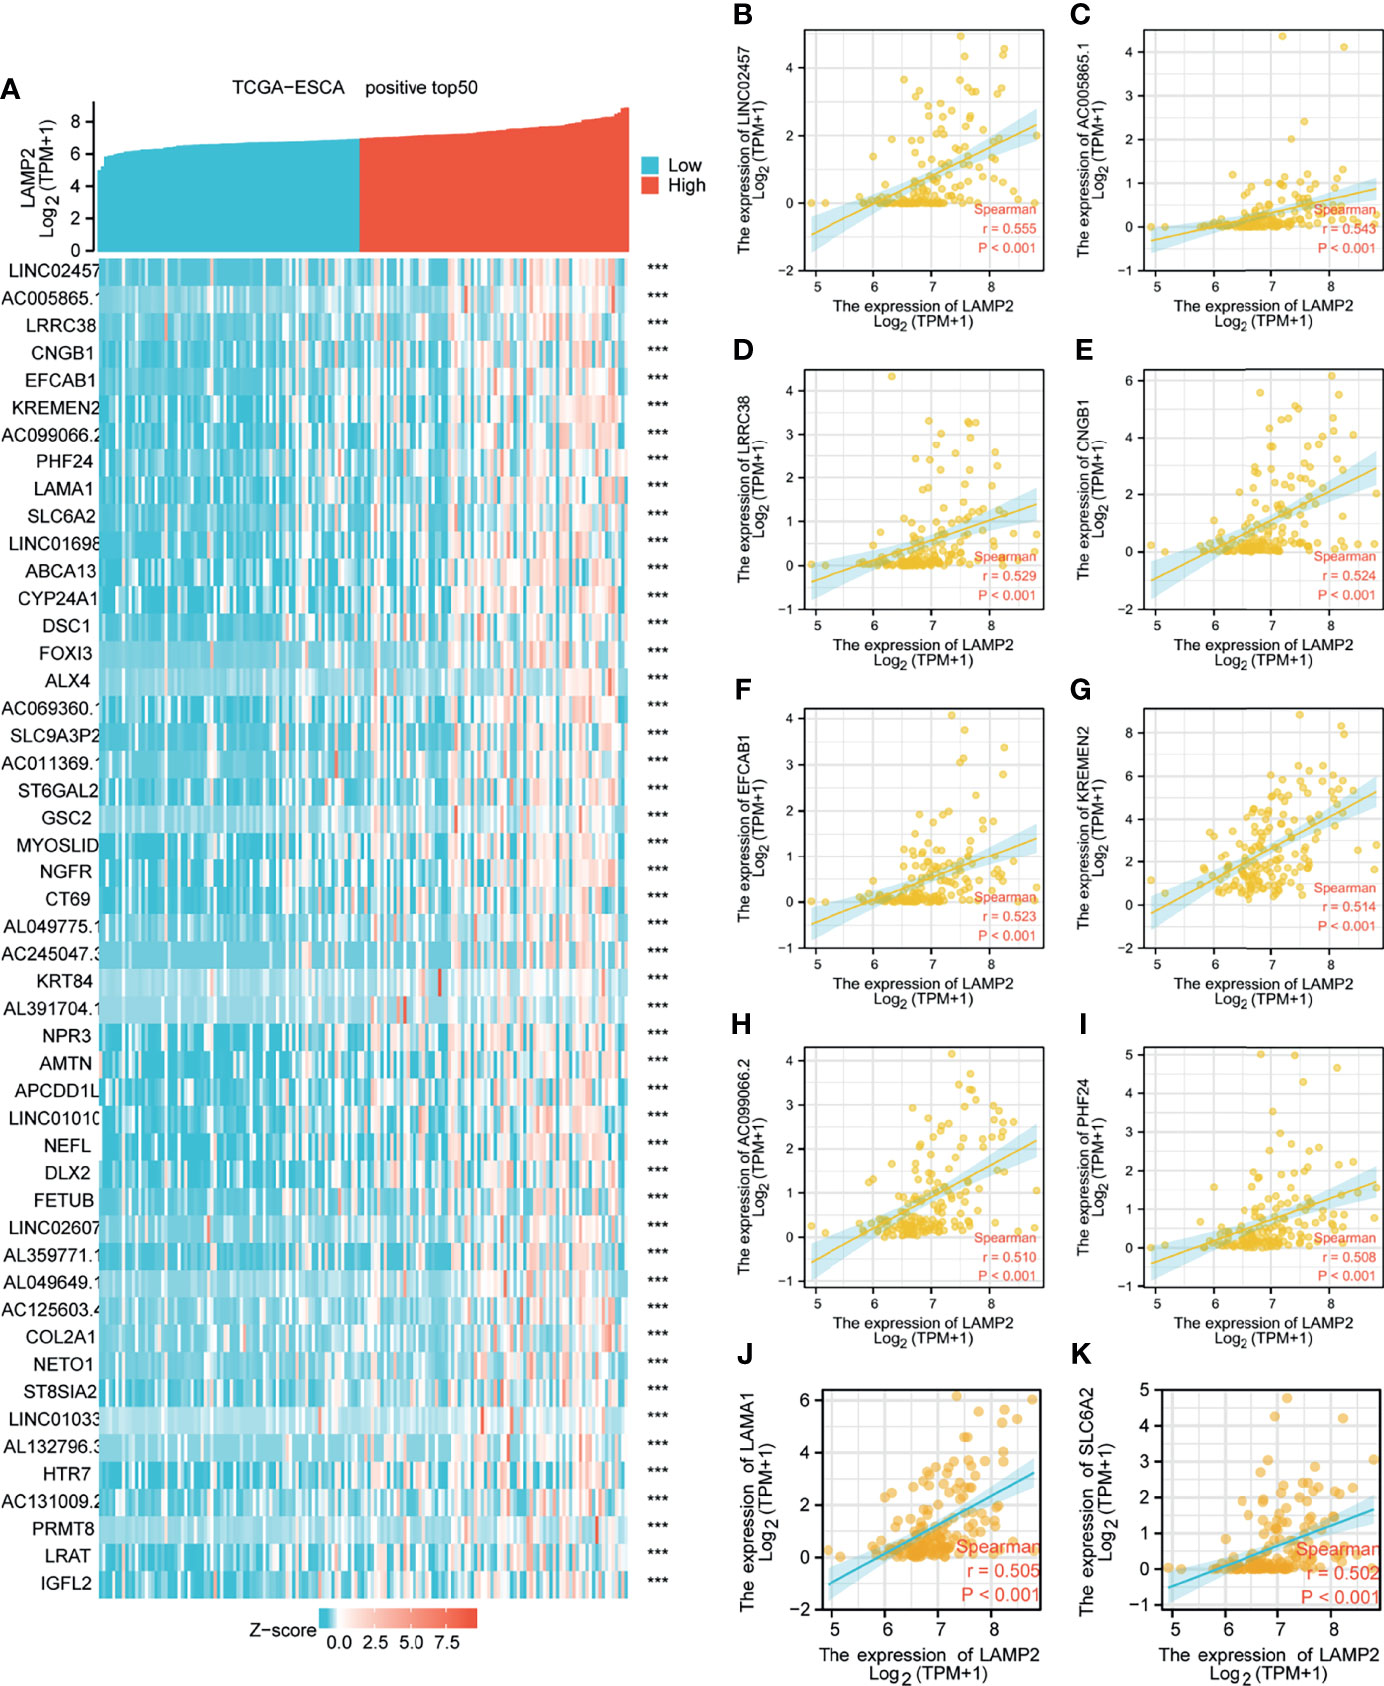
Figure 5 Top 50 genes positively associated with LAMP2 expression in ESCA. (A) The gene coexpression heat map of the top 50 genes positively linked with LAMP2 in ESCA; correlation analysis of the top 10 genes and LAMP2 in the heat map: (B) LINC02457, (C) AC005865.1, (D) LRRC38 (E) CNGB1, (F) EFCAB1, (G) KREMEN2, (H), AC099066.2 (I) PHF24, (J) LAMA1, and (K) SLC6A2. ***p < 0.001.
Identification of DEGs in ESCA in LAMP2 Low-Expression and High-Expression Groups
Median LAMP2 mRNA expression was used to divide samples into high-expression and low- expression groups. A total of 708 DEGs were identified, including 485 upregulated and 223 downregulated genes, between the LAMP2 low- and high-expression groups (|log fold change| > 2, P < 0.05) (Figure 4C). Heat maps were used to illustrate the associations between the top 50 related genes and LAMP2 expression levels. As shown in the heat map of positive correlations (Figure 5A), the expression level of LAMP2 was positively associated with those of LINC02457 (r = 0.555) (Figure 5B), AC005865.1 (r = 0.543) (Figure 5C), LRRC38 (r = 0.529) (Figure 5D), cyclic nucleotide-gated channel subunit beta 1 (CNGB1; r = 0.524) (Figure 5E), EFCAB1 (r = 0.523) (Figure 5F), KREMEN2 (r = 0.514) (Figure 5G), AC099066.2 (r = 0.510) (Figure 5H), PHF24 (r = 0.508) (Figure 5I), LAMA1 (r = 0.505) (Figure 5J), and SLC6A2 (r = 0.502) (Figure 5K). Among the negatively correlated genes (Figure 6A), the top 10 were AGR3 (r = −0.576) (Figure 6B), CDC42EP5 (r = −0.562) (Figure 6C), CLRN3 (r = −0.534) (Figure 6D), SMIM24 (r = −0.532) (Figure 6E), the polymeric immunoglobulin receptor (PIGR; r = −0.530) (Figure 6F), IHH (r = −0.517) (Figure 6G), DMBT1 (r = −0.510) (Figure 6H), MIR3131 (r = −0.503) (Figure 6I), MS4A8 (r = −0.503) (Figure 6J), and TM4SF5 (r = −0.503) (Figure 6K).
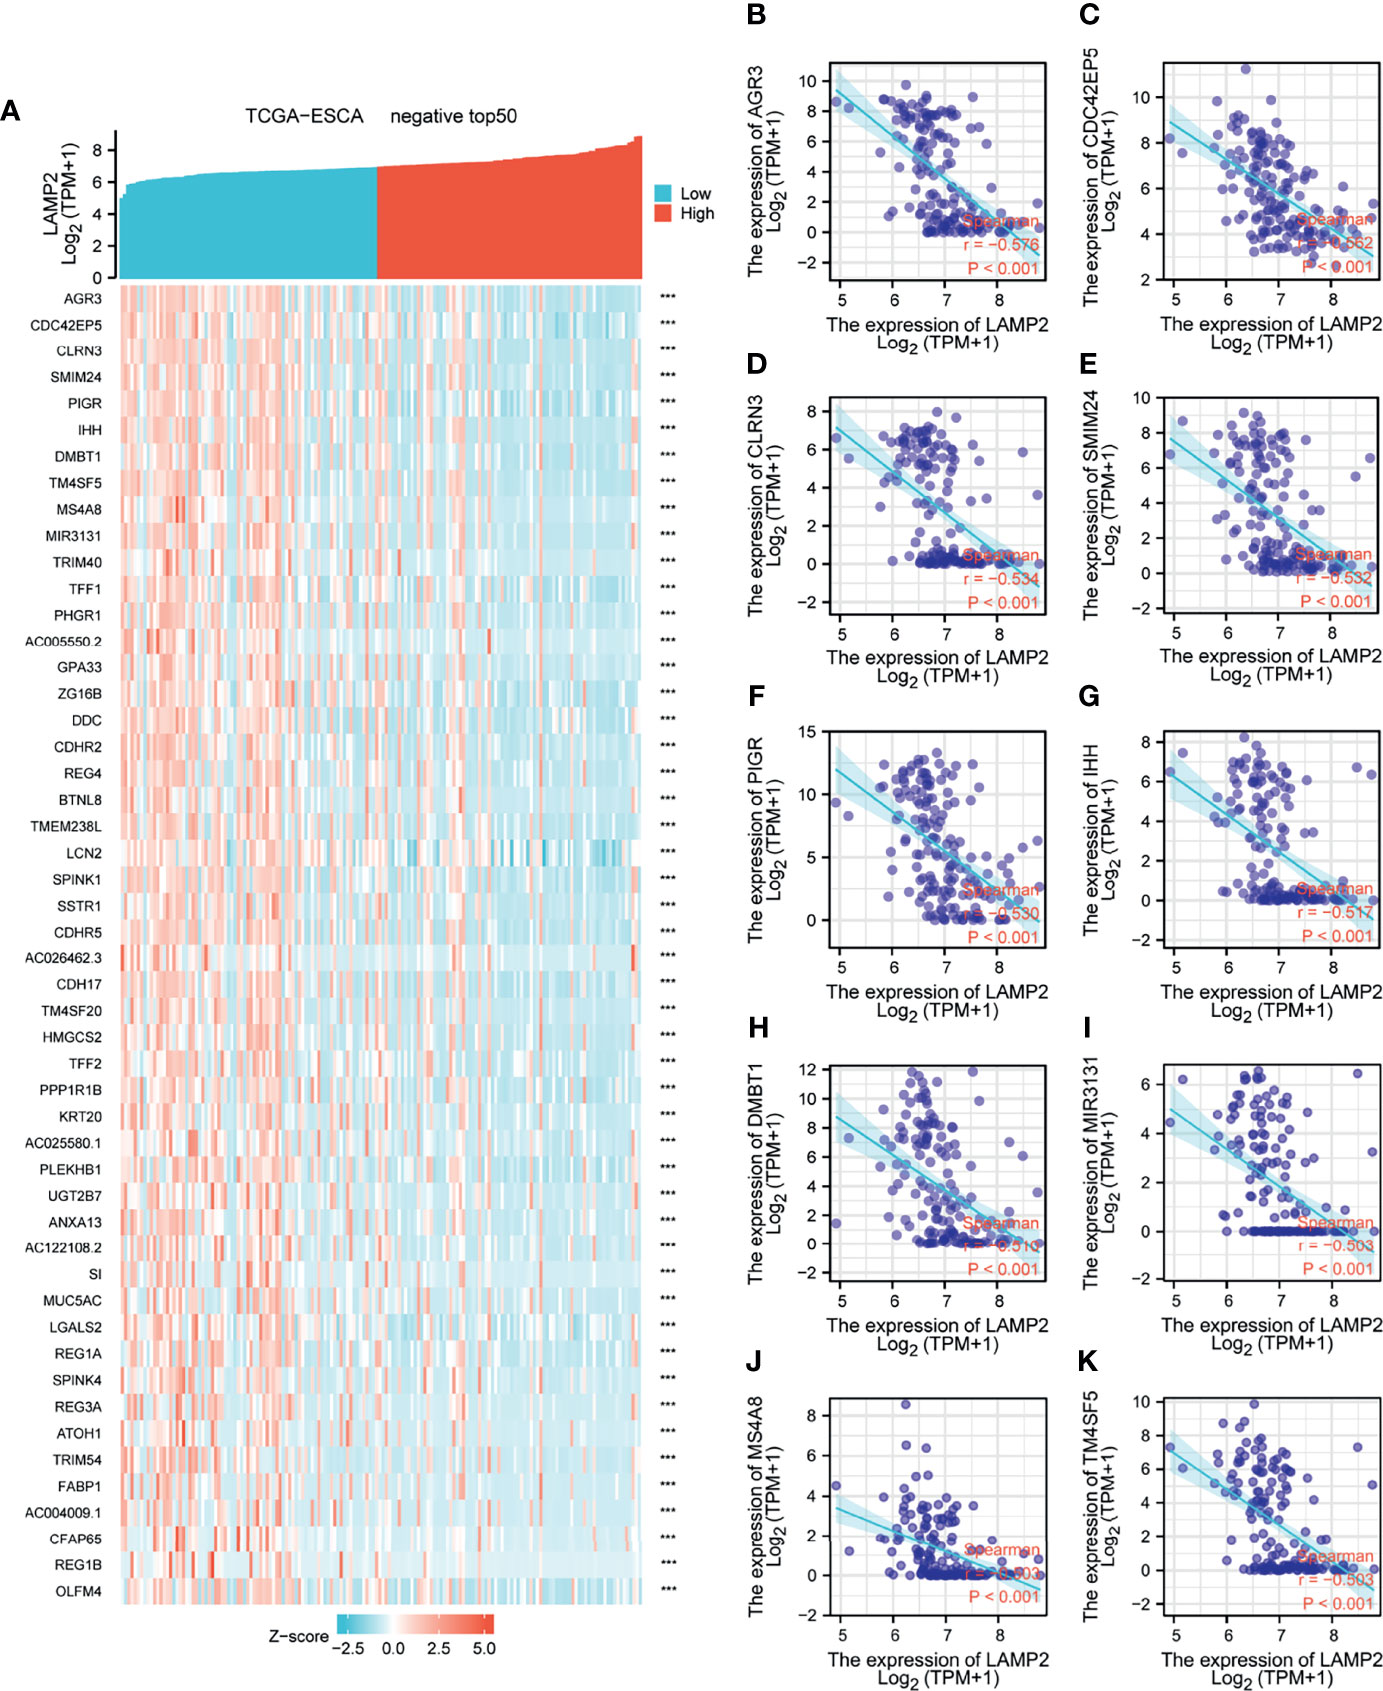
Figure 6 Top 50 genes negatively associated with LAMP2 expression in ESCA. (A) The gene coexpression heat map of the top 50 genes negatively linked with LAMP2 in ESCA; correlation analysis of the top 10 genes with LAMP2 in the heat map: (B) AGR3, (C) CDC42EP5, (D) CLRN3 (E) SMIM24, (F) PIGR, (G) IHH, (H) DMBT1, (I) MIR3131, (J) MS4A8, and (K) TM4SF5. ***p < 0.001.
Functional Enrichment Analysis
To better comprehend the characteristics of LAMP2 and its related pathways, we performed a correlation analysis on LAMP2 and the DEGs in ESCA using TCGA data. The top 250 linked genes most positively correlated with LAMP2 were picked for enrichment analysis. We further studied the potential functional pathway based on the top 250 genes using the clusterProfiler R package. According to the GO enrichment analysis, the primary biological processes included a humoral immune response, an antimicrobial humoral response, epidermis development, digestion, epidermal cell differentiation, and keratinocyte differentiation. The main cellular components were the immunoglobulin complex, blood microparticle, and cornified envelope. The molecular functions were principally related to carbohydrate binding, glucuronosyltransferase activity, and peptidoglycan binding (Figures 7A–C). In addition, KEGG pathway analysis identified the enrichment and crosstalk of the top 250 genes in protein digestion and absorption and retinol metabolism (Figure 7D). GSEA was used to search for reactome and KEGG pathways: the ABC transporter in lipid homeostasis; acetylcholine binding and downstream events; activation of the mRNA upon the binding of the cap-binding complex and eukaryotic initiation factors (eIFs), and subsequent binding to 43S; and activation of the TFAP2 (AP-2) family of transcription factors were extremely enriched (Figure 7E). Alanine aspartate and glutamate metabolism, aldosterone-regulated sodium reabsorption, allograft rejection, and the allograft rejection pathway were significantly enriched in the KEGG analysis (Figure 7F). These results strongly suggest that LAMP2 is involved in the regulation of the immune response in ESCA.
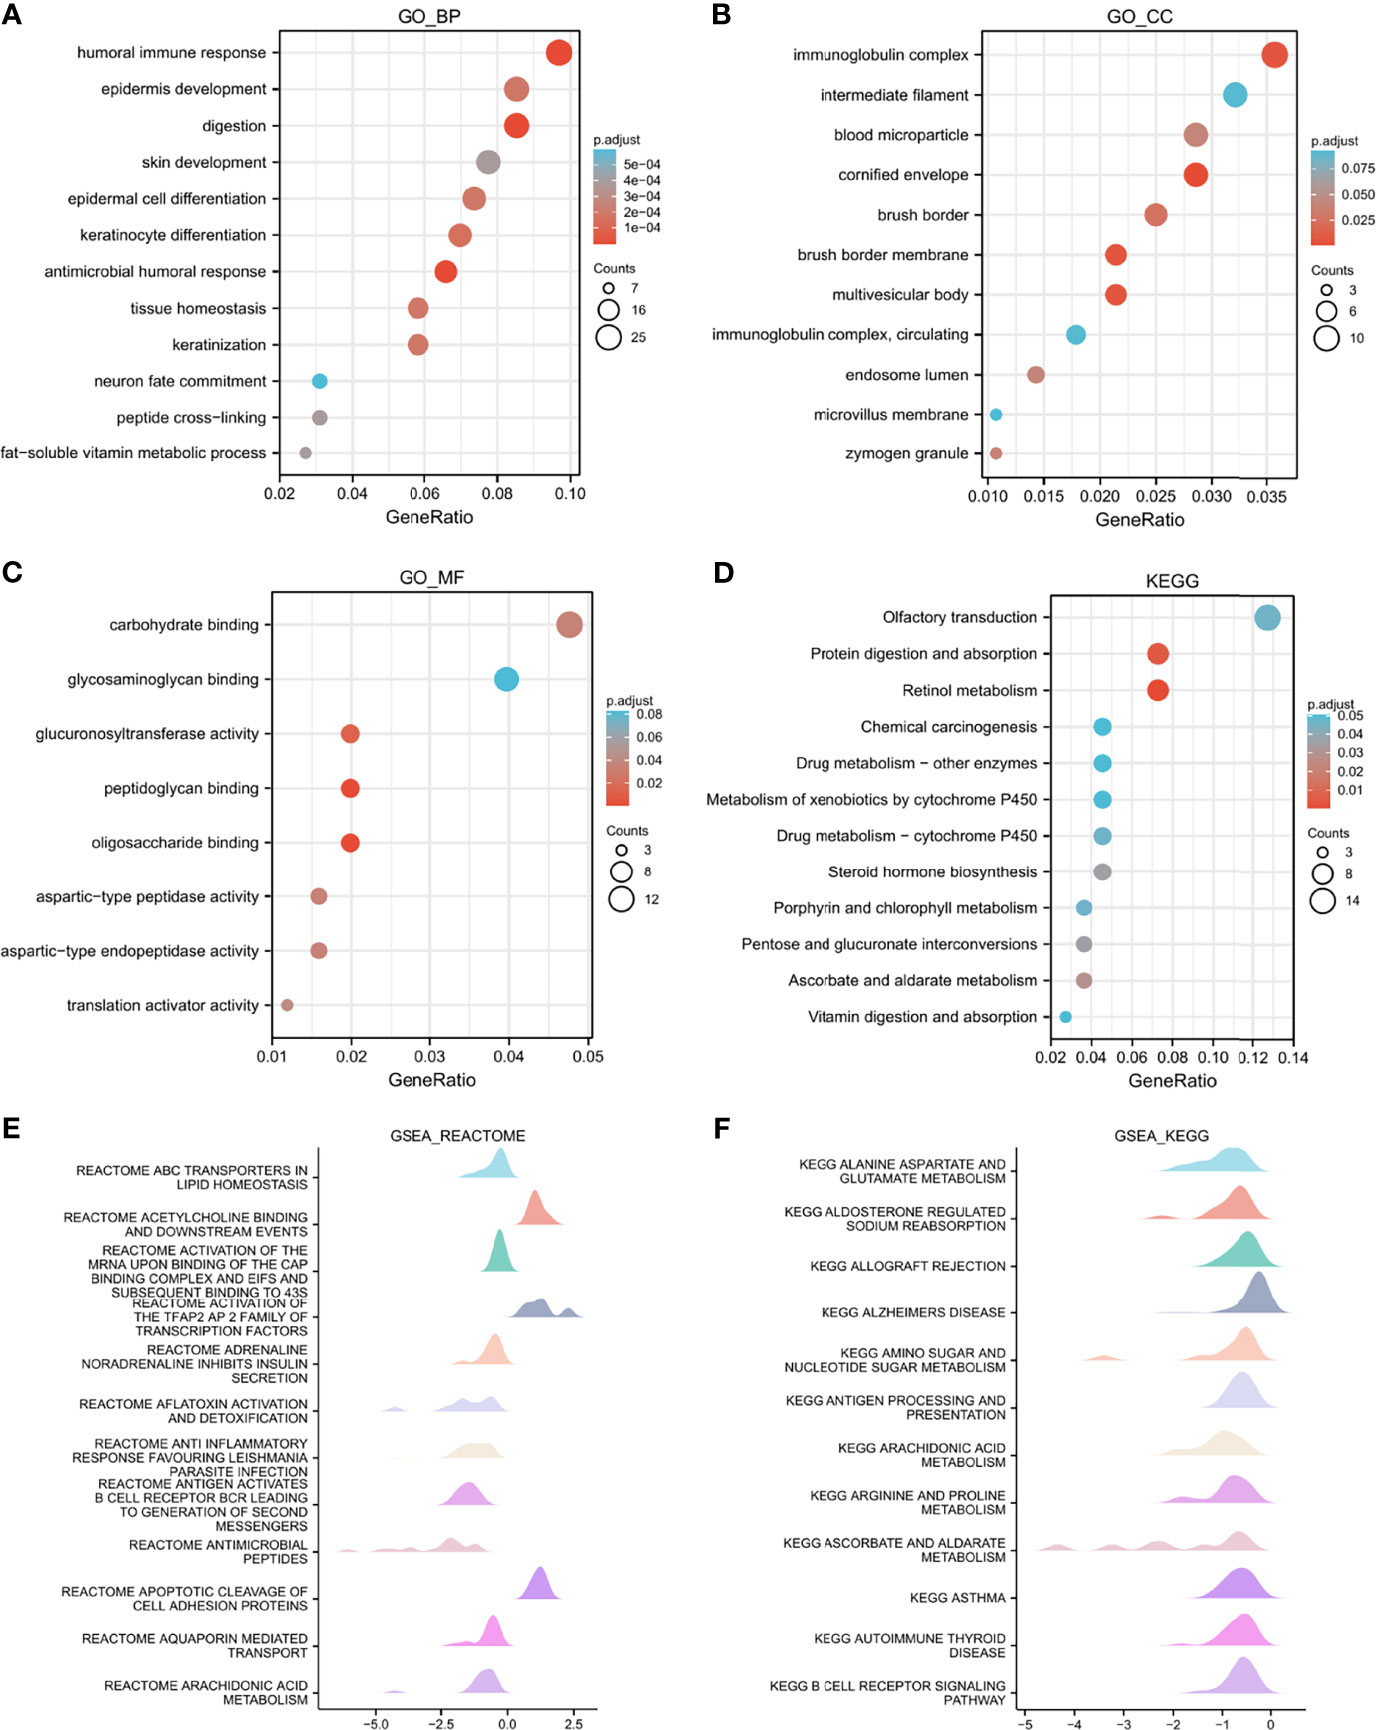
Figure 7 Functional enrichment analysis of LAMP2 in ESCA. (A–C) Significant Gene Ontology terms of the top 250 genes of DEGs most positively associated with LAMP2 include BPs, CC, and MF. (D) Significant KEGG pathways of the top 250 genes most positively associated with LAMP2. (E, F) Significant GSEA results of the top 250 genes most positively associated with LAMP2, including reactome pathways (E) and KEGG pathways (F). FDR<0.25 and p.adjust<0.05. The Gene Ontology and KEGG pathway analysis results for upregulated DEGs with jlog2fold change j >2.
Immune Infiltration Analysis in ESCA
Spearman correlation analysis showed that the expression level of LAMP2 in ESCA was related to immune cell infiltration levels as quantified by ssGSVA. The size of the dot in Figure 8A shows the absolute value of Spearman’s r, indicating that infiltrating cells were correlated with LAMP2 in the differential expression analysis. Specifically, LAMP2 was positively correlated with TCM (T central memory) cells, Th2 cells, and natural killer (NK) cells (Figure 8A) and negatively correlated with Th17 cells, pDC, NK CD56 bright cells, and eosinophils (Figure 8A). The infiltration of TCM and Th17 cells in the LAMP2 differential expression analysis was statistically significant (P<0.001) (Figures 8B, C). The relative enrichment scores of TCM and Th17 cells showed significantly positive and negative correlations with LAMP2 expression levels, respectively (P<0.001) (Figure 8D). Next, we further analyzed the relationship between LAMP2 expression and the abundance of 28 TILs using TISIDB. Figure 9A shows the relationships between TPM4 expression and LAMP2 in different types of cancer. In particular, LAMP2 expression was significantly associated with multiple types of TILs (Figures 9B–I) in ESCA. LAMP2 expression was meaningfully negatively associated with infiltrating levels of monocytes (rho = −0.348, p = 1.4e-06) (Figure 9B), Th17 cells (rho = −0.354, p = 8.98e-07) (Figure 9C), CD56dim cells (rho = −0.284, p = 9.73e-05) (Figure 9D), Act_B cells (rho = −0.152, p = 0.0385) (Figure 9E), Act_CD8 cells (rho = −0.15, p = 0.0417) (Figure 9F), Act_DC cells (rho = −0.183, p = 0.0127) (Figure 9G), and eosinophils (rho = −0.24, p = 0.00104) (Figure 9H) and positively correlated with the infiltrating levels of Th2 cells (rho = 0.146, p = 0.048) (Figure 9I) in ESCA.
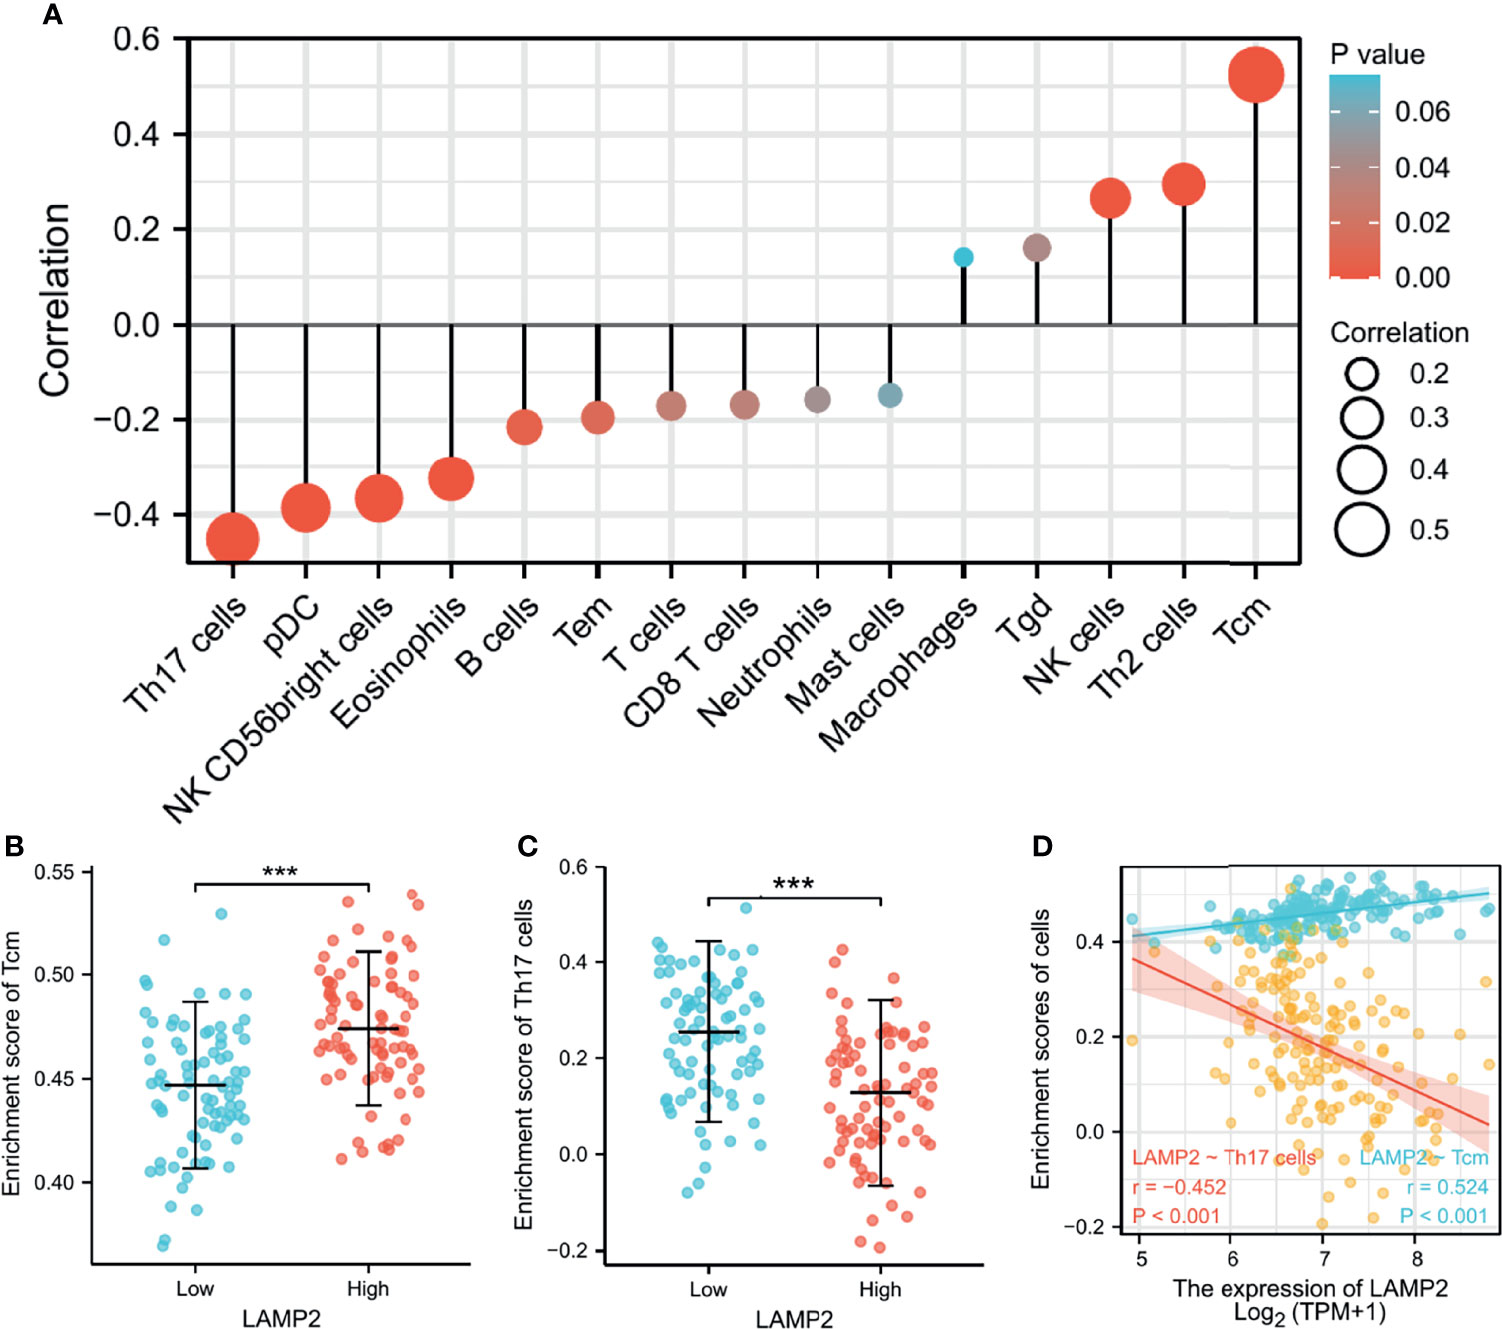
Figure 8 LAMP2 expression is linked with immune infiltration in the ESCA microenvironment. (A) LAMP2 was positively correlated with 5 immune cells and negatively correlated with 10 immune cells according to the forest plots. (B, C) Correlation between the relative enrichment score of Tcm and Th17 cells and the expression level (TPM) of LAMP2. (D) Relevance between the relative enrichment score of Tcm, Th17 cells, and LAMP2 expression level. ***p < 0.001.
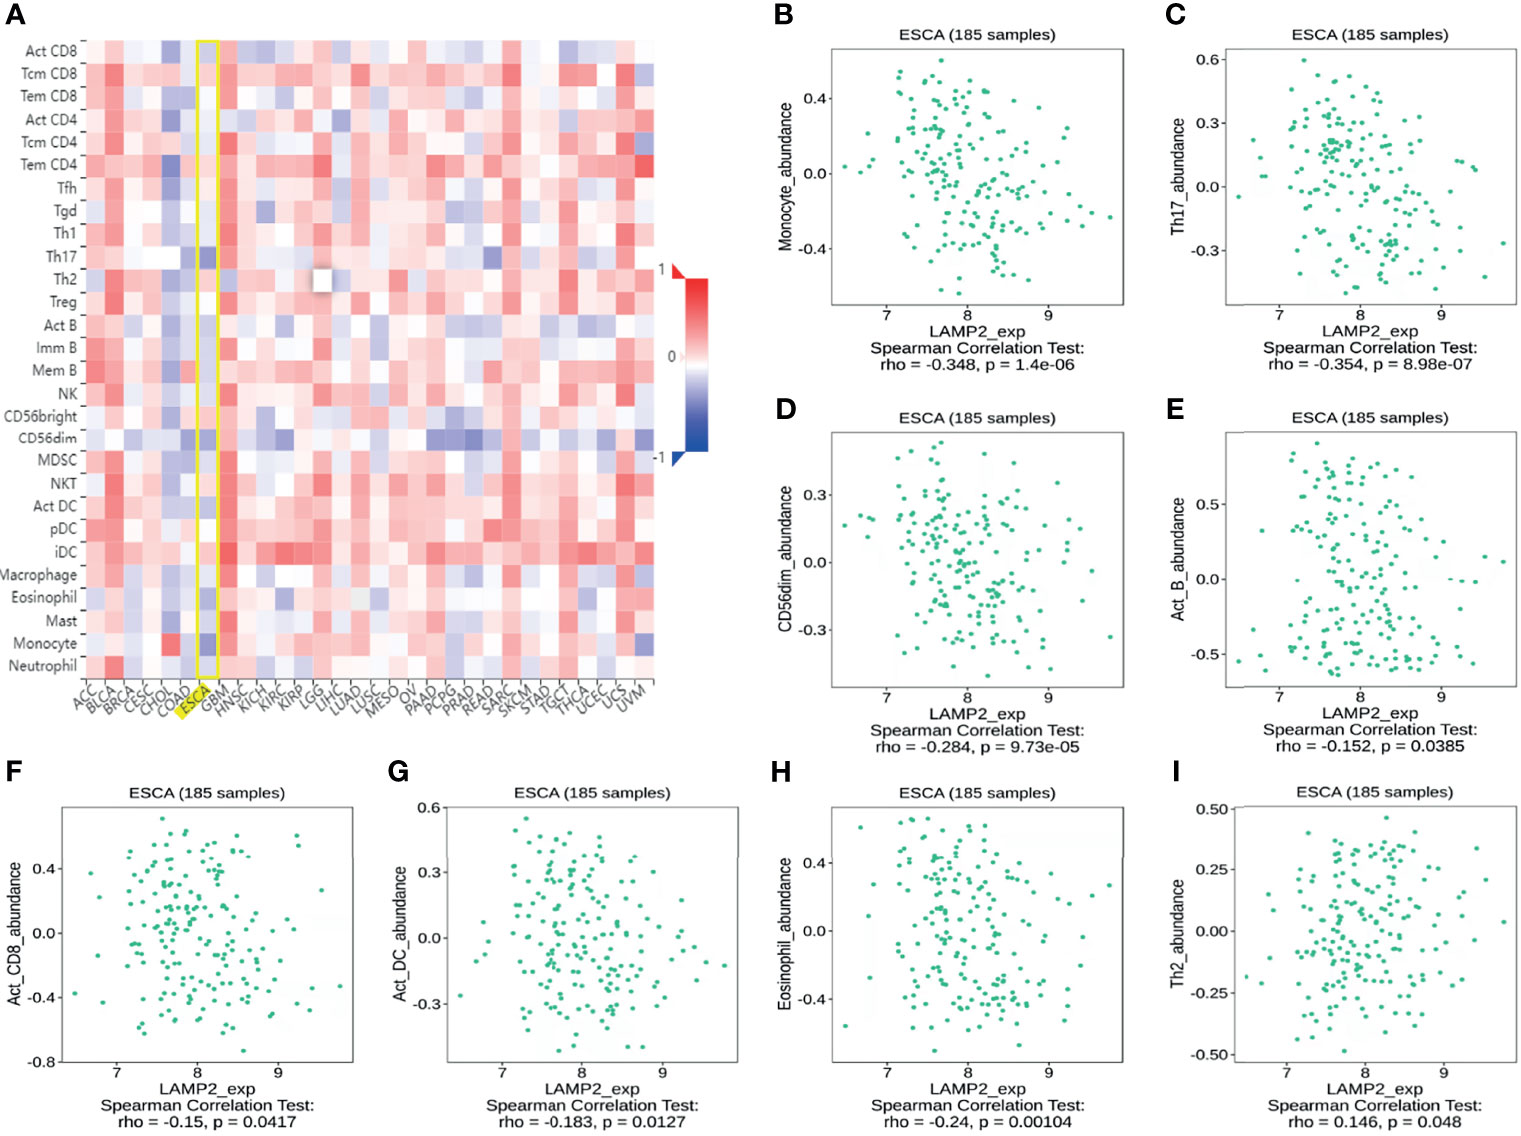
Figure 9 Correlation analysis of LAMP2 expression with the immune-related signatures of 28 TIL types in cancer based on the TISIDB database. (A) The landscape of relationship between LAMP2 expression and TILs in multiple types of cancers (red indicates positive correlation; blue indicates negative correlation). (B–H) LAMP2 expression was negatively linked with infiltrating levels of Act_DC, CD56dim, eosinophil, Act_B, monocyte, Act_CD8, and Th17 in ESCA. (I) LAMP2 expression was meaningfully positively correlated with infiltrating levels of Th2 in ESCA.
Pan-Cancer Expression Landscape of LAMP2
The TIMER database was used to analyze LAMP2 mRNA expression in 25 commonly occurring types of human cancer. LAMP2 expression was significantly upregulated in 24 cancer types, BRCA, CESC, CHOL, COAD, GBM, HNSC, KICH, KIRC, KIRP, LAML, LGG, LIHC, LUAD, LUSC, OV, PAAD, PRAD, READ, SKCM, STAD, TGCT, THCA, THYM, and UCEC, whereas it was downregulated only in DLBC (Figure 10A). Then, LAMP2 expression levels were determined using the GEPIA2 database. We found that LAMP2 was significantly more highly expressed in eight human tumor types (GBM, LGG, LIHC, PAAD, PRAD, SKCM, STAD, and READ) compared with normal tumor tissues, a result consistent with those shown in Figure 10A (Figure 10B). LAMP2 expression was significantly upregulated in 11 cancer types (BLCA, BRCA, CHOL, COAD, HNSC, KIRC, LIHC, LUAD, LUSC, READ, and STAD (Figure 10C). In addition, we analyzed the protein expression of LAMP2 across 10 cancer subtypes in CPTAC samples based on UALCAN data (Figure 10D). In CPTAC samples, high LAMP2 expression was correlated strongly with subtypes k3 and k10. These findings suggest that LAMP2 may have an important regulatory role in the progression of various cancers.
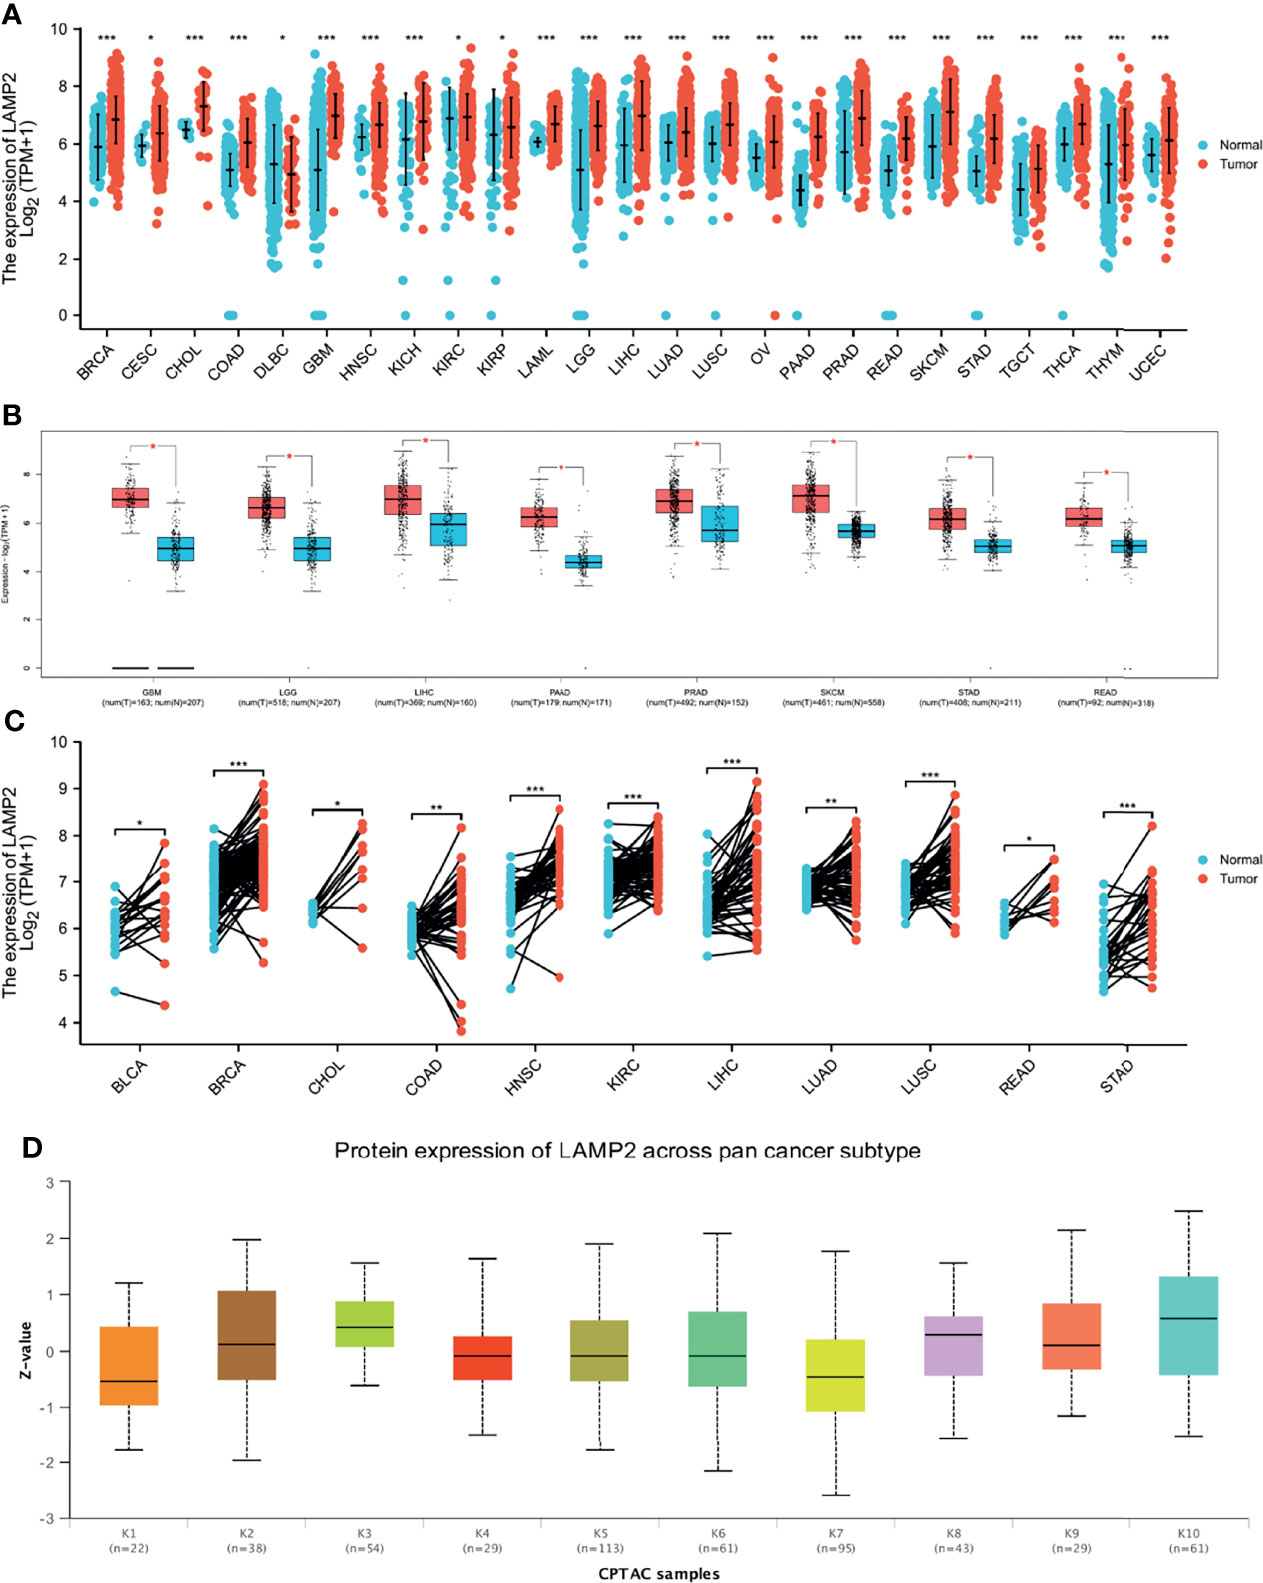
Figure 10 LAMP2 expression in pan-cancer (ruling out ESCA). (A) Expression levels of LAMP2 in a dataset containing 25 tissues in tumor cell lines, derived from the TCGA data and normal tissues with the data of the GTEx database; (B) expression levels of LAMP2 in a dataset containing 8 tissues in tumor cell lines, derived from the GEPIA2 data; (C) LAMP2 expression in TCGA tumors and adjacent normal tissues; (D) Protein expression of LAMP2 across pan-cancer subtype in CPTAC samples based on UALCAN data. (*p < 0.05, **p < 0.01, ***p < 0.001).
Pan-Cancer Diagnostic Value of LAMP2
ROC curves were constructed to assess the diagnostic value of LAMP2 in other cancers. The results showed that LAMP2 had a certain accuracy (AUC > 0.7) in predicting 20 cancer types: PAAD (AUC = 0.970) (Figure 11A), READ (AUC = 0.938) (Figure 11B), CHOL (AUC = 0.938) (Figure 11C), GBM (AUC = 0.927) (Figure 11D), STAD (AUC = 0.913) (Figure 11E), GBMLGG (AUC = 0.889) (Figure 11F), LGG (AUC = 0.879) (Figure 11G), COAD (AUC = 0.868) (Figure 11H), LAML (AUC = 0.862) (Figure 11I), LUSC (AUC = 0.842) (Figure 11J), THCA (AUC = 0.816) (Figure 11K), LIHC (AUC = 0.815) (Figure 11L), SKCM (AUC = 0.803) (Figure 11M), BRCA (AUC = 0.791) (Figure 11N), HNSC (AUC = 0.765) (Figure 11O), OV (AUC = 0.765) (Figure 11P), OSCC (AUC = 0.757) (Figure 11Q), PRAD (AUC = 0.756) (Figure 11R), TGCT (AUC = 0.734) (Figure 11S), and LUAD (AUC=0.702) (Figure 11T). LAMP2 had high accuracy in predicting PAAD, READ, CHOL, GBM, and STAD (AUC > 0.9). In addition, LAMP2 had a better reliability in the remaining cancers (0.7 < AUC < 0.9). These results suggest that LAMP2 has valid pan-cancer diagnostic value.
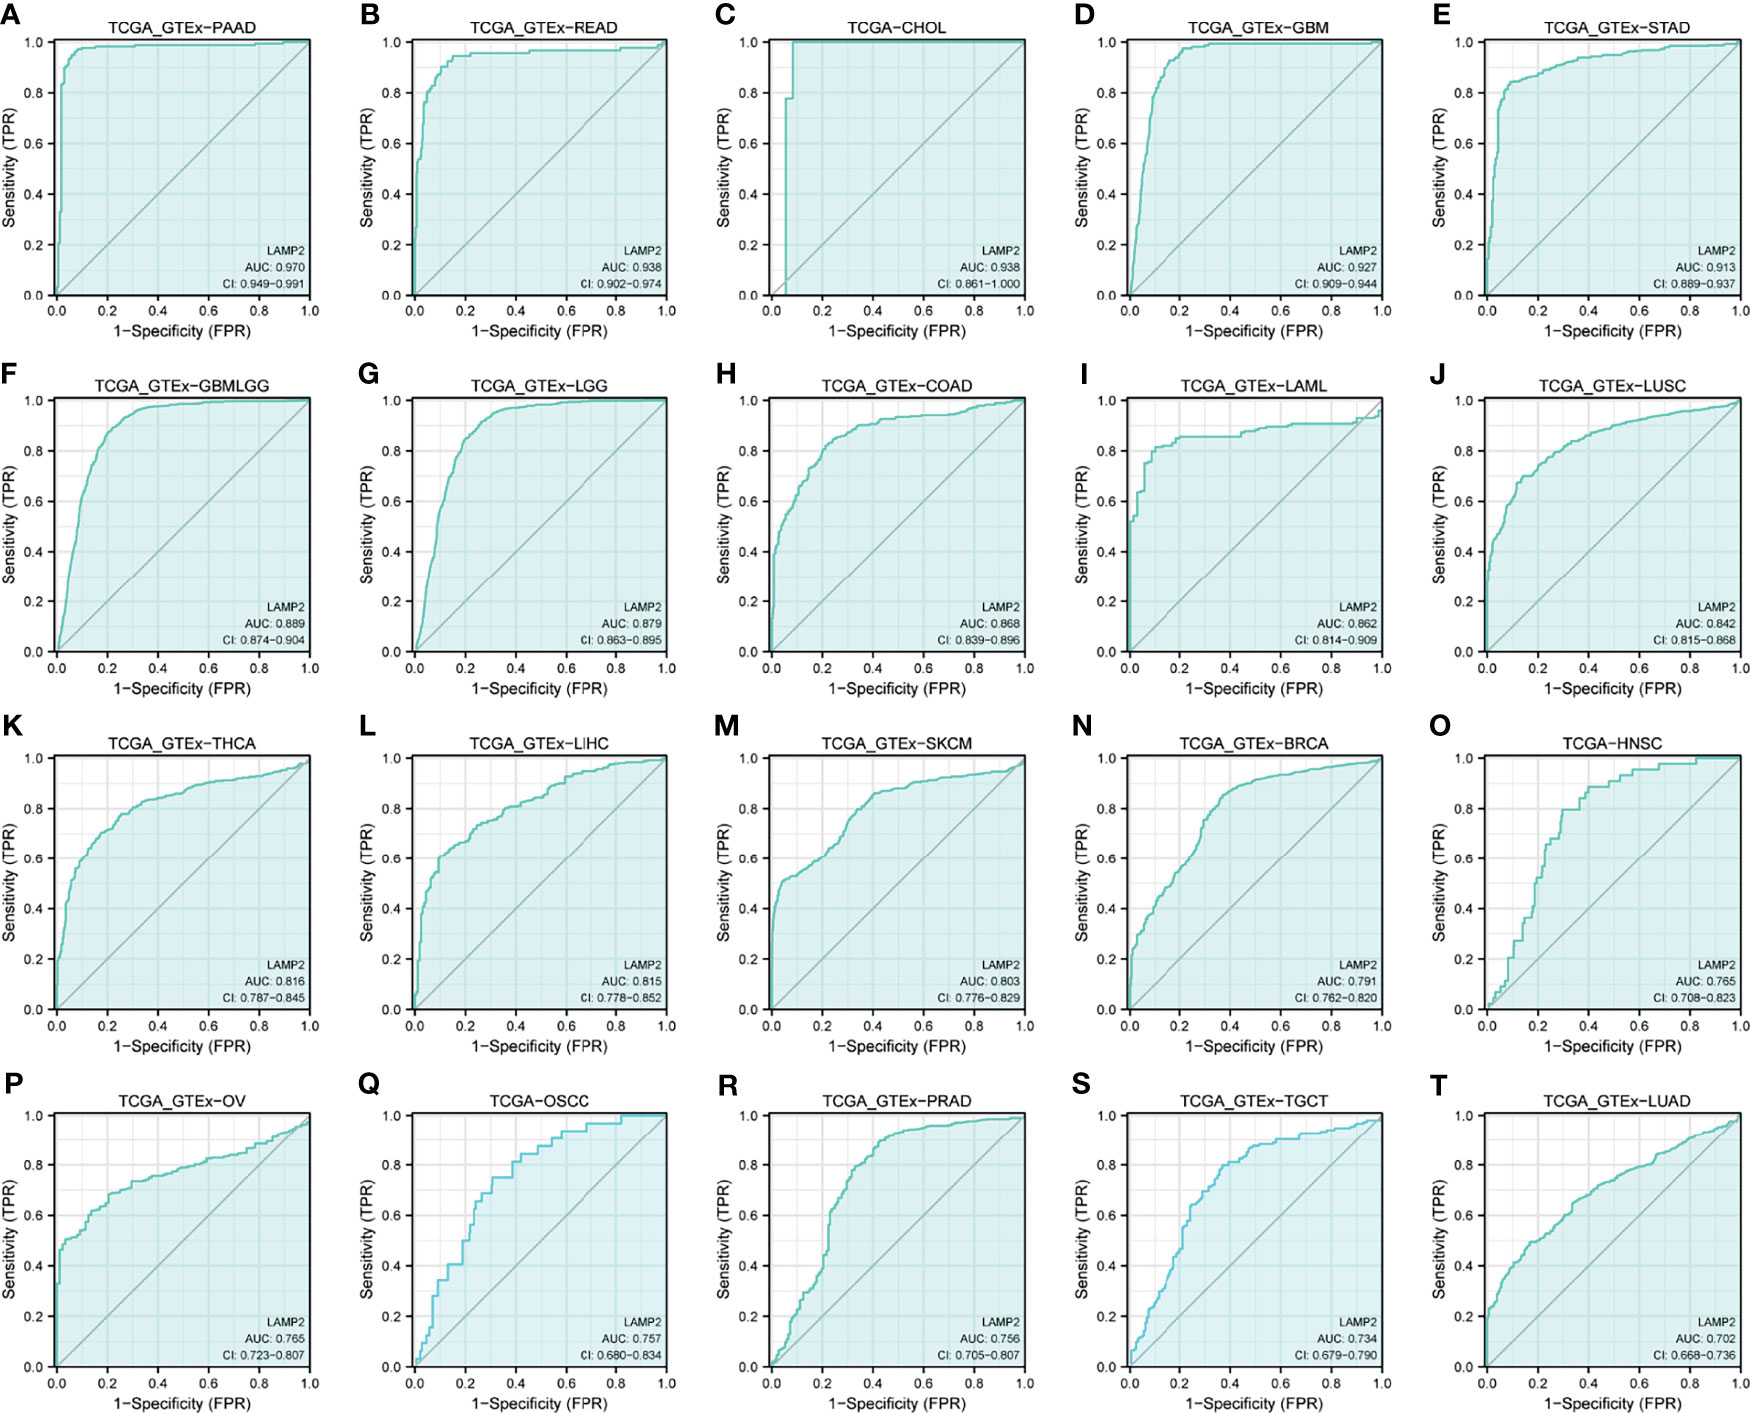
Figure 11 Receiver operating characteristic (ROC) curve for LAMP2 expression in pan-cancer. (A) PAAD; (B) READ; (C) CHOL; (D) GBM; (E) STAD; (F) GBMLGG; (G) LGG; (H) COAD; (I) LAML; (J) LUSC; (K) THCA; (L) LIHC; (M) SKCM; (N) BRCA; (O) HNSC; (P) OV; (Q) OSCC; (R) PRAD; (S) TGCT; and (T) LUAD.
Pan-Cancer Prognostic Value of LAMP2
The expression levels of LAMP2 were particularly correlated with the PFI, DSS, and OS of patients with GBMLGG, LGG, SARC, and BLCA. Higher LAMP2 expression was associated with worse PFI, DSS, and OS (P < 0.001) in GBMLGG (Figures 12A, F, K); worse PFI (P < 0.01), DSS (P < 0.01) and OS (P < 0.001) in LGG (Figures 12B, G, L); worse PFI (P < 0.05), DSS (P < 0.01), and OS (P < 0.01) in SARC (Figures 12C, H, M); worse PFI (P < 0.01), DSS (P < 0.01), and OS (P < 0.05) in BLCA (Figures 12D, I, N); worse PFI (P < 0.05) in KIRP (Figure 12E); worse DSS (P < 0.05) (Figure 12J) and OS (P = 0.01) (Figure 12O) in MESO; and worse OS (P < 0.05) in BRCA and OV (Figures 12P, Q). In addition, we validated the prognostic value of LAMP2 in a variety of cancers including LUAD, GBMLGG, breast cancer, colorectal cancer, blood cancer (follicular lymphoma), and soft tissue cancer (liposarcoma) using PrognoScan based on the GEO dataset (Supplementary Table 1). The results verified the prognostic value of LAMP2 on a pan-cancer basis.
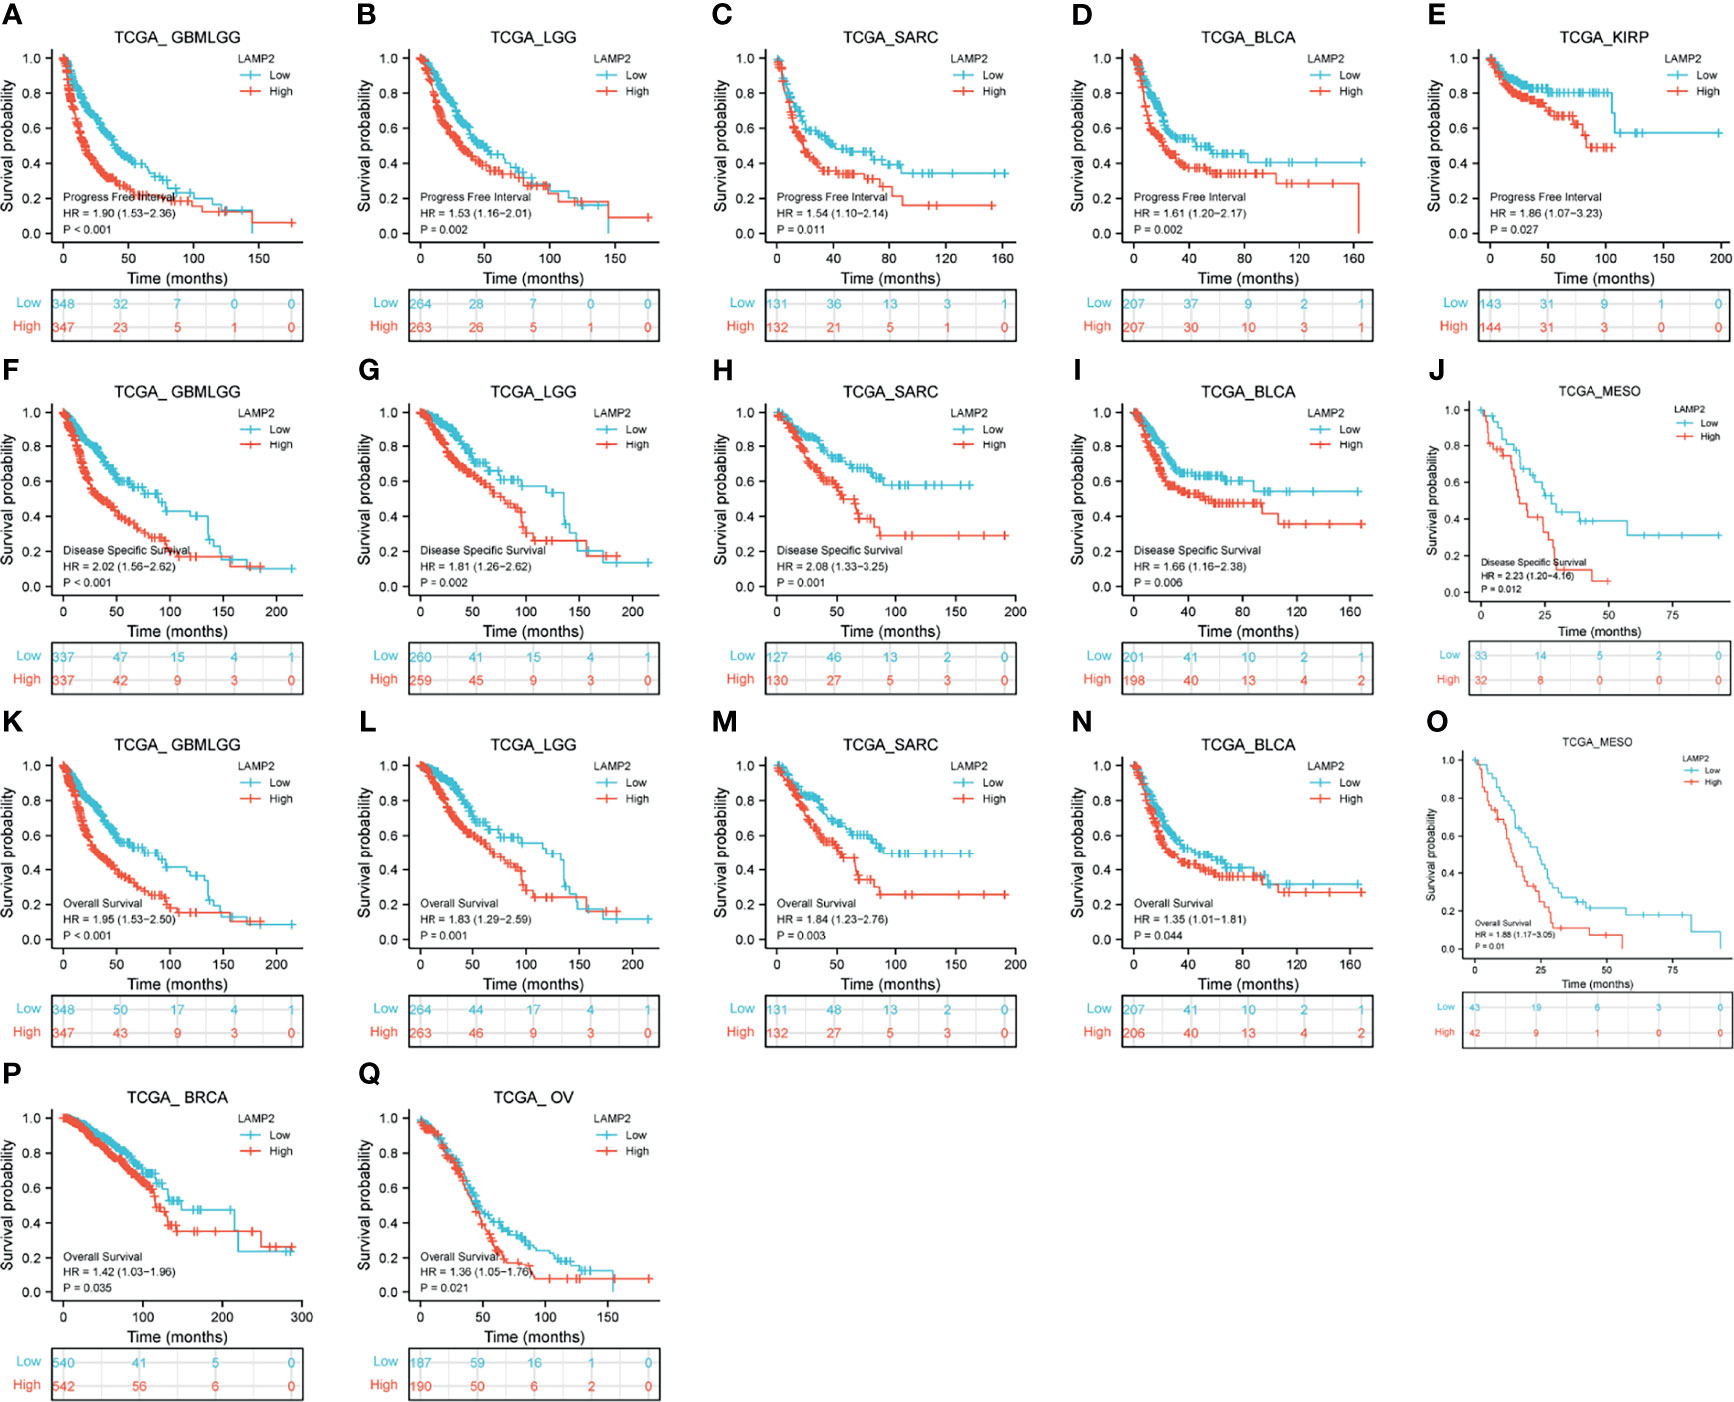
Figure 12 Correlations between LAMP2 expression and the prognosis (OS, DSS, and PFI) of other cancers. PFI: (A) GBMLGG, (B) LGG, (C) SARC, (D) BLCA and (E) KIRP; DSS: (F) GBMLGG, (G) LGG, (H) SARC, (I) BLCA and (J) MESO; and OS: (K) GBMLGG, (L) LGG, (M) SARC, (N) BLCA, (O) MESO, (P) BRCA, and (Q) OV.
Correlations Between LAMP2 and Immune Modulatory Factors Across Multiple Cancer Types
To evaluate the relevance of LAMP2 to immunity in cancer progression, we explored the relationships between LAMP2 expression and immunoinhibitors, immunostimulators, chemokines, and receptors in human heterogeneous carcinomas based on TISIDB. As shown in Figure 13, LAMP2 expression levels were positively correlated with various immunoinhibitors (including CD274, the colony-stimulating factor 1 receptor [CSF1R], and TGFBR1) (Figure 13A), several immune stimulators (including CD80, CD86, and IL6R) (Figure 13C), various chemokines (including CXCL8, CXCL10, and CXCL11) (Figure 13E), and multiple receptors (including CCR1, CCR2, and CX3CR1) (Figure 13F). In contrast, the immunoinhibitors ADORA2A and CD160, the immunostimulator TNFRSF25, and the receptor CCR10 were significantly negatively correlated with LAMP2 expression (Figures 13A, C, F). Overall, as shown in Figure 13B, there were significant pan-cancer positive correlations between LAMP2 expression and infiltration of six immune cell types (B cells, CD4+ T cells, CD8+ T cells, macrophages, neutrophils, and dendritic cells). Only six tumor types (BRCA, BRCA-luminal, COAD, KIRC, LGG, and LUAD) were consistently associated with the six immune cell types. The strongest correlations were with B cells in KTCH (r = 0.57, p < 0.01) and THCA (r = 0.52, p < 0.01); with CD4+ T cells in THCA (r = 0.47, p < 0.01) and HNSC-HPVpos (r = 0.44, p < 0.01); with CD8+ T cells in PAAD (r = 0.65, p < 0.01), KICH (r = 0.65, p < 0.01); and PRAD (r = 0.59, p < 0.01); with dendritic cells in PAAD (r = 0.58, p < 0.01) and DLBC (r = 0.55, p < 0.01); with macrophages in PAAD (r = 0.66, p < 0.01) and THCA (r = 0.51, p < 0.01); and with neutrophils in DLBC (r = 0.69, p < 0.01) and SKCM-Primary (r = 0.54, p < 0.01) (all data are from the TIMER2.0 database, and values are given to two decimal places). By contrast, five tumor types (ESCA, KICH, KIRP, THYM, and UCEC) were significantly negatively associated with CD4+ T cells, and only THCA was negatively associated with CD8+ T cells. None of the other cancer types showed any significant correlation (p > 0.05) between LAMP2 expression levels and tumor infiltration by immune cells (Figure 13B).
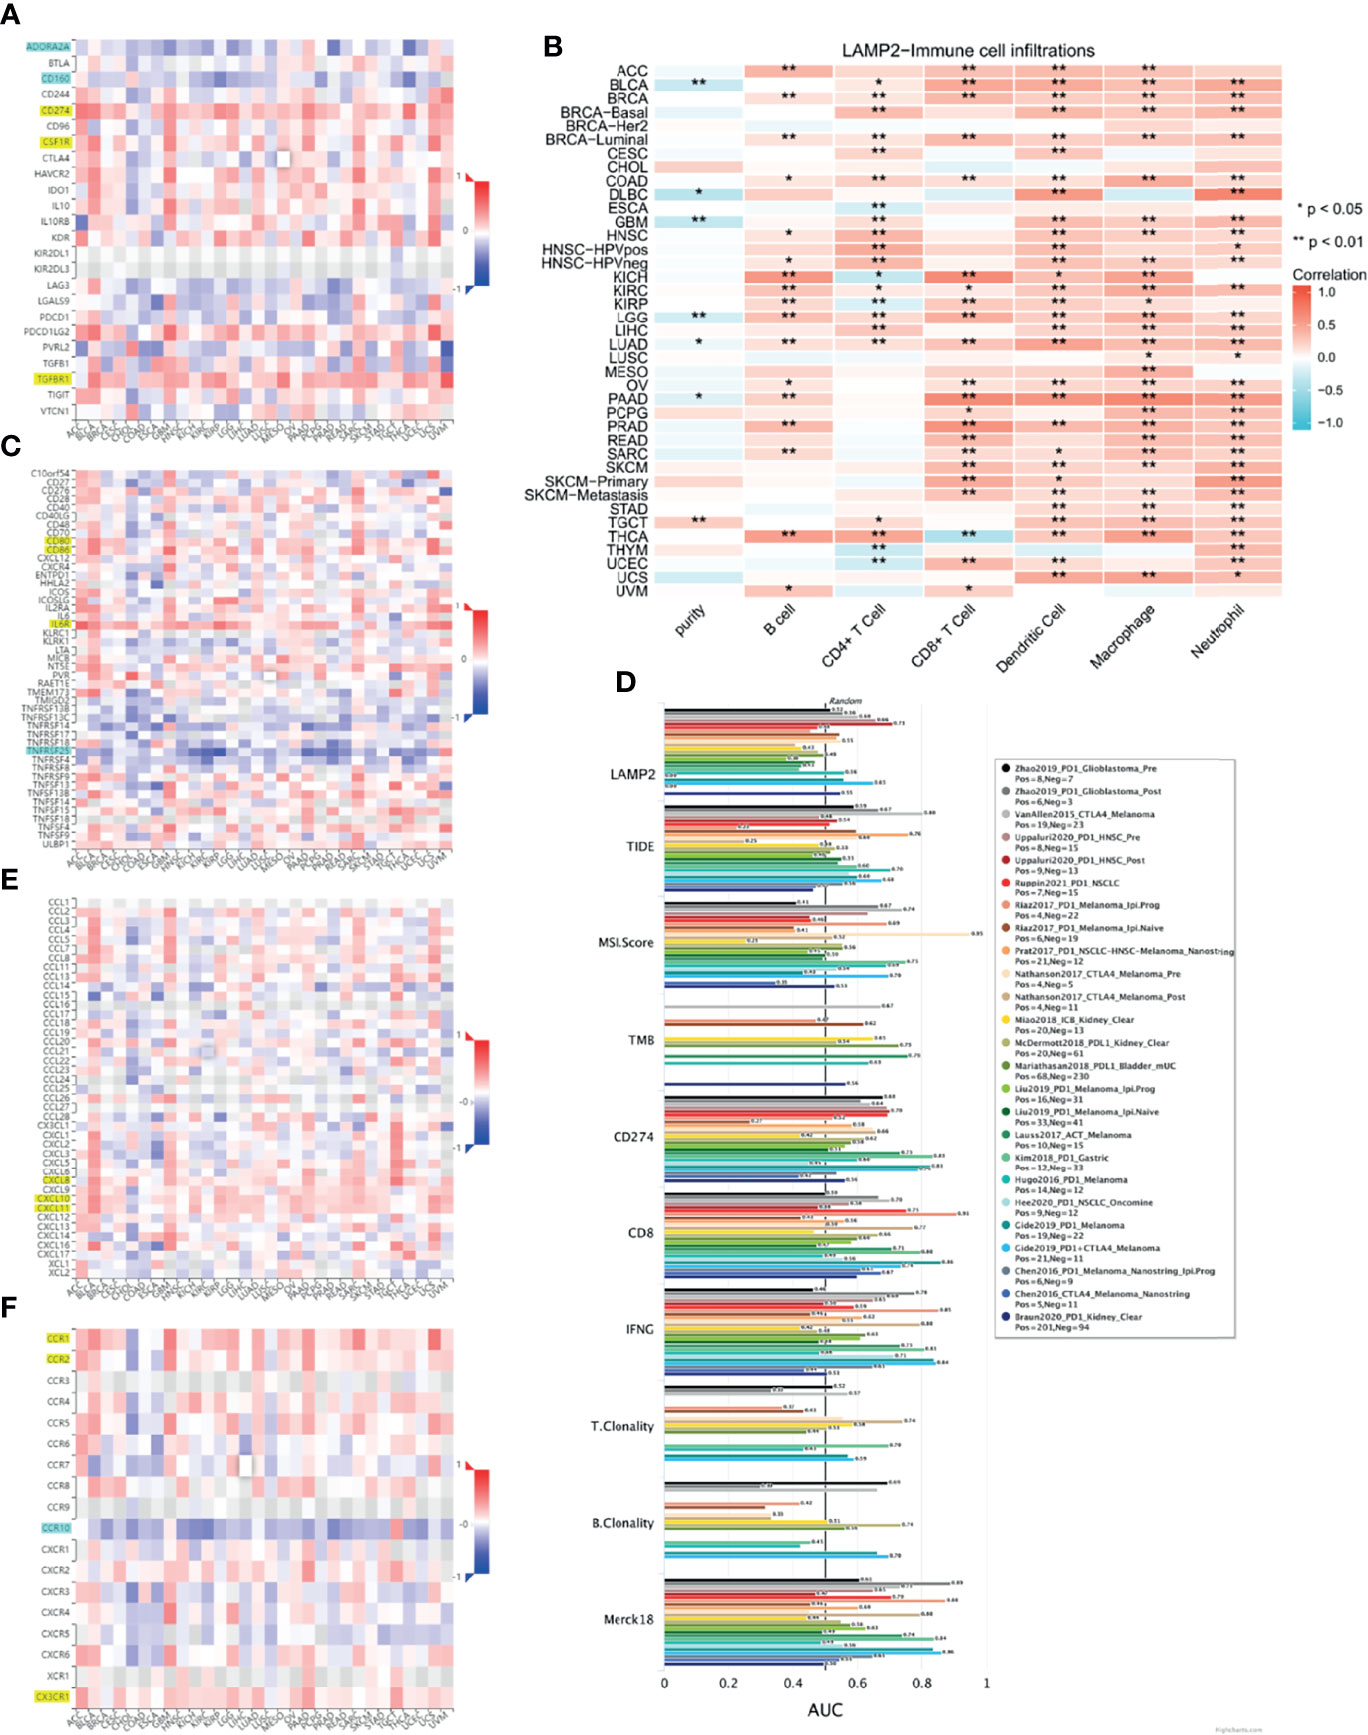
Figure 13 Immune infiltration analysis in pan-cancer. Relationship between LAMP2 expression and (A) immunoinhibitor, (C) immunostimulator (E) chemokine, and (F) receptor in human heterogeneous carcinomas based on the TISIDB database. (B) Heat map showing the correlation between infiltration of six immune cells and LAMP2 expression based on the TIMER2.0 database. (D) Bar chart shows the biomarker correlation of LAMP2 compared to standardized cancer immune evasion biomarkers in the ICB subcohort based on the TIDE algorithm. The AUC was used to evaluate the predictive performance of the tested biomarkers for ICB response status. *p < 0.05, **p < 0.01.
We assessed the biomarker relatedness of LAMP2 by comparing it using standardized biomarkers based on predictive power response outcomes and OS in the immune checkpoint blockade (ICB) subcohort. These results showed that LAMP2 alone had an AUC value >0.5 in 12 of the 25 ICB subcohorts (Figure 13D). LAMP2 showed a higher predictive value than TMB, T. Clonality, and B. Clonality, which respectively had AUC values >0.5 in seven, nine, and seven ICB subcohorts. However, the predictive value of LAMP2 was lower than those of TIDE, MSI score, CD274, CD8, IFNG, and Merck 18. In summary, LAMP2 is related to immune modulatory factors in a variety of tumor types.
LAMP2 Expression in Immune and Molecular Subtypes of Cancers
An investigation of the correlations between LAMP2 expression and tumor molecular subtypes and immune subtypes based on TISIDB showed that LAMP2 expression was meaningfully linked with several different immune subtypes (C1: wound healing, C2: IFN-gamma dominant, C3: inflammatory, C4: lymphocyte depleted, C5: immunologically quiet, and C6: TGF-b dominant) in five cancer types (Figure 14A): BLCA (Figure 14B), BRCA (Figure 14C), LIHC (Figure 14D), STAD (Figure 14E), and TGCT (Figure 14F). We also found that LAMP2 was differentially expressed in the diverse molecular subtypes of various tumors (Figure 14G), including BRCA, COAD, STAD, LIHC, and ESCA. Specifically, LAMP2 expression was higher in the Her2 molecular subtype of BRCA (Figure 14H), the CIN molecular subtype of COAD (Figure 14I), HM-SNV molecular subtype of STAD (Figure 14J), iCluster:2 molecular subtype of LIHC (Figure 14K), and ESCC subtype of ESCA compared with the other molecular subtypes of the respective tumor types (Figure 14L). In conclusion, LAMP2 is highly expressed in the immune and molecular subtypes of some cancer types.
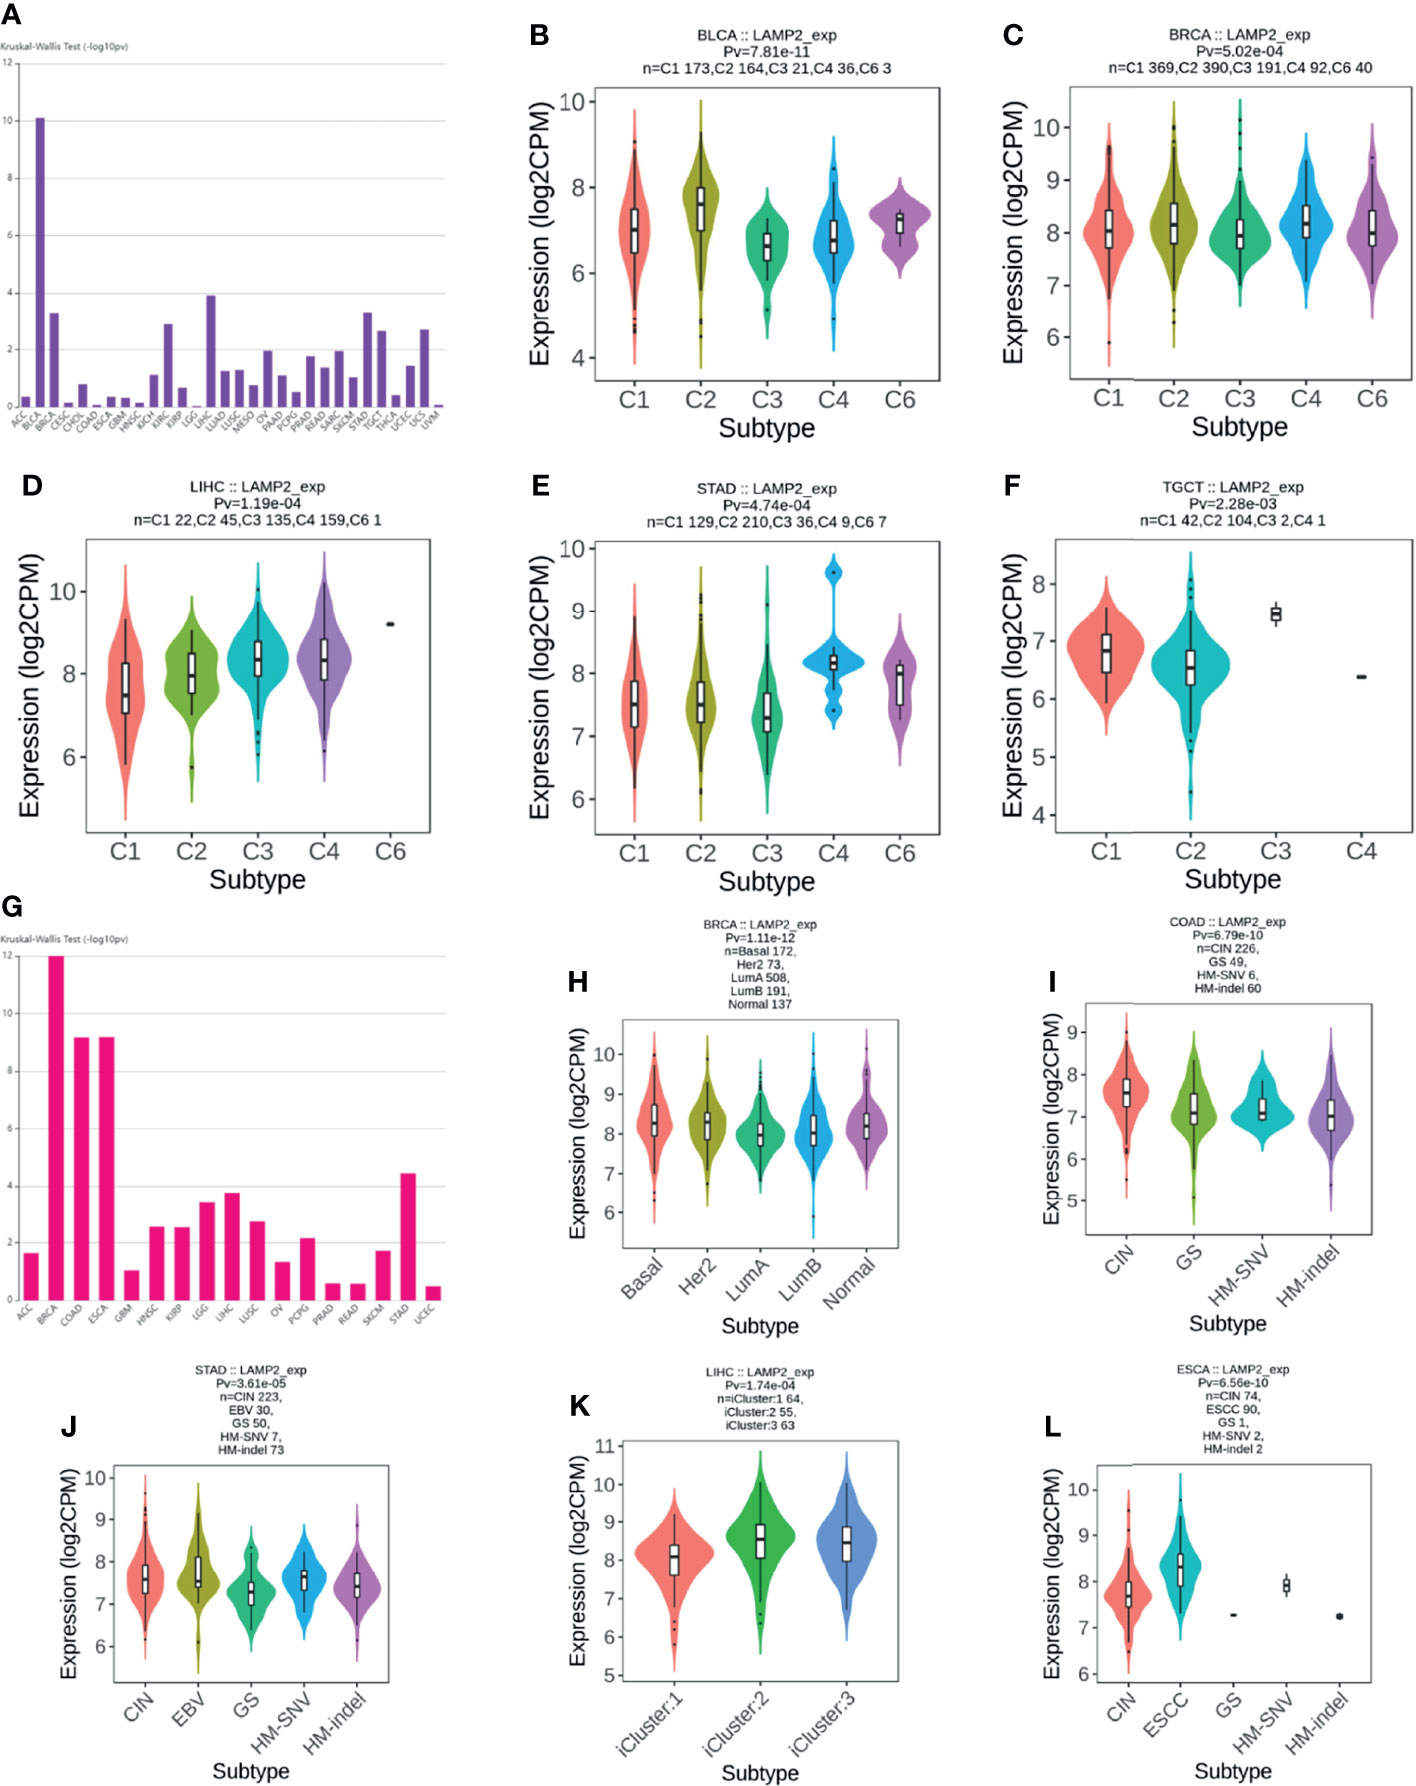
Figure 14 LAMP2 expression in immune and molecular subtypes of cancers. (A) Correlation of LAMP2 expression with immune subtypes in tumors based on the TISIDB database; (B) BLCA; (C) BRCA; (D) LIHC; (E) STAD; and (F) TGCT. (G) Correlation of LAMP2 expression with molecular subtypes in tumors based on the TISIDB database; (H) BRCA; (I) COAD; (J) STAD; (K) LIHC; and (L) ESCA.
LAMP2 Expression Validated by Immunohistochemistry
We performed immunohistochemical staining and found that the expression levels of LAMP2 protein in ESCC tissues were significantly higher than those in corresponding normal tissues (Figures 15A, C). The subcellular localization of LAMP2 in cancer cells indicated that it was predominantly expressed in cytoplasmic lipid droplets (Figure 15B). Finally, the results further confirmed the differences in LAMP2 expression between the tissues of five tumor types and the corresponding normal tissues from THPA and showed that LAMP2 was significantly highly expressed in gliomas (Figure 15D), BLCA (Figure 15E), BRCA (Figure 15F), OV (Figure 15G), and KIRP (Figure 15H).
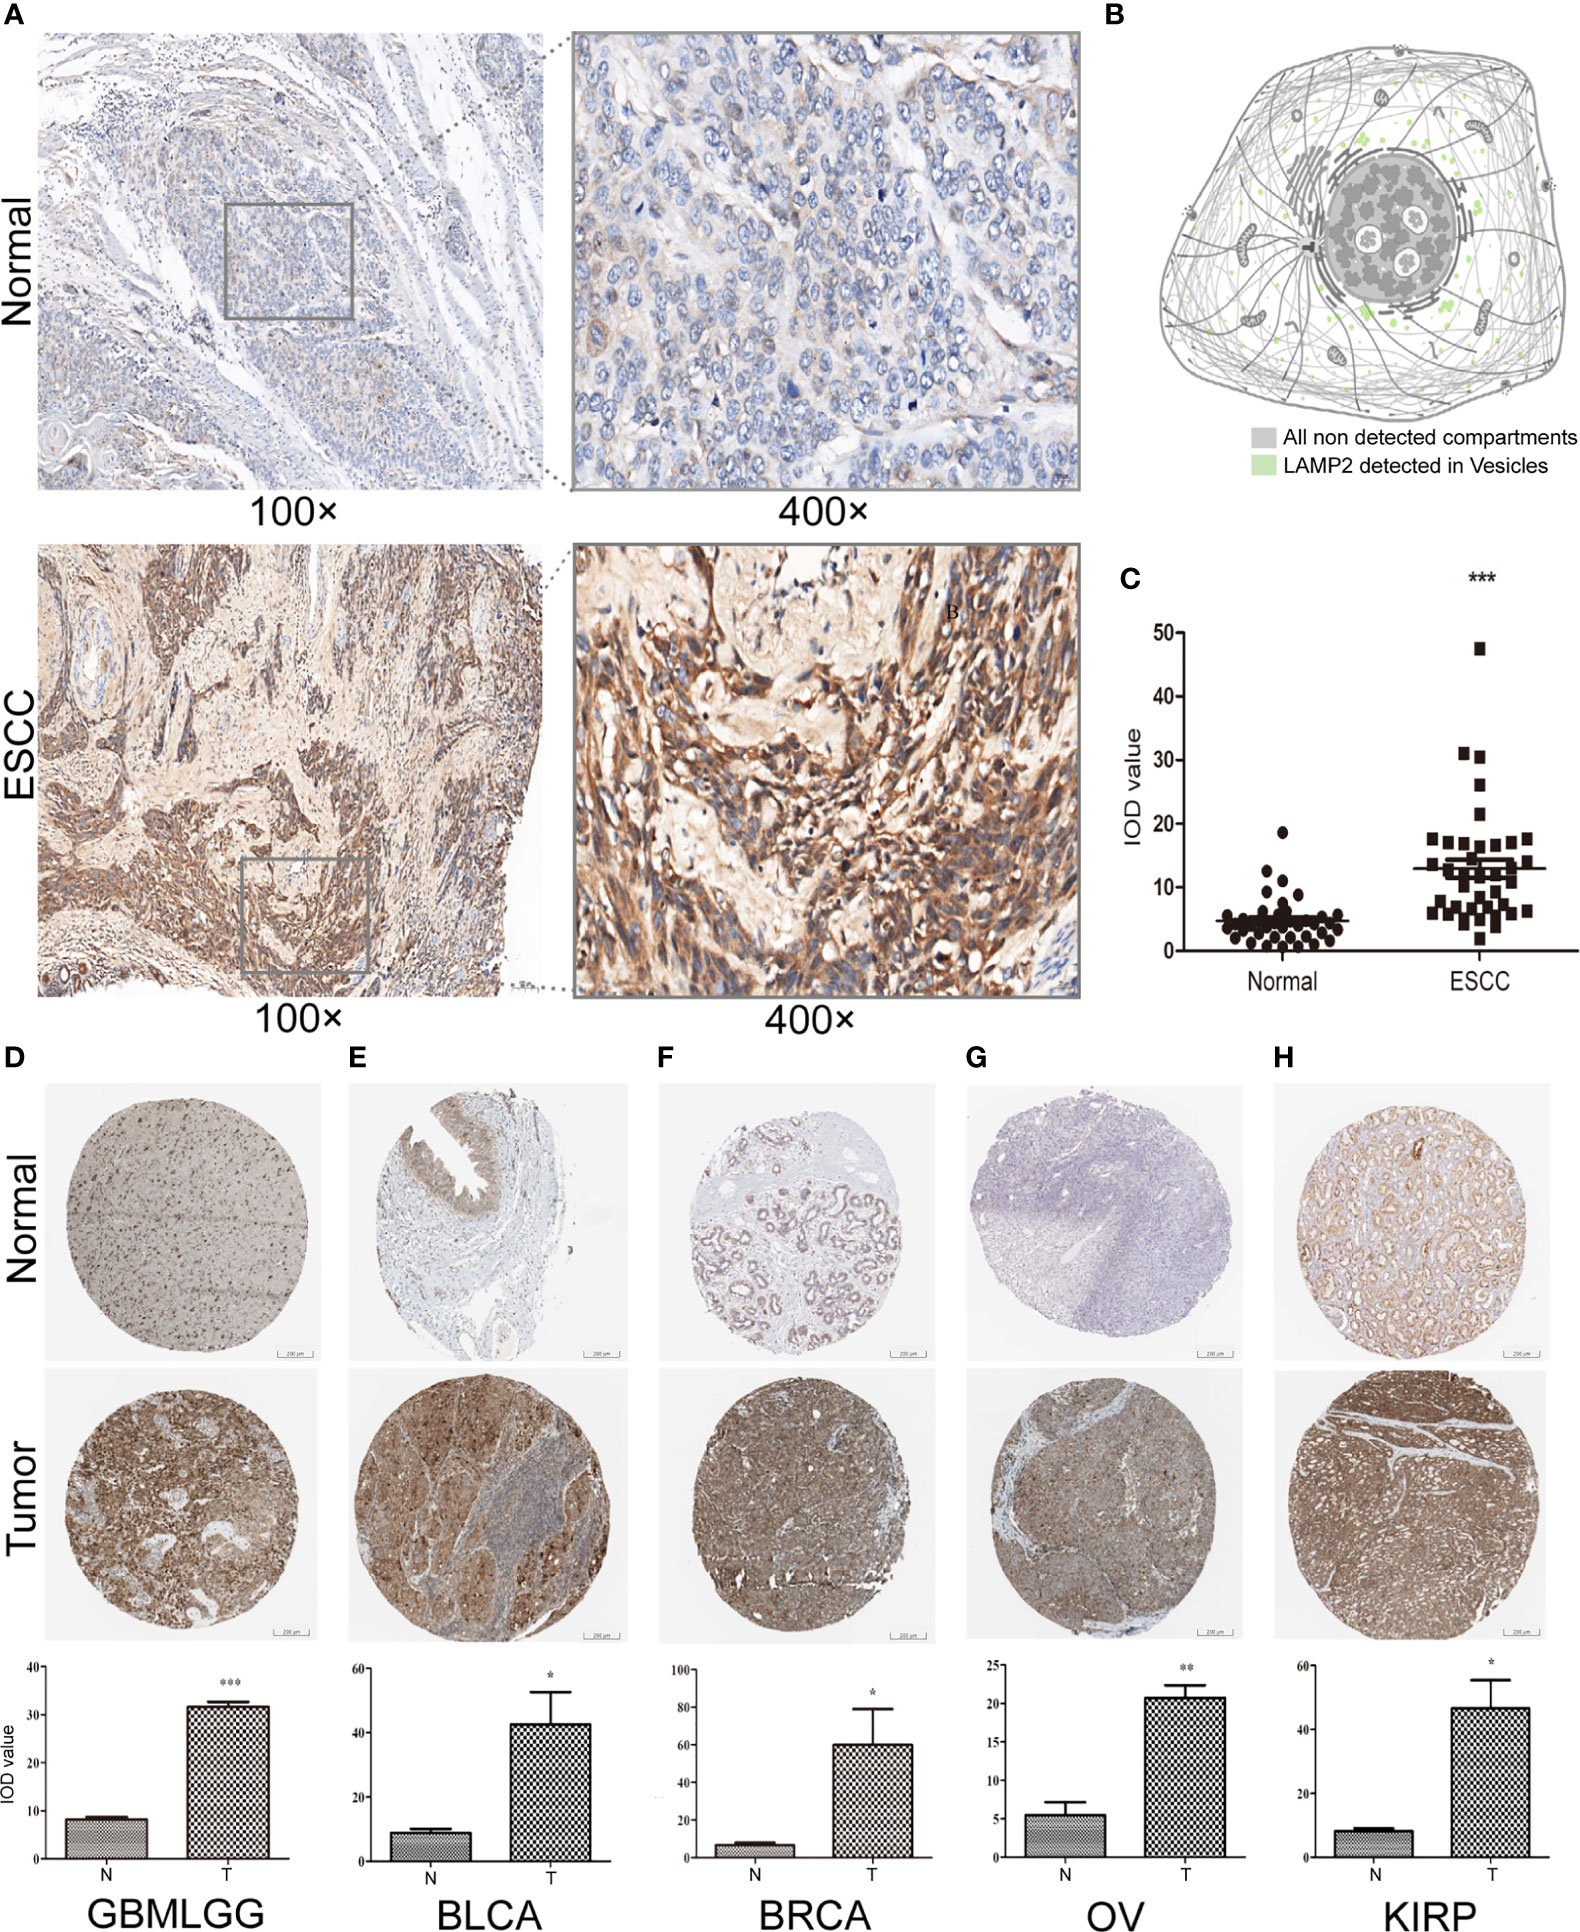
Figure 15 LAMP2 expression validated by applying immunohistochemistry. (A) Expression of LAMP2 in representative negative and positive specimens of ESCC stained by IHC. (B) Subcellular localization of LAMP2 in cancer cells by the THPA database. Antibody-green. (C) Quantitative staining. Black dots indicate the mean density and IOD values of 40 images of ESCC patient tissue and corresponding normal tissue. The expression of LAMP2 gene was significantly higher in (D) GBMLGG, (E) BLCA, (F) BRCA, (G) OV, and (H) KIRP expression than in the corresponding normal tissues by the THPA database. *P < 0.05, **P < 0.01, ***P < 0.001.
Discussion
ESCA is the sixth most common cause of cancer deaths (39). Despite recent advances in molecular marker diagnostics, radiomics, targeted therapies, and immunotherapy, the long-term survival rates of patients with ESCA remain relatively poor (4–6). Therefore, it is of great importance to identify the potential therapeutic targets for ESCA. ESCC and EAC are the main subtypes of ESCA (2, 6). LAMP2, a single transmembrane protein located on the restriction endosomal membranes of lysosomes and advanced nuclear nucleosomes, has an important role in tumor cell metastasis in EAC (24). We found that LAMP2 was highly expressed with extremely high predictive value (AUC = 0.939) in ESCA; this result was validated by immunohistochemistry. Our findings were consistent with those of previous reports and showed that LAMP2 could serve as a biomarker to promote the development and progression of ESCA (40). Similarly, studies have confirmed that LAMP2 can promote cell migration and invasion in some types of cancers, including LUAD (13), LIHC (14), COAD (15), and PRAD (16, 17). However, no previous studies have evaluated the significance of LAMP2 on a pan-cancer basis. In this study, our findings supplemented those of previous reports to indicate that LAMP2 has a potential as a new epigenetic biomarker and target that promotes the development and progression of the majority of malignant tumors.
High LAMP2 expression was related to subtypes k3 and k10 in CPTAC samples (41). Hypoxia affects the tumor microenvironment (TME). Tumor cells secrete a variety of cytokines and chemokines during hypoxia and establish a gradient that creates recruitment or rejection of immune cell subsets in hypoxic areas; this ultimately promotes the formation of an immunosuppressive microenvironment and immune escape and functional angiogenesis, which, in turn, promotes tumor development and metastasis (42). In the k3 subtype, tumor cells may be more likely to develop a hypoxic microenvironment. Hypoxia is known to dysregulate the complement system in various cell types of the TME (41, 43, 44). In the k10 subtype, tumor cells are frequently exposed to endogenous and exogenous factors that alter protein homeostasis, resulting in ER stress. ER stress states have been shown to regulate a variety of precancerous features and the function of dynamically reprogrammed immune cells (45). ER stress may be activated by a variety of factors that interfere with protein folding capacity, resulting in the unfolded protein response and cell death (41, 46). The present study provides some new evidence that a high expression of LAMP2 in tumor cells may induce tumor growth and metastasis through the formation of a hypoxic microenvironment and ER stress. The exact mechanism requires further experimental investigation.
Our findings also provide an important basis for further comprehensive analysis of the role of LAMP2 in the clinical subgroups of ESCA. Kaplan–Meier survival analysis suggested that high LAMP2 expression was significantly correlated with worse prognosis in ESCA. The results were consistent with those of previous research (24). The correlations between LAMP2 expression and various clinicopathological features highlight the need to pay more attention to patients over the age of 60 and those without Barrett’s esophagus or distal tumor central location in order to improve their clinical outcomes. We found that LAMP2 was highly expressed in GBMLGG, BLCA, BRCA, OV, and KIRP. These results were validated by immunohistochemistry in TPHA. LAMP2 has diagnostic and prognostic importance in the above tumor types and is a potential biomarker or therapeutic target for precision treatment of tumors.
GeneMANIA was used to identify 20 genes that were closely related to LAMP2, including LAMP1, CD60, IMPDH1, LAMP3, and LAMP5. LAMP3 has been reported to be correlated with ESCA (47). Using the STRING database, we also found that SLC40A1, TFR2, and HFE protein expression was meaningfully linked with LAMP2. SLC40A1 has been shown to be a significant risk gene with respect to OS in ESCC patients (48). According to functional enrichment analysis, LAMP2 was mainly associated with immune-related functions, for example, humoral immune response, antimicrobial humoral response, and immunoglobulin complex. Next, heat maps were used to illustrate the top 10 genes positively correlated with LAMP2; these were LINC02457, AC005865.1, LRRC38, CNGB1, EFCAB1, KREMEN2, AC099066.2, PHF24, LAMA1, and SLC6A2. CNGB1 is involved in the olfactory pathway and has been found to be overexpressed in ESCC. The expression of CNGB1 has been proposed as a marker with potential diagnostic or therapeutic value (49). The top 10 genes negatively correlated with LAMP2 expression were AGR3, CDC42EP5, CLRN3, SMIM24, PIGR, IHH, DMBT1, MIR3131, MS4A8, and TM4SF5. PIGR has been considered as a candidate prognostic biomarker in several cancers, and a previous study reported that reduced PIGR expression was associated with more aggressive tumors in the distal esophagus (50, 51). The finding that PIGR expression was negatively correlated with LAMP2 further validates the reliability of LAMP2 as a potentially relevant biomarker.
Accelerated tumor progression is not only associated with malignant cells but is also influenced by the TME (52). As researchers continue to understand and appreciate the tumor immune microenvironment, there is a great potential to develop the ability to predict and guide the responses to immunotherapy (53). Other studies have shown that the TME promotes tumor proliferation and metastasis by producing growth factors, chemokines, and matrix-degrading enzymes and supporting tumor cells (54). Our results show that LAMP2 expression in ESCA and other tumors is positively correlated with tumor-infiltrating immune cells. For example, LAMP2 gene expression levels were positively correlated with those of immunoinhibitors CD274 (PD-L1) and CSF1R in a variety of cancers. Different types of cancers show high expression levels of PD-L1 and use PD-L1/PD-1 signaling to evade T-cell immunity (55). The use of CSF1R inhibitors in cancer therapy is currently of great interest, with various therapeutic approaches targeting its ligand or receptor in clinical development (56). Through functional enrichment analysis, we found that the mechanism of LAMP2 in ESCA may also be primarily associated with the aforementioned immune-related genes. We also found the protein expression of LAMP2 across a pan-cancer subtype; high LAMP2 protein expression was associated with the k3 subtype of the innate immune system. These findings suggest a possible impact of LAMP2 expression on the tumor immune microenvironment. Further elucidating the interactions between tumors and immune cells will help to predict immunotherapeutic responses and develop new immunotherapeutic targets. In addition, we showed that LAMP2 was more strongly associated with certain immune and molecular subtypes in multiple cancer types. Notably, in BRCA, STAD, and LIHC, LAMP2 was strongly associated with both molecular and immune subtypes. Hence, the studies focusing on a unique molecular subtype or immune subtype may help determine the potential mechanism of action of LAMP2 and demonstrate that LAMP2 is a promising diagnostic pan-cancer biomarker that is involved in immune regulation. Ultimately, LAMP2-related studies and new targeted therapies may help to improve the poor prognosis of patients with esophageal and other cancers.
There were some limitations to this study. First, we explored LAMP2 using GEO, TCGA, GTExase, and other public databases, but there was a lack of actual clinical data. Second, we used immunohistochemistry to validate the results in ESCC tissues but lacked EAC specimens. The data from immunohistochemistry experiments on other tumor types were obtained from public databases. Further precise validation by biological experiments is required.
In summary, we found that LAMP2 may have a role in predicting poor prognosis and relate to the level of immune infiltration in ESCA and other cancers. Thus, LAMP2 could serve as a novel prognostic biomarker and provide an opportunity and challenge to develop new immunotherapy strategies.
Data Availability Statement
The original contributions presented in the study are included in the article/Supplementary Material. Further inquiries can be directed to the corresponding authors.
Ethics Statement
The studies involving human participants were reviewed and approved by the clinical research ethics committee of the First Affiliated Hospital of Shantou University. The patients/participants provided their written informed consent to participate in this study. Written informed consent was not obtained from the individual(s) for the publication of any potentially identifiable images or data included in this article.
Author Contributions
ZX and SL conceptualized and designed the study. SX and SZ collected data. SL and YL provided the tissue specimen and staining. XL and DL performed the data analysis. ZX and SL designed and revised the manuscript. All authors contributed to the article and approved the submitted version.
Funding
This work was supported by the National Natural Science Foundation of China (No.81001340), the Medical Scientific Research Foundation of Guangdong Province, China (A2021474), and the Medical and Health Science and Technology Project of Shantou, Guangdong, China (210526156491330).
Conflict of Interest
The authors declare that the research was conducted in the absence of any commercial or financial relationships that could be construed as a potential conflict of interest.
Publisher’s Note
All claims expressed in this article are solely those of the authors and do not necessarily represent those of their affiliated organizations, or those of the publisher, the editors and the reviewers. Any product that may be evaluated in this article, or claim that may be made by its manufacturer, is not guaranteed or endorsed by the publisher.
Supplementary Material
The Supplementary Material for this article can be found online at: https://www.frontiersin.org/articles/10.3389/fonc.2022.884448/full#supplementary-material
References
1. Smyth EC, Lagergren J, Fitzgerald RC, Lordick F, Cunningham D. Oesophageal Cancer. Nat Rev Dis Primers (2017) 3:17048. doi: 10.1038/nrdp.2017.48
2. Talukdar FR, di Pietro M, Secrier M, Moehler M, Goepfert K, Lima SSC, et al. Molecular Landscape of Esophageal Cancer: Implications for Early Detection and Personalized Therapy. Ann NY Acad Sci (2018) 1434(1):342–59. doi: 10.1111/nyas.13876
3. Yang H, Hu B. Recent Advances in Early Esophageal Cancer: Diagnosis and Treatment Based on Endoscopy. Postgrad Med (2021) 133(6):665–73. doi: 10.1080/00325481.2021.1934495
4. Yang YM, Hong P, Xu WW, He QY, Li B. Advances in Targeted Therapy for Esophageal Cancer. Signal Transduct Target Ther (2020) 5(1):229. doi: 10.1038/s41392-020-00323-3
5. Sah BR, Owczarczyk K, Siddique M, Cook GJR, Goh V. Radiomics in Esophageal and Gastric Cancer. Abdom Radiol (New York) (2019) 44(6):2048–58. doi: 10.1007/s00261-018-1724-8
6. Liu K, Zhao T, Wang J, Chen Y, Zhang R, Lan X, et al. Etiology, Cancer Stem Cells and Potential Diagnostic Biomarkers for Esophageal Cancer. Cancer Lett (2019) 458:21–8. doi: 10.1016/j.canlet.2019.05.018
7. Alessandrini F, Pezzè L, Ciribilli Y. LAMPs: Shedding Light on Cancer Biology. Semin Oncol (2017) 44(4):239–53. doi: 10.1053/j.seminoncol.2017.10.013
8. Ballabio A, Bonifacino JS. Lysosomes as Dynamic Regulators of Cell and Organismal Homeostasis. Nat Rev Mol Cell Biol (2020) 21(2):101–18. doi: 10.1038/s41580-019-0185-4
9. Tang T, Yang ZY, Wang D, Yang XY, Wang J, Li L, et al. The Role of Lysosomes in Cancer Development and Progression. Cell Biosci (2020) 10(1):131. doi: 10.1186/s13578-020-00489-x
10. Loeffler DA, Klaver AC, Coffey MP, Aasly JO. Cerebrospinal Fluid Concentration of Key Autophagy Protein Lamp2 Changes Little During Normal Aging. Front Aging Neurosci (2018) 10:130. doi: 10.3389/fnagi.2018.00130
11. Damaghi M, Tafreshi NK, Lloyd MC, Sprung R, Estrella V, Wojtkowiak JW, et al. Chronic Acidosis in the Tumour Microenvironment Selects for Overexpression of LAMP2 in the Plasma Membrane. Nat Commun (2015) 6:8752. doi: 10.1038/ncomms9752
12. Tan KP, Ho MY, Cho HC, Yu J, Hung JT, Yu AL. Fucosylation of LAMP-1 and LAMP-2 by FUT1 Correlates With Lysosomal Positioning and Autophagic Flux of Breast Cancer Cells. Cell Death Dis (2016) 7(8):e2347. doi: 10.1038/cddis.2016.243
13. Li QK, Shah P, Li Y, Aiyetan PO, Chen J, Yung R, et al. Glycoproteomic Analysis of Bronchoalveolar Lavage (BAL) Fluid Identifies Tumor-Associated Glycoproteins From Lung Adenocarcinoma. J Proteome Res (2013) 12(8):3689–96. doi: 10.1021/pr400274w
14. Huang PS, Lin YH, Chi HC, Tseng YH, Chen CY, Lin TK, et al. Dysregulated FAM215A Stimulates LAMP2 Expression to Confer Drug-Resistant and Malignant in Human Liver Cancer. Cells (2020) 9(4):13–7. doi: 10.3390/cells9040961
15. Bednarczyk M, Fatyga E, Dzięgielewska-Gęsiak S, Waniczek D, Grabarek B, Zmarzły N, et al. The Expression Patterns of BECN1, LAMP2, and PINK1 Genes in Colorectal Cancer Are Potentially Regulated by Micrornas and CpG Islands: An In Silico Study. J Clin Med (2020) 9(12):13–17. doi: 10.3390/jcm9124020
16. Jamali L, Moradi A, Ganji M, Ayati M, Kazeminezhad B, Fazeli Attar Z, et al. Potential Prognostic Role for SPOP, DAXX, RARRES1, and LAMP2 as an Autophagy Related Genes in Prostate Cancer. Urol J (2020) 17(2):156–63. doi: 10.22037/uj.v0i0.4935
17. Morell C, Bort A, Vara-Ciruelos D, Ramos-Torres Á, Altamirano-Dimas M, Díaz-Laviada I, et al. Up-Regulated Expression of LAMP2 and Autophagy Activity During Neuroendocrine Differentiation of Prostate Cancer LNCaP Cells. PloS One (2016) 11(9):e0162977. doi: 10.1371/journal.pone.0162977
18. Tomczak K, Czerwińska P, Wiznerowicz M. The Cancer Genome Atlas (TCGA): An Immeasurable Source of Knowledge. Contemp Oncol (Poznan Poland) (2015) 19(1a):A68–77. doi: 10.5114/wo.2014.47136
19. Barrett T, Wilhite SE, Ledoux P, Evangelista C, Kim IF, Tomashevsky M, et al. NCBI GEO: Archive for Functional Genomics Data Sets–Update. Nucleic Acids Res (2013) 41(Database issue):D991–5 doi: 10.1093/nar/gks1193
20. Su H, Hu N, Yang HH, Wang C, Takikita M, Wang QH, et al. Global Gene Expression Profiling and Validation in Esophageal Squamous Cell Carcinoma and Its Association With Clinical Phenotypes. Clin Cancer Res (2011) 17(9):2955–66. doi: 10.1158/1078-0432.CCR-10-2724
21. Yan W, Shih J, Rodriguez-Canales J, Tangrea MA, Player A, Diao L, et al. Three-Dimensional mRNA Measurements Reveal Minimal Regional Heterogeneity in Esophageal Squamous Cell Carcinoma. Am J Pathol (2013) 182(2):529–39. doi: 10.1016/j.ajpath.2012.10.028
22. Li J, Chen Z, Tian L, Zhou C, He MY, Gao Y, et al. LncRNA Profile Study Reveals a three-lncRNA Signature Associated With the Survival of Patients With Oesophageal Squamous Cell Carcinoma. Gut (2014) 63(11):1700–10. doi: 10.1136/gutjnl-2013-305806
23. Wen J, Yang H, Liu MZ, Luo KJ, Liu H, Hu Y, et al. Gene Expression Analysis of Pretreatment Biopsies Predicts the Pathological Response of Esophageal Squamous Cell Carcinomas to Neo-Chemoradiotherapy. Ann Oncol (2014) 25(9):1769–74. doi: 10.1093/annonc/mdu201
24. Wang Y, Liang N, Xue Z, Xue X. Identifying an Eight-Gene Signature to Optimize Overall Survival Prediction of Esophageal Adenocarcinoma Using Bioinformatics Analysis of ceRNA Network. Onco Targets Ther (2020) 13:13041–54. doi: 10.2147/OTT.S287084
25. Tang Z, Kang B, Li C, Chen T, Zhang Z. GEPIA2: An Enhanced Web Server for Large-Scale Expression Profiling and Interactive Analysis. Nucleic Acids Res (2019) 47(W1):W556–60. doi: 10.1093/nar/gkz430
26. Chandrashekar DS, Bashel B, Balasubramanya SAH, Creighton CJ, Ponce-Rodriguez I, Chakravarthi B, et al. UALCAN: A Portal for Facilitating Tumor Subgroup Gene Expression and Survival Analyses. Neoplasia (New York NY) (2017) 19(8):649–58. doi: 10.1016/j.neo.2017.05.002
27. Mizuno H, Kitada K, Nakai K, Sarai A. PrognoScan: A New Database for Meta-Analysis of the Prognostic Value of Genes. BMC Med Genomics (2009) 2:18. doi: 10.1186/1755-8794-2-18
28. Ru B, Wong CN, Tong Y, Zhong JY, Zhong SSW, Wu WC, et al. TISIDB: An Integrated Repository Portal for Tumor-Immune System Interactions. Bioinformatics (Oxford England) (2019) 35(20):4200–2. doi: 10.1093/bioinformatics/btz210
29. Jiang P, Gu S, Pan D, Fu J, Sahu A, Hu X, et al. Signatures of T Cell Dysfunction and Exclusion Predict Cancer Immunotherapy Response. Nat Med (2018) 24(10):1550–8. doi: 10.1038/s41591-018-0136-1
30. Fu J, Li K, Zhang W, Wan C, Zhang J, Jiang P, et al. Large-Scale Public Data Reuse to Model Immunotherapy Response and Resistance. Genome Med (2020) 12(1):21. doi: 10.1186/s13073-020-0721-z
31. Anaya J. OncoLnc: Linking TCGA Survival Data to mRNAs, miRNAs, and lncRNAs. PeerJ Computer Science (2016) 2(2). doi: 10.7717/peerj-cs.67
32. Franz M, Rodriguez H, Lopes C, Zuberi K, Montojo J, Bader GD, et al. GeneMANIA Update 2018. Nucleic Acids Res (2018) 46(W1):W60–w4. doi: 10.1093/nar/gky311
33. Szklarczyk D, Gable AL, Nastou KC, Lyon D, Kirsch R, Pyysalo S, et al. The STRING Database in 2021: Customizable Protein-Protein Networks, and Functional Characterization of User-Uploaded Gene/Measurement Sets. Nucleic Acids Res (2021) 49(D1):D605–12. doi: 10.1093/nar/gkaa1074
34. Subramanian A, Tamayo P, Mootha VK, Mukherjee S, Ebert BL, Gillette MA, et al. Gene Set Enrichment Analysis: A Knowledge-Based Approach for Interpreting Genome-Wide Expression Profiles. Proc Natl Acad Sci USA (2005) 102(43):15545–50. doi: 10.1073/pnas.0506580102
35. Yu G, Wang LG, Han Y, He QY. Clusterprofiler: An R Package for Comparing Biological Themes Among Gene Clusters. Omics (2012) 16(5):284–7. doi: 10.1089/omi.2011.0118
36. Colwill K, Gräslund S. A Roadmap to Generate Renewable Protein Binders to the Human Proteome. Nat Methods (2011) 8(7):551–8. doi: 10.1038/nmeth.1607
37. Hänzelmann S, Castelo R, Guinney J. GSVA: Gene Set Variation Analysis for Microarray and RNA-Seq Data. BMC Bioinform (2013) 14:7. doi: 10.1186/1471-2105-14-7
38. Love MI, Huber W, Anders S. Moderated Estimation of Fold Change and Dispersion for RNA-Seq Data With Deseq2. Genome Biol (2014) 15(12):550. doi: 10.1186/s13059-014-0550-8
39. Secrier M, Li X, de Silva N, Eldridge MD, Contino G, Bornschein J, et al. Corrigendum: Mutational Signatures in Esophageal Adenocarcinoma Define Etiologically Distinct Subgroups With Therapeutic Relevance. Nat Genet (2017) 49(2):317. doi: 10.1038/ng0217-317a
40. Zhang L, Gao Y, Zhang X, Guo M, Yang J, Cui H, et al. TSTA3 Facilitates Esophageal Squamous Cell Carcinoma Progression Through Regulating Fucosylation of LAMP2 and ERBB2. Theranostics (2020) 10(24):11339–58. doi: 10.7150/thno.48225
41. Chen F, Chandrashekar DS, Varambally S, Creighton CJ. Pan-Cancer Molecular Subtypes Revealed by Mass-Spectrometry-Based Proteomic Characterization of More Than 500 Human Cancers. Nat Commun (2019) 10(1):5679. doi: 10.1038/s41467-019-13528-0
42. Riera-Domingo C, Audigé A, Granja S, Cheng WC, Ho PC, Baltazar F, et al. Immunity, Hypoxia, and Metabolism-The Ménage À Trois of Cancer: Implications for Immunotherapy. Physiol Rev (2020) 100(1):1–102. doi: 10.1152/physrev.00018.2019
43. Olcina MM, Balanis NG, Kim RK, Aksoy BA, Kodysh J, Thompson MJ, et al. Mutations in an Innate Immunity Pathway Are Associated With Poor Overall Survival Outcomes and Hypoxic Signaling in Cancer. Cell Rep (2018) 25(13):3721–32.e6. doi: 10.1016/j.celrep.2018.11.093
44. Olcina MM, Kim RK, Melemenidis S, Graves EE, Giaccia AJ. The Tumour Microenvironment Links Complement System Dysregulation and Hypoxic Signalling. Br J Radiol (2019) 92(1093):20180069. doi: 10.1259/bjr.20180069
45. Chen X, Cubillos-Ruiz JR. Endoplasmic Reticulum Stress Signals in the Tumour and Its Microenvironment. Nat Rev Cancer (2021) 21(2):71–88. doi: 10.1038/s41568-020-00312-2
46. Cubillos-Ruiz JR, Bettigole SE, Glimcher LH. Tumorigenic and Immunosuppressive Effects of Endoplasmic Reticulum Stress in Cancer. Cell (2017) 168(4):692–706. doi: 10.1016/j.cell.2016.12.004
47. Yang C, Shen S, Zheng X, Ye K, Sun Y, Lu Y, et al. Long Noncoding RNA HAGLR Acts as a microRNA-143-5p Sponge to Regulate Epithelial-Mesenchymal Transition and Metastatic Potential in Esophageal Cancer by Regulating LAMP3. FASEB J (2019) 33(9):10490–504. doi: 10.1096/fj.201802543RR
48. Zhang RY, Liu ZK, Wei D, Yong YL, Lin P, Li H, et al. UBE2S Interacting With TRIM28 in the Nucleus Accelerates Cell Cycle by Ubiquitination of P27 to Promote Hepatocellular Carcinoma Development. Signal Transduct Target Ther (2021) 6(1):64. doi: 10.1038/s41392-020-00432-z
49. Ma F, Laster K, Nie W, Liu F, Kim DJ, Lee MH, et al. Heterogeneity Analysis of Esophageal Squamous Cell Carcinoma in Cell Lines, Tumor Tissues and Patient-Derived Xenografts. J Cancer (2021) 12(13):3930–44. doi: 10.7150/jca.52286
50. Fristedt R, Gaber A, Hedner C, Nodin B, Uhlén M, Eberhard J, et al. Expression and Prognostic Significance of the Polymeric Immunoglobulin Receptor in Esophageal and Gastric Adenocarcinoma. J Trans Med (2014) 12:83. doi: 10.1186/1479-5876-12-83
51. Gologan A, Acquafondata M, Dhir R, Sepulveda AR. Polymeric Immunoglobulin Receptor-Negative Tumors Represent a More Aggressive Type of Adenocarcinomas of Distal Esophagus and Gastroesophageal Junction. Arch Pathol Lab Med (2008) 132(8):1295–301. doi: 10.5858/2008-132-1295-PIRTRA
52. Giraldo NA, Sanchez-Salas R, Peske JD, Vano Y, Becht E, Petitprez F, et al. The Clinical Role of the TME in Solid Cancer. Br J Cancer (2019) 120(1):45–53. doi: 10.1038/s41416-018-0327-z
53. Binnewies M, Roberts EW, Kersten K, Chan V, Fearon DF, Merad M, et al. Understanding the Tumor Immune Microenvironment (TIME) for Effective Therapy. Nat Med (2018) 24(5):541–50. doi: 10.1038/s41591-018-0014-x
54. Belli C, Trapani D, Viale G, D'Amico P, Duso BA, Della Vigna P, et al. Targeting the Microenvironment in Solid Tumors. Cancer Treat Rev (2018) 65:22–32. doi: 10.1016/j.ctrv.2018.02.004
55. Cha JH, Chan LC, Li CW, Hsu JL, Hung MC. Mechanisms Controlling PD-L1 Expression in Cancer. Mol Cell (2019) 76(3):359–70. doi: 10.1016/j.molcel.2019.09.030
Keywords: LAMP2, esophageal cancer, pan-cancer, diagnostic, prognosis, immune infiltration
Citation: Liu S-p, Li X-m, Liu D-m, Xie S-h, Zhang S-b, Li Y and Xie Z-f (2022) LAMP2 as a Biomarker Related to Prognosis and Immune Infiltration in Esophageal Cancer and Other Cancers: A Comprehensive Pan-Cancer Analysis. Front. Oncol. 12:884448. doi: 10.3389/fonc.2022.884448
Received: 26 February 2022; Accepted: 14 March 2022;
Published: 21 April 2022.
Edited by:
Jin-Ming Yang, University of Kentucky, United StatesReviewed by:
Fengyi Mao, University of Kentucky, United StatesYifan Kong, University of Kentucky, United States
Copyright © 2022 Liu, Li, Liu, Xie, Zhang, Li and Xie. This is an open-access article distributed under the terms of the Creative Commons Attribution License (CC BY). The use, distribution or reproduction in other forums is permitted, provided the original author(s) and the copyright owner(s) are credited and that the original publication in this journal is cited, in accordance with accepted academic practice. No use, distribution or reproduction is permitted which does not comply with these terms.
*Correspondence: Ze-feng Xie, MjB4bWxpMUBzdHUuZWR1LmNu