- 1School of Precision Instrument and Opto-electronics Engineering, Tianjin University, Tianjin, China
- 2Department of Radiotherapy, Shandong Cancer Hospital and Institute, Shandong First Medical University and Shandong Academy of Medical Sciences, Jinan, China
- 3Department of Clinical Laboratory, Shandong First Medical University and Shandong Academy of Medical Sciences, Shandong Cancer Hospital and Institute, Jinan, China
Purpose: Accurate lesion segmentation is a prerequisite for radiomic feature extraction. It helps to reduce the features variability so as to improve the reporting quality of radiomics study. In this research, we aimed to conduct a radiomic feature reproducibility test of inter-/intra-observer delineation variability in hepatocellular carcinoma using 3D-CT images, 4D-CT images and multiple-parameter MR images.
Materials and Methods: For this retrospective study, 19 HCC patients undergoing 3D-CT, 4D-CT and multiple-parameter MR scans were included in this study. The gross tumor volume (GTV) was independently delineated twice by two observers based on contrast-enhanced computed tomography (CECT), maximum intensity projection (MIP), LAVA-Flex, T2W FRFSE and DWI-EPI images. We also delineated the peritumoral region, which was defined as 0 to 5 mm radius surrounding the GTV. 107 radiomic features were automatically extracted from CECT images using 3D-Slicer software. Quartile coefficient of dispersion (QCD) and intraclass correlation coefficient (ICC) were applied to assess the variability of each radiomic feature. QCD<10% and ICC≥0.75 were considered small variations and excellent reliability. Finally, the principal component analysis (PCA) was used to test the feasibility of dimensionality reduction.
Results: For tumor tissues, the numbers of radiomic features with QCD<10% indicated no obvious inter-/intra-observer differences or discrepancies in 3D-CT, 4D-CT and multiple-parameter MR delineation. However, the number of radiomic features (mean 89) with ICC≥0.75 was the highest in the multiple-parameter MR group, followed by the 3DCT group (mean 77) and the MIP group (mean 73). The peritumor tissues also showed similar results. A total of 15 and 7 radiomic features presented excellent reproducibility and small variation in tumor and peritumoral tissues, respectively. Two robust features showed excellent reproducibility and small variation in tumor and peritumoral tissues. In addition, the values of the two features both represented statistically significant differences among tumor and peritumoral tissues (P<0.05). The PCA results indicated that the first seven principal components could preserve at least 90% of the variance of the original set of features.
Conclusion: Delineation on multiple-parameter MR images could help to improve the reproducibility of the HCC CT radiomic features and weaken the inter-/intra-observer influence.
Introduction
Liver cancer has been the third leading cause of cancer-related death worldwide, totaling nearly 905,700 new cases in 2020 (1). In some areas, the mortality rate is almost equal to the morbidity rate (2). Hepatocellular carcinoma (HCC) is the most common histologic subtype of liver cancer, accounting for more than 90% of all cases. Liver cancer treatment has been evolved from surgery, interventional therapy, radiotherapy, chemotherapy, targeted therapy to immunotherapy (3). However, early detection is almost the only chance of long-term survival for HCC patients. In addition, accurate prediction and evaluation of the profile of patients are also an important pathway to improve their survival rate.
Noninvasive imaging (i.e., ultrasound, computed tomography (CT), magnetic resonance imaging (MRI), etc.) plays an important role in the characterization and monitoring of liver cancer. The modern (or advanced) imaging technology has allowed qualitative evaluation of liver cancer (or other liver diseases) and assisted personalized medical decision-making (4, 5).
Thereinto, radiomics is an innovative technology deriving from early 2012 (6), serving as the preferred method to study the relationship between cancer imaging phenotypes, cancer genotypes and clinical prognosis (7–9). It refers to the high-throughput extraction of numerous quantitative and mineable imaging features assumed to convey prognostic and predictive information. The most prominent advantage is that it realizes objective non-invasive assessment of tumors using conventional imaging data, including heterogeneity, as opposed to current visual identification.
Although strong evidence shows that radiomics contributes to clinical decisions, no clinical application of radiomic features has been developed to date. Some scholars suggest that radiomics studies must be cautiously approached because several radiomic features change significantly with slight variation in images (10, 11). Therefore, in each step of the radiomics workflow, many challenges exist for clinical transition, including but not limited to the interpretability of models, reproducibility of radiomic features, and sensitivity to changes in image acquisition, reconstruction parameters, and tumor segmentation (12). A main challenge is the lack of reproducibility regarding the reported radiomic features and models (13). The search engine PubMed showed that investigations of feature reproducibility or repeatability were only limited to a small number of cancer types (14). Reproducibility can be pursued in imaging data, segmentation, calculations or statistics, and studies (11, 15), among which segmentation is considered the most critical, challenging and controversial part of radiomics analysis (11).
For the past few years, several studies involving lung tumor, head and neck tumor, renal tumor, liver tumor, and pancreas tumor have reported the impact of target segmentation on the reproducibility of radiomic features (16–19). These investigations suggest that the minimization of the observer delineation is an effective way for improving the reproducibility of radiomics features, which can be well achieved by supervising computed results, performing inter/intra-reader variability, obtaining the consensus of radiologists on contouring and using the software properly (20). Another notable approach is multimodal imaging. Although it can provide a better region-of-interest (ROIs) delineation, evidence is scarce as to whether it can increase the reproducibility of the radiomics features.
Accurate lesion segmentation is a prerequisite for radiomic feature extraction. However, the liver lesion delineation represents a great variation on CT images, even in contrast-enhanced computed tomography (CECT) images. The magnetic resonance (MR) technique can significantly increase the discrimination of liver lesion boundaries.
In view of this, we aimed to carry out a reproducibility test of radiomics features of inter-/intra-observer delineation variability in HCC using CT images, 4DCT images and multiple-parameter MR images. This study is expected to provide a new approach to improve the reproducibility of radiomics features.
Materials and Methods
Patient Population
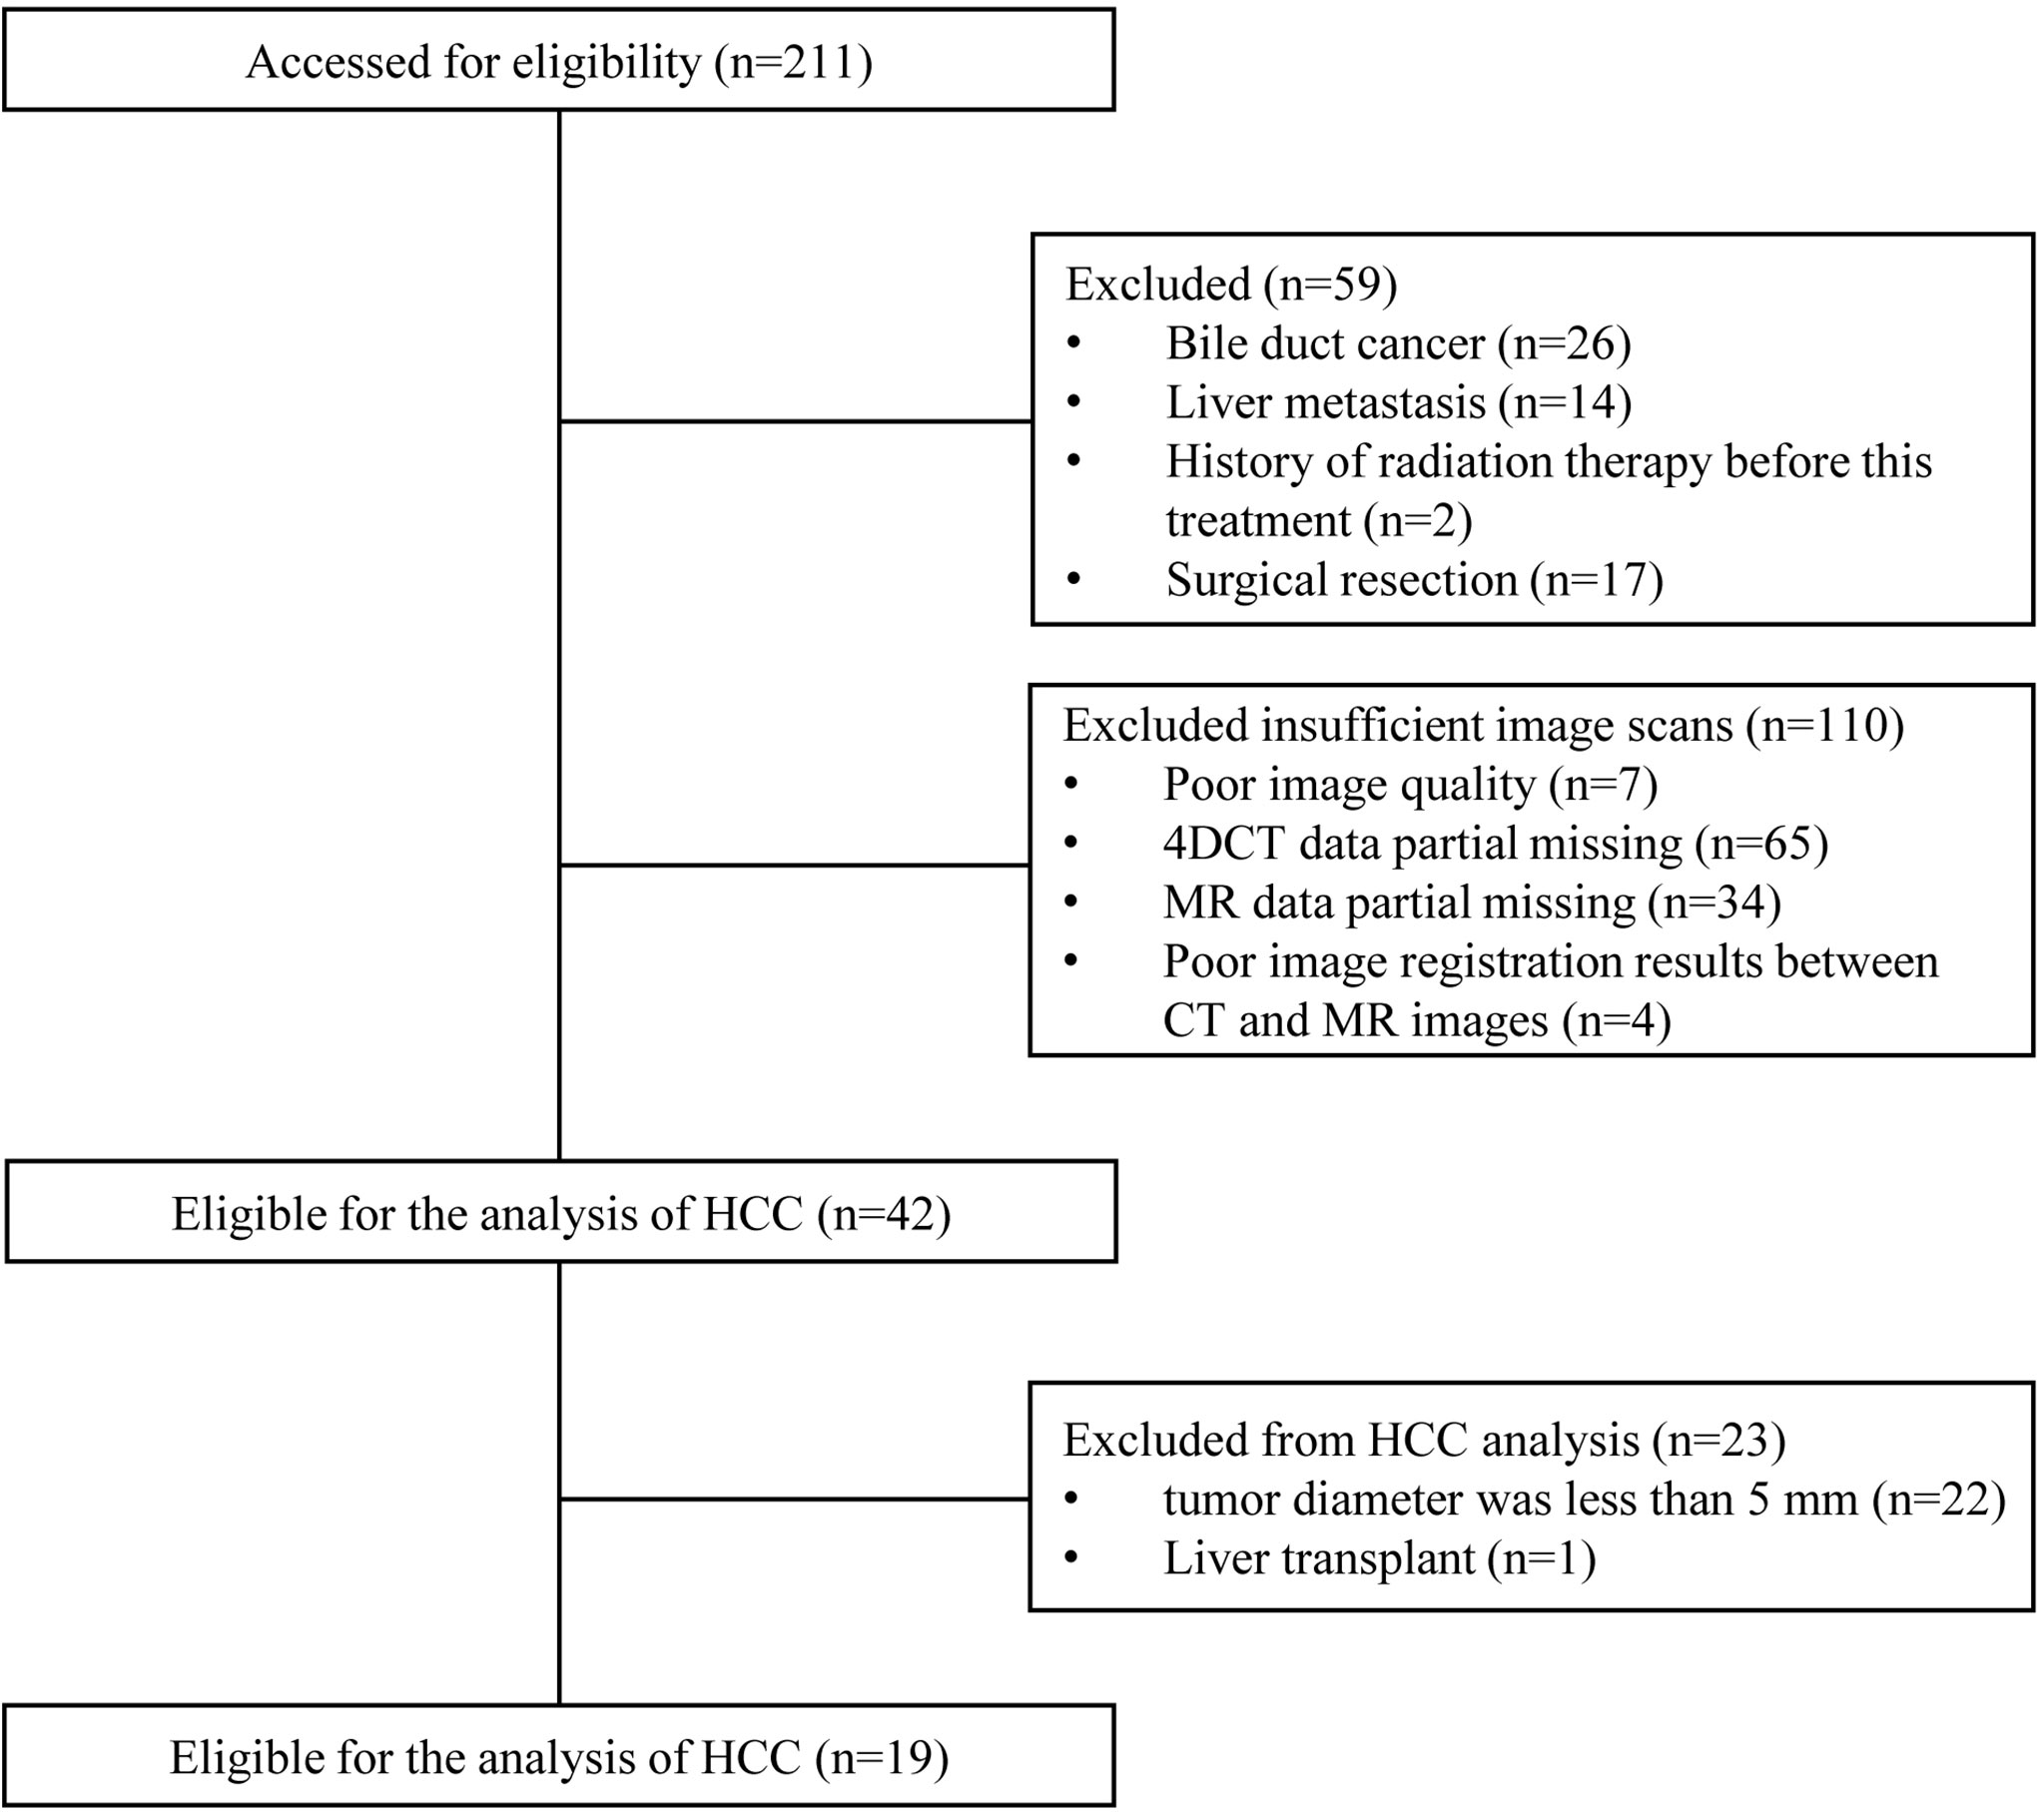
This study was approved by the local ethics committee. Considering the present observational and retrospective study using a database, informed consent was waived by our ethics institution. The identifying information of each patient had been removed. A database of 211 HCC patients treated with radiotherapy was identified between September 2018 and April 2021 in Shandong Cancer Hospital and Institute. Imaging follow-up was obtained through the Eclipse treatment planning system (TPS) (Varian Medical Systems, Palo Alto, CA). Eligibility criteria were as follows: (I) Cases were diagnosed with HCC by pathology; (II) the tumor diameter was greater than 5 mm, and at least two slices showed visible lesions; (III) suggested by ESUR guidelines on contrast agents (21), glomerular filtration rate (GFR) was more than 30 mL/min/1.73 m2. Exclusion criteria were as follows: (I) Liver metastasis; (II) poor image quality; (III) data partial missing; (IV) surgical resection; (V) history of radiation therapy; (VI) liver transplant; (VII) poor image registration results between CT and MR images.
Image Acquisition
All patients underwent the liver CT scan (Brilliance iCT 128, Phillips Medical Systems, Netherlands) and 3.0T MRI scan (Discovery 750 W, General Electric Co., Boston, USA). The CECT was performed before enhanced MR. During CT scans, patients were placed supine with their arms above their heads and immobilized using an evacuated cushion. All patients sequentially acquired 3D and 4D CT scans while breathing freely. The 3D-CT signal intensity was collected in arterial phase images. Based on the respiratory signal obtained from the real-time location management system (Varian Medical Systems, Palo Alto, USA), 10 respiratory phases (i.e., CT00, CT10, CT20, CT30, CT40, CT50, CT60, CT70, CT80, CT90) were acquired, among which CT00 and CT50 were defined ned as end-inhalation and end-exhalation, respectively. The maximum intensity projection (MIP) images were immediately acquired. The matrix size was 512×512 with a pixel spacing of 0.97×0.97×3.0 mm3 in the left-right, antero-posterior and craniocaudal directions, respectively.
To reduce any potential for nephrotoxicity, MR scans were subsequently conducted 4 hours after CT scans on the same day. During MR scans, patients were immobilized on the patient table overlaid with a flat couch top with the identical dedicated device and in the same position as in CT scans. Before scanning, all patients underwent a bolus injection of gadoteric acid (0.2 mmol/kg, 2 mL/sec) and immediately a 20 mL saline flush. Three pulse sequences of MR simulation images were acquired: (1) Axial LAVA-Flex: repetition time (TR)=5 ms, echo time (TE)=2 ms, slice thickness=3 mm, interslice spacing=0 mm, NEX=0.71, FOV=44 cm×35.2 cm, matrix size=296×256; (2) axial T2W FRFSE: repetition time (TR)=11250 ms, echo time (TE)=87.9 ms, slice thickness=3 mm, interslice spacing=0 mm, NEX=2.5, FOV=44 cm×44 cm, matrix size=384×384; (3) DWI-EPI: repetition time (TR)=18750 ms, echo time (TE)=60.3 ms, slice thickness=4 mm, interslice spacing=0 mm, NEX=1, FOV=44 cm×35.2 cm, matrix size=96×128; b=800 s/mm2.
ROIs Delineation
Based on the images of CECT, MIP, DWI and T2W FRFSE, the gross tumor volume (GTV) was independently delineated twice (ten days apart) by two observers (an experienced radiation oncologist and a radiologist). The MIP delineation results, as well as the merged DWI and T2W FRFSE delineation results by rigid registration, were copied on CECT images. Automatic grayscale registration was performed and manually corrected according to the outer contours of the liver. The structures delineated by the first and second observers were named 3DCT1, MIP1, MR1, 3DCT2, MIP2, MR2, 3DCT3, MIP3, MR3, 3DCT4, MIP4, and MR4 for the first and second delineations, respectively.
In addition, we also delineated the peritumoral region, which was defined as a 0 to 5 mm radius surrounding the GTV.
Feature Extraction
All features were extracted from CECT images by using PyRadiomics platform implanted in the 3D Slicer software. (v4.8.1), a popular open-source platform for the processing and analysis of medical images. Radiomics features were extracted from original image. All textural features were discretized using absolute gray level discretization with a fixed bin width value of 25. A total of 107 radiomic features were extracted and divided into 6 groups according to the feature calculation method: first-order, gray level co-occurrence matrix (GLCM), gray level dependence matrix (GLDM), gray level run length matrix (GLRLM), gray level size matrix (GLSZM), neighborhood gray-tone difference matrix (NGTDM) and shape. A total of 18, 24, 14, 16, 16, 5, and 14 features were extracted for each matrix, respectively. The definitions and interpretations of these features have been reported on this website (https://pyradiomics.readthedocs.io/en/latest/features.html).
Data Analysis and Statistics
Variation of Radiomics Features
Quartile coefficient of dispersion (QCD) was used to assess the variation of radiomics features. QCD<10% was considered small variations, 10%≤QCD<20% was considered intermediate variations, and QCD≥20% was considered large variations. The definition of QCD was as the equation 1:
where Q1 and Q3 denote the first and third quartiles (22), respectively.
Reproducibility of Radiomics Features
The inter-/intra-observer reproducibility of radiomics features was evaluated using the intraclass correlation coefficient (ICC), a primary metric in most previous research (16–19). The ICC was calculated as the equation 2:
where MSR means the mean square for rows (observations), MSE denotes the mean square error, MSC represents the mean square for columns and k is the number of raters (normalization methods or observers). ICC=0 indicates no reliability, while ICC=1 represents highly stable features. We adopted the previous reports to interpret the ICC interrater agreement measures (23): ICC values less than 0.4 indicate poor reliability, values between 0.4 and 0.59 indicate fair reliability, values between 0.6 and 0.74 indicate good reliability, and values greater than 0.75 indicate excellent reliability.
Identification of Tumor Tissues and Peritumor Tissues Using Robust Radiomic Features
The radiomic features with ICC>0.75 and QCD<10% in both tumor and peritumoral tissues were selected to identify the differences between the two groups. The two groups were compared using one-way ANOVA or Kruskal-Wallis test. P<0.05 was considered statistically significant. The SPSS 20.0 software and GraphPad Prism 9.2 were used to do all statistical analyses.
Radiomic Features Dimensionality Reduction
In addition, for CT radiomic features with ICC≥0.75 based on the ROIs delineation of multiple-parameter MR images, principal component analysis (PCA) was performed to test the feasibility of dimensionality reduction. PCA is widely used for qualitative analysis and data reduction to explore data characteristics. To preserve at least 90% of variances of the original feature set, the number of principal components was detected.
Results
Study Cohort
A flowchart of patient participation and sample selection is given in Figure 1. Finally, 19 HCC patients (15 males and 4 females aged from 45 to 75 with mean age of 57.4 years) were included in this study. The smallest, mean and largest tumor volume is 19.5 cm3, 105.3 cm3 and 385.4 cm3 respectively. A total of 456 contouring results were obtained for this research (228 contouring results for tumor and peritumoral region, respectively). Figure 2 illustrates an example of the target delineation for HCC in 3D-CT, MIP and MR images.
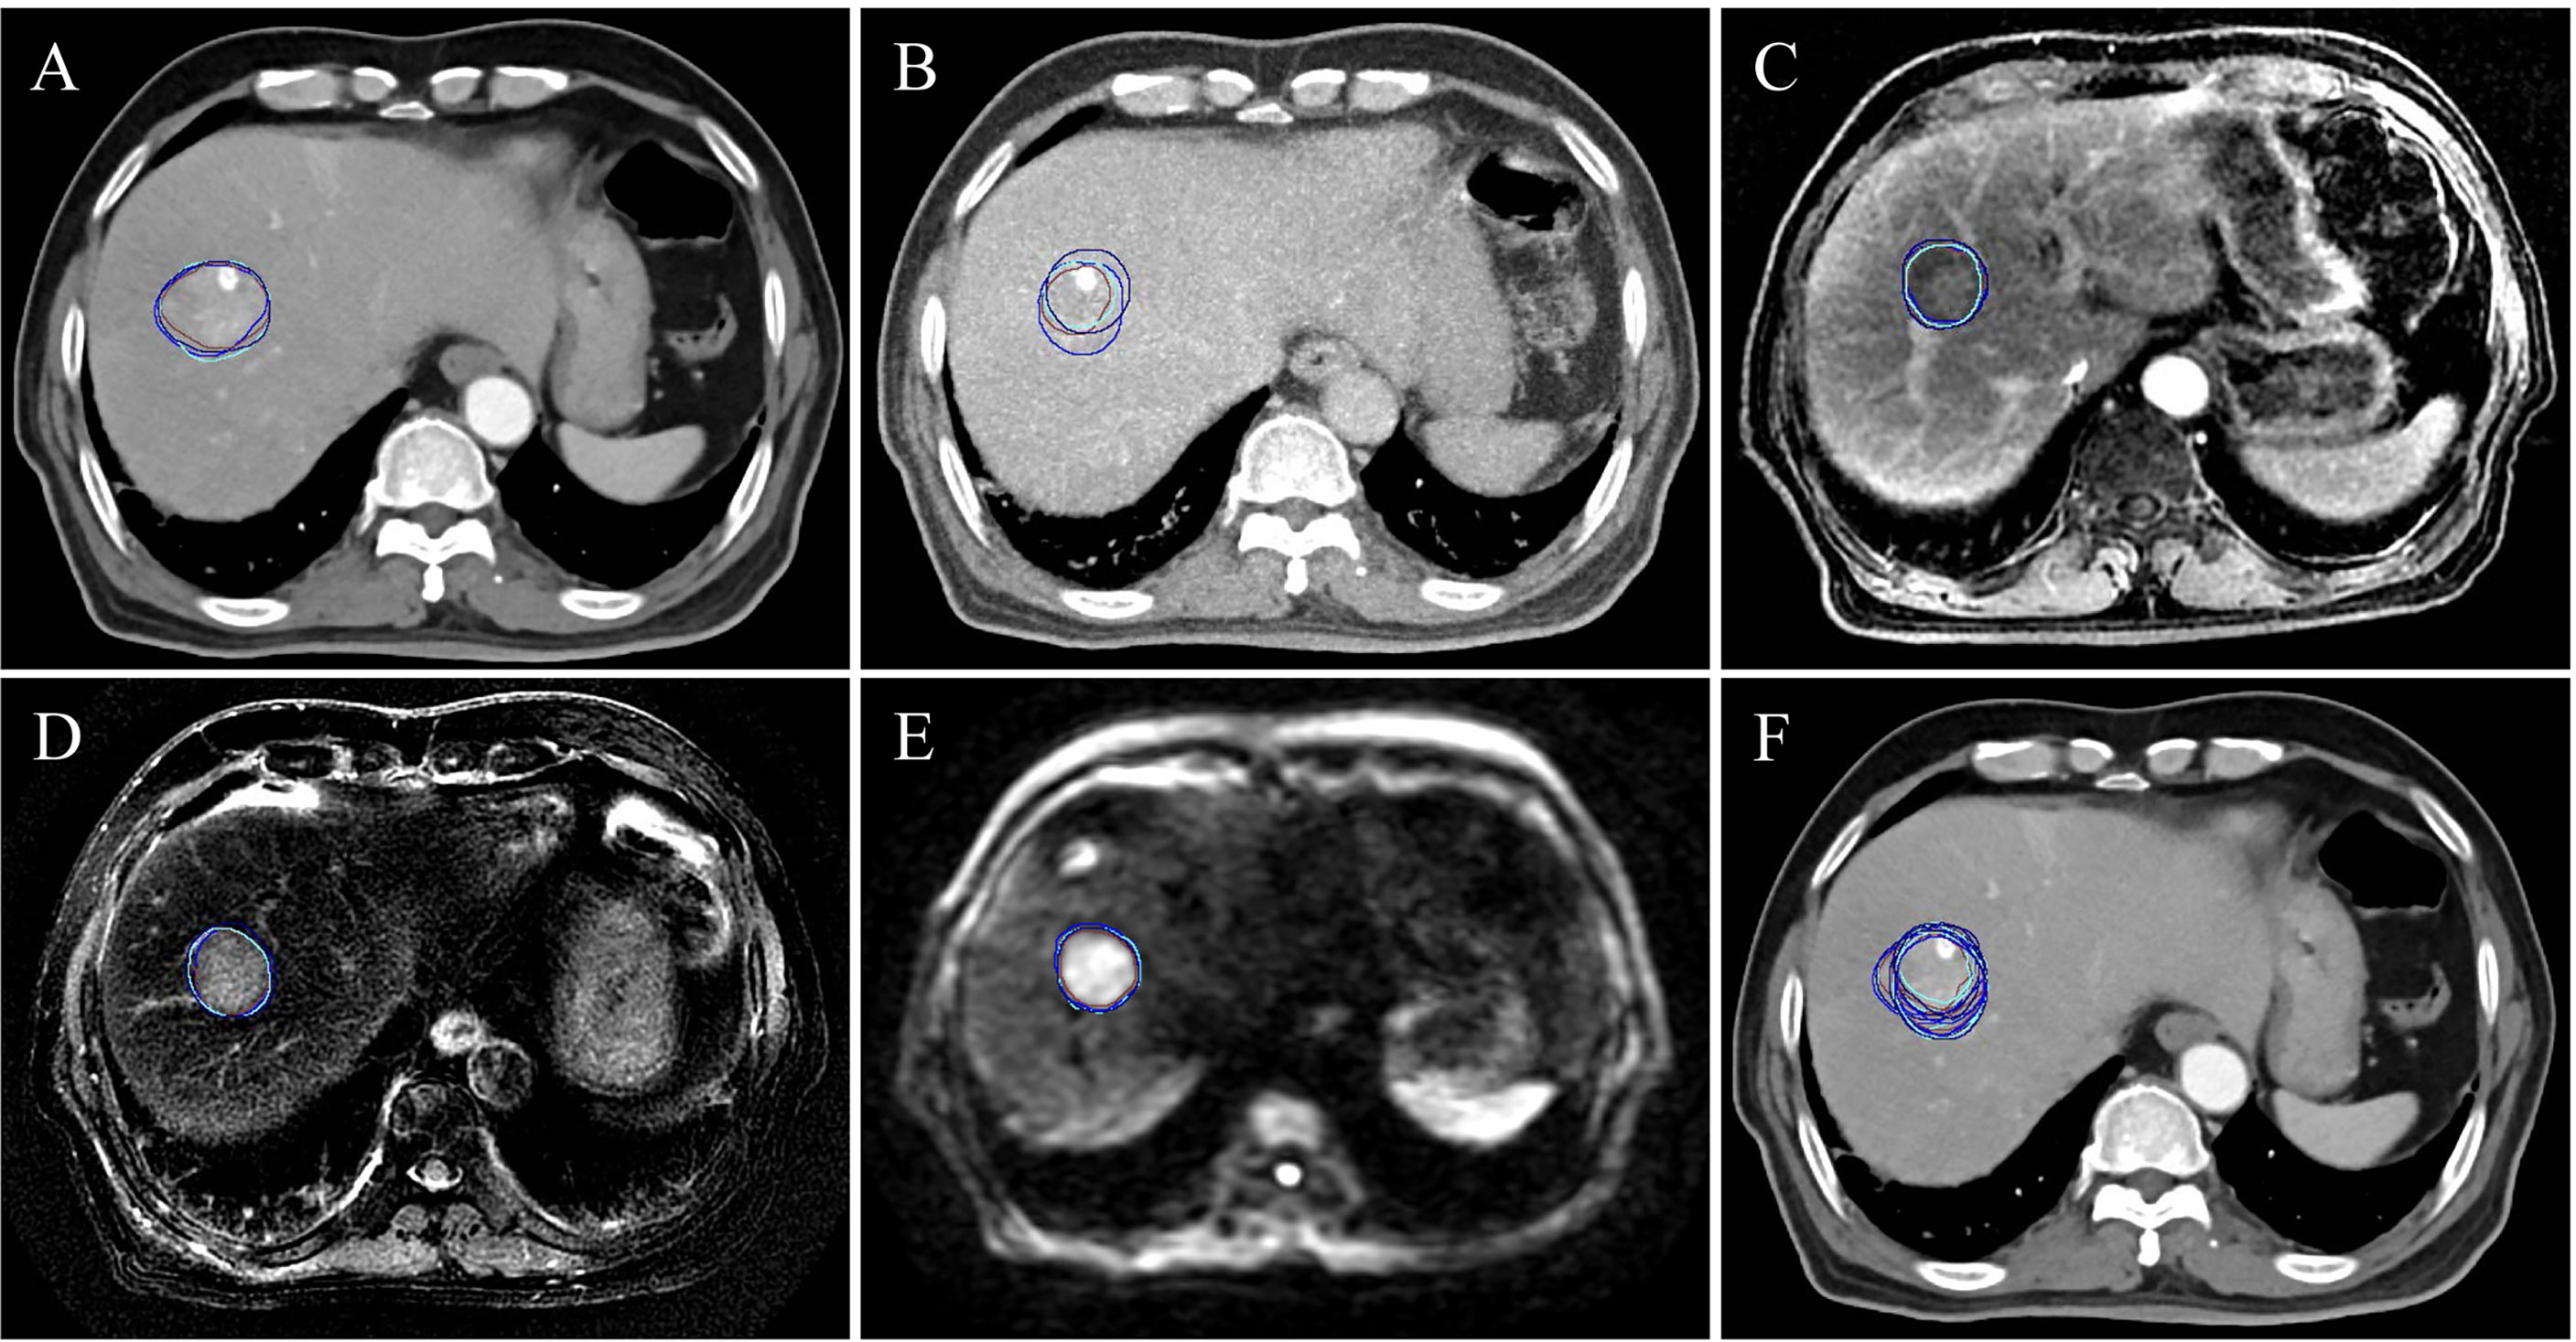
Figure 2 A subject (a male aged 69 and diagnosed with hepatocellular carcinoma) of the target delineation for primary liver cancer in 3D-CT, MIP and multiple-parameter MR images. (A-E) show the delineation results of CECT, MIP, LAVA-Flex, T2W FRFSE and DWI-EPI, respectively. (F) shows all the delineation results displayed on CECT. The blue, brown, cyan and dark blue contour denote the first delineation of the first observer. The brown contour is the second delineation of the first observer. The cyan contour is the first delineation of the second observer. The dark blue is the second delineation of the second observer.
Variation of Radiomic Features According to QCD
For tumor tissues, the numbers of radiomic features with QCD ≤ 10% in 3DCT1, 3DCT2, 3DCT3, 3DCT4, MIP1, MIP2, MIP3, MIP4, MR1, MR2, MR3 and MR4 were 15, 13, 10, 15, 14, 13, 11, 13, 15, 12, 12 and 12, respectively. For peritumoral tissues, the numbers of radiomic features with QCD ≤ 10% in 3DCT1, 3DCT2, 3DCT3, 3DCT4, MIP1, MIP2, MIP3, MIP4, MR1, MR2, MR3 and MR4 were 14, 11, 12, 14, 13, 12, 12, 11, 13, 16, 13 and 13, respectively. A detailed QCD results can be found in Supplementary Materials (see Table S1).
Reproducibility of Radiomics Features According to ICC
As seen in Figure 3A, for tumor tissue-derived radiomic features, when ICC≥0.75 is the threshold, 85/107 (79.4%), 72/107 (67.3%), 70/107 (65.4%), 74/107 (69.2%), 77/107 (72.0%), 82/107 (76.6%), 77/107 (72.0%), 75/107 (70.1%), 70/107 (65.4%), 71/107 (66.4%), 69/107 (64.5%), 77/107 (72.0%), 99/107 (92.5%), 84/107 (78.5%), 82/107 (76.6%), 85/107 (79.4%), 90/107 (84.1%), and 96/107 (89.7%) features meet the threshold for 3DCT1/3DCT2, 3DCT1/3DCT3, 3DCT1/3DCT4, 3DCT2/3DCT3, 3DCT2/3DCT4, 3DCT3/3DCT4, MIP1/MIP2, MIP1/MIP3, MIP1/MIP4, MIP2/MIP3, MIP2/MIP4, MIP3/MIP4, MR1/MR2, MR1/MR3, MR1/MR4, MR2/MR3, MR2/MR4, and MR3/MR4, respectively. The mean numbers of radiomic features with ICC≥0.75 in intra-observer groups are much more than those in inter-observer groups using CECT (84/107 (78.5%) vs. 74/107 (69.2%)), MIP (77/107 (72.0%) vs. 71/107 (66.4%)) or MR (98/107 (91.6%) vs. 85/107 (79.4%)) delineations. Notably, the excellent reproducibility numbers in MR delineations are much more than those in CECT delineations in both intra-observer groups (98/107(91.6%) vs. 84/107(78.5%)) and inter-observer groups (85/107(79.4%) vs. 74/107(69.2%)). The excellent reproducibility numbers in MIP delineations are the least in both groups. Supplementary Material (Figure S1) shows the ICC values in each radiomic features subgroup for CECT, MIP and MR delineations.
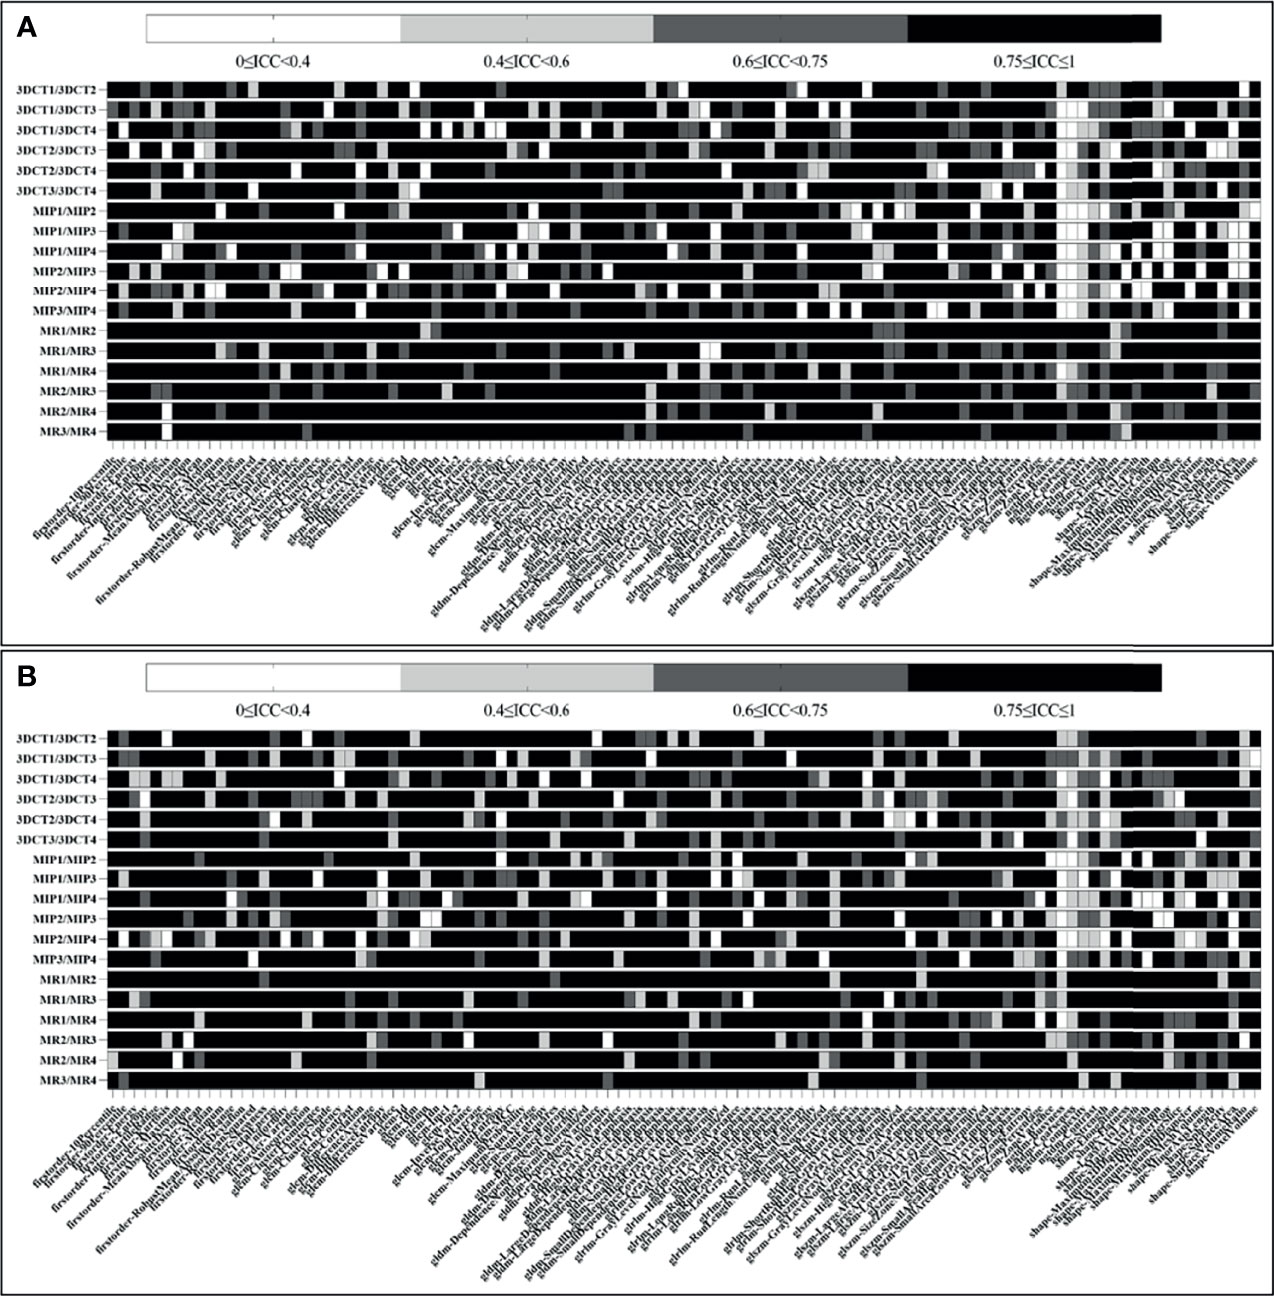
Figure 3 Heatmap demonstrating tumor and peritumor tissue-derived reproducible features, where each row and column represent each comparison dataset and radiomic feature, respectively. (A, B) show the ICC results of tumor and peritumor tissues, respectively.
As seen in Figure 3B, for peritumoral tissue-derived radiomic features, the results are similar to those of tumor tissues. The information of the radiomic features subgroup is shown in the Supplementary Material (Figure S2).
Radiomic Features With Small Variation and Excellent Reproducibility
Figure 4 indicates that radiomic features are not affected by the intra-/inter-observer MR delineations. The 47/107 (43.9%) and 40/107 (37.4%) features show excellent reproducibility for tumor and peritumoral tissues, respectively. Fifteen radiomic features present excellent reproducibility in both tissues. Ten and eleven radiomic features show small variations for tumor and peritumoral tissues, respectively. Seven radiomic features present small variations in both tissues. Only 2 robust features (GLDM-dependence entropy and GLRLM short run emphasis) show excellent reproducibility and small variation in both tissues. Names of specific radiomic features can be found in Supplementary Materials (see Table S2).
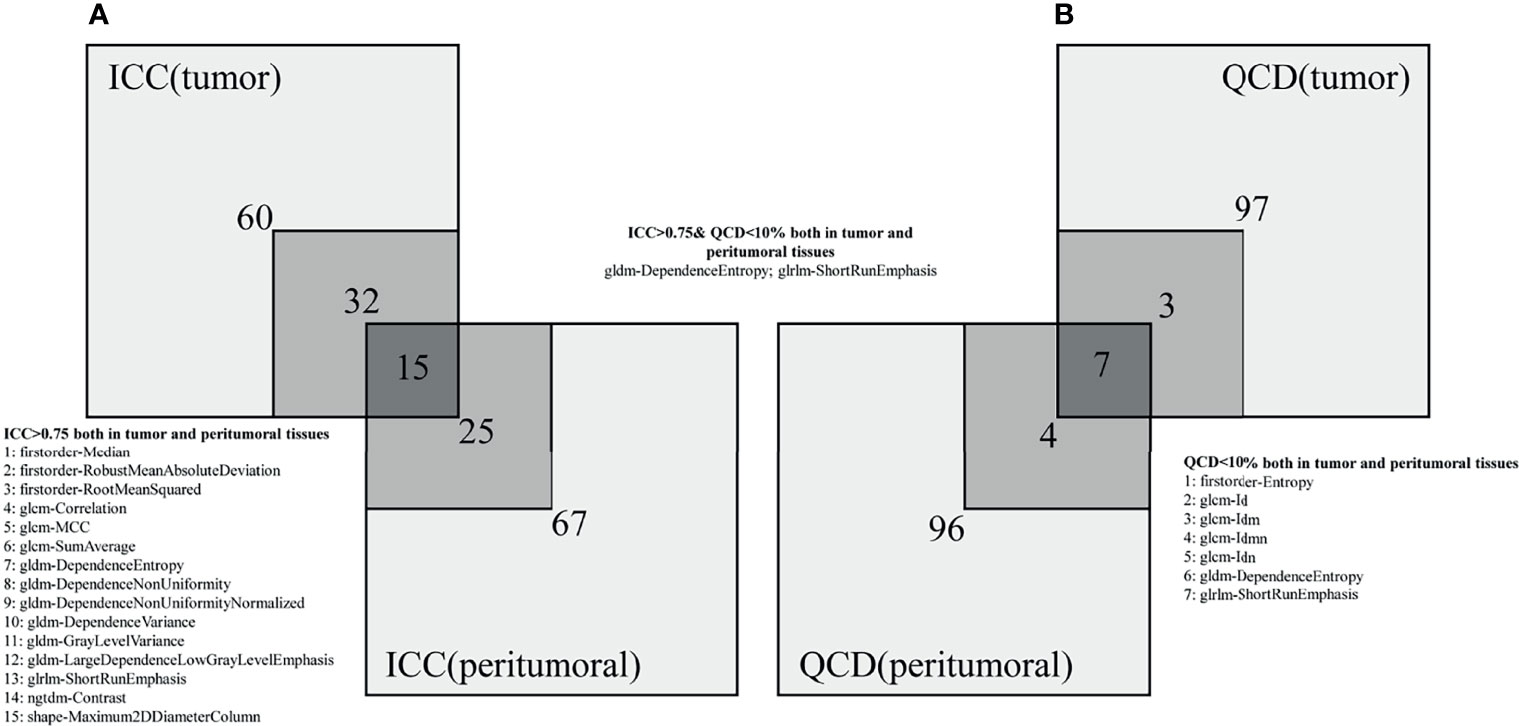
Figure 4 Numbers of radiomic features not affected by intra-/inter-observer MR delineations. (A, B) represent the ICC and QCD, respectively.
Identification of Tumor and Peritumor Tissues
The robust features were used to identify the tumor and peritumor tissues. As shown in Figure 5, in the GLDM-dependence entropy feature, the mean values of tumor and peritumor tissues are 5.93 and 6.81, respectively. In the GLRLM short run emphasis feature, the mean values of tumor and peritumor tissues are 0.73 and 0.89, respectively. Taken together, both features showed statistically significant differences among the two groups (P<0.05).
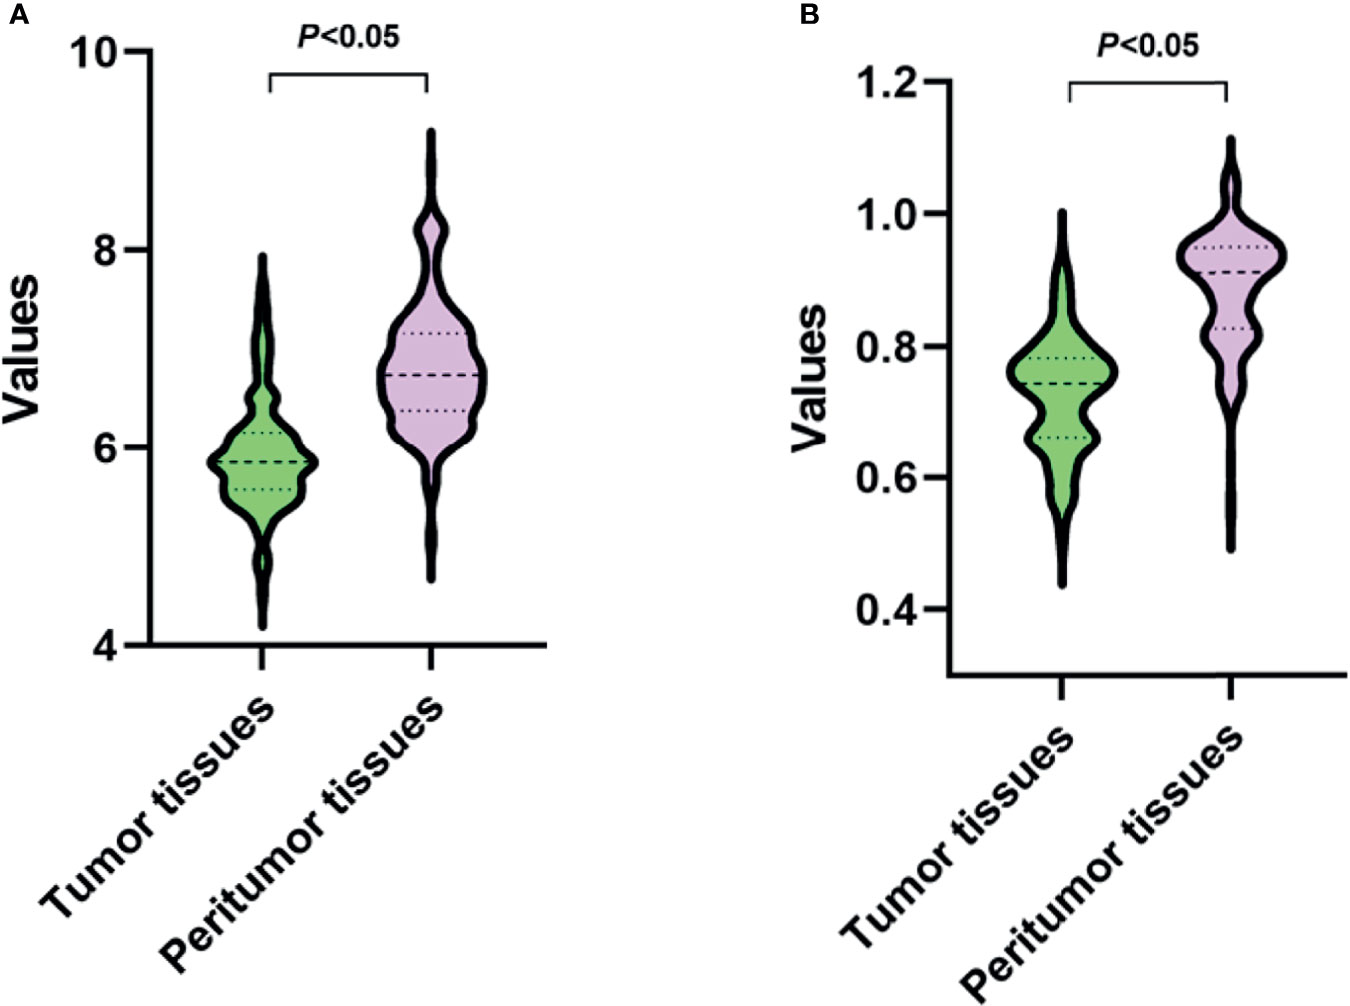
Figure 5 Values of two robust radiomic features in tumor and peritumor tissues. (A, B) present the features of GLDM-dependence entropy and GLRLM short run emphasis, respectively.
Radiomic Features Dimensionality Reduction
The PCA results can be seen in Figure 6. For tumor tissue-derived radiomic features, the variance contribution rates of the first principal component (PC1) and the second principal component (PC2) are 44.53% and 18.18%, respectively. The eigenvalues for each principal component are shown in Figure 6B. The cumulative proportion of variance is presented in Figure 6C. The first seven principal components can preserve at least 90% (92.39%) of the variance of the original feature set.
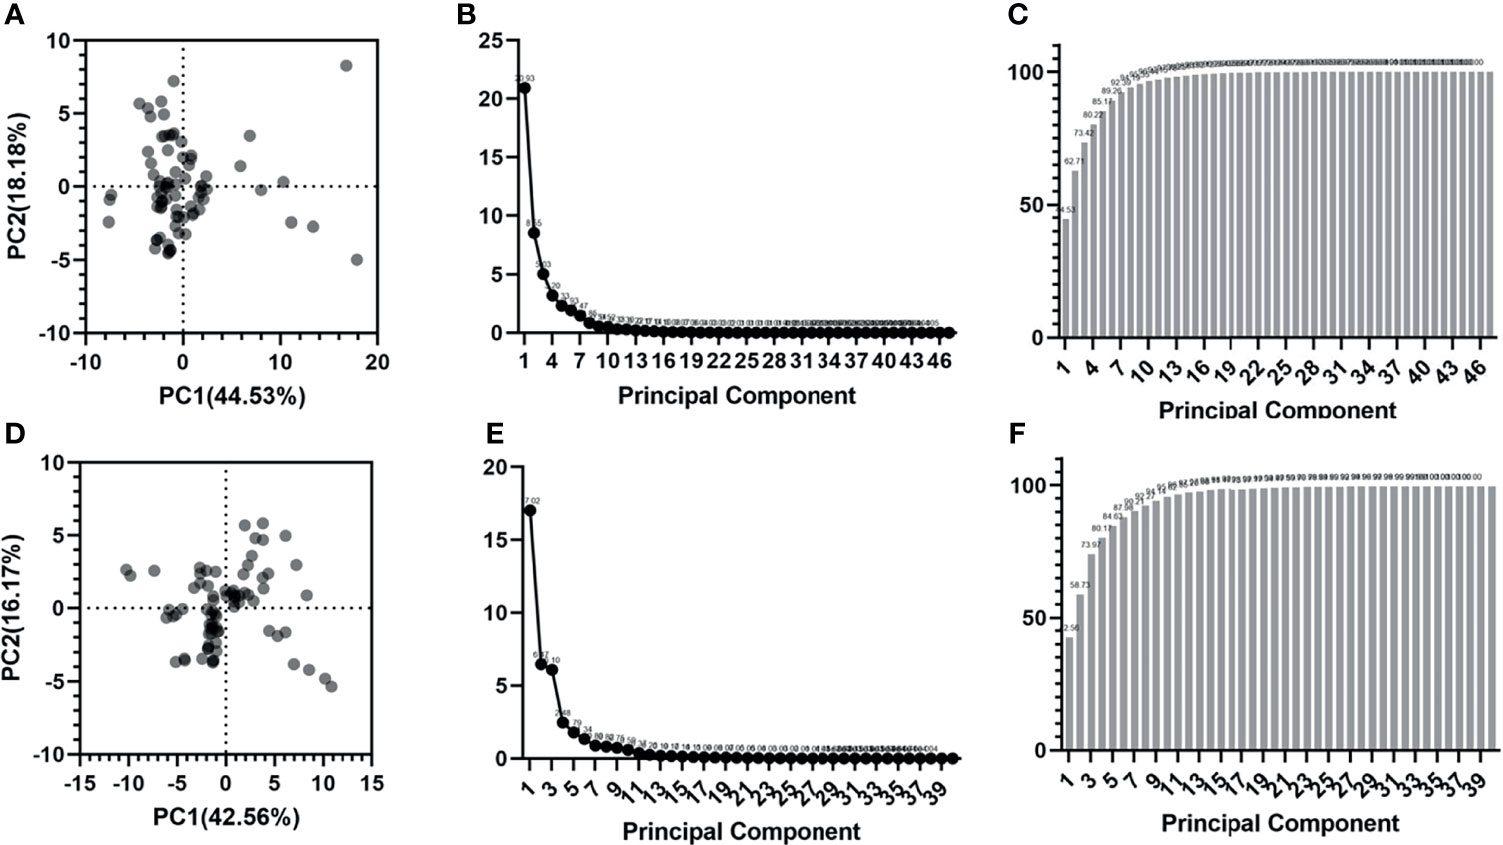
Figure 6 Radiomic features dimensionality reduction using PCA. (A-C) are the score plot, scree plot and proportion of variance plot for tumor tissue-derived radiomic features. (D-F) are the score plot, scree plot and proportion of variance plot for peritumoral tissue-derived radiomic features.
For peritumoral tissue-derived radiomic features, the variance contribution rates of PC1 and PC2 are 42.56% and 16.17%, respectively. The eigenvalues for each principal component are listed in Figure 6E. The cumulative proportion of variance is shown in Figure 6F. The first seven principal components can preserve at least 90% (90.21%) of the variance of the original feature set.
Discussion
The term “radiomics” has been coined for almost a decade since 2012. Despite numerous published studies, few are put into clinical practice because of the gaps in radiomics research (24). The gaps are multifaceted, sourced from the following parts (13): (1) features selection; (2) model building; (3) model selection; (4) model validation; (5) model performance; (6) intended clinical use; (7) impact on outcomes. In 2017, a consensus statement (25) and review (26) pointed the way to accelerate the clinical translation of radiomics, in which optimal reproducibility and stability of radiomic features is one necessary component but far from being fit-for-purpose in routine clinical use.
Recently, the sources of variation radiomics features were comprehensively surveyed (20). The results revealed that multiple sources of variation exist in each step of the radiomics workflow, starting with the earliest radiomics analyses. For example, features may be sensitive to heterogeneous image acquisition settings (scanners, scanning techniques, image filtering, and reconstruction parameters) (10, 27, 28), organ motion (29), tumor types and uncertain tumor boundaries in the segmentation step (inter-/intra-algorithm and post-seg. correction). Moreover, potential strategies and practical considerations were also discussed for reducing feature variability and improving the quality of radiomics studies. The inter-reader (or intra-reader) testing was suggested to identify radiomic features sensitive to lesion segmentation so that these features could be removed from subsequent analyses.
As described in the introduction section, several studies have reported the impact of tumor segmentation variants on the reproducibility of the radiomic features. Matea et al. (16) investigated the impact of inter-observer variability in manual tumor delineation on the reliability of radiomic features. They found that differences in tumor delineation could exert relevant influences on the results of a radiomics analysis. Furthermore, this effect varied with types of tumors. Brook et al. (17) identified that radiomic features were sensitive to even a slightly 2-mm change in segmentation margin for clear cell renal cell carcinomas. The possible influence of the segmentation margin was suggested for consideration. In addition, the reproducibility of the radiomic features significantly relied on the tumor segmentation (manually, semi-automatically, and fully-automated) and scan parameters (18, 19). In MR images, Alberto et al. (30) evaluated the stability of radiomic features obtained from apparent diffusion coefficient (ADC) maps of cervical cancer. They found that shape features were potentially more prone to inter-observer variability, and normalization prior to feature extraction contributed to increasing the reproducibility of ADC-based radiomics features. To sum up, all the above studies were performed in a single modality image during tumor segmentation, ignoring the value of multimodal images. In fact, in tumor delineation, multimodal images (such as PET-CT, multiple-parameter MR images, and CECT) can reduce the delineation variation, especially in HCC (31–33). However, the reproducibility of the resulting radiomic features remains unclear so far.
This study investigated the reproducibility of CT radiomic features from HCC via multimodal images target delineation. We found the numbers of excellent reproducibility for multiple-parameter MR images delineation were much more than those of CTCT and MIP images delineation in inter- and intra-observer contouring. The delineation of MIP images supported the least excellent reproducibility features. The reason might be that MR images could provide a high-contrast tumor than CECT images. The tumor borders were difficult to be defined in MIP images.
To the best of our knowledge, this study blazed a trail in assessing the radiomic feature variation stemming from different modal images. In addition, the differences between intra- and inter-observer results were also analyzed. More importantly, our research proved that this method could effectively improve the reproducibility of CT radiomics features in liver cancer.
Many tumors have indistinct borders, posing challenges to the reproducibility of their delineation. MRI has a significantly higher agreement on ROI delineation than CT images in some tumors, such as brain tumor (34), prostate cancer (35), and HCC (36). Therefore, this study tried to use multiple-parameter MR images to delineate the liver tumor. The radiomic feature extraction was performed on CT images. MR images have an obvious limitation in studying the reproducibility of radiomic features because of numerous scanning parameters. The magnetic field strength, b-values, radiofrequency coil, corrections for gradient non-linearity and other factors presented large variations. Sandra et al. (37) reported that few reproducible MRI-based radiomic features were acquired in cervical cancer, and shape features showed the most reliability. Another study (38) showed few reproducible radiomic features extracted from T1W and T2W imaging. In addition, normalization could also impact the reproducibility of T2W-MRI radiomic features (39). However, FLAIR imaging and T2 mapping could provide a large number of robust radiomic features (38, 40). CT images had fewer parameter settings, and radiomic features were hardly dependent on the time after contrast injection (41). Therefore, to date, most studies focused on radiomics analyses of CT, which is thus utilized in this study to perform radiomic features extraction.
Responsible radiomics research is crucial for advancing clinical translation, which requires great efforts to improve radiomics reproducibility. Choe et al. attempted to improve the reproducibility of radiomic features by applying kernel transformation techniques based on the convolutional neural network (42). This study takes the first step toward bigger strides in radiomics. Therefore, we have reason to believe that deep learning in the future will reverse the current research on the reproducibility of radiomics. Furthermore, to increase consistency in tumor delineation, automatic and semi-automatic precision segmentation algorithms are urgently needed (43, 44). Of course, the universality of algorithms needs to be confirmed by multiple observers in different fields. Insufficient transparency in reporting radiomics studies hinders the translation. Data sharing and open-source software packages are indispensable in the future to prove the clinical usefulness of radiomics (45, 46).
Our study also had several limitations. Firstly, this study was conducted at a single hospital, and the distribution of liver pathological changes and ethnic trends might differ slightly from other institutions. The multi-center study will be embraced in future work. Secondly, HCC presents high heterogeneity. Several studies have shown that radiomics can help unravel information about tumor heterogeneity hiding in medical images. If the radiomic features were extracted from the whole tumor, the reproducibility might be influenced by the HCC heterogeneity to some extent. Another limitation was that differences in tumor contours due to multimodal image registration algorithms were not considered (such as deformation registration versus rigid registration), which should be the focus of future studies.
Conclusion
We provide a new strategy to screen more reproducible radiomic features in HCC. Delineation on multiparametric MRI images in liver tumors and the subsequent extraction on CT images can help to capture more reproducible radiomic features.
Data Availability Statement
The original contributions presented in the study are included in the article/Supplementary Material. Further inquiries can be directed to the corresponding author.
Ethics Statement
Written informed consent was obtained from the individual(s) for the publication of any potentially identifiable images or data included in this article.
Author Contributions
Conceived and designed the experiments: JD and XM. Performed the experiments: JD, QQ. Analyzed the data: all authors. Wrote the paper: JD and XM. All authors contributed to the article and approved the submitted version.
Funding
This research was partly supported by the National Nature Science Foundation of China (No. 81901743, No. 82001902 and No. 82172072), the Natural Science Foundation of Shandong Province (No. ZR2020QH198 and ZR2020LZL001).
Conflict of Interest
The authors declare that the research was conducted in the absence of any commercial or financial relationships that could be construed as a potential conflict of interest.
Publisher’s Note
All claims expressed in this article are solely those of the authors and do not necessarily represent those of their affiliated organizations, or those of the publisher, the editors and the reviewers. Any product that may be evaluated in this article, or claim that may be made by its manufacturer, is not guaranteed or endorsed by the publisher.
Acknowledgments
We thank the Language Editing Service of KetengEdit for assistance with the language editing.
Supplementary Material
The Supplementary Material for this article can be found online at: https://www.frontiersin.org/articles/10.3389/fonc.2022.881931/full#supplementary-material
Supplementary Figure 1 | The ICC values in each radiomic feature subgroup for CECT, MIP and MR delineations for tumor tissues.
Supplementary Figure 2 | The ICC values in each radiomic feature subgroup for CECT, MIP and MR delineations for peritumoral tissues.
Supplementary Table 1 | The detailed QCD numbers of radiomic features.
Supplementary Table 2 | The specific radiomic feature with small variation and excellent reproducibility.
References
1. World Health Organization. The Global Cancer Observatory: Cancer Today EB/OL Available at: https://gco.iarc.fr/today/fact-sheets-cancers.
2. Forner A, llovet JM, Bruix J. Hepatocellular Carcinoma. Lancet (2012) 379:1245–55. doi: 10.1016/S0140-6736(11)61347-0
3. Bruix J, Sherman M. Management of Hepatocellular Carcinoma: An Update. Aasld Practice Guideline. Hepatology (2011) 53:1020–2. doi: 10.1002/hep.24199
4. Mulé S, Galletto PA, Tenenhaus A, Kharrat R, Amaddeo G, Baranes L, et al. Multiphase Liver MRI for Identifying the Macrotrabecular-Massive Subtype of Hepatocellular Carcinoma. Radiology (2020) 295:562–71. doi: 10.1148/radiol.2020192230
5. Tapper EB, Lok AS-F. Use of Liver Imaging and Biopsy in Clinical Practice. N Engl J Med (2017) 377:756–68. doi: 10.1056/NEJMra1610570
6. Lambin P, Rios-Velazquez E, Leijenaar R, Carvalho S, van Stiphout RGPM, Granton P, et al. Radiomics: Extracting More Information From Medical Images Using Advanced Feature Analysis. Eur J Cancer (2012) 48:441–6. doi: 10.1016/j.ejca.2011.11.036
7. Aerts Hugo JWL, Velazquez ER, Leijenaar RTH, Parmar C, Grossmann P, Cavalho S, et al. Decoding Tumour Phenotype by Noninvasive Imaging Using a Quantitative Radiomics Approach. Nat Commun (2014) 5:4006. doi: 10.1038/ncomms5006
8. Renzulli M, Biselli M, Brocchi S, Granito A, Vasuri F, Tovoli F, et al. New Hallmark of Hepatocellular Carcinoma, Early Hepatocellular Carcinoma and High-Grade Dysplastic Nodules on Gd-EOB-DTPA MRI in Patients With Cirrhosis: A New Diagnostic Algorithm. Gut (2018) 67:1674–82. doi: 10.1136/gutjnl-2017-315384
9. Lee Scott J, Zea R, Kim DH, Lubner MG, Deming DA, Pickhardt PJ. CT Texture Features of Liver Parenchyma for Predicting Development of Metastatic Disease and Overall Survival in Patients With Colorectal Cancer. Eur Radiol (2018) 28:1520–8. doi: 10.1007/s00330-017-5111-6
10. Mackin D, Fave X, Zhang L, Fried D, Yang JZ, Taylor B, et al. Measuring Computed Tomography Scanner Variability of Radiomics Features. Invest Radiol (2015) 50(11):757–65. doi: 10.1097/RLI.0000000000000180
11. Gillies RJ, Kinahan PE, Hricak H. Radiomics: Images are More Than Pictures, They are Data. Radiology (2016) 278(2):563–77. doi: 10.1148/radiol.2015151169
12. Ibrahim A, Primakov S, Beuque M, Woodruff HC, Halilaj I, Wu G, et al. Radiomics for Precision Medicine: Current Challenges, Future Prospects, and the Proposal of a New Framework. Methods (2021) 188:20–9. doi: 10.1016/j.ymeth.2020.05.022
13. Zwanenburg A. Radiomics in Nuclear Medicine: Robustness, Reproducibility, Standardization, and How to Avoid Data Analysis Traps and Replication Crisis. Eur J Nucl Med Mol Imaging (2019) 46:2638–55. doi: 10.1007/s00259-019-04391-8
14. Traverso A, Wee L, Dekker A, Gillies R. Repeatability and Reproducibility of Radiomic Features: A Systematic Review. Int J Radiat Oncol Biol Phys (2018) 102:1143–58. doi: 10.1016/j.ijrobp.2018.05.053
15. Park JE, Park SY, Kim HJ, Kim HS. Reproducibility and Generalizability in Radiomics Modeling: Possible Strategies in Radiologic and Statistical Perspectives. Kor J Radiol (2019) 20:1124–37. doi: 10.3348/kjr.2018.0070
16. Pavic M, Bogowicz M, Würms X, Glatz S, Finazzi T, Riesterer O, et al. Influence of Inter-Observer Delineation Variability on Radiomics Stability in Different Tumor Sites. Acta Oncol (2018) 57:1070–4. doi: 10.1080/0284186X.2018.1445283
17. Kocak B, Ates E, Durmaz ES, Ulusan MB, Kilickesmez O. Influence of Segmentation Margin on Machine Learning-Based High-Dimensional Quantitative CT Texture Analysis: A Reproducibility Study on Renal Clear Cell Carcinomas. Eur Radiol (2019) 29:4765–75. doi: 10.1007/s00330-019-6003-8
18. Qiu Q, Duan J, Duan Z, Meng X, Ma C, Zhu J, et al. Reproducibility and Non-Redundancy of Radiomic Features Extracted From Arterial Phase CT Scans in Hepatocellular Carcinoma Patients: Impact of Tumor Segmentation Variability. Quant Imaging Med Surg (2019) 9:453–64. doi: 10.21037/qims.2019.03.02
19. Yamashita R, Perrin T, Chakraborty J, Chou JF, Horvat N, Koszalka MA, et al. Radiomic Feature Reproducibility in Contrast-Enhanced CT of the Pancreas is Affected by Variabilities in Scan Parameters and Manual Segmentation. Eur Radiol (2020) 30:195–205. doi: 10.1007/s00330-019-06381-8
20. Zhao B. Understanding Sources of Variation to Improve the Reproducibility of Radiomics. Front Oncol (2021) 11:633176. doi: 10.3389/fonc.2021.633176
21. Contrast Media Safety Committee. ESUR Guidelines on Contrast Agents. Available at: https://www.esur.org/fileadmin/content/2019/ESUR_Guidelines_10.0_Final_Version.pdf.
22. Bonett DG. Confidence Interval for a Coefficient of Quartile Variation. Comput Stat Data Anal (2006) 50(11):2953–7. doi: 10.1016/j.csda.2005.05.007
23. Tkk A, Mylb B. A Guideline of Selecting and Reporting Intraclass Correlation Coefficients for Reliability Research. J Chiropractic Med (2016) 15(2):155–63. doi: 10.1016/j.jcm.2016.02.012
24. Pinto Dos Santos D, Dietzel M, Baessler B. A Decade of Radiomics Research: Are Images Really Data or Just Patterns in the Noise? Eur Radiol (2021) 31:1–4. doi: 10.1007/s00330-020-07108-w
25. O’Connor JPB, Aboagye EO, Adams JE, Aerts HJ, Barrington SF, Beer AJ, et al. Imaging Biomarker Roadmap for Cancer Studies. Nat Rev Clin Oncol (2017) 14:169–86. doi: 10.1038/nrclinonc.2016.162
26. Lambin P, Leijenaar RTH, Deist TM, Peerlings J, de Jong EEC, van Timmeren J, et al. Radiomics: The Bridge Between Medical Imaging and Personalized Medicine. Nat Rev Clin Oncol (2017) 14:749–62. doi: 10.1038/nrclinonc.2017.141
27. Larue RTHM, Van De Voorde L, van Timmeren JE, Leijenaar RTH, Berbée M, Sosef MN, et al. 4dct Imaging to Assess Radiomics Feature Stability: An Investigation for Thoracic Cancers. Radiother Oncol (2017) 125:147–53. doi: 10.1016/j.radonc.2017.07.023
28. Berenguer R, Pastor-Juan Del Rosario M, Canales-Vázquez J, Castro-García M, Villas MV, Mansilla Legorburo F, et al. Radiomics of CT Features May Be Nonreproducible and Redundant: Influence of CT Acquisition Parameters. Radiology (2018) 288:407–15. doi: 10.1148/radiol.2018172361
29. Alis D, Yergin M, Asmakutlu O, Topel C, Karaarslan E. The Influence of Cardiac Motion on Radiomics Features: Radiomics Features of Non-Enhanced CMR Cine Images Greatly Vary Through the Cardiac Cycle. Eur Radiol (2021) 31:2706–15. doi: 10.1007/s00330-020-07370-y
30. Traverso A, Kazmierski M, Welch ML, Weiss J, Fiset S, Foltz WD, et al. Sensitivity of Radiomic Features to Inter-Observer Variability and Image Pre-Processing in Apparent Diffusion Coefficient (ADC) Maps of Cervix Cancer Patients. Radiother Oncol (2020) 143:88–94. doi: 10.1016/j.radonc.2019.08.008
31. Jensen NKG, Mulder D, Lock M, Fisher B, Zener R, Beech B, et al. Dynamic Contrast Enhanced CT Aiding Gross Tumor Volume Delineation of Liver Tumors: An Interobserver Variability Study. Radiother Oncol (2014) 111:153–7. doi: 10.1016/j.radonc.2014.01.026
32. Kim YS, Kim JW, Yoon WS, Kang MK, Lee IJ, Kim TH, et al. Interobserver Variability in Gross Tumor Volume Delineation for Hepatocellular Carcinoma: Results of Korean Radiation Oncology Group 1207 Study. Strahlenther Onkol (2016) 192:714–21. doi: 10.1007/s00066-016-1028-2
33. Habraken SJM, Sharfo AWM, Buijsen J, Verbakel WFAR, Haasbeek CJA, Öllers MC, et al. The TRENDY Multi-Center Randomized Trial on Hepatocellular Carcinoma - Trial QA Including Automated Treatment Planning and Benchmark-Case Results. Radiother Oncol (2017) 125:507–13. doi: 10.1016/j.radonc.2017.09.007
34. Weltens C, Menten J, Feron M, Bellon E, Demaerel P, Maes F, et al. Interobserver Variations in Gross Tumor Volume Delineation of Brain Tumors on Computed Tomography and Impact of Magnetic Resonance Imaging. Radiother Oncol (2001) 60:49–59. doi: 10.1016/S0167-8140(01)00371-1
35. Groenendaal G, Moman MR, Korporaal JG, van Diest PJ, van Vulpen M, Philippens ME. Validation of Functional Imaging With Pathology for Tumor Delineation in the Prostate. Radiother Oncol (2010) 94:145–50. doi: 10.1016/j.radonc.2009.12.034
36. Wei J, Jiang H, Gu D, Niu M, Fu F, Han Y, et al. Radiomics in Liver Diseases: Current Progress and Future Opportunities. Liver Int (2020) 40:2050–63. doi: 10.1111/liv.14555
37. Fiset S, Welch ML, Weiss J, Pintilie M, Conway JL, Milosevic M, et al. Repeatability and Reproducibility of MRI-Based Radiomic Features in Cervical Cancer. Radiother Oncol (2019) 135:107–14. doi: 10.1016/j.radonc.2019.03.001
38. Baeßler B, Weiss K, Pinto Dos Santos D. Robustness and Reproducibility of Radiomics in Magnetic Resonance Imaging: A Phantom Study. Invest Radiol (2019) 54:221–8. doi: 10.1097/RLI.0000000000000530
39. Scalco E, Belfatto A, Mastropietro A, Rancati T, Avuzzi B, Messina A, et al. T2w-MRI Signal Normalization Affects Radiomics Features Reproducibility. Med Phys (2020) 47:1680–91. doi: 10.1002/mp.14038
40. Crombé A, Buy X, Han F, Toupin S, Kind M. Assessment of Repeatability, Reproducibility, and Performances of T2 Mapping-Based Radiomics Features: A Comparative Study. J Magn Reson Imaging (2021) 54(2):537–48. doi: 10.1002/jmri.27558
41. Yang J, Zhang L, Fave XJ, Fried DV, Stingo FC, Ng CS, et al. Uncertainty Analysis of Quantitative Imaging Features Extracted From Contrast-Enhanced CT in Lung Tumors. Comput Med Imaging Graph (2016) 48:1–8. doi: 10.1016/j.compmedimag.2015.12.001
42. Choe J, Lee SM, Do KH, Lee G, Lee JG, Lee SM, et al. Deep Learning-Based Image Conversion of CT Reconstruction Kernels Improves Radiomics Reproducibility for Pulmonary Nodules or Masses. Radiology (2019) 292:365–73. doi: 10.1148/radiol.2019181960
43. Bi WL, Hosny A, Schabath MB, Giger ML, Birkbak NJ, Mehrtash A, et al. Artificial Intelligence in Cancer Imaging: Clinical Challenges and Applications. CA: Cancer J Clin (2019) 69(2):127–57. doi: 10.3322/caac.21552
44. Lin YC, Lin CH, Lu HY, Chiang HJ, Wang HK, Huang YT, et al. Deep Learning for Fully Automated Tumor Segmentation and Extraction of Magnetic Resonance Radiomics Features in Cervical Cancer. Eur Radiol (2020) 30(3):1297–305. doi: 10.1007/s00330-019-06467-3
45. Sardanelli F, Alì M, Hunink MG, Houssami N, Sconfienza LM, Di Leo G. To Share or Not to Share? Expected Pros and Cons of Data Sharing in Radiological Research. Eur Radiol (2018) 28:2328–35. doi: 10.1007/s00330-017-5165-5
Keywords: radiomic feature, reproducibility, hepatocellular carcinoma (HCC), multiple-parameter MR images, 4D-CT
Citation: Duan J, Qiu Q, Zhu J, Shang D, Dou X, Sun T, Yin Y and Meng X (2022) Reproducibility for Hepatocellular Carcinoma CT Radiomic Features: Influence of Delineation Variability Based on 3D-CT, 4D-CT and Multiple-Parameter MR Images. Front. Oncol. 12:881931. doi: 10.3389/fonc.2022.881931
Received: 23 February 2022; Accepted: 21 March 2022;
Published: 14 April 2022.
Edited by:
Youyong Kong, Southeast University, ChinaReviewed by:
Rui Hu, Suzhou Municipal Hospital, ChinaChunyu Wang, Second Affiliated Hospital of Jilin University, China
Copyright © 2022 Duan, Qiu, Zhu, Shang, Dou, Sun, Yin and Meng. This is an open-access article distributed under the terms of the Creative Commons Attribution License (CC BY). The use, distribution or reproduction in other forums is permitted, provided the original author(s) and the copyright owner(s) are credited and that the original publication in this journal is cited, in accordance with accepted academic practice. No use, distribution or reproduction is permitted which does not comply with these terms.
*Correspondence: Xiangjuan Meng, eGpfbWVuZ0AxNjMuY29t
 Jinghao Duan
 Qingtao Qiu
 Jian Zhu
 Dongping Shang
 Xue Dou
 Tao Sun
 Yong Yin
 Xiangjuan Meng