
94% of researchers rate our articles as excellent or good
Learn more about the work of our research integrity team to safeguard the quality of each article we publish.
Find out more
ORIGINAL RESEARCH article
Front. Oncol. , 06 May 2022
Sec. Molecular and Cellular Oncology
Volume 12 - 2022 | https://doi.org/10.3389/fonc.2022.881801
 Lirui Dai1,2,3
 Yiran Tao1,2,3
 Zimin Shi1,2,3
 Wulong Liang2,3
 Weihua Hu2,3
 Zhe Xing1,2,3
 Shaolong Zhou1,2
 Xuyang Guo1,2,3
 Xudong Fu1,2,3
 Xinjun Wang1,2,3*
The suppressor of cytokine signaling (SOCS) family contains eight members, including SOCS1–7 and CIS, and SOCS3 has been shown to inhibit cytokine signal transduction in various signaling pathways. Although several studies have currently shown the correlations between SOCS3 and several types of cancer, no pan-cancer analysis is available to date. We used various computational tools to explore the expression and pathogenic roles of SOCS3 in several types of cancer, assessing its potential role in the pathogenesis of cancer, in tumor immune infiltration, tumor progression, immune evasion, therapeutic response, and prognostic. The results showed that SOCS3 was downregulated in most The Cancer Genome Atlas (TCGA) cancer datasets but was highly expressed in brain tumors, breast cancer, esophageal cancer, colorectal cancer, and lymphoma. High SOCS3 expression in glioblastoma multiforme (GBM) and brain lower-grade glioma (LGG) were verified through immunohistochemical experiments. GEPIA and Kaplan–Meier Plotter were used, and this bioinformatics analysis showed that high SOCS3 expression was associated with a poor prognosis in the majority of cancers, including LGG and GBM. Our analysis also indicated that SOCS3 may be involved in tumor immune evasion via immune cell infiltration or T-cell exclusion across different types of cancer. In addition, SOCS3 methylation was negatively correlated with mRNA expression levels, worse prognoses, and dysfunctional T-cell phenotypes in various types of cancer. Next, different analytical methods were used to select genes related to SOCS3 gene alterations and carcinogenic characteristics, such as STAT3, SNAI1, NFKBIA, BCL10, TK1, PGS1, BIRC5, TMC8, and AFMID, and several biological functions were identified between them. We found that SOCS3 was involved in cancer development primarily through the JAK/STAT signaling pathway and cytokine receptor activity. Furthermore, SOCS3 expression levels were associated with immunotherapy or chemotherapy for numerous types of cancer. In conclusion, this study showed that SOCS3 is an immune-oncogenic molecule that may possess value as a biomarker for diagnosis, treatment, and prognosis of several types of cancer in the future.
Cancer is currently the primary cause of death worldwide, and its morbidity and mortality rates have been increasing on an annual basis. The latest research released by the International Agency for Research on Cancer indicated that lung cancer remains the most common cause of cancer-associated death, followed by colorectal cancer and prostate cancer (1). Therefore, there is an urgent need for potential diagnostic markers and therapeutic methods to control tumor progression.
Tumorigenesis is a complex process involving genetic alterations and epigenetic modifications (2). Genetic and epigenetic alterations can alter the progression of cancers and promote tumor progression (3). The tumor microenvironment (TME) is widely associated with the occurrence of cancers. Immune cells, fibroblasts, adipocytes, and the tumor vascular systems all contribute to the tumor microenvironment (4). Tumor-associated immune cells can be roughly segmented into two types: tumor-antagonistic immune cells and tumor-promoting immune cells. The two types of cells perform different functions at different stages of tumor formation (5). It is worth mentioning that tumor-promoting immune cells can affect immune homeostasis and immune tolerance (5), promote tumor cell migration to endothelial cells, increase metastasis (6), promote immune avoidance, increase tumor blood vessel formation, and promote the acquisition of treatment resistance, and these processes involve manipulation of regulatory T cells (Tregs), myeloid-derived suppressor cells (MDSC), cancer-associated fibroblasts (CAF), and M2-polarized macrophages (7).
Different types of immune-related cells serve differing roles in various types of cancer; therefore, immune escape of tumors has become a challenging problem in disease treatment (5). Through bioinformatics analysis, we concentrated on the immune microenvironment of tumors, investigating multiple tumor immunosuppression mechanisms and therapeutic methods, and provided evidence for cancer diagnosis, therapeutic responses, and prognosis (8).
The SOCS family consists of eight members, and SOCS3 can affect the occurrence of tumors by interacting with a variety of immune molecules and several signaling pathways (9, 10). We previously summarized the role of SOCS3 in several types of tumors (10), and numerous experiments have also confirmed the association between SOCS3 and different types of cancer, including breast cancer (11), colorectal cancer (12), and glioblastoma (13). However, the pathogenesis of SOCS3 in various types of cancer and whether there is a common molecular mechanism between these different types of cancer in regulating the pathogenic effects and treatment responses remain to be further studied. Therefore, we explored the potential molecular mechanisms of SOCS3 in the diagnosis, treatment, and prognosis of a range of cancers (Figure 1).
Oncomine (https://www.oncomine.org/) (access date: November 1, 2021) was employed to investigate the mRNA expression levels of SOCS3 in several types of cancer (14). The threshold values were set in line with the following parameters: analysis of components, cancer vs. normal tissue and cancer vs. cancer tissue; p-value, 0.01; gene ranking of top 10%; and fold change, all. A t-test was used to calculate the p-value. Furthermore, the TIMER2.0 (http://timer.cistrome.org/) (access date: November 2, 2021) database (15), gene expression profiling interactive analysis (GEPIA2) database (http://gepia2.cancer-pku.cn/) (access date: November 3, 2021) (16), and UALCAN (http://ualcan.path.uab.edu/) (access date: November 3, 2021) (17) were employed to systematically compare the expression levels of SOCS3 between cancers and the corresponding normal tissues. We used the GEPIA2 and UALCAN databases to assess the SOCS3 expression in different tumor pathological stages across TCGA cancer types. p<0.05 was considered to indicate a statistically significant difference.
GEPIA2 and Kaplan–Meier plotter (http://www.kmplot.com/analysis/) (access date: November 4, 2021) (18) were used to investigate the overall survival (OS) and disease-free survival (DFS) of SOCS3 based on TCGA data. Cutoff-low (50%) and cutoff-high (50%) values were used as the different expression thresholds. Patient samples were segmented into high and low SOCS3 expression groups and analyzed using the risk ratio (95% confidence interval) and log rank test p-values.
The association between the SOCS3 gene and tumor immune cell infiltrations (TIICs) (including B cells, CD8+ T cells, CD4+ T cells, DC cells, neutrophils, and macrophages) in different types of tumors were investigated using the TIMER2.0 database. Spearman-based correlation analysis was corrected based on tumor purity (19). The correlation of SOCS3 expression with several immunosuppressive cells, which can promote T-cell exclusion, were analyzed, including the M2 subtype of tumor-associated macrophages (M2-TAMs), cancer-associated fibroblasts (CAFs), myeloid-derived suppressor cells (MDSCs), and regulatory T (Treg) cells in 40 different cancers based on data obtained from TCGA. The Spearman’s rho value was corrected using tumor purity, and p<0.05 was considered to indicate a statistically significant difference. Furthermore, we applied Tumor Immune Dysfunction and Exclusion (TIDE) (http://tide.dfci.harvard.edu/) (access date: November 4, 2021) to assess whether the epigenetic alterations of SOCS3 could impact the dysfunctional T-cell phenotypes (20, 21). We visualized the levels of immune cell infiltration using heatmaps via 35 cancer types.
We employed the cBioPortal (http://www.cbioportal.org/) (access date: November 5, 2021) database to evaluate co-occurrence modes of gene mutation between SOCS3 and other genes based on data from 10,967 patients from TCGA Pan-Cancer Atlas Studies (22). Co-occurrence modes of gene mutations were directed as follows: log ratio >5, p-value < 1 ×10⁻¹⁰. The Oncomine database was used to assess related genes that were associated with SOCS3 expression in different types of tumors.
The methylation section of the UALCAN database was used to investigate differences in SOCS3 methylation status between different types of tumors and normal tissues based on TCGA cancer types (23). β-Values represent the promoter methylation levels, ranging from 0 to 1, which corresponded to unmethylated and fully methylated, respectively. Hypomethylation was considered as β-values in the range of 0.25–0.3, whereas hypermethylation was considered as β-values in the range of 0.5–0.75 (24).
The GPS-Prot (http://gpsprot.org/) (access date: November 5, 2021) database was applied for protein–protein interaction (PPI) analysis of SOCS3 (25), while the STRING (https://string-db.org/) (access date: November 6, 2021) website was used to determine the proteins interacting with SOCS3 (26). These databases constructed PPI networks based on the co-expression analysis, colocalization, genetic interaction, and common pathways. We employed the GEPIA2 database to gain the top 100 target genes related to SOCS3 and conducted Pearson correlation analysis, respectively. In addition, we used the TIMER2.0 database to obtain the heatmap data of the six top-most related genes.
We used Jvenn, an interactive Venn graph viewer, to compare the genes that interacted with SOCS3 (27). Moreover, PPI and enrichment analyses were performed using the SOCS3 co-expressed and co-mutated genes. We used Database for Annotation, Visualization, and Integrated Discovery (DAVID) (https://david.ncifcrf.gov/) (access date: November 7, 2021) to perform Gene Ontology (GO) and Kyoto Encyclopedia of Genes and Genomes (KEGG) enrichment analysis. The enrichment p-value <0.05 was considered to indicate a statistically significant difference (28).
We used the ROC plotter (http://rocplot.org/) (access date: November 9, 2021) database to analyze whether SOCS3 mRNA expression was relevant to therapeutic responses in patients with breast cancer, ovarian cancer, glioblastoma (GBM), and colorectal cancer (29). In addition, we used the TIDE website and queried the regulator prioritization of SOCS3 from four aspects, which specifically included the response to T dysfunction, immune checkpoint blockade therapy (ICB), CRISPR screens, and immune-suppressive cell types. It is worth mentioning that the Z-score in the Cox-PH regression was employed to assess whether differences in SOCS3 expression had influences on ICB-treated patients. Furthermore, we entered the biomarker evaluation section of the TIDE to compare the therapeutic responses of SOCS3 expression to different cancer types with nine standardized tumor immune response biomarkers, including MSI, TMB, CD274, CD8, IFNG, T.Clonality, B.Clonalityand, Merck 18, and TIDE (20, 21).
We fixed tissues obtained from 30 HGG patients (11 GBM) and 32 LGG patients with 10% formaldehyde, which were subsequently paraffin-embedded and sectioned, and then, tissues were incubated overnight at 4°C with an anti-SOCS3 antibody (Abcam, cat. no. AB16030, 1:100 dilution). After washing with phosphate-buffered saline (PBS), we added sheep anti-rabbit secondary antibody (1∶200 dilution) labeled with horseradish peroxidase (HRP) and incubated at room temperature for 20 min. Samples were washed again with PBS, and HRP-conjugated streptomycin working solution was added and incubated at room temperature for 15 min. Then, DAB chromogenic solution was used for color development, and hematoxylin staining was observed under a microscope. The areas with a strong immune response in each section were selected, and five non-repeating fields were observed with a low magnification field (200×) and high magnification field (400×), respectively, and the number of SOCS3-positive cells were counted.
We employed the GeneCards (https://www.genecards.org/) (access date: November 2, 2021) database to explore SOCS3 mRNA expression in normal tissues and found that SOCS3 was highly expressed in the nervous system, reproductive system, immune system, and various visceral tissues (Figure 2A) (30, 31). Then, PROTTER (https://wlab.ethz.ch/protter/start/) (access date: November 4, 2021) was used to explore the SOCS3 protein topology. A natural missense variant of Tis125 was located in the intracellular membrane (Figure 2B). Next, the GPS-Prot database was used to display the SOCS3 gene network and found the genes correlated with SOCS3 (Figure 2C). The Open Targets Platform (https://platform.opentargets.org/) (access date: November 10, 2021) database was applied to analyze the correlations between SOCS3 and diseases. The results showed that SOCS3 was associated with benign tumors, cancers, nervous system diseases, respiratory or thoracic diseases, genetic diseases, endocrine system diseases, nutritional or metabolic diseases, immune system diseases, and gastrointestinal diseases (Figure 2D). Finally, we used The Human Protein Atlas (https://www.proteinatlas.org/) (access date: November 13, 2021), specifically the Cell Atlas section, to evaluate the distribution of SOCS3 within the nucleus, microtubules, and endoplasmic reticulum (ER) of ASC TERT1, BJ, and U-2 OS cells via immunofluorescence analysis. We found that SOCS3 was co-localized with microtubules and ER markers in ASC TERT1, BJ, and U-2 OS, which suggested that the subcellular localization of SOCS3 was largely restricted to microtubules and ER. An overlap between SOCS and the nucleus was not observed (Figure 2E).
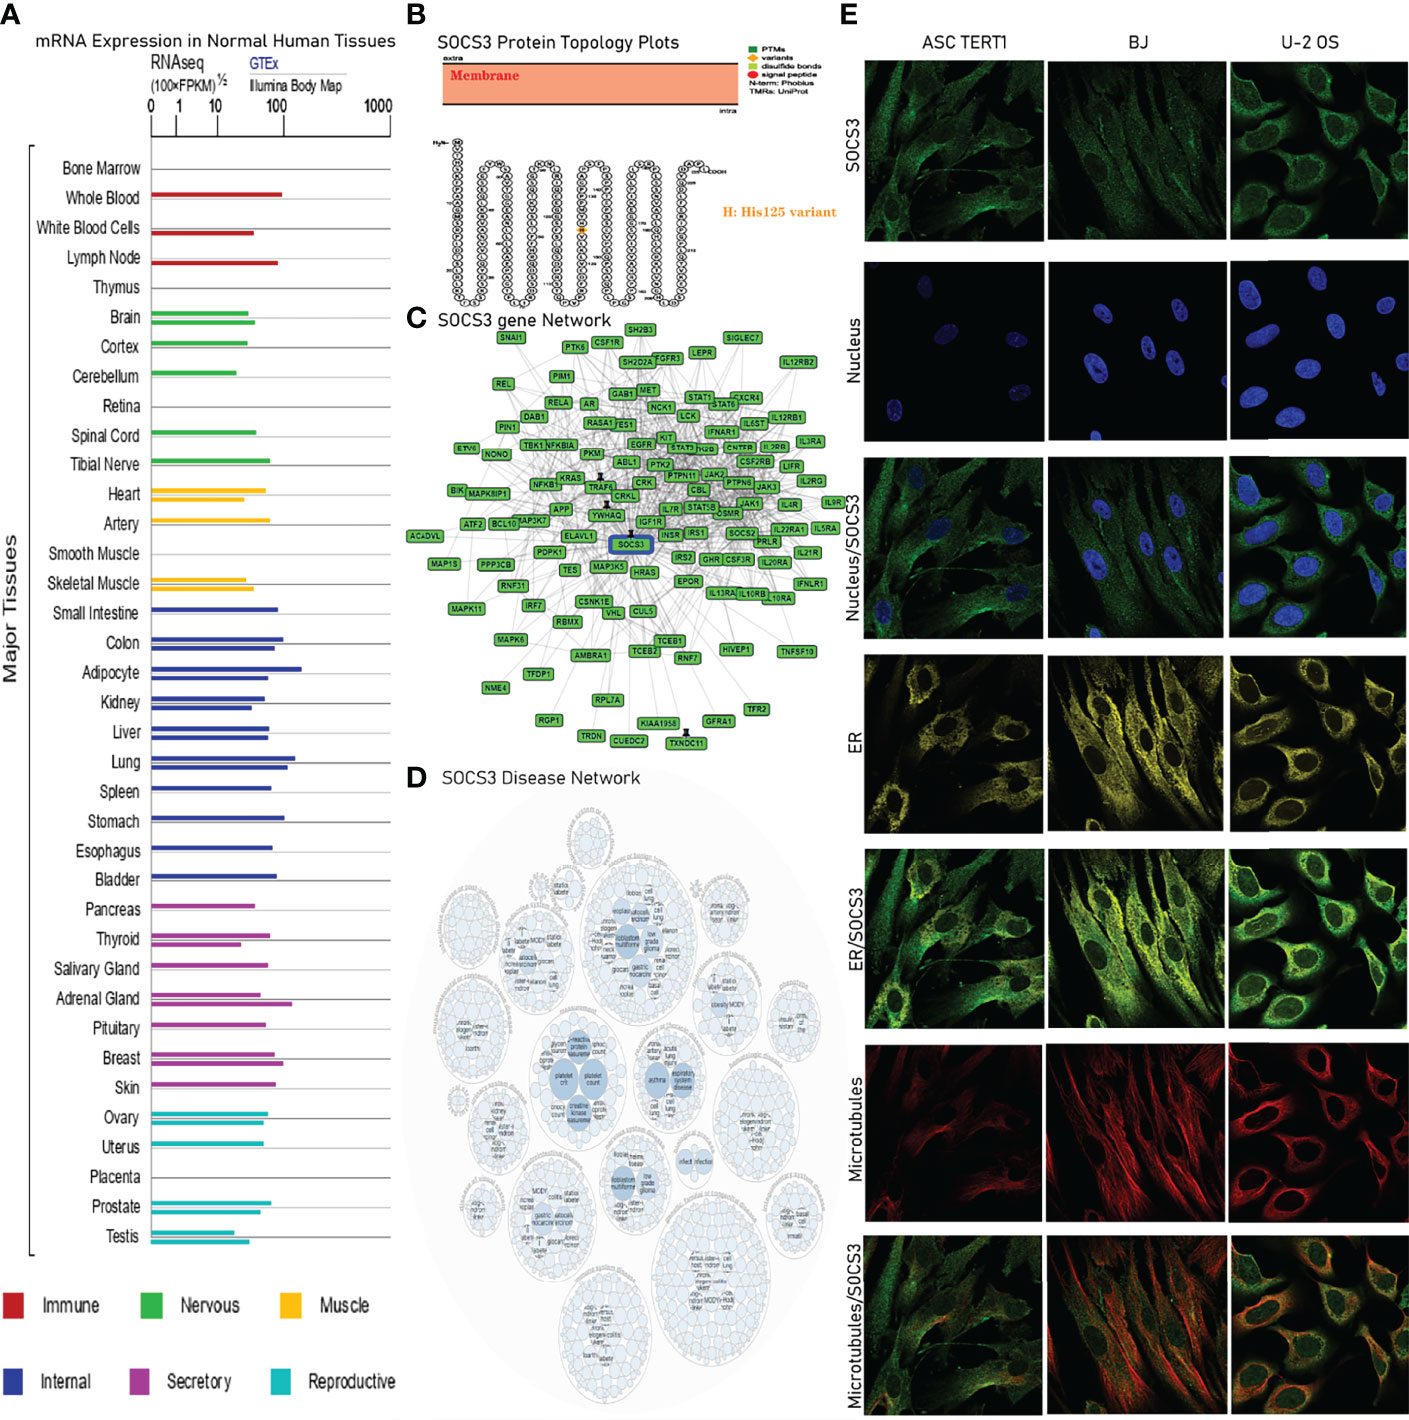
Figure 2 SOCS3 localization, variations, and expression under physiological conditions. (A) SOCS3 mRNA expression status in disparate normal human samples across GTEx database. (B) SOCS3 protein topology shows a His125 variant that is located in the membrane. (C, D) Network of functional genes and diseases associated with SOCS3. (E) Immunofluorescence staining of subcellular distribution of SOCS3 in endoplasmic reticulum (ER), nucleus and microtubule of ASC TERT1, BJ, and U-2 osteosarcoma.
The Oncomine website was employed to compare the mRNA expression levels of SOCS3 between various types of cancer and the corresponding healthy samples. The results indicated that the expression of SOCS3 mRNA was upregulated in lymphoma, esophageal cancer, and glioma compared with normal tissues, while the expression of SOCS3 mRNA was downregulated in bladder cancer, lung cancer, leukemia, and sarcoma compared with the respective normal controls (Figure 3A). Next, we used the TIMER2.0 to probe the expression of SOCS3 across a range of cancers. The results indicated that SOCS expression was lower in bladder urothelial carcinoma (BLCA), breast invasive carcinoma (BRCA), kidney chromophobe (KICH), liver hepatocellular carcinoma (LIHC), lung adenocarcinoma (LUAD), lung squamous cell carcinoma (LUSC), prostate adenocarcinoma (PRAD), testicular germ cell tumors (TGCT) (p<0.001), uterine corpus endometrial carcinoma (UCEC) (p<0.01) and head and neck squamous cell carcinoma (HNSC), and kidney renal papillary cell carcinoma (KIRP) (p<0.05) compared with the healthy controls.
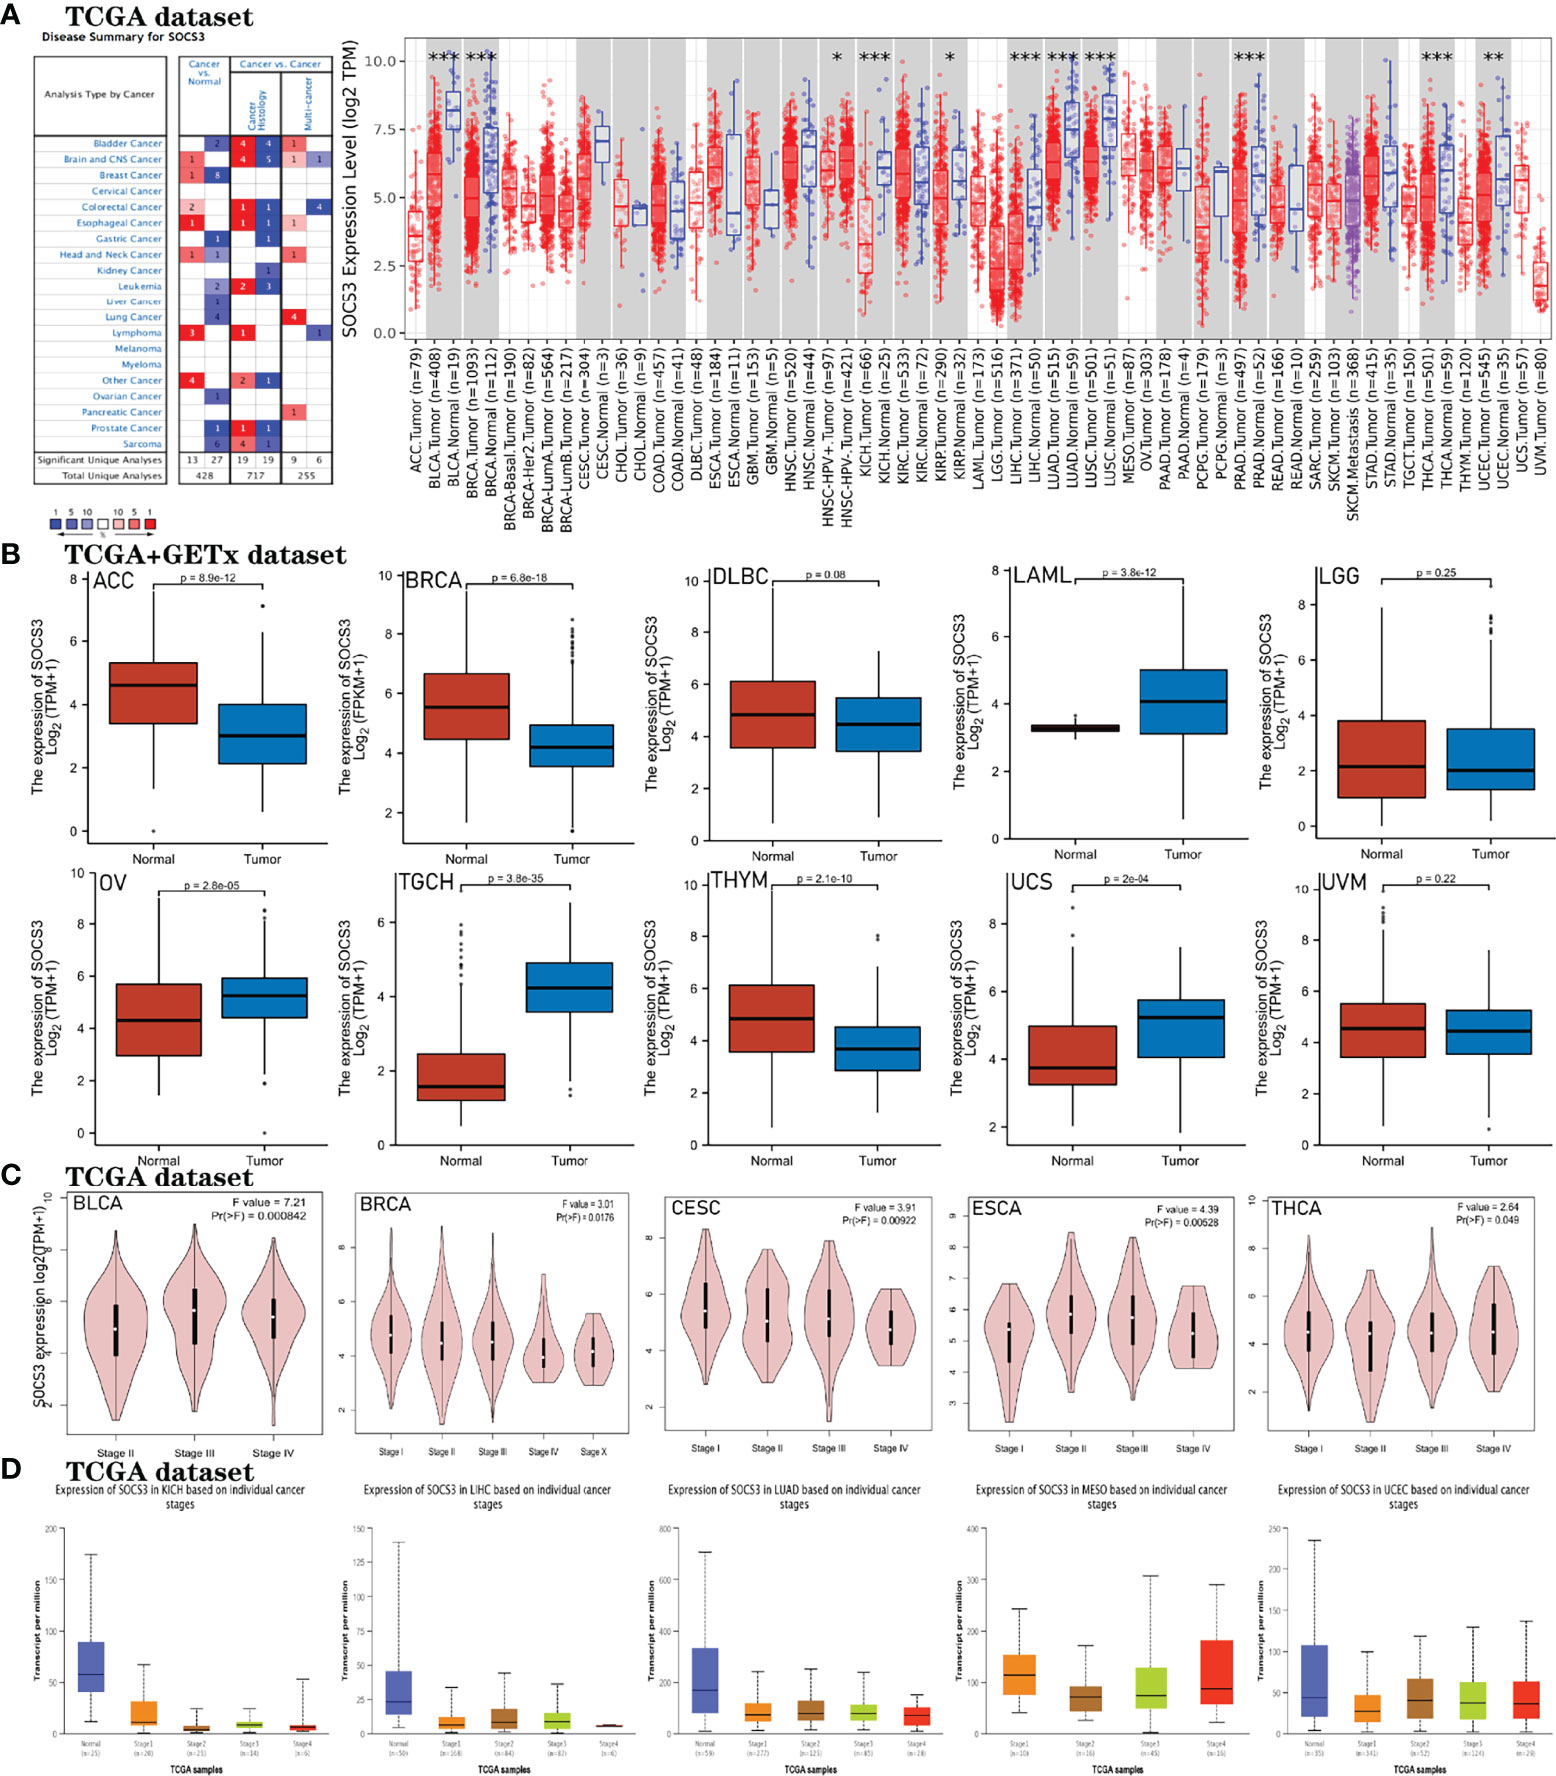
Figure 3 Expression of SOCS3 in disparate cancers and pathological stages. (A) Expression of SOCS3 mRNA in disparate kinds of cancers analyzed with Oncomine and TIMER2.0 databases. Oncomine website: fold change = 2, p-value = 0.01. The value in the figure on behalf of the number of datasets that satisfy the threshold. Red and blue indicate the degree of upregulation and downregulation respectively. TIMER2.0: ***p < 0.001, **p < 0.01, *p < 0.05. (B) Expression of SOCS3 mRNA levels in ACC, BRCA, DLBC, LAML, LGG, OV, TGCH, THYM, UCS, and UVM across TCGA cancers, and the corresponding normal samples in the GETx dataset were employed as controls. (C, D) GEPIA2 and UALCAN databases were used to analyze the relationship between pathological stages (stage I, II, III, and IV) of various tumors and SOCS3 expression levels across TCGA data, including BLCA, BRCA, CESC, ESCA, THCA, KICH, LIHC, LUAD, MESO, and UCEC.
We used normal samples from the GTEx to investigate the expression of SOCS3 in the corresponding tumors. We found that the expression of SOCS3 in adrenocortical carcinoma (ACC), acute myeloid leukemia (LAML), ovarian serous cystadenocarcinoma (OV), testicular germ cell tumors (TGCT), thymoma (THYM), and uterine carcinosarcoma (UCS) was statistically significant compared with the corresponding normal tissues (Figure 3B). GEPIA2 and UALCAN databases were also employed to evaluate the correlations between SOCS3 expression and the pathological status of tumors, such as in BLCA, BRCA, Cervical and endocervical cancers (CESC), esophageal carcinoma (ESCA), thyroid carcinoma (THCA), KICH, LIHC, LUAD, mesothelioma (MESO) and UCEC (all p < 0.05, Figures 3C, D). It can be seen that the expression levels of SOCS3 in the cancers shown in Figures 3C, D predominantly decreased as the tumor pathological stage increased, consistent with the protein expression levels of SOCS3 in the corresponding cancers. Furthermore, compared with the expression profiles of cancer histological subtypes, there was a statistically significant difference in SOCS3 expression among BLCA, LUAD, THYM, UCEC, LIHC, MESO, TGCT, and THCA subtypes, and SOCS3 expression was higher in all histological subtypes compared with the corresponding normal adjacent tissues in BLCA, LUAD, THYM, and THCA (Figure 4; Table 1).
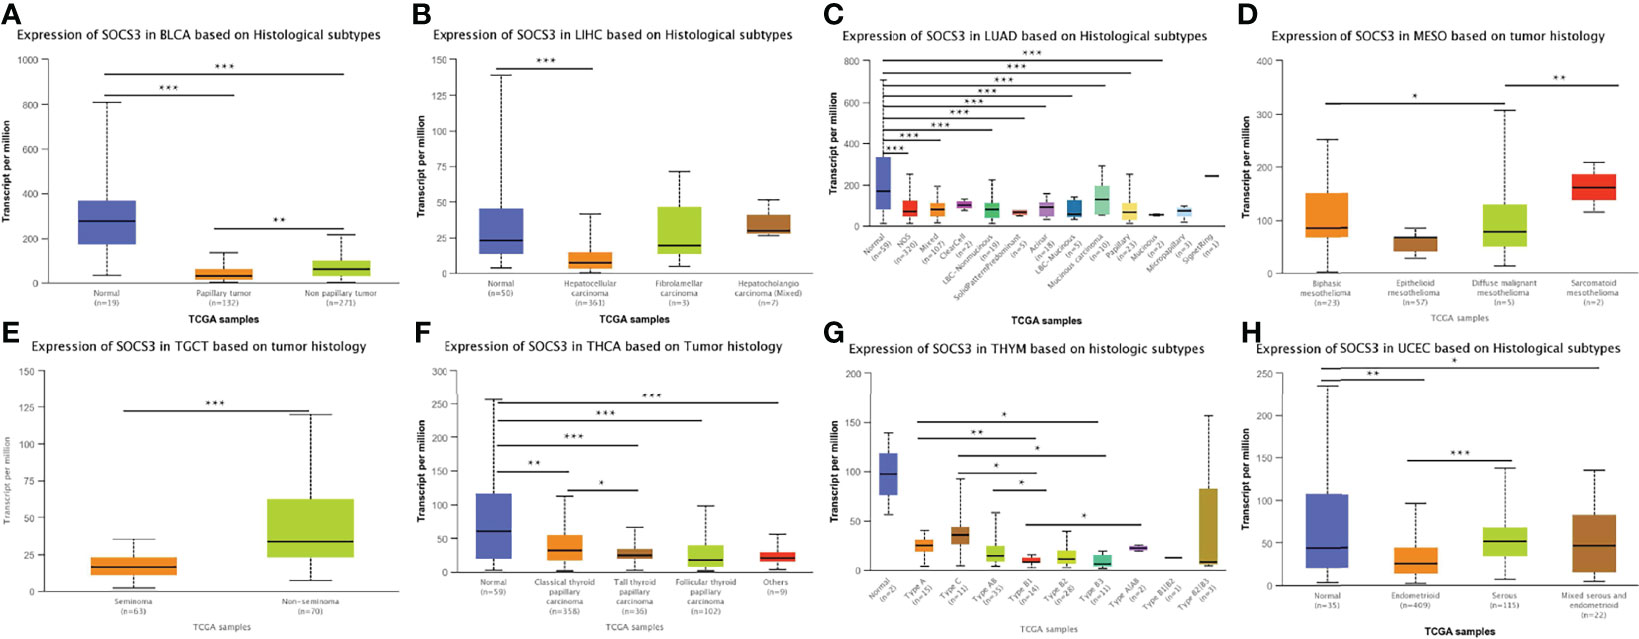
Figure 4 The correlations between SOCS3 expression levels and histological subtypes in disparate cancers. This figure investigated that the expression levels of SOCS3 based on histological subtypes in various cancers, such as BLCA, LUAD, THYM, UCEC, LIHC, MESO, TGCT, and THCA, and there was significant statistical significance among multiple groups of data. ***p < 0.001, **p < 0.01, *p < 0.05.
The protein expression levels of SOCS3 in cancer tissues and the corresponding normal samples (medium expression and low expression) were explored via the Human Protein Atlas database. We found that the staining of SOCS3 in the kidneys, ovaries, uterus, colon and rectum, and brain tumor specimens were higher than that in the normal tissues, which was consistent with the results of mRNA expression analysis, suggesting that high SOCS3 expression may be a risk factor for LGG, GBM, COAD, KIRC, OV, and UCS (Figure 5A). Finally, we investigated the genomic alterations of SOCS3 in 10,967 patients across TCGA Pan-Cancer Atlas Studies using the cBioPortal database. The incidence of genetic variations in SOCS3 was increased by up to 1.9% (Figure 5B), and amplification was the most common type of SOCS3 genetic alterations, followed by missense mutations, truncation mutations, and deep deletions. SOCS3 amplification occurred in several cancers, among which the most common type of cancers was breast invasive carcinoma, followed by ovarian serous cystadenocarcinoma, liver hepatocellular carcinoma, lung squamous cell carcinoma, and LGG. In addition, gene mutation often occurred in the uterine corpus endometrial carcinoma, skin cutaneous melanoma, and colorectal adenocarcinoma. These findings indicated that SOCS3 is an oncogenic protein involved in cancer progression, different cancer stages, and various tissue subtypes, and can be employed as a potential biomarker for tumor diagnosis and treatment.
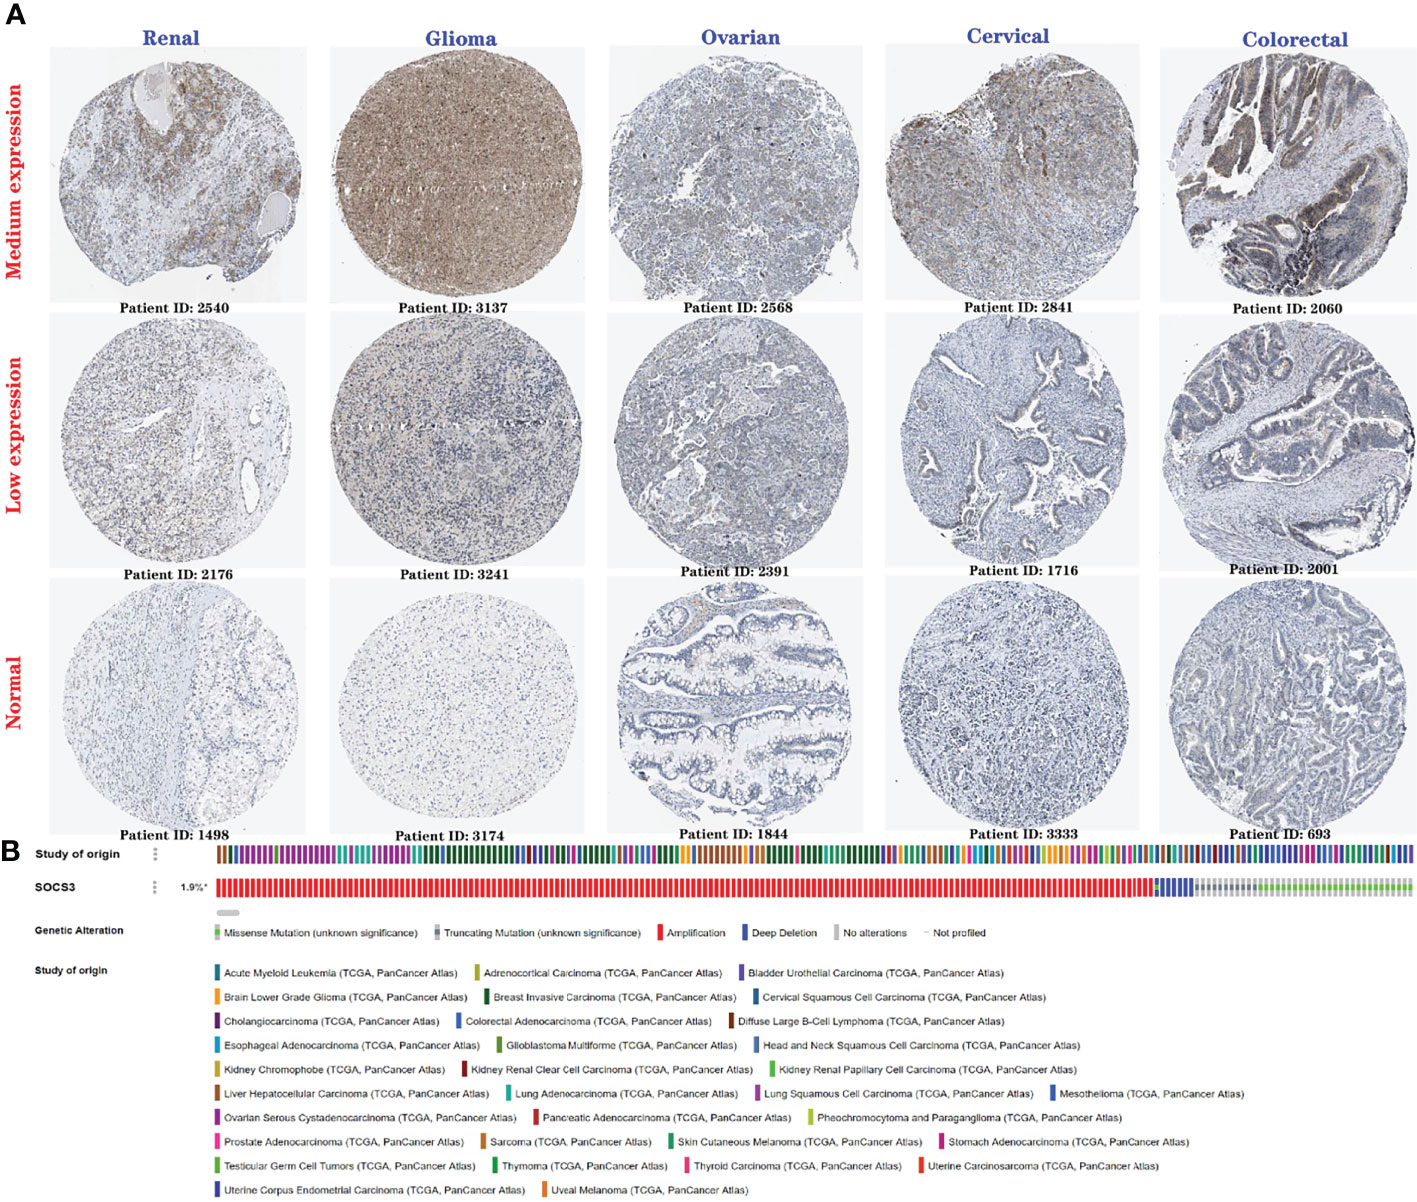
Figure 5 Protein expression level and genetic alteration of SOCS3 in various cancers. (A) The protein expression of SOCS3 in different cancers (low expression and medium expression) and normal tissues via Human Protein Atlas website. (B) Genetic variations of SOCS3 in disparate cancers across OncoPrint. *altered/profiled=209/10950.
To further explore the potential prognosis of SOCS3 in several types of cancer, GEPIA and Kaplan–Meier Plotter databases were used (32). Using GEPIA database, we observed that upregulation of SOCS3 expression was relevant to poor overall survival rate in GBM (p=0.03), KIRC (p=0.00013), LGG (p=2.8e−5), STAD (p=0.0067), and UVM (p=0.037), whereas BRCA (p=0.0077) patients with high SOCS3 expression had higher overall survival rate (Figure 6A). DFS analysis displayed the relationship between upregulation of SOCS3 expression levels and poor prognosis for TCGA cancer types, including ACC (p=0.049), GBM (p=0.012), LGG (p=0.0067), and STAD (p=0.041) (Figure 6C).
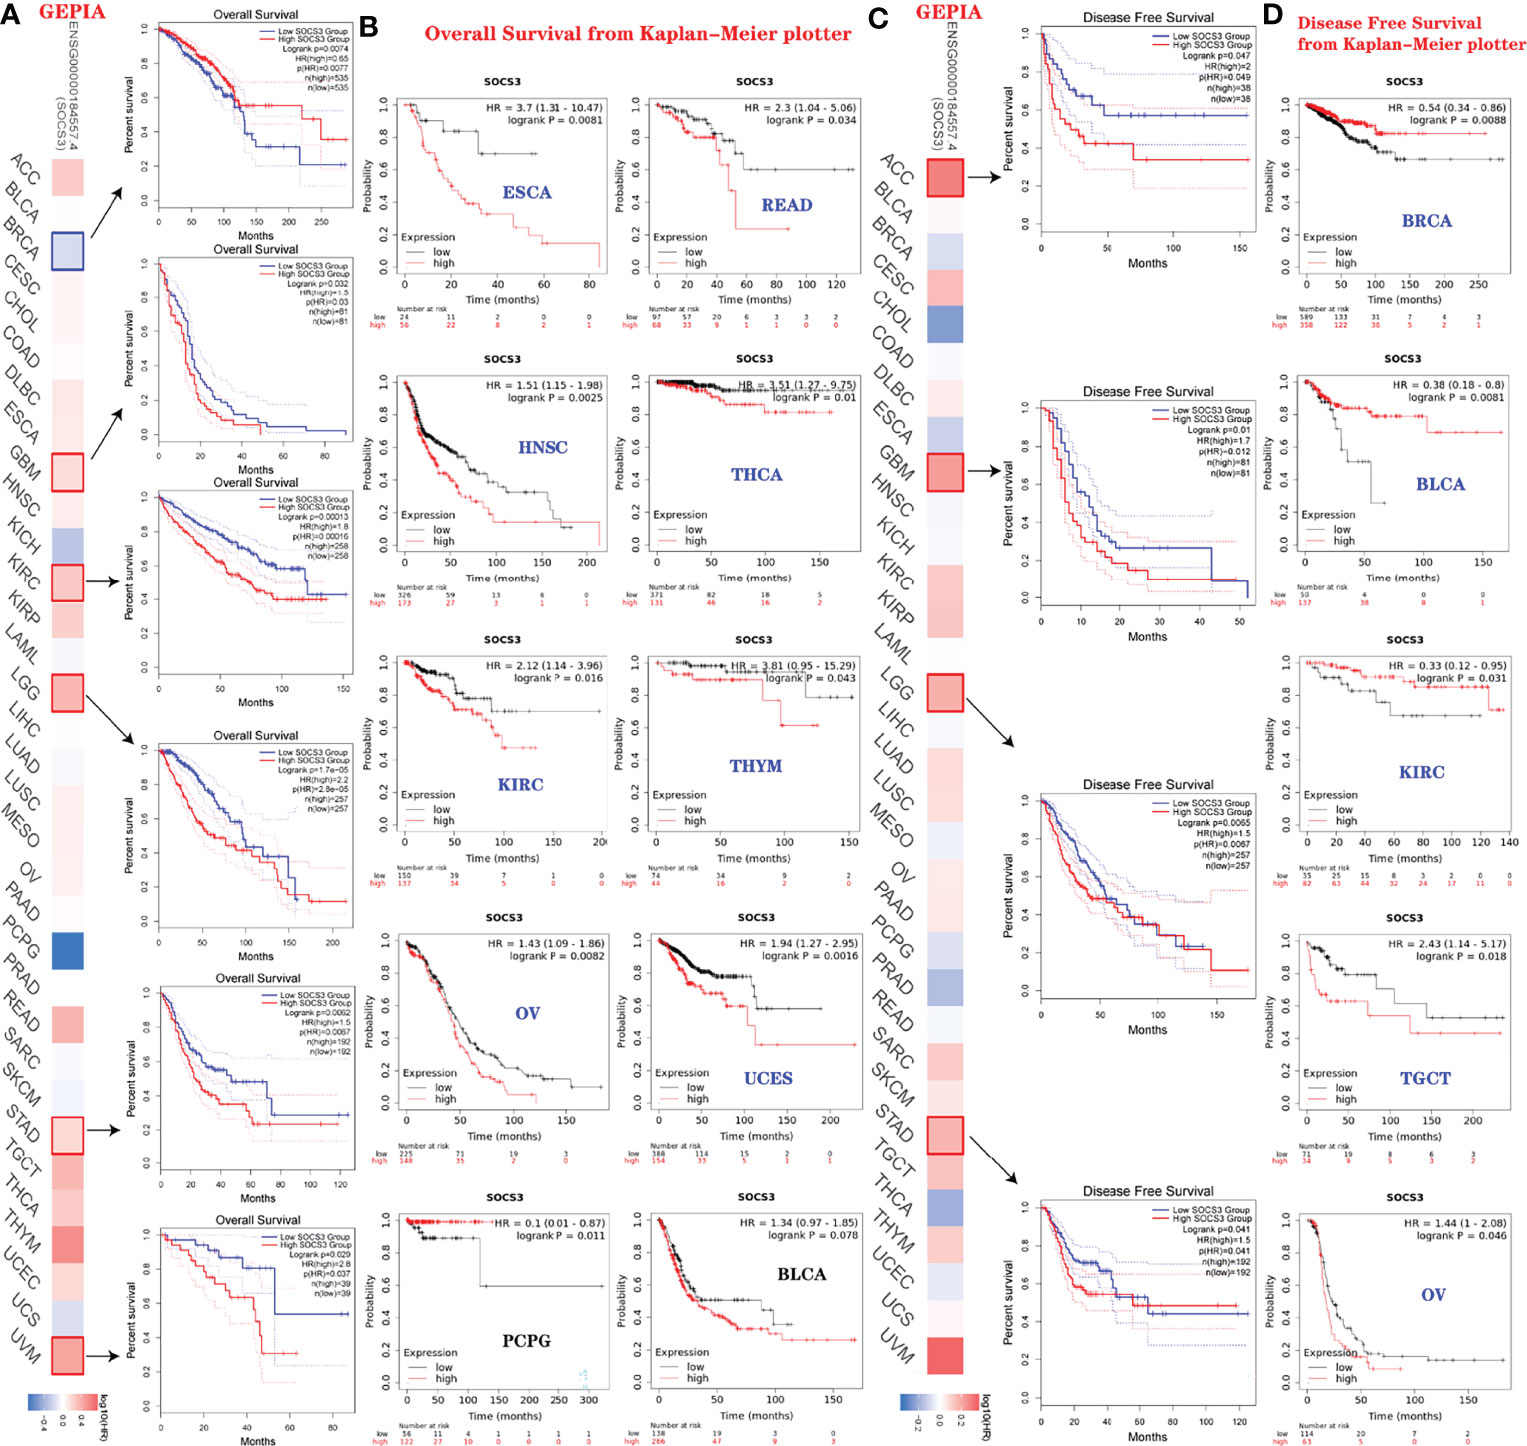
Figure 6 Relevance between SOCS3 expression status and survival prognosis of various tumors in TCGA. (A, C) Analysis of the relationship between overall survival, disease-free survival, and SOCS3 expression levels in different cancers via GEPIA2 website. (B, D) Same analysis using Kaplan–Meier database.
Moreover, the prognostic values of SOCS3 in different types of cancer were also assessed using Kaplan–Meier Plotter databases. Figures 6B, D indicated that high SOCS3 expression levels were associated with poor overall survival in ESCA (p=0.0081), READ (p=0.034), HNSC (p=0.0025), THCA (p=0.01), KIRC (p=0.016) THYM (p=0.043), OV (p=0.0082), and UCES (p=0.0016) (Figure 6B). In contrast, SOCS3 expression status was relevant to a positive DFS in BRCA (p=0.0088), BLCA (p=0.0081), and KIRC (p=0.031), which were opposed to TGCT (p=0.018) and OV (p=0.046) (Figure 6D). In addition, the expression of SOCS3 was relevant to AML, astrocytoma, glioma, breast cancer, colorectal cancer, ovarian cancer, and melanoma from the PrognoScan database (http://dna00.bio.kyutech.ac.jp/PrognoScan/index.html) (access date: November 15, 2021), which also indicated that SOCS3 expression in BRCA and BLCA was associated with a positive prognosis (Table 2).
In conclusion, we found that high SOCS3 expression was associated with a poor prognosis in the majority of different types of cancer, and upregulated expression was associated with a poorer OS and DFS based on analyses using several databases.
We assessed tumor immune infiltration from 39 TCGA cancers, and seven of these exhibited a notable positive relationship between SOCS3 expression levels and infiltration of six kinds of immune cells (B cells, CD8 + T cells, CD4 + T cells, DCs macrophages, and neutrophils), including CHOL, LGG, LIHC PAAD, PRAD, SKCM, and STAD. Tumor immunity infiltration of LGG, LIHC, PAAD, and PRAD were strongly correlated with SOCS3 expression (p<0.01), while GHOL, SKCM, SKC-metastasis, and STAD were relatively weakly correlated with infiltration of the six types of immune cells (p<0.05). No significant correlation (p>0.05) or negative correlation (r<0, p<0.05) was observed between all the other types of cancer and tumor immune infiltration of the six kinds of immune cells (Figure 7A).
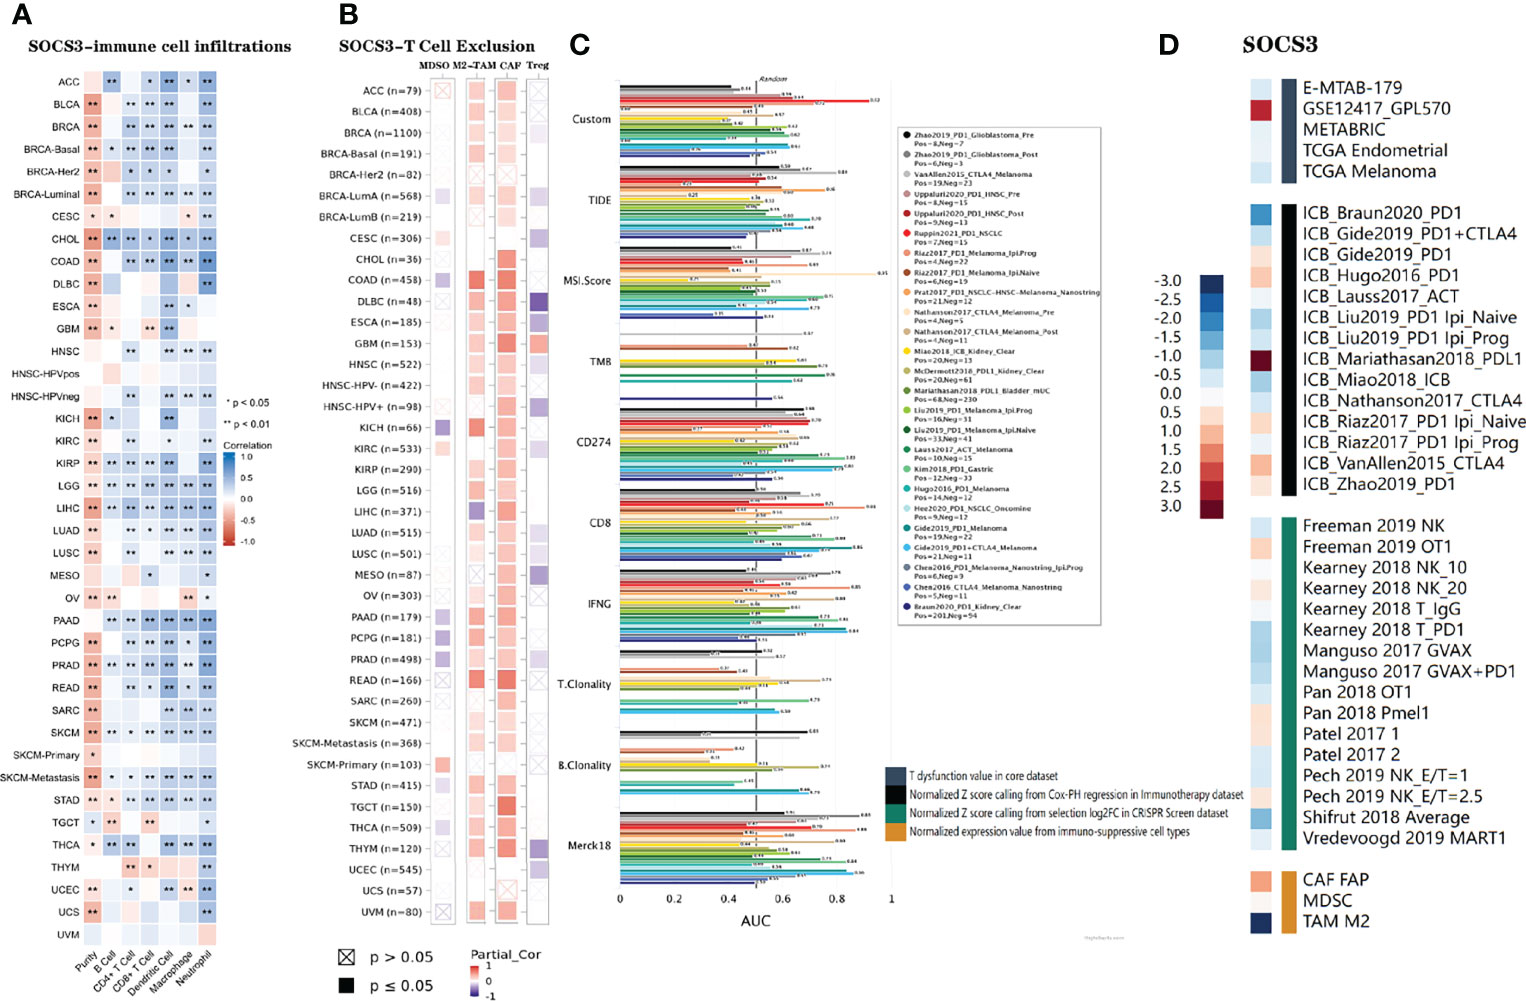
Figure 7 (A, B) Relevance between SOCS3 expression status and six immune infiltration cells and four immunosuppressive cells in different cancers. Purity-corrected partial Spearman’s rho values and statistical difference were employed to account for the relationship. (C) Correlations between SOCS3 and standardized tumor immune evasion markers in immune checkpoint blockade cohorts. The predictive abilities of the targets on the ICB response were assessed by AUC. (D) Correlations between SOCS3 and lymphocyte-mediated tumor killing in T dysfunction, immunotherapy, CRISPR screen, and immune-suppressive cell types. MDSCs, myeloid-derived suppressor cells; M2-TAMs, M2 subtype of tumor-associated macrophages; CAFs, cancer-associated fibroblasts; Tregs, regulatory T cell. **p < 0.01, *p < 0.05.
Four types of immunosuppressive cells promoting T-cell exclusion, including MDSCs, CAFs, M2-TAMS, and Treg cells, were used to predict associations with SOCS3 expression. We discovered that the expression of SOCS3 was positively relevant to tumor infiltration of MSDCs in CESC, KIRC, and SKCM-Primary, whereas it was negatively correlated with BRCA-LumA, COAD, KICH PAAD, PCPG, PRAD, STAD, and THCA. Tumor infiltration of M2-TAMs occurred in ACC, BLCA, BRCA, COAD, DLBC, ESCA, GBM, HNSC, KICH, KIRP, LGG, LUAD, LUSC, OV, PAAD, PCPG, PRAD, PEAD, SKCM, STAD, TGCT, THYM, and UVM; tumor infiltration of Tregs occurred in DLBC, GBM, CESC, ESCA, HNSC, MESO, PRAD, THYM, and UCEC; and tumor infiltration of CAFs occurred in almost all of the 40 TCGA types and subtypes, except CESC, UCEC, BRCA-Her2, UCS, and SKCM-Primary (Figure 7B).
We predicted the biomarker association between SOCS3 with standardized biomarkers according to the response results and OS of the ICB groups. We observed that SOCS3 contained an area under the receiver operating characteristic curve (AUC) of >0.5 in 12 of the 25 ICB groups. The predicted value of SOCS3 was higher than that of TMB, T.Clonality, and B.Clonality that had AUC values of >0.5 in eight, nine, and seven ICB sub-cohorts. However, SOCS3 had a lower predictive value than TIDE, MIS.Score, CD274, CD8, IFNG, and Merck 18 (Figure 7C).
The TIDE database also indicated that high SOCS3 expression was related to unfavorable programmed death 1 protein (PD1) therapeutic consequences in melanoma (ICB_Gide2019_PD1), melanoma (ICB_Hugo2016_PD1), melanoma (ICB_Riza2017_PD1) and glioblastoma (ICB_Zhao2019_PD1), PD-ligand 1 (L1) therapeutic consequences in bladder urothelial carcinoma (ICB_Mariathasan2018_PD-L1), and CTLA4 in melanoma (ICB_VanAllen2015_CTLA4), whereas it was associated with positive therapeutic outcomes in kidney renal clear cell carcinoma (ICB_Braun2020_PD1), kidney renal clear cell carcinoma (ICB_Braun2020_PD1), melanoma (ICB_Nathanson2017_CTLA4), and melanoma (ICB_Lauss2017_ACT). Gene knockout phenotype analysis of CRISPR screening indicated that SOCS3-knockout was a significant influencing factor of lymphocyte-mediated tumor killing in B16 melanoma (Freeman_2019_NK) and MC38 colon cancer (Kearney2018_T_PD1) models. Furthermore, upregulation of SOCS3 expression levels was relevant to T dysfunction in leukemia (GSE12417_GPL570) (Figure 7D).
The UALCAN website was used to explore the DNA methylation levels of SOCS3 in various cancers. In various types of cancer, it reminded hypomethylated, such as in BLCA, BRCA, COAD, HNSC, KIRP, LIHC, LUAD, LUSC, PRAD, READ, THCA, and UCEC (Figure 8A). These results strongly suggested that SOCS3 methylation is negatively associated with its mRNA expression levels in different types of tumors. Studies have shown that after methylation of CpG islands in the SOCS3 promoter region, SOCS3 gene silencing, and mRNA expression decreased, which was predictive of adverse clinical outcomes and prognosis, such as GBM (33–35). To further investigate the influence of promoter methylation level of SOCS3 in different types of cancer, the TIDE website was used, and it was shown that hypermethylation of SOCS3 was negatively related to dysfunctional T-cell phenotypes (Figure 8B) and longer survival durations of patients with colorectal, melanoma, uveal, and kidney cancers (Figure 8C) Thus, the methylation status of SOCS3 in several types of cancer may be related to dysfunctional T-cell phenotypes through several mechanisms and may be predictive of a less favorable prognosis in colorectal carcinoma, melanoma, uveal melanoma, and kidney cancer.
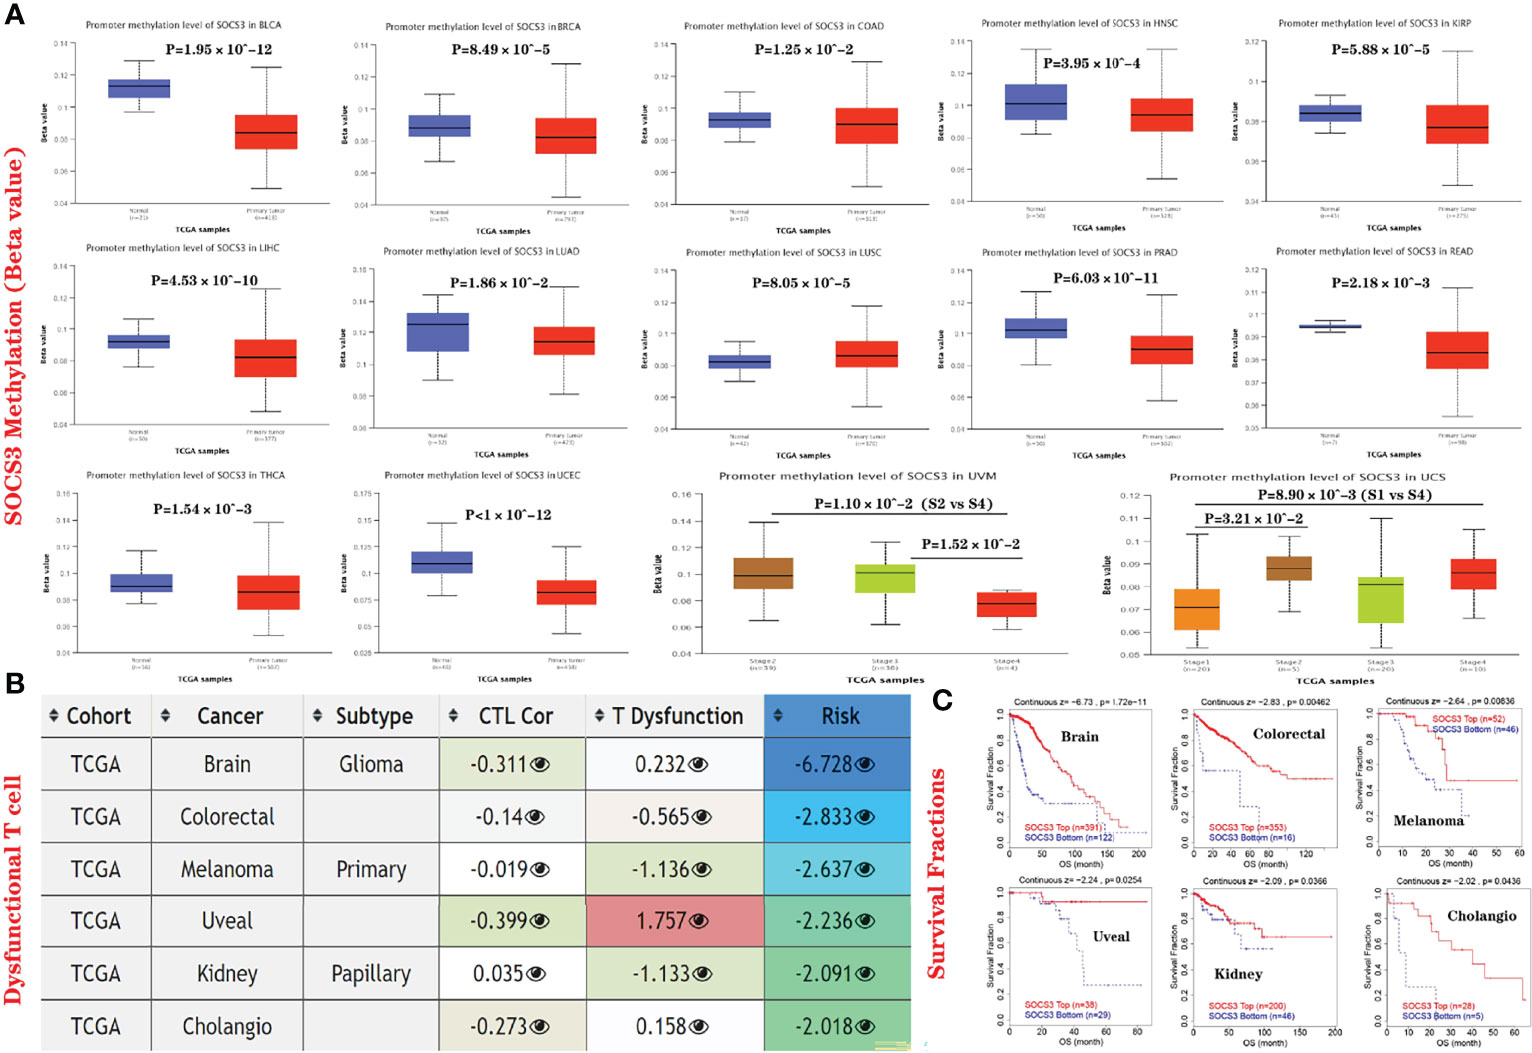
Figure 8 Epigenetic modifications of SOCS3 are related to dysfunctional T-cell phenotypes and poor outcomes in various cancers. (A) UALCAN database was employed to investigate the SOCS3 methylation levels (beta values) in various tumors via TCGA dataset, such as BLCA, BRCA, COAD, HNSC, KIRP, LIHC, LUAD, LUSC, PRAD, READ, THCA, UCEC, UVM, and UCS. (B) Correlations between SOCS3 methylation and cytotoxic T-cell levels (CTLs), dysfunctional T-cell phenotypes, and risk factors in TCGA cancers. (C) Effect of SOCS3 methylation levels on overall survival in TCGA cancer cohorts. We only indicated statistically significant cancers.
We used the cBioPortal database to compare the types and frequencies of genetic changes in the SOCS3 gene in the different types of cancer. SOCS3 gene amplification and mutations were the main types of alterations observed. However, deep deletions and duplication alterations were rare (Figure 9A). Figure 9E shows the sites, types, and case numbers of SOCS3 genetic mutations, and we observed that missense mutation of SOCS3 was the most common type of alteration, followed by truncation mutations. These changes could have significant influences on a patients’ OS, DFS, and progression-free survival (Figure 9B). The Oncomine website was employed to analyze the genes associated with SOCS3 in the cancer cohorts. SOCS3 expression was highly correlated with several genes, including TK1, BIRCS, AFMID, SYNGR2, TMC8, and TMC6 (r≥0.99) (Figure 9C). As for these SOCS3-related genes, we found that they were associated with tumor progression and their expression was increased during tumorigenesis. For example, the mRNA and protein levels of TK1 in liver tissues and the serum of patients with liver cancer were significantly increased, while the TK1 target gene knockdown had significant anti-apoptotic and proliferative effects on HepG2 cells (36). Interestingly, these gene alterations were similar to those of SOCS3 (Figures 9D–F), suggesting that these genes are functional partners associated with carcinogenic effects of SOCS3 in tumors. Gene enrichment analysis was employed to explore the biological processes modulated by these genes (Figures 9G, H). GO pathway showed that this group of genes primarily regulated the STAT cascade, JAK/STAT cascade, and peptidyl-tyrosine phosphorylation, and KEGG enrichment analysis included cytokine-cytokine receptor interaction, JAK/STAT, and PI3K/Akt signaling pathways (Table 3). Together, the carcinogenic effects of SOCS3 were related to the regulation of PGS1, BIRC5, TK1, AFMID, and, other genes associated with the development of cancer.
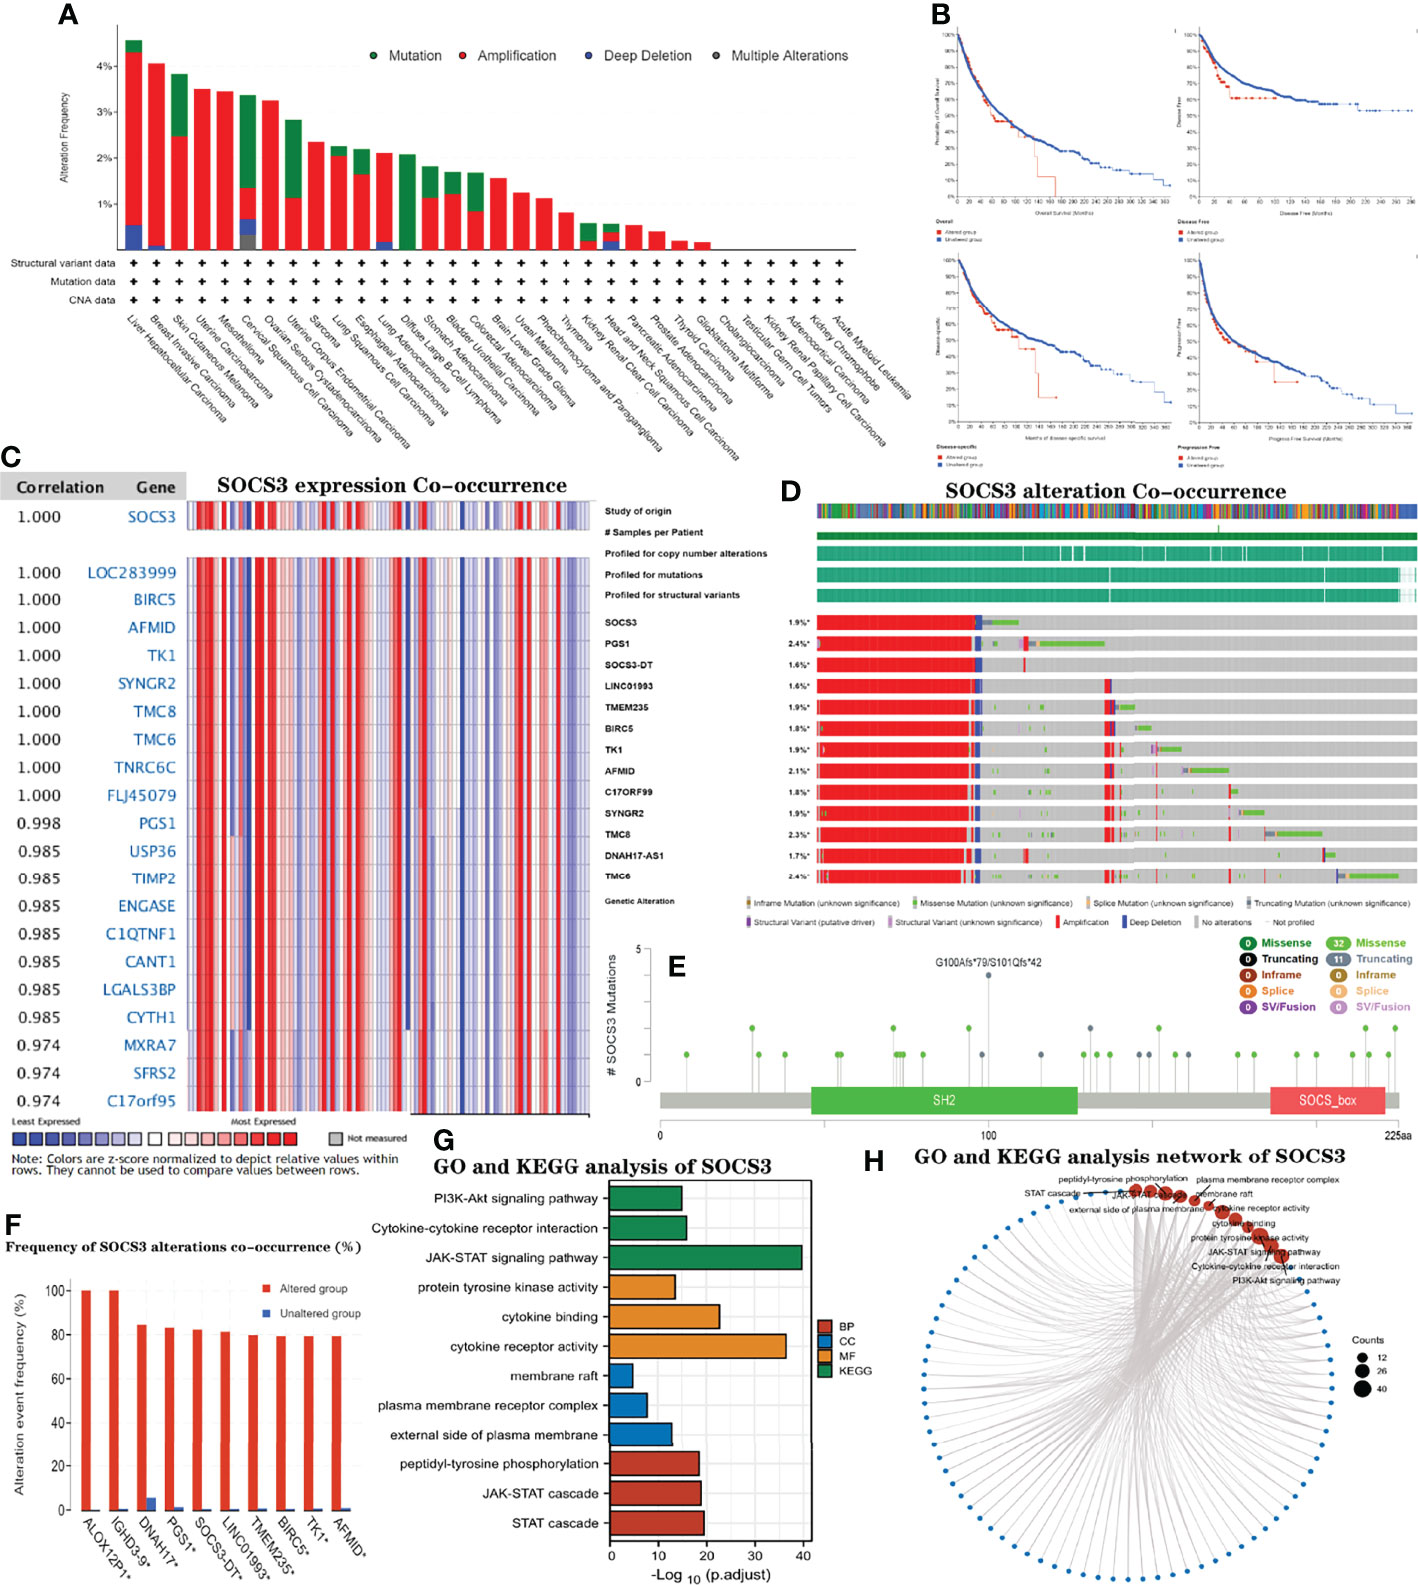
Figure 9 Genetic diversities and oncogenic characteristics of SOCS3 co-occurrence with dysregulation of its functional chaperone and may predict poor prognosis of cancers. The mutation features of SOCS3 in TCGA cancers were explored via cBioPortal database, (A) displayed the mutation frequency and (E) showed the mutation site. (B) Kaplan–Meier curves of the influence of SOCS3 alterations on OS, DSS and PFS. (C) Heatmap indicated SOCS3 overexpression co-occurrence via Oncomine database. Spearman’s rho value and estimated statistical significance were employed to reflect the degree of relevance between these genes. (D) Displayed SOCS3 alteration co-occurrence genes, including PGS1, SOCS3-DT, LINC01993, TMEM235, BIRC5, TK1, AFMID, C17ORF99, SYNGR2, TMC8, DNAH17-AS1, and TMC6. (F) Frequencies of ALOX12P1, IGHD3-9, DNAH17, PGS1, SOCS3-DT, LINC01993, TMEM235, BIRC5, TK1, and AFMID alteration co-occurrence with SOCS3 alterations. (G, H) Co-occurrence GO and KEGG enrichment analysis of SOCS3 in different cancers.
Next, to explore the molecular mechanism in which SOCS3 participated in to promote the tumorigenesis of various tumors, we used the STRING dataset to construct a PPI network for SOCS3 (Figure 10A). The interaction network contained 50 SOCS3-binding proteins. Next, the GEPIA2 was used to acquire the top 100 genes associated with SOCS3 expression across the types of cancer assessed. Specifically, we selected six genes with the highest correlation with SOCS3 expression, including ZFP36 ring finger protein (ZFP36) (r=0.66), JunB proto-oncogene, AP-1 transcription factor subunit (JUNB) (r=0.54), cysteine and serine-rich nuclear protein 1 (CSRNP1) (r=0.52), dual specificity phosphatase 1 (DUSP1) (r=0.47), nuclear factor, interleukin 3 regulated (NFIL3) (r=0.46) and Fos proto-oncogene, AP-1 transcription factor subunit (FOS) (r=0.45) genes (all p<0.001), and we found that these genes were positively associated with SOCS3 (Figures 10B, C). Additionally, as can be seen from Figure 10B, these genes were also positively related to majority of cancer types. Finally, we took the intersection of the two groups of genes and found four common genes: the snail family transcriptional repressor 1 (SNAI1), signal transducer and activator of transcription 3 (STAT3), NFKB inhibitor α (NFKBIA), and BCL10 immune signaling adaptor (BCL10) (Figure 10D).
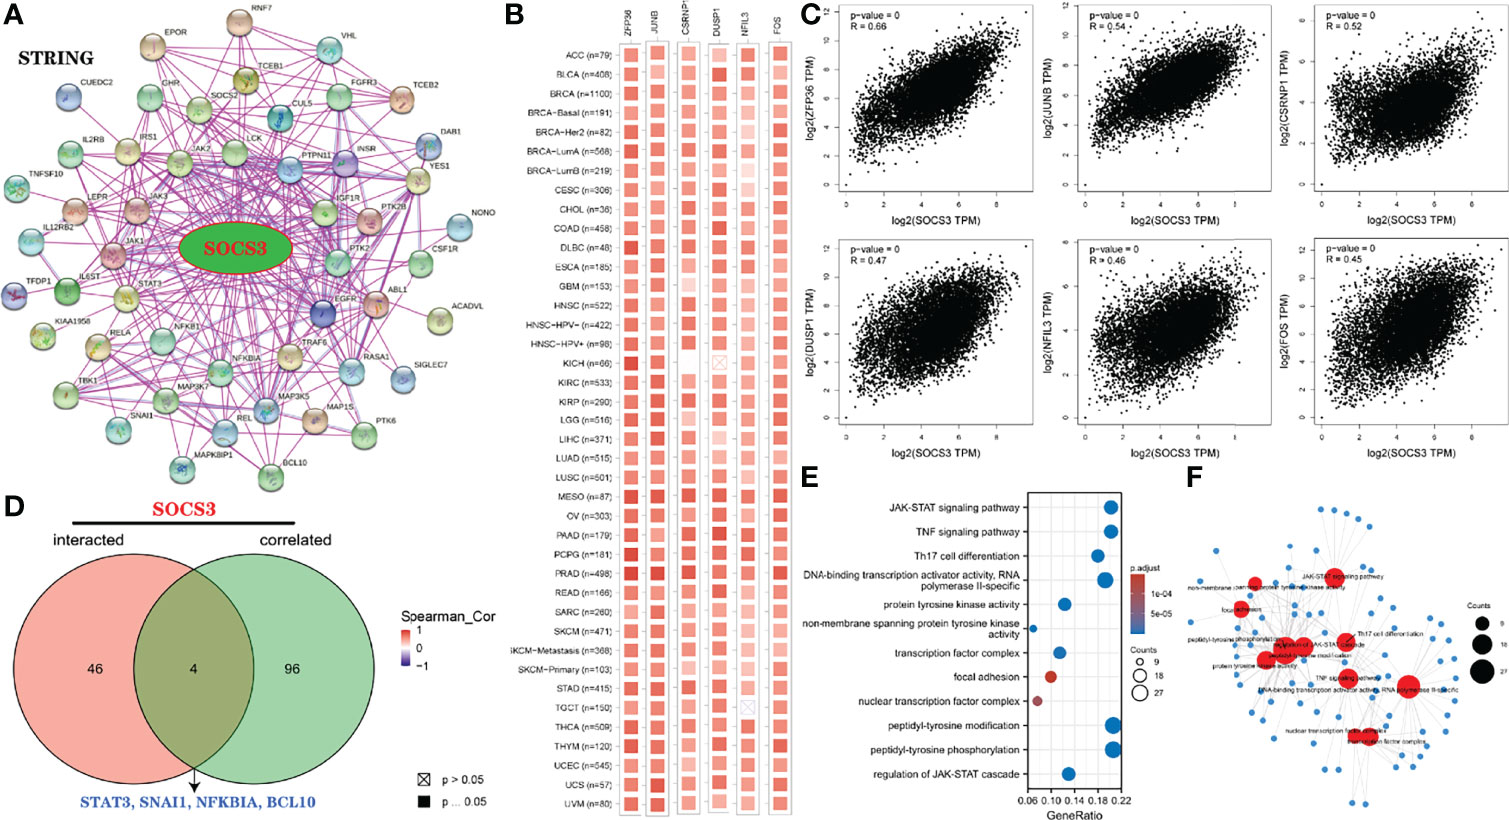
Figure 10 Enrichment analysis of SOCS3-related genes. (A) SOCS3-binding proteins via STRING dataset. (B, C) One hundred genes related to SOCS3 were obtained via GEPIA2 database, and 6 genes most related to SOCS3 were specifically analyzed, including ZFP36, JUNB, CSRNP1, DUSP1, NFIL3, and FOS. Then, the heatmap corresponding to these genes were analyzed in detail. (D) Intersection genes of SOCS3-binding and correlated genes. (E, F) GO and KEGG analysis based on SOCS3-binding genes and interacted genes.
Furthermore, GO and KEGG analysis were performed using these two groups to explore the effect of SOCS3 on cancer pathogenesis. As shown in Figures 10E, F, SOCS3 and their co-operators were significantly related to the JAK/STAT and TNF signaling pathways, Th17 cell differentiation, DNA-binding transcription activator activity, RNA polymerase II-specific, peptidyl-tyrosine phosphorylation, regulation of JAK/STAT cascade, protein tyrosine kinase activity, transcription factor complex, and peptidyl-tyrosine modification, among others.
We used the ROC plotter website to investigate the effects of SOCS3 expression on chemotherapy response in various types of cancer. We found that breast and ovarian cancer patients with high expression levels of SOCS3 were resistant to chemotherapy; however, GBM and colorectal cancer patients with high expression levels of SOCS3 were more sensitive to chemotherapy than patients with low SOCS3 expression (Figure 11A). Furthermore, using the TIDE website, it was determined that patients with downregulated expression levels of SOCS3 had a higher overall survival rate after ICB (PD-1 or PD-L1) treatment among kidney cancer, melanoma, and bladder cancer patients. It is worth mentioning that SOCS3 expression levels were negatively relevant to CTL in glioblastoma patients, which indicated an interaction with T-cell exclusion. For breast cancer and leukemia patients with T-cell dysfunction, the cohort with high SOCS3 expression possessed a higher survival time (Figures 11B, C).
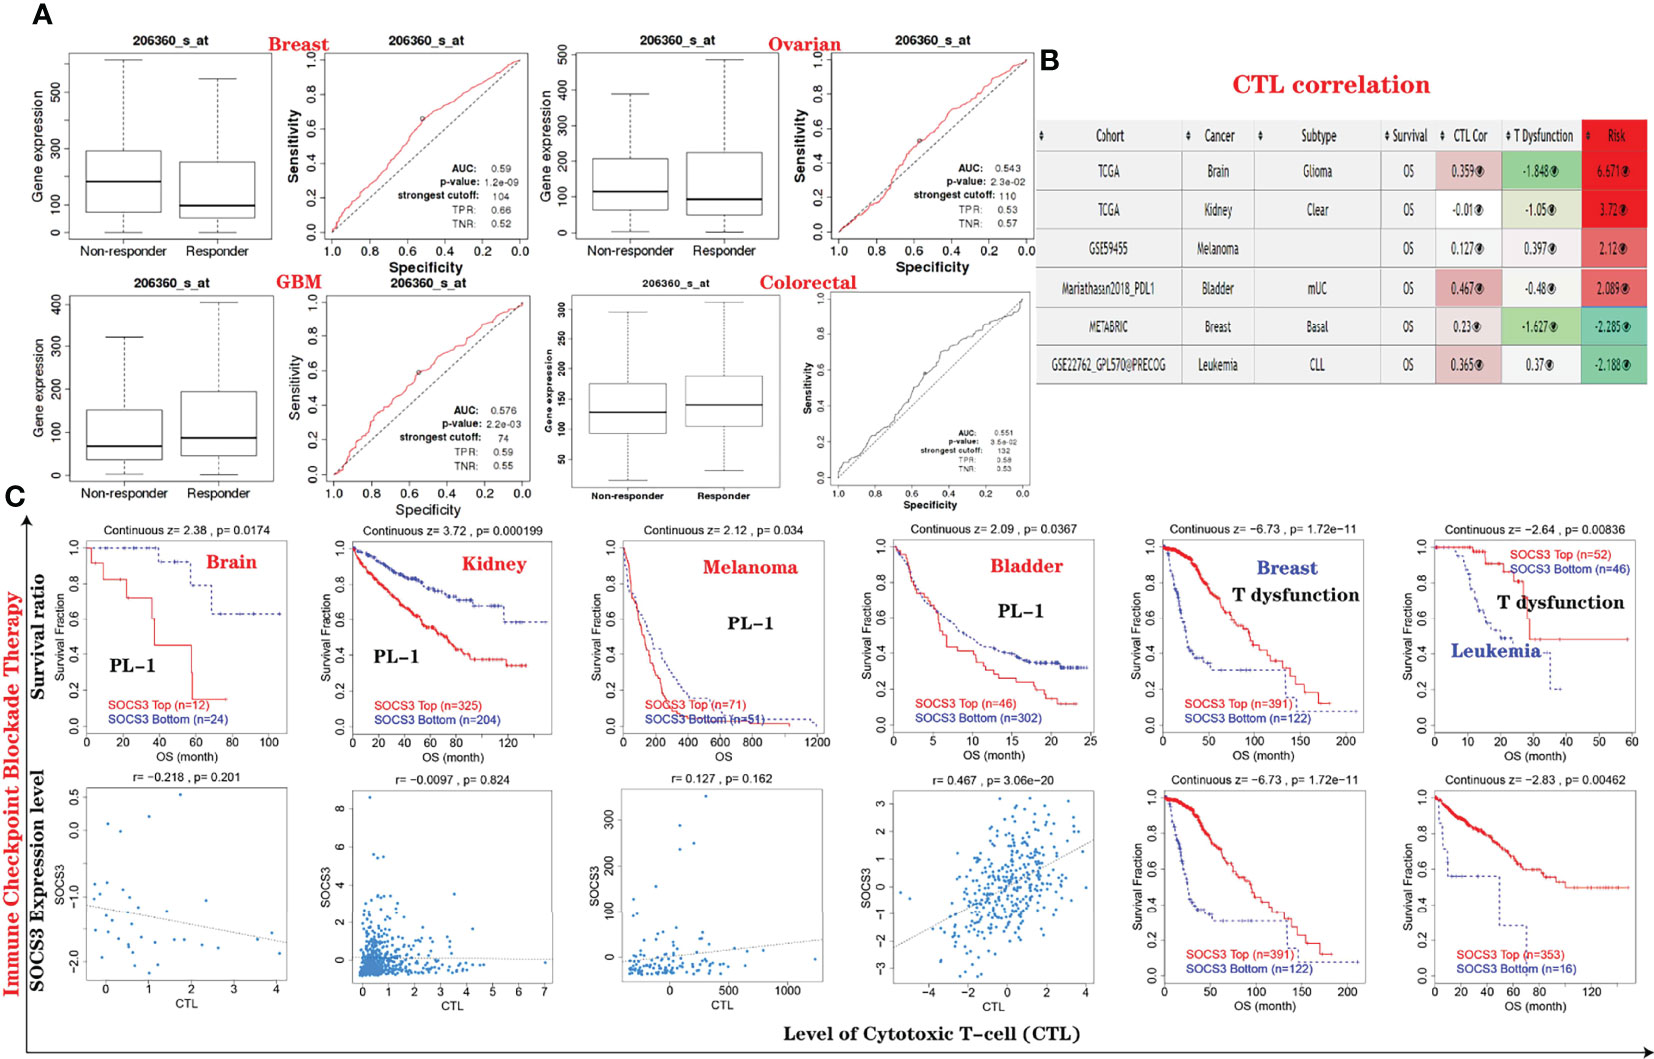
Figure 11 SOCS3 expression is relevant to the treatment of disparate cancers. (A) Relationship between SOCS3 expression and responses to chemotherapy in breast, ovarian, brain and colorectal cancers, which is displayed via ROC curve plot. (B, C) Employed TIDE database to indicate the correlations between immunotherapeutic response (ICB) and cytotoxic T-cell level (CTL) and SOCS3 expression levels in TCGA cancers using Kaplan–Meier curves. Only cancers with statistically significant differences were listed.
Immunohistochemistry (IHC) was used to assess 30 HGG patients’ tissues (11 GBM) and 32 LGG patients’ samples (Figure 12). We observed SOCS3 expression in tissue specimens using low-power field (200×) and high-power field (400×), respectively, and the results indicated that SOCS3 expression was significantly increased in the HGG tissues compared to the LGG samples, consistent with the results of the bioinformatics analysis (Figure 12) (Supplementary Table S1).
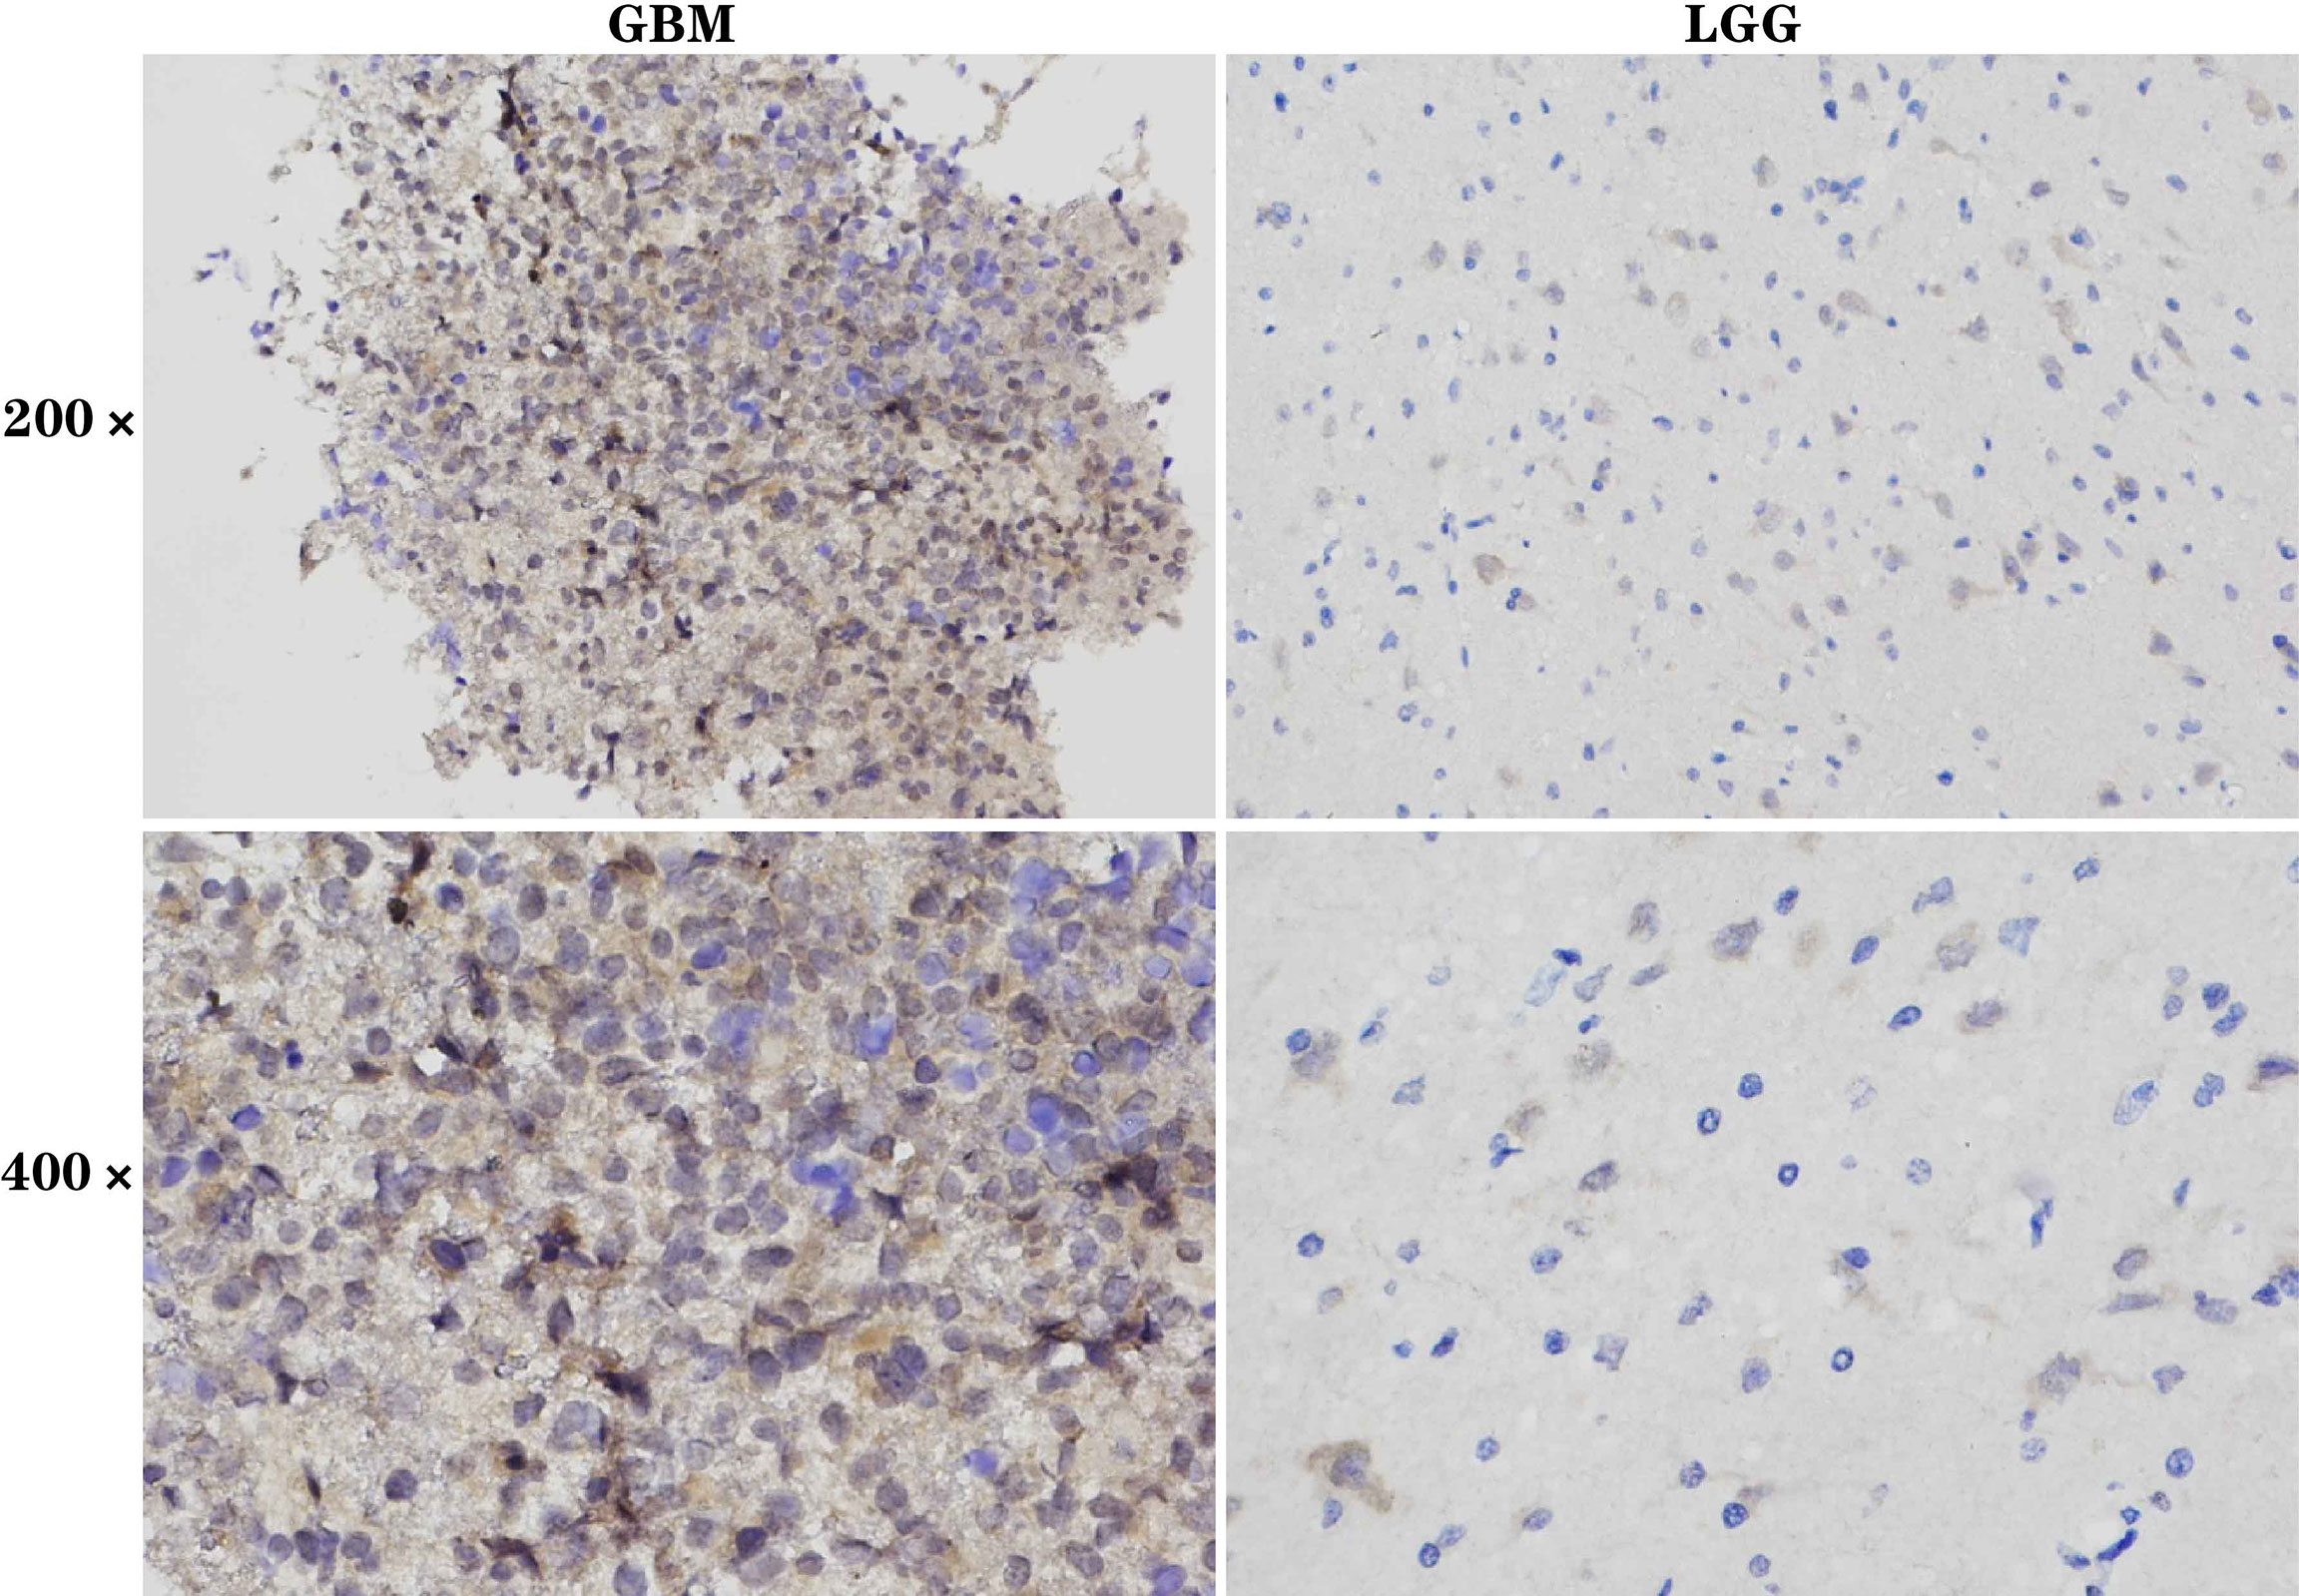
Figure 12 The experimental validation of SOCS3 by IHC. Expression of SOCS3 in GBM and LGG tissues is shown at 200× and 400× magnification, respectively. It is found that SOCS3 is highly expressed in GBM and low expressed in LGG.
The results of this study indicated that SOCS3 was strongly associated with the occurrence and development of different types of cancer. Several studies have also found that SOCS3 is closely related to various types of cancer (10, 37–39). Whether SOCS3 exerts a role in the pathogenesis and therapeutic response of the different types of cancer via common molecular pathways remains to be determined. In this study, we revealed the relationship between SOCS3 expression and genetic alterations with the survival status, tumor microenvironment, tumor cell and immune cell invasion, the related molecular pathways, the therapeutic responses, and the prognosis in 39 different types of cancer based on data obtained from TCGA.
Phenotypic and functional heterogeneity can occur between different types of tumors and between cancer cells within the same tumor due to alterations in the genetics, the environment, and the cellular characteristics (40). The differences in protein expression may provide a reference for the diagnosis, therapy, and prognosis of tumors (41). We explored the carcinogenic role of SOCS3 in several types of cancer through mRNA and protein expression level analysis and found that SOCS3 was upregulated or downregulated in almost all tumor types, and in a variety of tumors, its expression was related with the tumor stage and/or histological subtype, such as BLCA, THCA, and MESO. These results indicate that SOCS3 is relevant to the occurrence and development of several types of cancer and maybe an underlying target for the diagnosis and therapy of different kinds of cancers. However, survival prognostic analysis showed that abnormal SOCS3 expression was varied among the different tumors. For example, GBM patients with high expression of SOCS3 has a poorer OS, while KIRC patients exhibited the opposite result, and these results were consistent with previous in vivo and in vitro studies (13, 42).
The results of the present study showed that the difference in SOCS3 expression was not statistically significant in several types of tumors, including CESC, CHOL, COAD, DLBC, KICH, KIRP, LAML, LIHC, LUAD, LUSC, MESO, PAAD, PRAD, PEAD, SARC, SKCM, UCS, and UVM, which suggests that SOCS3 expression was not relevant to the signaling imbalance in these tumors. However, genetic alterations in SOCS3 may disrupt the immune micro-environment and affect the prognosis of patients.
Tumor immune microenvironment and immune evasion are relevant to therapeutic and prognostic responses in cancer (43). Tumor invasion of immune cells can promote tumor development and result in a dysfunctional T-cell phenotype (44, 45). Our research showed that the expression of SOCS3 was relevant to immune infiltration in seven kinds of cancer, including CHOL, LGG, LIHC, PAAD, PRAD, SKCM, and STAD. In addition, Tregs, MDSCs, CAFs, and M2-TAMS are the main mechanisms of T-cell exclusion (46). Our research found that SOCS3 expression is relevant to tumor-promoting immune cells of almost all types of cancer; therefore, T-cell exclusion may be a primary mechanism of tumor immune cell infiltration. Our research also found that SOCS3 methylation levels were negatively associated with mRNA expression in various tumors.
We explored alterations in frequency and types of SOCS3 in different types of cancer and found that SOCS3 gene amplification and mutation were the most common alterations, among which missense mutation was the most common mutation type. These results suggest that cancer progression may be driven by genetic changes and the accumulation of alterations in gene expression patterns (47). Alterations in SOCS3 gene expression profiles may be associated with a poorer prognosis in the majority of cancers. This oncogenic effect cannot be attributed to a single genetic change but may instead be the result of a combination of multiple related genes. We found that several genes were highly correlated with SOCS3 expression and may play similar pathogenic roles, such as TK1, BIRSC, TMC8, and AFMID (48). These consequences reveal that the carcinogenic influence of SOCS3 may be caused by the interaction of multiple functional partners. Furthermore, we performed enrichment analysis of SOCS3 and its functional partners to explore the possible pathogenic mechanism of SOCS3 and found that the JAK/STAT and other signaling pathways were involved in the SOCS3-mediated tumor progression, consistent with existing research results (37, 49, 50). However, some biological functions require further experiments to elucidate the relevance of such as the correlation between SOCS3 and peptidyl-tyrosine phosphorylation.
Our research indicated that ovarian and breast cancer patients with high SOCS3 expression levels were resistant to chemotherapy; however, GBM and colorectal cancer patients were more sensitive to chemotherapy. Anti-PD-1 or PD-L1 antibodies can efficaciously remedy a variety of cancers (51), and the results of the present study showed that certain patients with low SOCS3 expression achieved better prognoses after ICB (PD-1 or PD-L1) treatment, such as in patients with kidney cancer, melanoma, and bladder cancer. The SOCS3 expression level was negatively correlated with CTL in some tumor patients, suggesting interactions with T-cell exclusion. Together, the results show that SOCS3 is an immuno-oncogenic molecule that may serve as a marker for tumor diagnosis, treatment, and prognosis, and thus, further experimental validation to ascertain its value is justified.
In conclusion, our research indicates that SOCS3 was valuable for diagnosis, staging, histological subtyping, prognosis, and therapeutic response of several types of cancer in the context of immuno-oncology through different mechanisms, and those genetic or epigenetic alterations in the SOCS3 genes were often predictive of a poor prognosis. Alterations in SOCS3 expression and tumor cell immune infiltration were also predicted by the presence of immunosuppressive cells (MDSCs, CAFs, M2-TAMS, and Treg), which promote T-cell exclusion. Furthermore, we found that the methylation status of SOCS3 was relevant to dysfunctional T-cell phenotypes and a poor prognosis in cancer. The carcinogenic characteristics of SOCS3 are also closely related to multiple functional partner genes and various biological functions. SOCS3 expression was also shown to have certain effects on the response to chemotherapy and immunotherapy in several types of cancer, and additional experiments are required to further elucidate the mechanisms involved. In summary, SOCS3 may be a potential marker for diagnosis, therapy, prognosis, and follow-up in several types of cancer.
The datasets presented in this study can be found in online repositories. The names of the repository/repositories and accession number(s) can be found in the article/Supplementary Material.
The studies involving human participants were reviewed and approved by Ethics Review Committee of the Fifth Affiliated Hospital of Zhengzhou University. The patients/participants provided their written informed consent to participate in this study.
LD wrote the manuscript. YT, ZS, WL, WH, SZ, ZX, and XG revised it critically for important intellectual content and gave important advice. XW provided the overall idea of the article and revised the original manuscript. All authors read and approved the manuscript and agree to be accountable for all aspects of the research in ensuring that the accuracy or integrity of any part of the work are appropriately investigated and resolved.
The present study was supported by grants from the National Natural Science Foundation of China (grant nos. 81972361 and 81874068) and Medical Science and Technology Project of Henan Province (grant nos. LHGJ20210487 and 222102310039).
The authors declare that the research was conducted in the absence of any commercial or financial relationships that could be construed as a potential conflict of interest.
The handling editor YZ declared a shared parent affiliation with the authors at the time of review.
All claims expressed in this article are solely those of the authors and do not necessarily represent those of their affiliated organizations, or those of the publisher, the editors and the reviewers. Any product that may be evaluated in this article, or claim that may be made by its manufacturer, is not guaranteed or endorsed by the publisher.
The Supplementary Material for this article can be found online at: https://www.frontiersin.org/articles/10.3389/fonc.2022.881801/full#supplementary-material
1. Sung H, Ferlay J, Siegel R, Laversanne M, Soerjomataram I, Jemal A, et al. Global Cancer Statistics 2020: GLOBOCAN Estimates of Incidence and Mortality Worldwide for 36 Cancers in 185 Countries. CA Cancer J Clin (2021) 71(3):209–49. doi: 10.3322/caac.21660
2. Dawson MA, Kouzarides T. Cancer Epigenetics: From Mechanism to Therapy. Cell (2012) 150(1):12–27. doi: 10.1016/j.cell.2012.06.013
3. Sadikovic B, Al-Romaih K, Squire J, Zielenska M. Cause and Consequences of Genetic and Epigenetic Alterations in Human Cancer. Curr Genomics (2008) 9(6):394–408. doi: 10.2174/138920208785699580
5. Hao X, Sun G, Zhang Y, Kong X, Rong D, Song J, et al. Targeting Immune Cells in the Tumor Microenvironment of HCC: New Opportunities and Challenges. Front Cell Dev Biol (2021) 9. doi: 10.3389/fcell.2021.775462
6. Zhou J, Nefedova Y, Lei A, Gabrilovich D. Neutrophils and PMN-MDSC: Their Biological Role and Interaction With Stromal Cells. Semin Immunol (2018) 35:19–28. doi: 10.1016/j.smim.2017.12.004
7. Monteran L, Erez N. The Dark Side of Fibroblasts: Cancer-Associated Fibroblasts as Mediators of Immunosuppression in the Tumor Microenvironment. Front Immunol (2019) 10:1835. doi: 10.3389/fimmu.2019.01835
8. Wargo JA, Reddy SM, Reuben A, Sharma P. Monitoring Immune Responses in the Tumor Microenvironment. Curr Opin Immunol (2016) 41:23–31. doi: 10.1016/j.coi.2016.05.006
9. Baker BJ, Akhtar LN, Benveniste EN. SOCS1 and SOCS3 in the Control of CNS Immunity. Trends Immunol (2009) 30(8):392–400. doi: 10.1016/j.it.2009.07.001
10. Dai L, Li Z, Tao Y, Liang W, Hu W, Zhou S, et al. Emerging Roles of Suppressor of Cytokine Signaling 3 in Human Cancers. Biomed Pharmacother (2021) 144:112262. doi: 10.1016/j.biopha.2021.112262
11. McFarland BC, Gray GK, Nozell SE, Hong SW, Benveniste EN. Activation of the NF-kappaB Pathway by the STAT3 Inhibitor JSI-124 in Human Glioblastoma Cells. Mol Cancer Res (2013) 11(5):494–505. doi: 10.1158/1541-7786.MCR-12-0528
12. Demircan Tan B, Turan T, Yucel B, Kara SA, Yilmaz SS, Yildirim A, et al. Aberrant SOCS3 Promoter Methylation as a Noninvasive Diagnostic Biomarker for Locally Advanced Prostate Cancer. Medeni Med J (2020) 35(2):99–105. doi: 10.5222/MMJ.2020.58708
13. Xu C, Liu Y, Xiao L, Chen L, Zheng S, Zeng E, et al. Silencing microRNA-221/222 Cluster Suppresses Glioblastoma Angiogenesis by Suppressor of Cytokine Signaling-3-Dependent JAK/STAT Pathway. J Cell Physiol (2019) 234(12):22272–84. doi: 10.1002/jcp.28794
14. Rhodes D, Yu J, Shanker K, Deshpande N, Varambally R, Ghosh D, et al. ONCOMINE: A Cancer Microarray Database and Integrated Data-Mining Platform. Neoplasia (2004) 6(1):1–6. doi: 10.1016/S1476-5586(04)80047-2
15. Li T, Fu J, Zeng Z, Cohen D, Li J, Chen Q, et al. TIMER2.0 for Analysis of Tumor-Infiltrating Immune Cells. Nucleic Acids Res (2020) 48:W509–14. doi: 10.1093/nar/gkaa407
16. Tang Z, Li C, Kang B, Gao G, Li C, Zhang Z, et al. GEPIA: A Web Server for Cancer and Normal Gene Expression Profiling and Interactive Analyses. Nucleic Acids Res (2017) 45:W98–W102. doi: 10.1093/nar/gkx247
17. Chandrashekar D, Bashel B, Balasubramanya S, Creighton C, Ponce-Rodriguez I, Chakravarthi B, et al. UALCAN: A Portal for Facilitating Tumor Subgroup Gene Expression and Survival Analyses. Neoplasia (2017) 19(8):649–58. doi: 10.1016/j.neo.2017.05.002
18. Lánczky A, Nagy Á, Bottai G, Munkácsy G, Szabó A, Santarpia L, et al. Mirpower: A Web-Tool to Validate Survival-Associated miRNAs Utilizing Expression Data From 2178 Breast Cancer Patients. Breast Cancer Res Treat (2016) 160(3):439–46. doi: 10.1007/s10549-016-4013-7
19. Li T, Fan J, Wang B, Traugh N, Chen Q, Liu J, et al. TIMER: A Web Server for Comprehensive Analysis of Tumor-Infiltrating Immune Cells. Cancer Res (2017) 77(21):e108–10. doi: 10.1158/0008-5472.CAN-17-0307
20. Fu J, Li K, Zhang W, Wan C, Zhang J, Jiang P, et al. Large-Scale Public Data Reuse to Model Immunotherapy Response and Resistance. Genome Med (2020) 12(1):21. doi: 10.1186/s13073-020-0721-z
21. Jiang P, Gu S, Pan D, Fu J, Sahu A, Hu X, et al. Signatures of T Cell Dysfunction and Exclusion Predict Cancer Immunotherapy Response. Nat Med (2018) 24(10):1550–8. doi: 10.1038/s41591-018-0136-1
22. Cerami E, Gao J, Dogrusoz U, Gross B, Sumer S, Aksoy B, et al. The Cbio Cancer Genomics Portal: An Open Platform for Exploring Multidimensional Cancer Genomics Data. Cancer Discov (2012) 2(5):401–4. doi: 10.1158/2159-8290.CD-12-0095
23. Shinawi T, Hill V, Krex D, Schackert G, Gentle D, Morris M, et al. DNA Methylation Profiles of Long- and Short-Term Glioblastoma Survivors. Epigenetics (2013) 8(2):149–56. doi: 10.4161/epi.23398
24. Men C, Chai H, Song X, Li Y, Du H, Ren Q, et al. Identification of DNA Methylation Associated Gene Signatures in Endometrial Cancer via Integrated Analysis of DNA Methylation and Gene Expression Systematically. J Gynecol Oncol (2017) 28(6):. doi: 10.3802/jgo.2017.28.e83
25. Fahey M, Bennett M, Mahon C, Jäger S, Pache L, Kumar D, et al. GPS-Prot: A Web-Based Visualization Platform for Integrating Host-Pathogen Interaction Data. BMC Bioinformatics (2011) 12:298. doi: 10.1186/1471-2105-12-298
26. Kong X, Liu C, Lu P, Guo Y, Zhao C, Yang Y, et al. Combination of UPLC-Q-TOF/MS and Network Pharmacology to Reveal the Mechanism of Qizhen Decoction in the Treatment of Colon Cancer. ACS Omega (2021) 6(22):14341–60. doi: 10.1021/acsomega.1c01183
27. Bardou P, Mariette J, Escudié F, Djemiel C, Klopp C. Jvenn: An Interactive Venn Diagram Viewer. BMC Bioinformatics (2014) 15:293. doi: 10.1186/1471-2105-15-293
28. Huang D, Sherman B, Tan Q, Kir J, Liu D, Bryant D, et al. DAVID Bioinformatics Resources: Expanded Annotation Database and Novel Algorithms to Better Extract Biology From Large Gene Lists. Nucleic Acids Res (2007) 35:W169–75. doi: 10.1093/nar/gkm415
29. Fekete J, Győrffy B. ROCplot.org: Validating Predictive Biomarkers of Chemotherapy/Hormonal Therapy/Anti-HER2 Therapy Using Transcriptomic Data of 3,104 Breast Cancer Patients. Int J Cancer (2019) 145(11):3140–51. doi: 10.1002/ijc.32369
30. Song Q, Bian Q, Liang T, Zhang Y, Zhang K, et al. Identification of Immune-Related Genes and Susceptible Population of Pulmonary Tuberculosis by Constructing TF-miRNA-mRNA Regulatory Network. Tuberculosis (Edinb) (2021) 131:102139. doi: 10.1016/j.tube.2021.102139
31. Wu SY, Lin KC, Lawal B, Wu AT, Wu CZ, et al. MXD3 as an Onco-Immunological Biomarker Encompassing the Tumor Microenvironment, Disease Staging, Prognoses, and Therapeutic Responses in Multiple Cancer Types. Comput Struct Biotechnol J (2021) 19:4970–83. doi: 10.1016/j.csbj.2021.08.047
32. Cui X, Zhang X, Liu M, Zhao C, Zhang N, Ren Y, et al. A Pan-Cancer Analysis of the Oncogenic Role of Staphylococcal Nuclease Domain-Containing Protein 1 (SND1) in Human Tumors. Genomics (2020) 112(6):3958–67. doi: 10.1016/j.ygeno.2020.06.044
33. Martini M, Pallini R, Luongo G, Cenci T, Lucantoni C, Larocca L, et al. Prognostic Relevance of SOCS3 Hypermethylation in Patients With Glioblastoma Multiforme. Int J Cancer (2008) 123(12):2955–60. doi: 10.1002/ijc.23805
34. Lindemann C, Hachmann O, Delic S, Schmidt N, Reifenberger G, Riemenschneider M, et al. SOCS3 Promoter Methylation is Mutually Exclusive to EGFR Amplification in Gliomas and Promotes Glioma Cell Invasion Through STAT3 and FAK Activation. Acta Neuropathol (2011) 122(2):241–51. doi: 10.1007/s00401-011-0832-0
35. Sutherland K, Lindeman G, Choong D, Wittlin S, Brentzell L, Phillips W, et al. Differential Hypermethylation of SOCS Genes in Ovarian and Breast Carcinomas. Oncogene (2004) 23(46):7726–33. doi: 10.1038/sj.onc.1207787
36. Cai Q, Zhu M, Duan J, Wang H, Chen J, Xiao Y, et al. Comprehensive Analysis of Immune-Related Prognosis of TK1 in Hepatocellular Carcinoma. Front Oncol (2021) 11:786873. doi: 10.3389/fonc.2021.786873
37. Xu JZ, Shao CC, Wang XJ, Zhao X, Chen JQ, Ouyang YX, et al. Circtada2as Suppress Breast Cancer Progression and Metastasis via Targeting miR-203a-3p/SOCS3 Axis. Cell Death Dis (2019) 10(3):175. doi: 10.1038/s41419-019-1382-y
38. Shang A, Wu J, Bi F, Zhang YJ, Xu LR, Li LL, et al. Relationship Between HER2 and JAK/STAT-SOCS3 Signaling Pathway and Clinicopathological Features and Prognosis of Ovarian Cancer. Cancer Biol Ther (2017) 18(5):314–22. doi: 10.1080/15384047.2017.1310343
39. Huang L, Hu B, Ni J, Wu J, Jiang W, Chen C, et al. Transcriptional Repression of SOCS3 Mediated by IL-6/STAT3 Signaling via DNMT1 Promotes Pancreatic Cancer Growth and Metastasis. J Exp Clin Cancer Res (2016) 35:27. doi: 10.1186/s13046-016-0301-7
40. Meacham CE, Morrison SJ. Tumour Heterogeneity and Cancer Cell Plasticity. Nature (2013) 501(7467):328–37. doi: 10.1038/nature12624
41. Borrebaeck CA. Precision Diagnostics: Moving Towards Protein Biomarker Signatures of Clinical Utility in Cancer. Nat Rev Cancer (2017) 17(3):199–204. doi: 10.1038/nrc.2016.153
42. Yabe M, Ishibashi K, Onagi A, Tanji R, Honda-Takinami R, Koguchi T, et al. Suppression of SOCS3 Enhances TRAIL-Induced Cell Growth Inhibition Through the Upregulation of DR4 Expression in Renal Cell Carcinoma Cells. Oncotarget (2018) 9(60):31697–708. doi: 10.18632/oncotarget.25851
43. Lawal B, Lin LC, Lee JC, Chen JH, Bekaii-Saab T, Wu A, et al. Multi-Omics Data Analysis of Gene Expressions and Alterations, Cancer-Associated Fibroblast and Immune Infiltrations, Reveals the Onco-Immune Prognostic Relevance of STAT3/CDK2/4/6 in Human Malignancies. Cancers (Basel) (2021) 13(5):954–76. doi: 10.3390/cancers13050954
44. Yu G, Chiang D, Song S, Hoyte E, Huang J, Vanishsarn C, et al. Regulatory T Cell Dysfunction in Subjects With Common Variable Immunodeficiency Complicated by Autoimmune Disease. Clin Immunol (2009) 131(2):240–53. doi: 10.1016/j.clim.2008.12.006
45. Man YG, Stojadinovic A, Mason J, Avital I, Bilchik A, Bruecher B, et al. Tumor-Infiltrating Immune Cells Promoting Tumor Invasion and Metastasis: Existing Theories. J Cancer (2013) 4(1):84–95. doi: 10.7150/jca.5482
46. Komohara Y, Fujiwara Y, Ohnishi K, Takeya M. Tumor-Associated Macrophages: Potential Therapeutic Targets for Anti-Cancer Therapy. Adv Drug Delivery Rev (2016) 99(Pt B):180–5. doi: 10.1016/j.addr.2015.11.009
47. Garnis C, Buys TP, Lam WL. Genetic Alteration and Gene Expression Modulation During Cancer Progression. Mol Cancer (2004) 3:9. doi: 10.1186/1476-4598-3-9
48. Blakely CM, Watkins TB, Wu W, Gini B, Chabon JJ, McCoach CE, et al. Evolution and Clinical Impact of Co-Occurring Genetic Alterations in Advanced-Stage EGFR-Mutant Lung Cancers. Nat Genet (2017) 49(12):1693–704. doi: 10.1038/ng.3990
49. Chen M, Zeng J, Chen S, Li J, Wu H, Dong X, et al. SPTBN1 Suppresses the Progression of Epithelial Ovarian Cancer via SOCS3-Mediated Blockade of the JAK/STAT3 Signaling Pathway. Aging (Albany NY) (2020) 12(11):10896–911. doi: 10.18632/aging.103303
50. Wan J, Che Y, Kang N, Wu W. SOCS3 Blocks HIF-1α Expression to Inhibit Proliferation and Angiogenesis of Human Small Cell Lung Cancer by Downregulating Activation of Akt, But Not STAT3. Mol Med Rep (2015) 12(1):83–92. doi: 10.3892/mmr.2015.3368
Keywords: SOCS3, immuno-oncology, gene expression profiling, immune-cell infiltration, genetic and epigenetic alterations, immunotherapy, chemotherapy, biomarker
Citation: Dai L, Tao Y, Shi Z, Liang W, Hu W, Xing Z, Zhou S, Guo X, Fu X and Wang X (2022) SOCS3 Acts as an Onco-immunological Biomarker With Value in Assessing the Tumor Microenvironment, Pathological Staging, Histological Subtypes, Therapeutic Effect, and Prognoses of Several Types of Cancer. Front. Oncol. 12:881801. doi: 10.3389/fonc.2022.881801
Received: 25 February 2022; Accepted: 28 March 2022;
Published: 06 May 2022.
Edited by:
Yi Zhang, First Affiliated Hospital of Zhengzhou University, ChinaReviewed by:
Qiang Zhang, University of Michigan, United StatesCopyright © 2022 Dai, Tao, Shi, Liang, Hu, Xing, Zhou, Guo, Fu and Wang. This is an open-access article distributed under the terms of the Creative Commons Attribution License (CC BY). The use, distribution or reproduction in other forums is permitted, provided the original author(s) and the copyright owner(s) are credited and that the original publication in this journal is cited, in accordance with accepted academic practice. No use, distribution or reproduction is permitted which does not comply with these terms.
*Correspondence: Xinjun Wang, d2FuZ3hqQHp6dS5lZHUuY24=
Disclaimer: All claims expressed in this article are solely those of the authors and do not necessarily represent those of their affiliated organizations, or those of the publisher, the editors and the reviewers. Any product that may be evaluated in this article or claim that may be made by its manufacturer is not guaranteed or endorsed by the publisher.
Research integrity at Frontiers

Learn more about the work of our research integrity team to safeguard the quality of each article we publish.