- 1School of Medicine, Tongji University, Shanghai, China
- 2Department of Medical Oncology, Shanghai Pulmonary Hospital & Thoracic Cancer Institute, School of Medicine, Tongji University, Shanghai, China
- 3Department of Thoracic Surgery, Shanghai Pulmonary Hospital, School of Medicine, Tongji University, Shanghai, China
- 4Department of Radiation Oncology, First Affiliated Hospital of Soochow University, Suzhou, China
Background: Lung adenocarcinoma (LUAD) is the most common type of lung cancer, accounting for around 40%. Despite achievements in the treatment approach, the prognosis is still dismal, with overall survival of fewer than five years. Thus, novel prognostic biomarkers are needed to predict the clinical outcomes of individual patients better. TTN has a high mutation rate in the LUAD, which encodes a large abundant protein of striated muscle. However, the value of TTN in prognosis and the immune environment are poorly understood.
Methods: We investigated the clinicopathological characteristics, transcriptional and protein level, prognostic value, biological function, and its relationship with immune infiltration of TTN gene in LUAD patients through bioinformatics analysis.
Results: TTN expression was significantly lower in LUAD than that in normal lung tissue. Lower TTN expression was associated with worse survival. Besides, TTN is highly expressed in alveolar type 2 cells which were surmised as the origin of LUAD.
Conclusion: Our findings indicated the potential prognostic value of TTN and its role as a biomarker for determining the immune infiltration levels in patients with LUAD.
Introduction
Lung adenocarcinoma (LUAD) accounts for a majority of cancer-related death worldwide. In the last decade, breakthroughs in immunotherapy research have dramatically improved survival rates for several tumor types (1–4), and revolutionized the management of cancer (5). Immunological checkpoint blockers (ICBs) targeting PD-1, PD-L1, and CTLA-4 have been widely used, showing extensive clinical benefits, rapidly expanding to more than a dozen clinical indications (6, 7).
Several clinical trials showed that the amounts and characteristics of immune cells in the immune microenvironment are key predictors of ICBs response. KEYNOTE-086 revealed a positive correlation between the number of TILs and the response to pembrolizumab (8). In the KEYNOTE-137 study, the level of PD-L1 expression and stromal tumor-infiltrating lymphocyte levels (TIL) had a strong correlation with response rates of pathologic complete response in triple-negative breast cancer (9). An inflamed tumor microenvironment, relatively abundant CD8+ cytotoxic T cells, relatively deficient CD4+ regulatory T cells, and activation of interferon-mediated signaling are required for ICBs therapeutic response. Therefore, deciphering the characteristics of tumor microenvironment and searching for immunotherapy biomarkers can help us predict the efficacy of immunotherapy and improve the outcome of treatment.
Titin is a key component in the assembly and functioning of vertebrate striated muscles. It acts a pivotal role in many diseases, like cardiomyopathy, limb-girdle muscular dystrophy, and multiple types of cancer (10, 11). Previous researches have focused on the function of TTN-AS1 in diverse cancers (12–16). Titin-antisense RNA1 (TTN-AS1) has been regarded as a tumor-promoting lncRNA in numerous cancers, such as LUAD, hepatocellular carcinoma, cervical cancer, papillary thyroid cancer, and gastric cancer (12, 17–21). Besides, TTN missense mutation plays a favorable prognostic role in lung squamous cell carcinoma(LUSC) (22). TTN is a protein-coding gene with a high mutation rate in LUAD. However, to our knowledge, the role of TTN mutation in LUAD is rarely reported.
Although immunotherapies have become the standard of care in patients with advanced LUAD, a fraction of patients still have a poor prognosis. Herein, we conducted comprehensive research to elucidate the prognosis value and function of TTN in LUAD, aiming to provide a new biomarker for predicting prognosis and a new immunotherapy target for advanced LUAD patients.
Methods
Expression Level and Biological Functions of TTN Different Types of Cancers
The expression level of the TTN gene in different types of cancers was analyzed in the Oncomine database (23) (https://www.oncomine.org/resource/login.html) and TIMER (24) (http://timer.cistrome.org/). The threshold was determined according to the following values: P-value of 0.0001, fold change of 2, gene ranking of top 10% and data type of all.
Prognosis Analysis
The overall survival and progress-free survival curves correlated to TTN expression in LUAD were plotted by Kaplan-Meier plotter (25, 26) (http://kmplot.com/analysis/). The correlation between TTN expression and survival in various cancer types was investigated in the PrognoScan database (27) (http://www.abren.net/PrognoScan/). The threshold was adjusted by a log-rank p-value of <0.05. Hazard ratio (HR) with 95% confidence intervals (CI) was also calculated.
Clinicopathological Characteristics Analysis
Clinicopathological characteristics and the mutation information of TTN of LUAD patients were explored in the cBioPortal database (28) (https://www.cbioportal.org). CBioPortal database contains somatic mutation and copy number variation data from the cancer genome atlas (TCGA) database (29) (https://www.cancer.gov/aboutnci/organization/ccg/research/structuralgenomics/tcga). The data of alteration frequency (mutation, fusion, amplification, deep deletion) of TTN was also visualized and downloaded from the official website. Besides, we excluded samples that are not profiled for all queried genes in all queried profiles.
Human Protein Atlas and CancerSEA Database
TTN mRNA expression and other related cell type markers in each cell type cluster of lung tissue were visualized by Uniform Manifold Approximation and Projection (UMAP) in the Human protein atlas (30, 31) (HPA; www.proteinatlas.org). Specificity and distribution classification were performed to determine the number of genes elevated in different cell types. The genes expressed in each of the cell types were explored in interactive UMAP plots and bar charts. Color-coding is based on groups of cells, and each cell type has common functional features. The functional state of TTN in various cancer types was analyzed by CancerSEA (32) (http://biocc.hrbmu.edu.cn/CancerSEA/). Correlations between the gene of interest and functional state in different single-cell datasets were filtered by correlation strength > 0.3 and P-value < 0.05.
Tumor Immune Infiltration Analysis
The relevance of TTN expression to tumor immune infiltration was analyzed via TIMER (http://timer.cistrome.org/). The gene expression level was displayed with log2 RSEM. The significantly correlated genes in TIMER were validated in GEPIA (33) (http://gepia.cancer-pku.cn/index.html). The Spearman method was used to analyze the correlation coefficient. TTN was used for the x-axis, and other genes of interest are represented on the y-axis. The tumor and normal tissue datasets were used for analysis.
GEO Database
One independent cohort (GSE116959) was downloaded from the GEO database. GSE116959 contains transcriptome profiling information of 57 LUAD samples and 11 peritumoral normal lung tissues, with gene expression measured by Agilent-039494 SurePrint G3 Human GE v2 8x60K Microarray 039381 in GPL17077. The TTN expression of each sample was analyzed using an unpaired t-test.
Quantitative Real-Time PCR
Two tumor tissue samples and paired tumor-adjacent tissues, five human lung tumor cell lines and one human pulmonary alveolar epithelial cell line (HPAEpiC) were used to detect transcriptional expression of TTN. A549, HCC827, H3255 and H1975 cell samples belong to lung adenocarcinoma cell lines, H1703 belongs to lung squamous cell line and HPAEpiC belongs to human pulmonary alveolar epithelial cell line. The mRNA expression of TTN was detected by real-time PCR, and GAPDH was the internal control gene. Real‐time PCR was performed with TB Green qPCR Master Mix (RR920A, Takara, Beijing, China) using the QuantStudio 6 Flex Real-Time PCR System (Thermo Fisher Scientific, Waltham, MA, USA). The expression values were analyzed by using 2−ΔΔCt relative quantitative methods. Primer sequences for the real-time PCR were listed as follows:
TTN forward: 5′- ACCCTTCTTTGACATCCGT -3′, reverse: 5′- TACTTTCCGCCACTTCGT -3′;
GAPDH forward: 5′- ACAACTTTGGTATCGTGGAAGG -3′, reverse: 5′- GCCATCACGCCACAGTTTC -3′.
Immunohistochemistry
Clinical samples were obtained from 1 patient with LUAD who was surgically treated at shanghai pulmonary hospital. The LUAD tissue and the paired adjacent tissues were prepared into 5 μm paraffin sections and incubated with mouse polyclonal antibodies of titin (1:150, Sigma, USA) at 4° overnight in a refrigerator. The sections were coupled with the secondary antibody labeled with horseradish peroxidase (1:400, Abcam, USA) at room temperature for 1.5 h, then each section was stained with DAB reagent, and counterstained with hematoxylin. IHC sections were independently reviewed by two pathologists (JC, HS).
Western Blotting
Protein from five lung cancer cell samples and one normal epithelial cell sample were extracted for used in the following western blotting (WB) experiments. WB experiments were performed according to the detailed protocol previously reported (34), with antibody against titin N-terminal (mouse;1:1000; Sigma SAB1400284).
Statistical Analysis
Survival curves were generated by the PrognoScan and Kaplan Meier plots. The results generated in PrognoScan were performed with the hazard ratio (HR), 95% confidence interval (CI), and Cox P-values. The results generated in Oncomine are displayed with P-values, fold changes, and ranks. The results of Kaplan Meier plots and GEPIA are displayed with HR and P or Cox P-values from a log-rank test. The correlation of gene expression was evaluated by Spearman’s correlation and statistical significance, and the strength of the correlation was determined using the following criteria: 0.00–0.19 “very weak,” 0.20–0.39 “weak,” 0.40–0.59 “moderate,” 0.60–0.79 “strong,” 0.80–1.0 “very strong.” P -value<0.05 was considered statistically significant.
Results
Assessment of TTN Expression and Biological Functions in Different Tumors and Normal Tissues
Oncomine database was used to determine the expression of TTN in various types of cancer and normal tissues. mRNA expression of TTN was significantly lower in lung cancer (Figure 1A). The panel shows the numbers of datasets with statistically significant mRNA upregulated expression (red) or downregulated expression (blue) of TTN. The threshold was designed with the following parameters: fold change of 1.5 and P-value of 0.05.
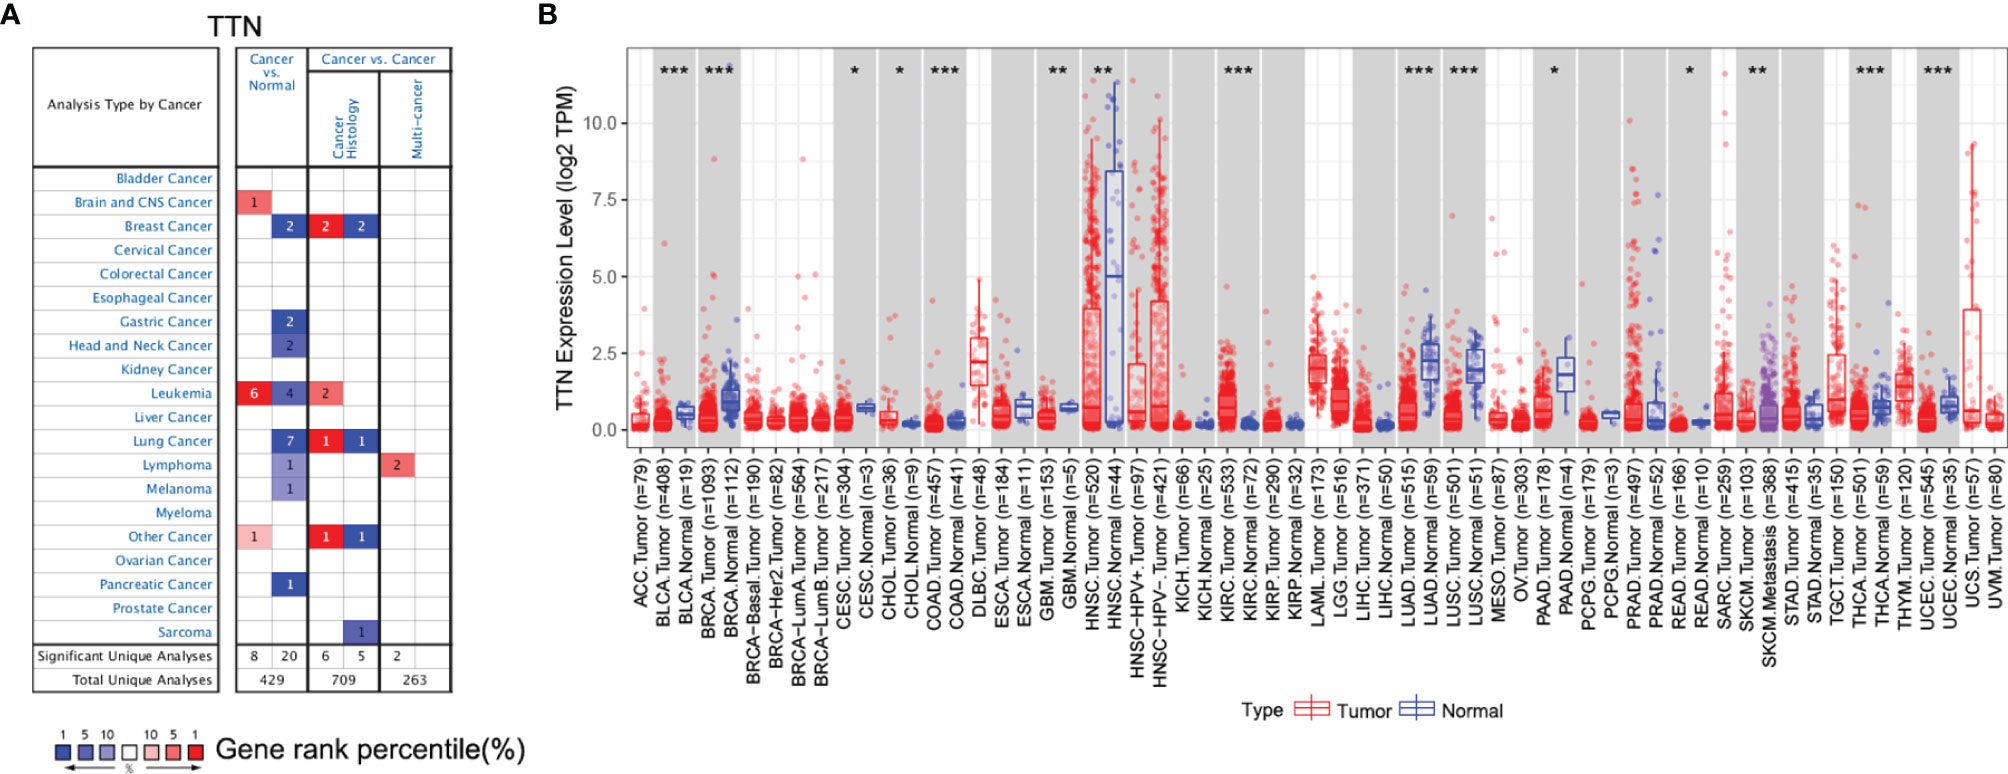
Figure 1 TTN gene expression level in different cancer and normal tissues. (A) The expression level of TTN in different cancer and normal tissues in the Oncomine database. Cell color was determined by the best gene rank percentile for the analyses within the cell; (B) The expression of TTN between tumor tissues and normal tissues in different cancer types in TIMER database (*P <0.05, **P < 0.01, ***P < 0.001).
Furthermore, we evaluated the expression of TTN in different types of cancer using the RNA-seq data of multiple malignancies in TCGA. The results manifested that tumor tissues had a significantly decreased TTN expression compared with that in normal tissues in LUAD (Figure 1B). In addition, it revealed the same tendency both in the microarray and RNA-seq data.
Prognosis Analysis in LUAD Patients With Different TTN Expression Levels
Since TTN expression was significantly changed in various tumor tissues, especially in LUAD, we investigated the Prognostic value of TTN expression in LUAD patients (Figure 2). Kaplan-Meier analysis revealed that higher expression of TTN predicted better overall survival (OS) and progress-free survival (PFS). (OS HR= 0.7, 95% CI = 0.55 to 0.9, P=0.0044; PFS HR=0.7, 95% CI = 0.51 to 0.97, P=0.032) (OS HR= 0.46, 95% CI = 0.34 to 0.61, P = 9.1e-8; PFS HR = 0.43, 95% CI = 0.28 to 0.68, P = 0.00015) (Figures 2A–D). Therefore, lower expression level of TTN may serve as a poor prognostic factor in LUAD patients.
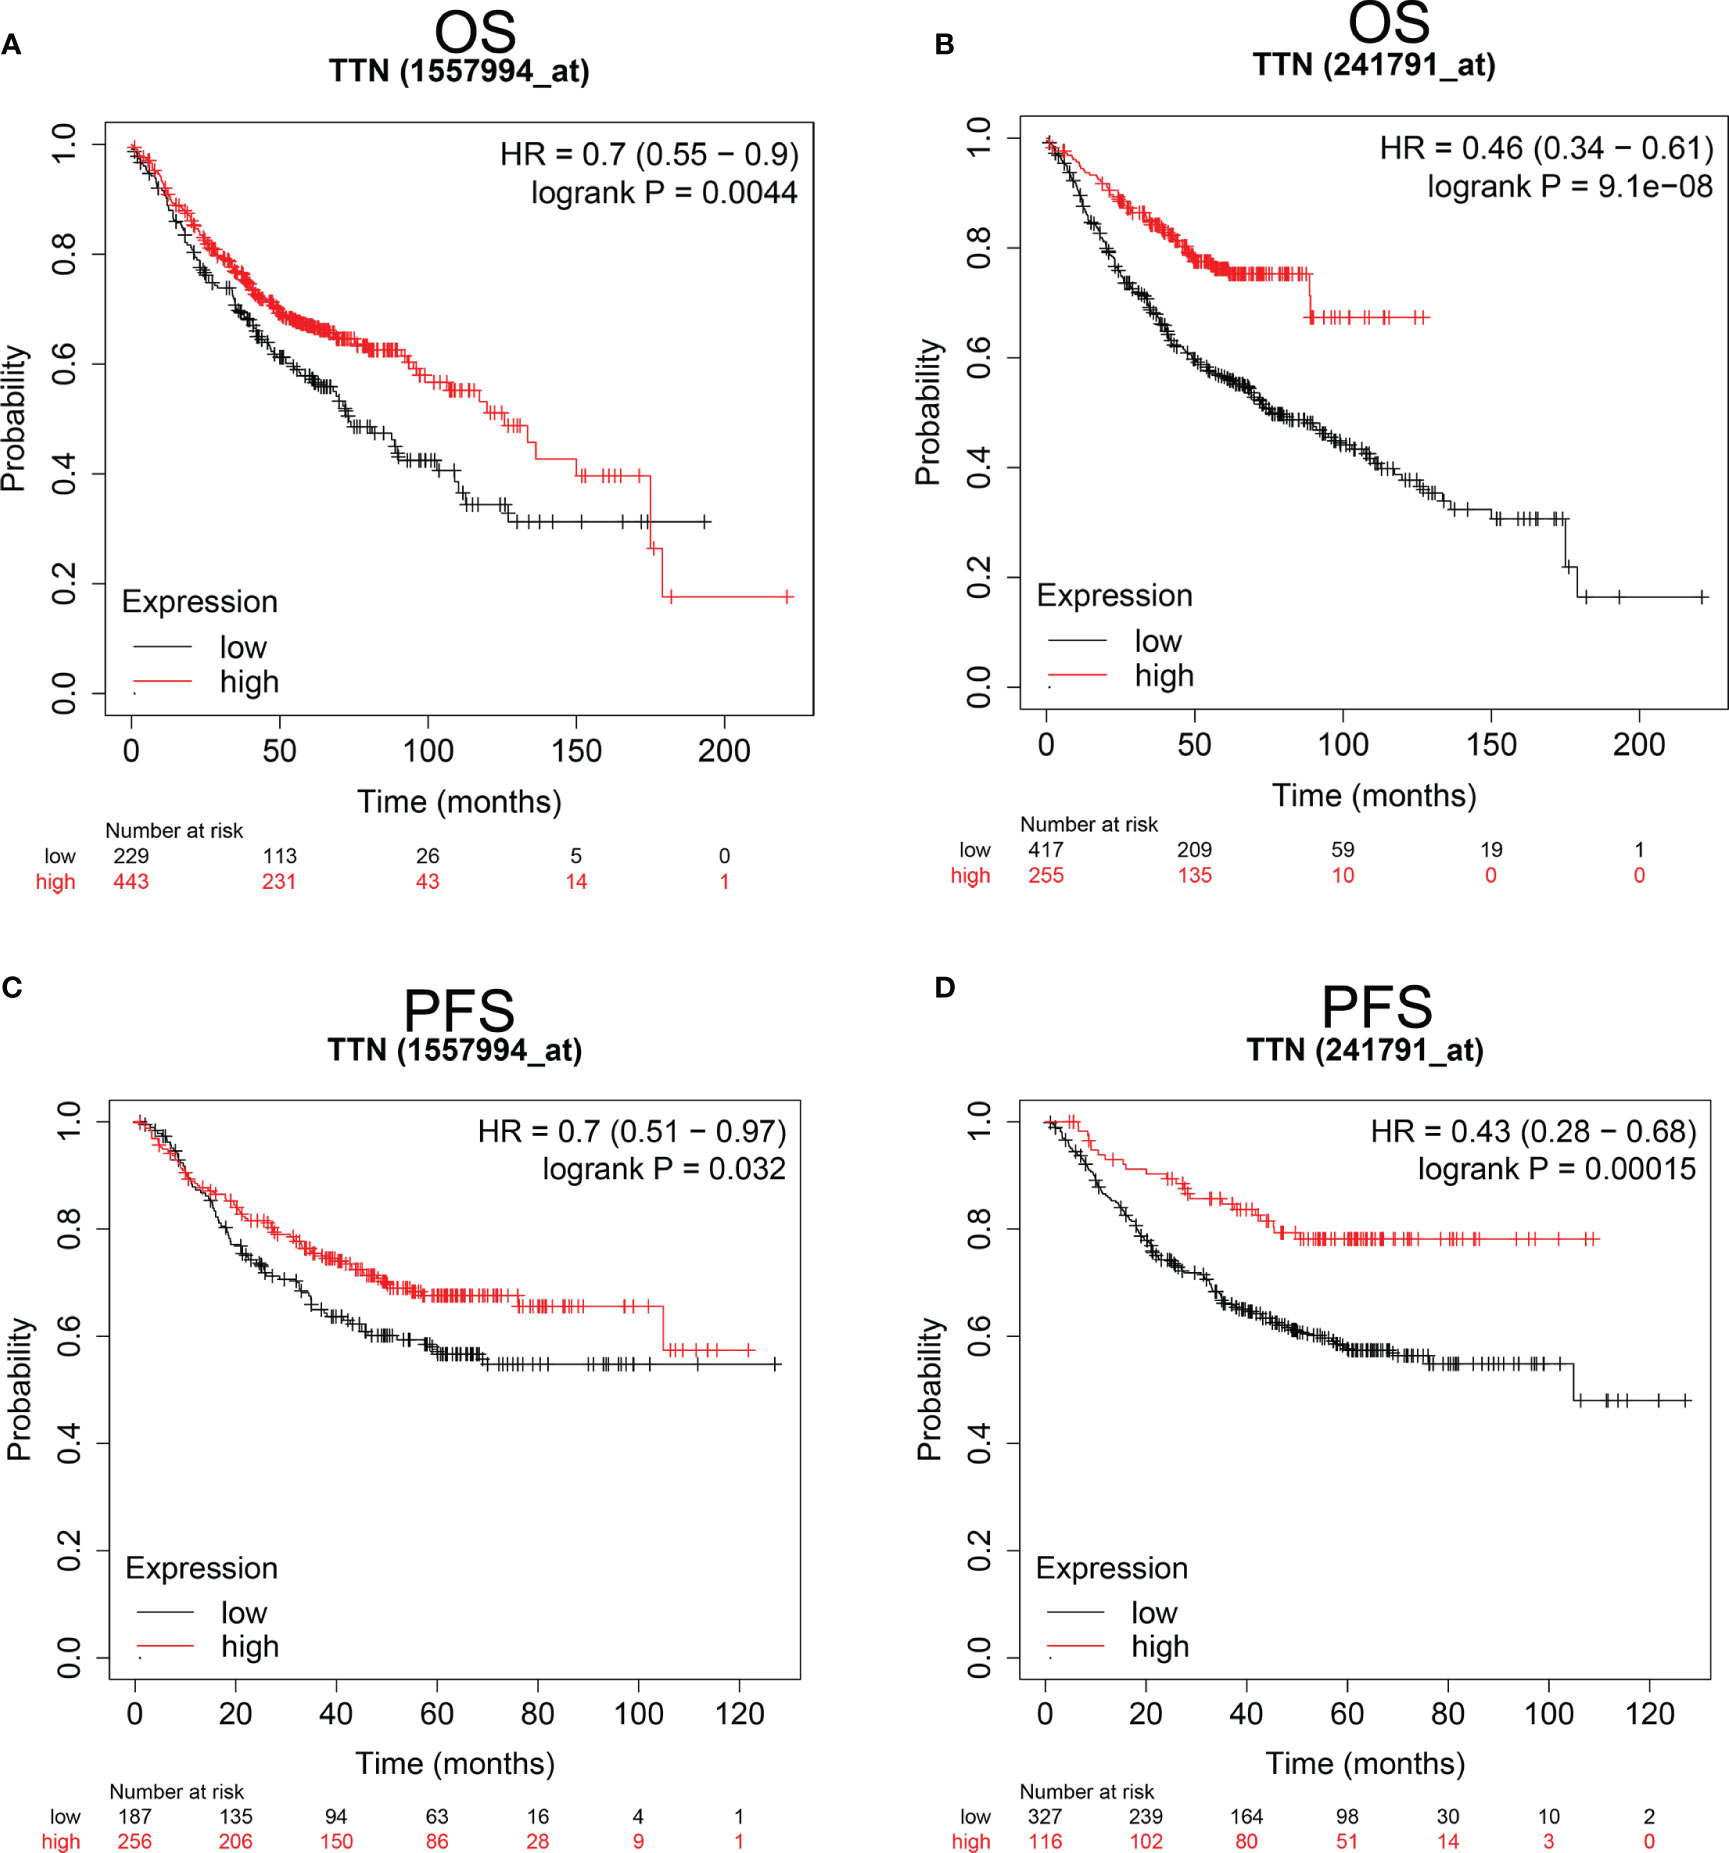
Figure 2 Kaplan-Meier survival curves comparing the higher and lower expression of TTN in LUAD Kaplan-Meier plotter database. OS and PFS of LUAD patients in the Kaplan-Meier plotter database (A–D). Red curves represented patients with higher expression of TTN. OS, overall survival; RFS, relapse-free survival. PFS, progress-free survival.
Correlation of TTN Expression With Prognosis Under Different Clinicopathological Factors in LUAD Patients
We investigated the relationship between TTN expression level with several clinicopathological features and prognosis in LUAD patients in the Kaplan-Meier plotter database (Table 1). Besides, the correlation between TTN expression and various characteristics in LUAD patients was visualized by the cBioPortal online tool (Figure 3). TTN mutation frequently occurs in LUAD patients with a rate of 49%. TTN missense mutation was the most common type of mutation which caused decreased mRNA expression (Figure S1). Moreover, high expression of TTN in female patients can benefit in PFS (n = 221, HR = 0.51, 95% CI = 0.32 to 0.83, P = 0.0055) and OS (n = 286, HR = 0.59, 95% CI = 0.4 to 0.89, P = 0.01) while male patients with high TTN expression level can benefit in OS (n = 328, HR = 0.62, 95% CI = 0.44 to 0.86, P = 0.0041). Thus, these results provided a theoretical basis for the poor prognosis of patients with TTN mutations.

Table 1 Correlation between TTN mRNA expression and clinical prognosis in LUAD with different clinicopathological factors by Kaplan-Meier plotter.
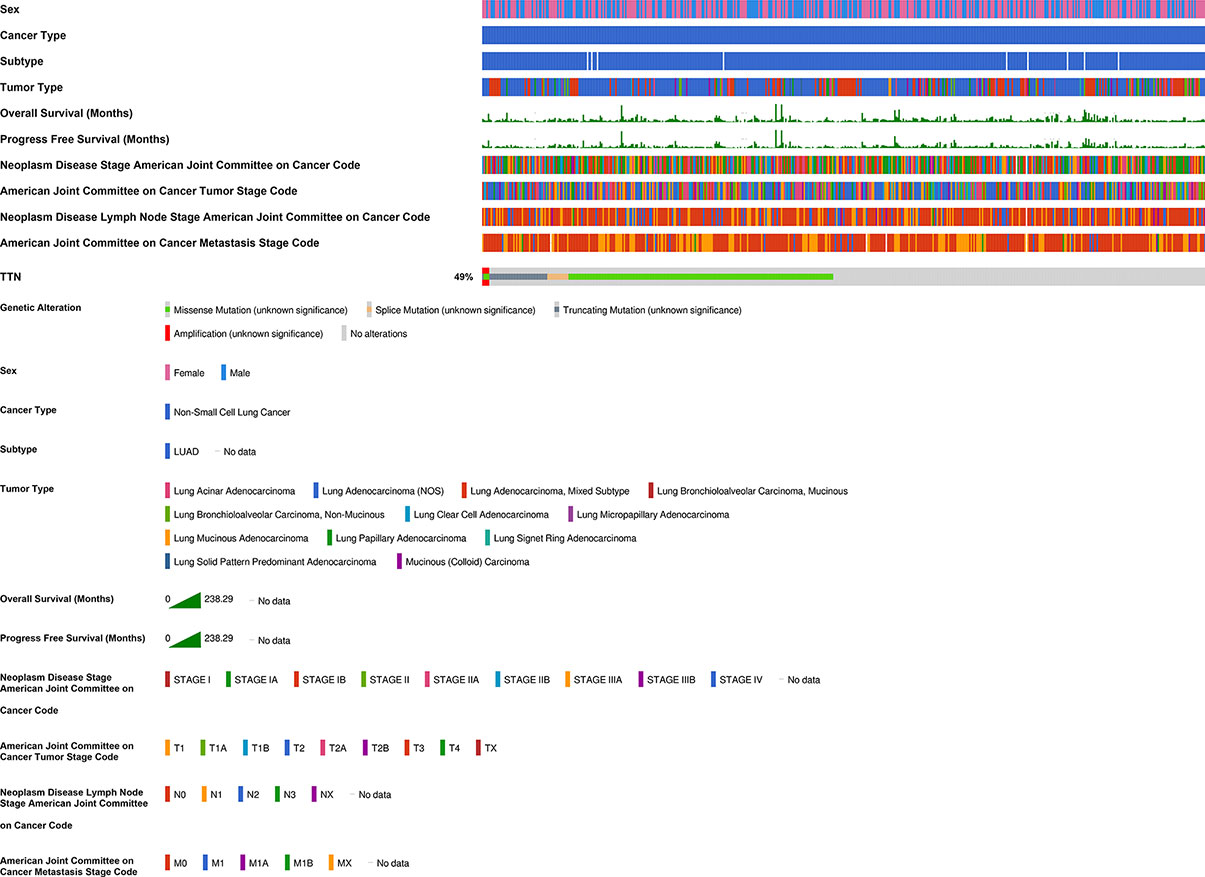
Figure 3 Correlation of TTN mRNA expression with different clinicopathological features in LUAD in the cBioPortal database. The mutation frequency of TTN was 49% in 511 patients with LUAD. 55 patients were excluded from analysis since they were not profiled for all queried genes in all queried profiles and germline mutations.
TTN Expression Level and Function in Different Single Cell Type Clusters of Lung Tissue
We investigated the transcriptomic expression level in diverse cell clusters of lung tissue (Figure 4). The results showed each value in different cluster, and we found that TTN had a higher expression level in alveolar cells type 2 c-1(n=750, 228.9pTPM), c-6 (n=275, 168.4pTPM) and endothelial cells c-9 (n=182, 154.2pTPM). Consequently, TTN function in tumorigenesis was investigated in nine organs or tissues at a single-cell level, including LUAD and other tumors (Figure 5). The results showed that TTN had a negative correlation with DNA repair function, and it also significantly related to differentiation in LUAD (ρ=0.37, p<0.01).
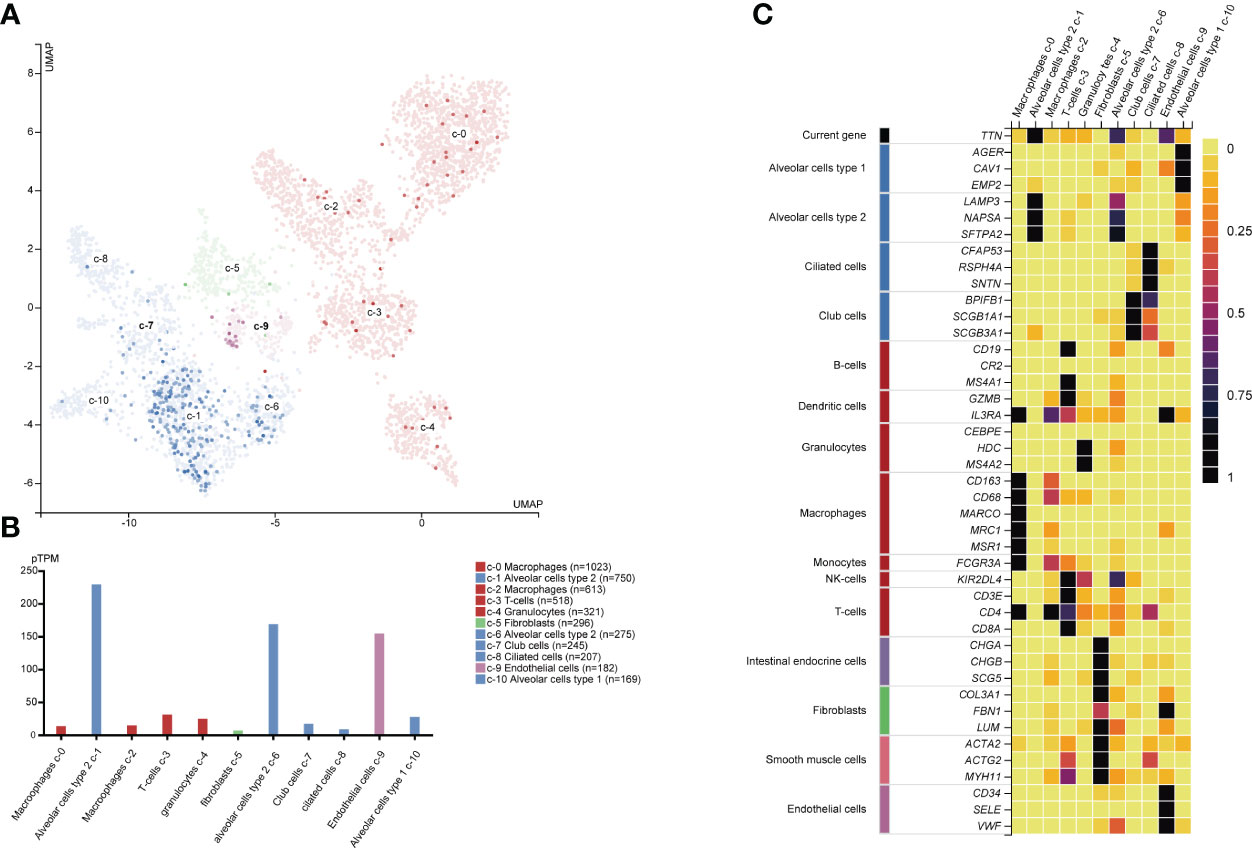
Figure 4 TTN mRNA expression and other related cell type markers in different single cell type clusters of lung tissue. Expression of TTN in the single-cell type clusters identified in lung tissue was visualized by a UMAP plot (A) and a bar chart (B) Each dot corresponds to a cell. The heatmap (C) of TTN and specific marker genes in each cell cluster subtype.
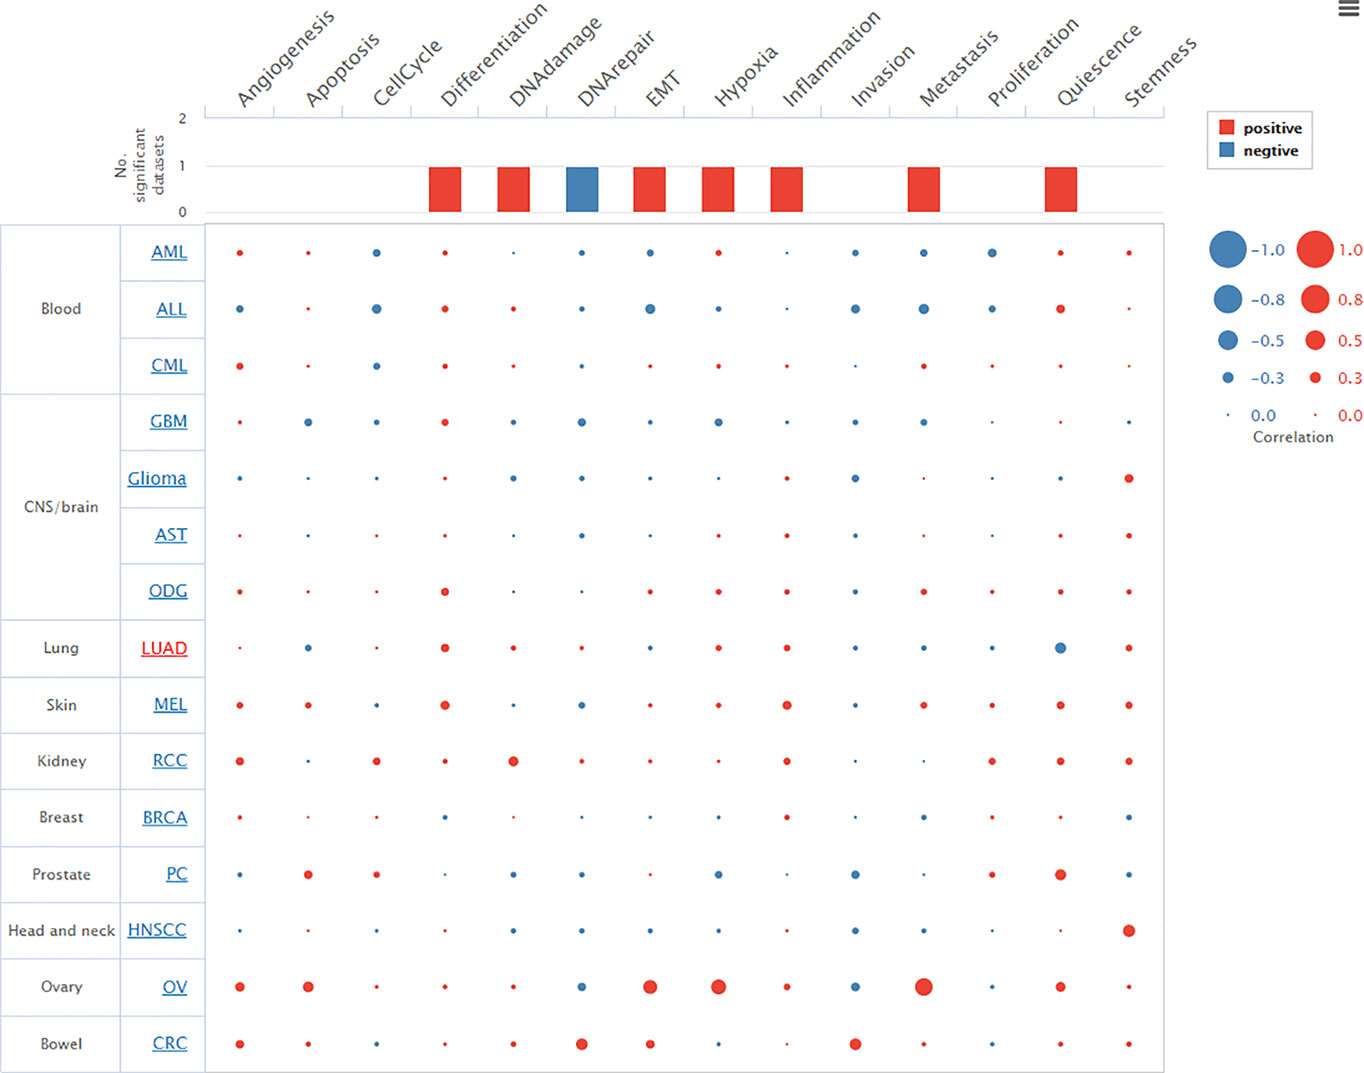
Figure 5 Relevance of TTN across 14 functional states in distinct cancers. Average correlations between TTN and functional states in different cancers. The bar chart showed the number of datasets in which TTN was significantly related to the corresponding state. The red plots indicated that TTN was positively correlated with the functional state while the blue plots indicated that TTN was negatively correlated with the functional state.
TTN Expression Correlated With Immune Cell Infiltration in LUAD
We investigated the association between TTN expression and infiltration level of immune cells in the tumor microenvironment (Figure 6). TTN expression level was positively correlated with the infiltration of CD8+ T cells (Rho = 0.144, P = 1.32e-03), CD4+ T cells (Rho = 0.269, P = 1.31e-09), B cells (Rho = 0.191, P = 1.88e-05), neutrophils (Rho = 0.101, P = 2.54e-02), T cell regulatory (Rho = 0.016, P = 7.23e-01), macrophages (Rho = 0.046, P = 3.13e-01), monocytes (Rho = 0.173, P = 1.12e-04), myeloid dendritic cells (Rho = 0.115, P = 1.09e-02) and mast cell activated (Rho = 0.251, P = 1.54e-08). The results showed that TTN and different tumor-infiltrating immune cell subsets were weakly to moderately correlated. Biomarker sets of immune cells were significantly associated with TTN in LUAD (Table S1). Markers of monocyte and macrophage were significantly correlated with the expression level of TTN in TIMER and GEPIA databases. (Figure 7 and Table 2). Moreover, TTN had the highest correlation with T cells and its markers implicated the potential of TTN to recruit and activate T cells. Above all, these results indicated that TTN played a potentially important role in modulating the immune microenvironment of LUAD.
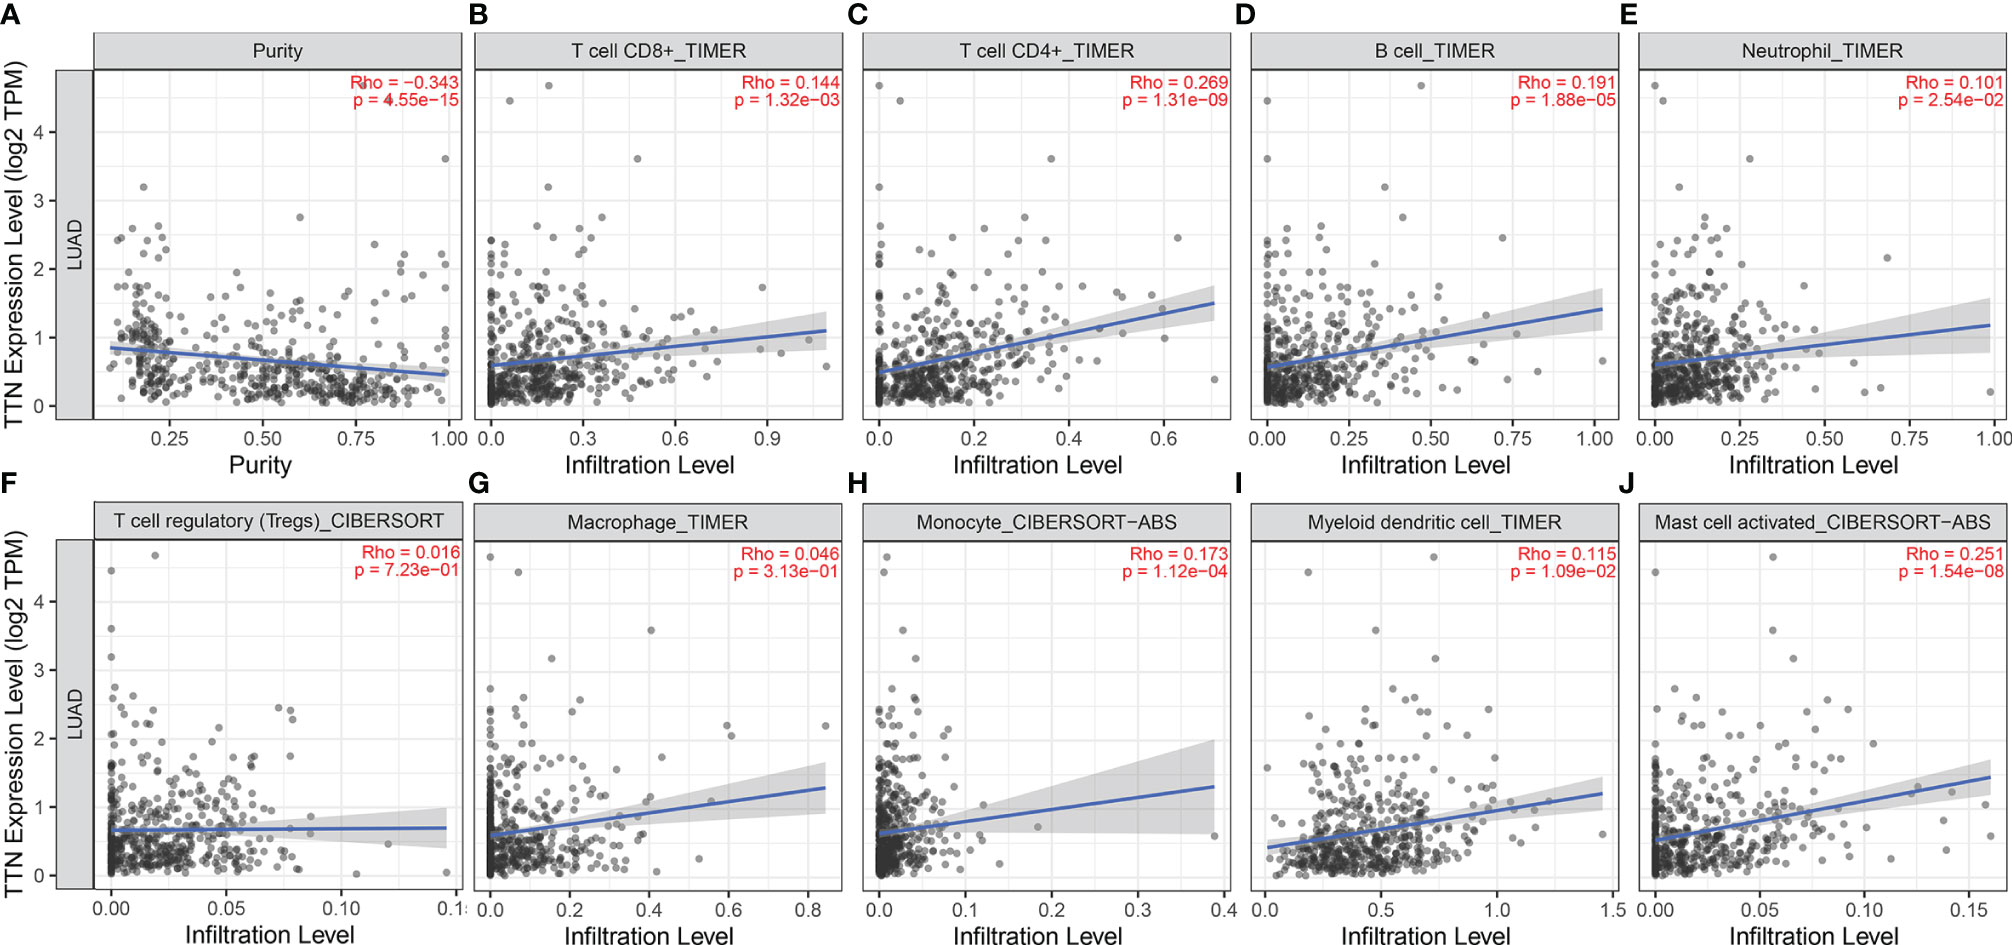
Figure 6 Correlations between TTN expression level and tumor-infiltrating immune cells in LUAD. TTN expression displayed significant correlations with tumor purity (A) and infiltration of CD8+T cells (B), CD4+T cells (C), B cells (D), neutrophils (E), monocytes (H), DCs (I), and mast cells (J) activated in LUAD. TTN expression showed a very weak correlation with Treg (F) and macrophages (G) in LUAD

Figure 7 TTN expression correlated with macrophage polarization in NSCLC. Scatterplots of correlations between TTN expression and gene markers of monocytes (A), TAMs (B) and M1 (C) and M2 macrophages (D) in LUAD(n=515) (A–D). Scatterplots of correlations between TTN expression and gene markers of monocytes (E), TAMs (F) and M1 (G) and M2 macrophages (H) in LUSC(n=501) (E–H).
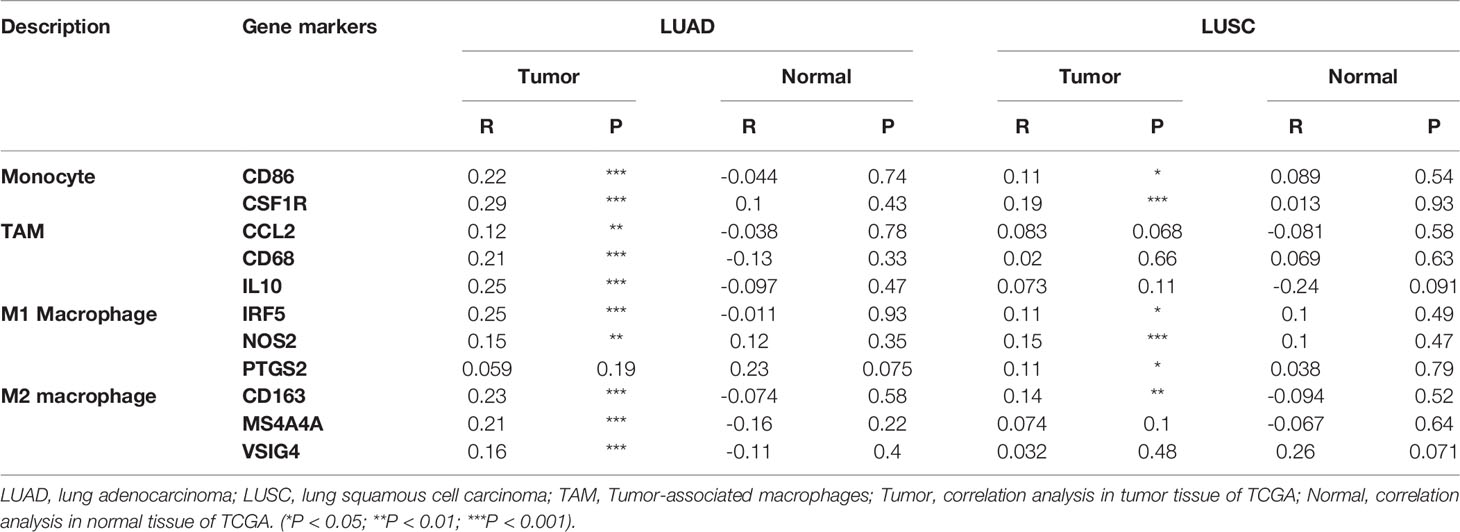
Table 2 Correlation analysis between TTN and related genes and markers of monocyte and macrophages in GEPIA.
Verification of TTN Prognostic Value and Expression
We investigated the Prognostic value of TTN Expression in LUAD in the PrognoScan database. The cohort (GSE31210), including 204 samples, showed that a lower TTN expression level was significantly associated with poor prognosis (Figures 8B, D–F). However, the cohort (240793_at and 1557994_at) showed no significant association between TTN expression and OS in LUAD (Figures 8A, C). In an independent (GSE116959), we found that TTN had a lower expression level, comparing to normal tissues (Figure 8G). In order to validate our findings, we also extracted RNA from 4 paired samples from 2 LUAD patients, 6 samples from five lung cancer cell lines and one normal cell line, and a similar result was also observed (Figures 8H, I). Immunohistochemical analysis confirmed that TTN expression was lower in LUAD than in normal lung tissue (Figure 8J). Western blotting analysis demonstrated that five lung cancer cell samples had significantly decreased expression of titin, compared with normal alveolar epithelial cell sample (Figure 8K).
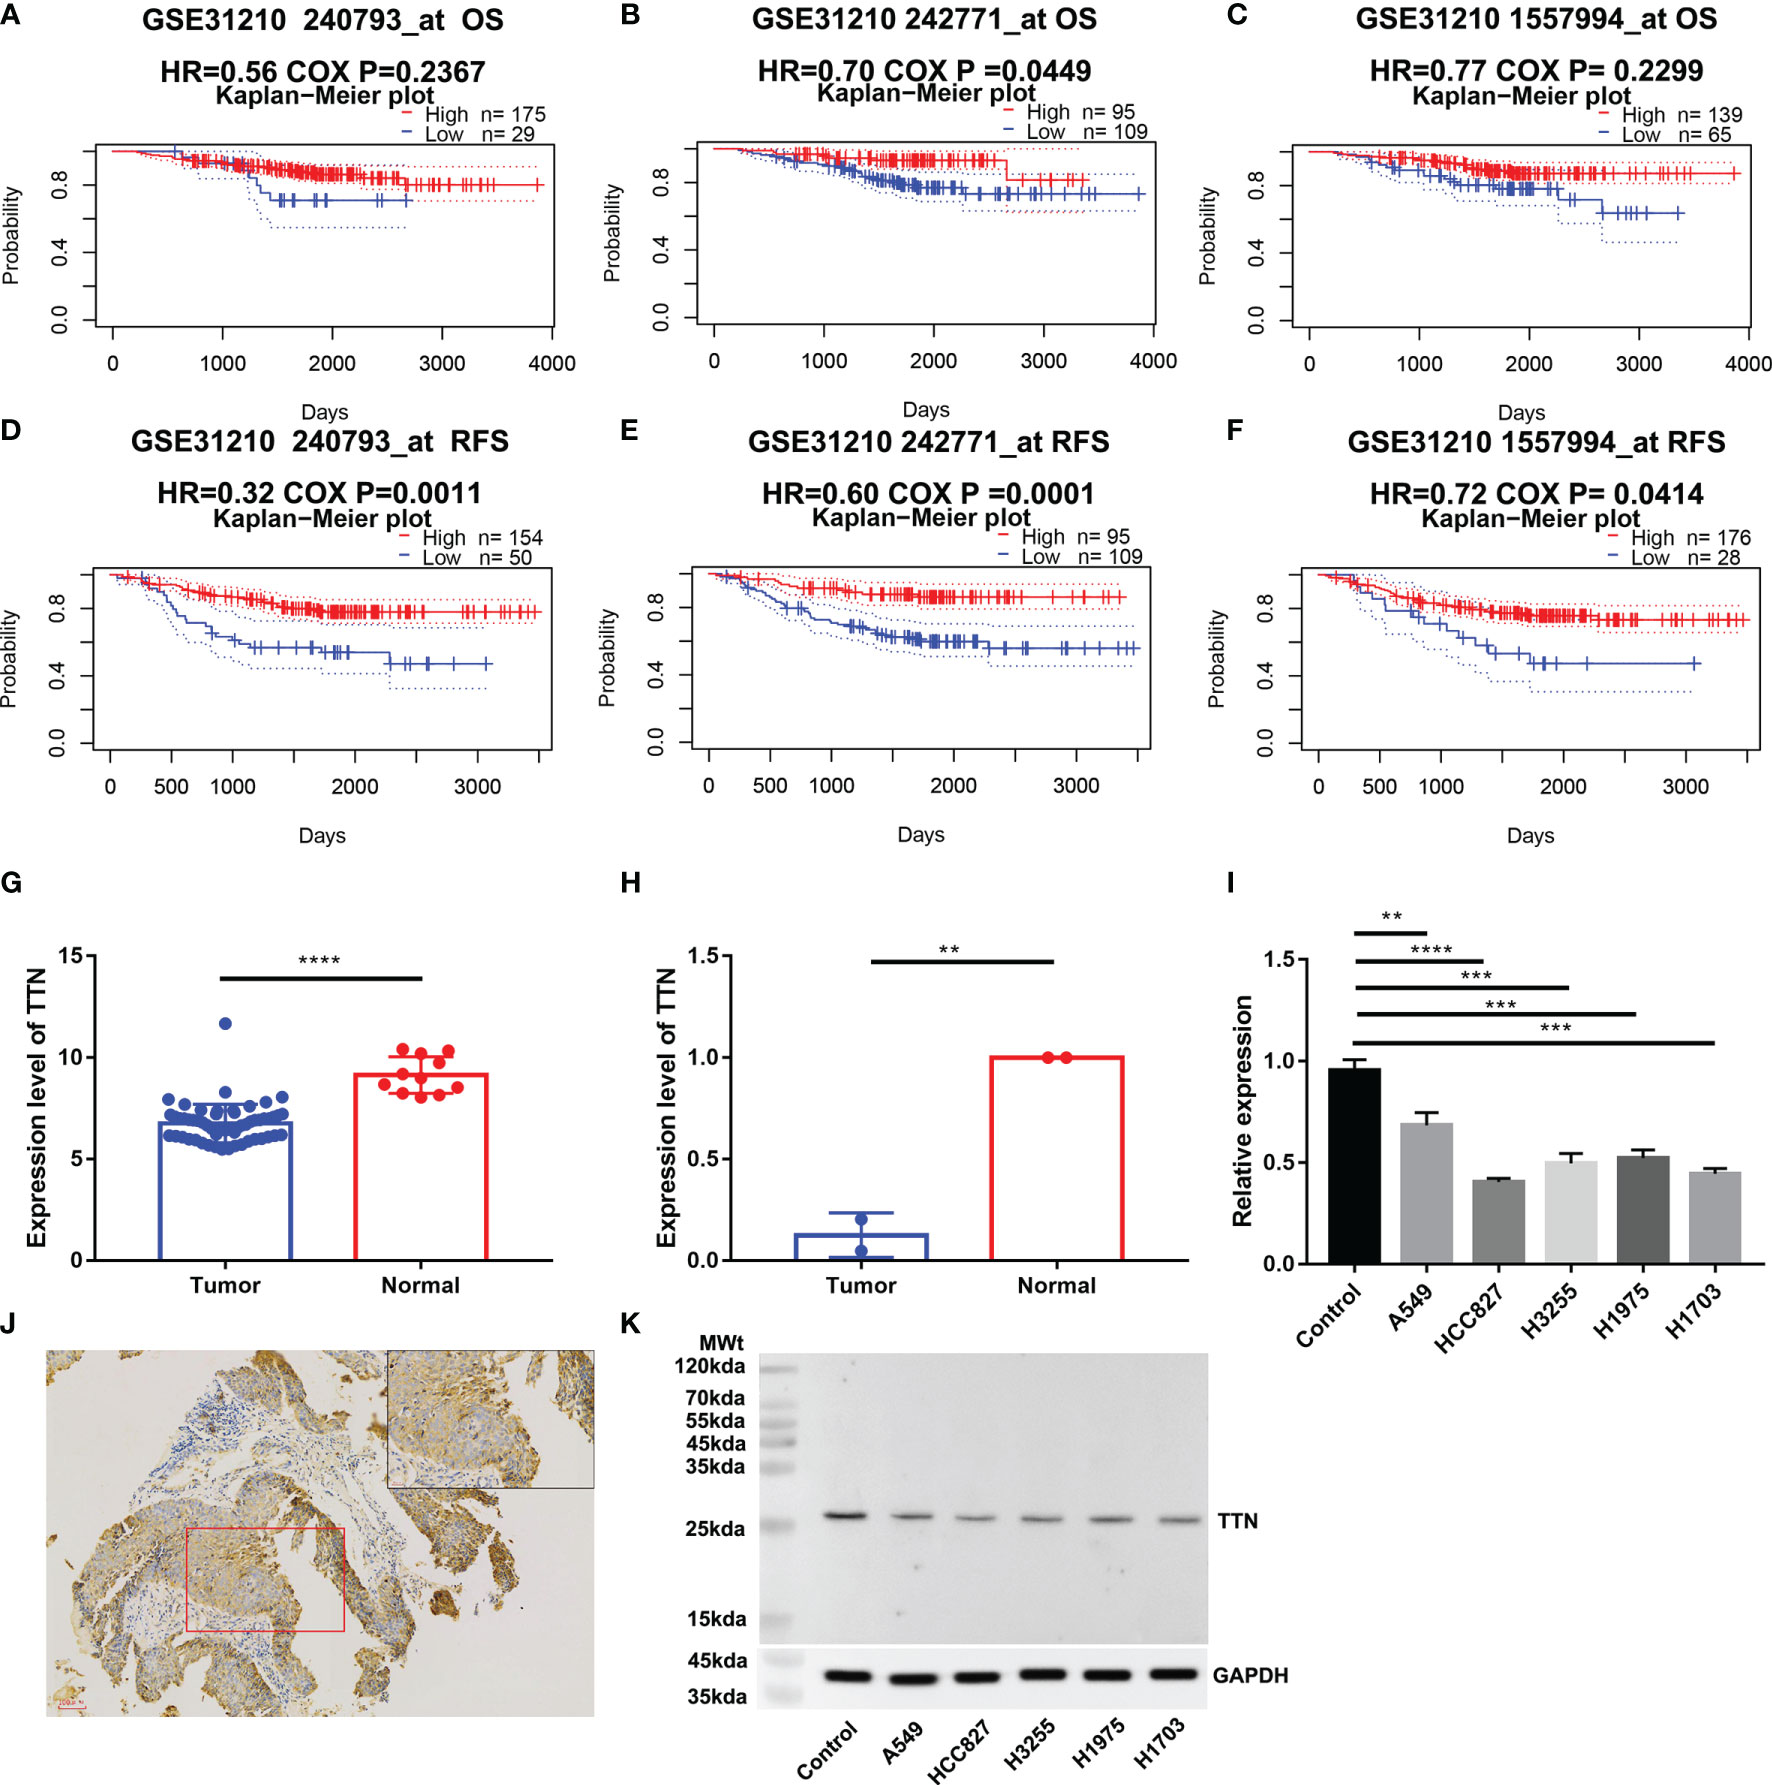
Figure 8 Validation of TTN expression and prognostic value. OS and RFS of LUAD patients in the cohort (GSE312100, n=204) (A–F); Expression of TTN in cohort (GSE116959, n= 68) (G); TTN expression level in 2 LUAD tissue samples and 2 paired normal tissue samples (H); TTN expression level in 4 LUAD cell samples,1 LUSC cell sample and 1 normal alveolar epithelial cell sample (I); Immunohistochemical analysis of the expression of titin in LUAD (J). Western blotting analysis of expression of titin in 5 different lung cancer cell lines and human pulmonary alveolar epithelial cells (K). (*P < 0.05, **P < 0.01, ***P < 0.001, ****P < 0.0001)
Discussion
On the basis of our findings and rigorous validation, we found TTN was strongly correlated with prognosis and tumor-infiltrating lymphocytes. Both Oncomine and TIMER databases showed consistent differences between tumor and normal tissues, which means TTN was a differentially expressed gene and deserved further study. Subsequently, we carried out prognosis analysis in LUAD patients with different TTN expression levels. Results in our findings indicated that lower expression levels in LUAD boded poor outcomes. In addition, we de novo verified our findings through two independent cohorts, qPCR, and immunohistochemistry methods. Thus, it could be a prognostic biomarker for LUAD patients.
Based on previous knowledge, we have learned that Alveolar Type 2 (AT2) cells are precursors of the alveolar epithelium, which can transform into AT1 cells, maintain self-renewal during normal homeostasis and recovery after injury (35–37). Some investigators found that AT2 cells may progress to adenomas and adenocarcinomas (38–40). The pathogenesis of early adenocarcinoma progression indicated that AT2 cells were the most likely cancer cells of origin (41). Recent advances in Single-cell RNA sequencing (scRNA-seq) revealed AT2-like cells were associated with malignant cell populations, and AT2 cells were regarded as the cancer-initiating cells (42, 43). According to our findings, TTN was highly expressed in AT2 cells at single-cell resolution (Figure 4). Meanwhile, a negative correlation between TTN with DNA repair was exclusively observed in the CancerSEA database (Figure 5). As we all know, DNA repair dysfunction could lead to tumorigenesis, which means TTN may be a potential determinant in the development of cancer.
Another important result in our study was the correlation between TTN expression and tumor-infiltrating lymphocytes. TTN expression level was positively correlated with the infiltration levels of CD8+ T cells, CD4+ T cells, and other immune cells (Figure 6). The tumor-infiltrating lymphocyte grade is a key factor in tumor staging and is one of the cogent predictors of cancer recurrence and survival (44, 45). This result may help explain the relationship between the low expression level of TTN and poor survival rate in patients with LUAD. Our study also showed that TTN significantly and specifically correlated with PD-1, CTLA-4, LAG-3, TIM-3. We can infer that TTN may have an influence on the clinical outcome of LUAD patients by means of interacting with immune infiltrating cells. Effective biomarkers which could improve response rates of immunotherapy are the basis of drug development and clinical precision medicine. Our findings also provided a tendency in scientific research and clinical use of immunotherapy in the future.
TTN was frequently detected with a high mutation rate in solid tumors, and was associated with responsiveness to checkpoint blockades in solid tumors (46). Furthermore, the detection of TTN mutations in peripheral blood was pertinent to satisfactory objective response and survival rate of ICBs (47). Recent studies also showed that TTN mutation has great potential as a predictive marker of ICBs for LUAD patients (48).
This study is the first research to explore the transcription level, function states of TTN, and its relationship with the prognosis and immune infiltration in patients with LUAD through bioinformatics analysis and validation in vitro, which may provide a potential biomarker for immunotherapy. Besides, our findings shed valuable insights on the roles of TTN in AT2 cell tumorigenesis. However, our study has several limitations. The precise role of TTN in tumor immune microenvironment is not clear, and the animal model is still needed to elucidate the underlying mechanism that how TTN promotes evolution and dissemination of tumors through mediating tumor-infiltrating immune cells.
In conclusion, our research indicates that the transcription level of TTN is obviously downregulated in LUAD and may play a significant role in the occurrence and development of LUAD. Besides, TTN has the potential as an immune-related therapeutic target.
Data Availability Statement
The original contributions presented in the study are included in the article/Supplementary Material. Further inquiries can be directed to the corresponding author.
Ethics Statement
The studies involving human participants were reviewed and approved by the ethics committee of Shanghai Pulmonary Hospital, Tongji University. The patients/participants provided their written informed consent to participate in this study.
Author Contributions
JC: Data analysis, Interpretation, Manuscript writing; YW: Collection and data assembly, Manuscript writing; HS: Provision of study materials or patients, Manuscript writing; XY: Manuscript writing. RH: Manuscript revision. CC: Conceptualization, Manuscript Revision; CS: Conceptualization, Administrative support, Manuscript Revision. All authors have reviewed the final version of the manuscript and approve it for publication.
Funding
This study was supported by the National Natural Science Foundation of China (grant number: 82072568) and the Cancer Research Funding of CSCO-Hausen (grant number: kh0151120201494, kh0151120200974).
Conflict of Interest
The authors declare that the research was conducted in the absence of any commercial or financial relationships that could be construed as a potential conflict of interest.
Publisher’s Note
All claims expressed in this article are solely those of the authors and do not necessarily represent those of their affiliated organizations, or those of the publisher, the editors and the reviewers. Any product that may be evaluated in this article, or claim that may be made by its manufacturer, is not guaranteed or endorsed by the publisher.
Acknowledgments
We would like to express our gratitude to the website for providing shared public information the data and thank the investigators and research groups of the GSE31210, GSE116959 and TCGA datasets. Besides, we appreciate Keren Jia (Peking University Cancer Hospital & Institute) for his suggestions and effort.
Supplementary Material
The Supplementary Material for this article can be found online at: https://www.frontiersin.org/articles/10.3389/fonc.2022.877878/full#supplementary-material
Supplementary Figure 1 | mRNA expression of different TTN mutation types. Missense mutation has decreased slightly with no statistical significance. P = 0.1642.
References
1. Hodi FS, O'Day SJ, McDermott DF, Weber RW, Sosman JA, Haanen JB, et al. Improved Survival With Ipilimumab in Patients With Metastatic Melanoma. New Engl J Med (2010) 363(8):711–23. doi: 10.1056/NEJMoa1003466
2. Lynch TJ, Bondarenko I, Luft A, Serwatowski P, Barlesi F, Chacko R, et al. Ipilimumab in Combination With Paclitaxel and Carboplatin as First-Line Treatment in Stage IIIB/IV Non-Small-Cell Lung Cancer: Results From a Randomized, Double-Blind, Multicenter Phase II Study. J Clin Oncol (2012) 30(17):2046–54. doi: 10.1200/JCO.2011.38.4032
3. Reck M, Bondarenko I, Luft A, Serwatowski P, Barlesi F, Chacko R, et al. Ipilimumab in Combination With Paclitaxel and Carboplatin as First-Line Therapy in Extensive-Disease-Small-Cell Lung Cancer: Results From a Randomized, Double-Blind, Multicenter Phase 2 Trial. Ann Oncol Off J Eur Soc Med Oncol (2013) 24(1):75–83. doi: 10.1093/annonc/mds213
4. Calabrò L, Morra A, Fonsatti E, Cutaia O, Fazio C, Annesi D, et al. Efficacy and Safety of an Intensified Schedule of Tremelimumab for Chemotherapy-Resistant Malignant Mesothelioma: An Open-Label, Single-Arm, Phase 2 Study. Lancet Respir Med (2015) 3(4):301–9. doi: 10.1016/S2213-2600(15)00092-2
5. Pardoll DM. The Blockade of Immune Checkpoints in Cancer Immunotherapy. Nat Rev Cancer (2012) 12(4):252–64. doi: 10.1038/nrc3239
6. Mok TS, Wu Y-L, Kudaba I, Kowalski DM, Cho BC, Turna HZ, et al. Pembrolizumab Versus Chemotherapy for Previously Untreated, PD-L1-Expressing, Locally Advanced or Metastatic Non-Small-Cell Lung Cancer (KEYNOTE-042): A Randomised, Open-Label, Controlled, Phase 3 Trial. Lancet (2019) 393(10183):1819–30. doi: 10.1016/S0140-6736(18)32409-7
7. Hunter KA, Socinski MA, Villaruz LC. PD-L1 Testing in Guiding Patient Selection for PD-1/PD-L1 Inhibitor Therapy in Lung Cancer. Mol Diagnosis& Ther (2018) 22(1):1–10. doi: 10.1007/s40291-017-0308-6
8. Adams S, Schmid P, Rugo H, Winer E, Loirat D, Awada A, et al. Pembrolizumab Monotherapy for Previously Treated Metastatic Triple-Negative Breast Cancer: Cohort A of the Phase II KEYNOTE-086 Study. Ann Oncol (2019) 30(3):397–404. doi: 10.1093/annonc/mdy517
9. Schmid P, Salgado R, Park Y, Muñoz-Couselo E, Kim S, Sohn J, et al. Pembrolizumab Plus Chemotherapy as Neoadjuvant Treatment of High-Risk, Early-Stage Triple-Negative Breast Cancer: Results From the Phase 1b Open-Label, Multicohort KEYNOTE-173 Study. Ann Oncol (2020) 31(5):569–81. doi: 10.1016/j.annonc.2020.01.072
10. Labeit S, Labeit D, Granzier H. Titin Gene (TTN): Description of the Gene Coding for Titin, a Giant Protein of Critical Importance for Myofibrillar Integrity and Elasticity in Vertebrate Striated Muscle. In: eLS (2018). p. 1–6. doi: 10.1002/9780470015902.a0005021.pub3
11. Kellermayer D, Smith JE, Granzier H. Titin Mutations and Muscle Disease. Pflugers Archiv Eur J Physiol (2019) 471(5):673–82. doi: 10.1007/s00424-019-02272-5
12. Jia Y, Duan Y, Liu T, Wang X, Lv W, Wang M, et al. LncRNA TTN-AS1 Promotes Migration, Invasion, and Epithelial Mesenchymal Transition of Lung Adenocarcinoma via Sponging miR-142-5p to Regulate CDK5. Cell Death disease (2019) 10(8):1–13. doi: 10.1038/s41419-019-1811-y
13. Zhu Y, Yang Z, Luo H-X. Long Noncoding RNA TTN-AS1 Promotes the Proliferation and Migration of Prostate Cancer by Inhibiting miR-1271 Level. Eur Rev Med Pharmacol Sci (2019) 23(24):10678–84. doi: 10.26355/eurrev_202102_24813
14. Feng H, Wang Q, Xiao W, Zhang B, Jin Y, Lu H. LncRNA TTN-AS1 Regulates miR-524-5p and RRM2 to Promote Breast Cancer Progression. OncoTargets Ther (2020) 13:4799. doi: 10.2147/OTT.S243482
15. Tang W, Wang D, Shao L, Liu X, Zheng J, Xue Y, et al. LINC00680 and TTN-AS1 Stabilized by EIF4A3 Promoted Malignant Biological Behaviors of Glioblastoma Cells. Mol Therapy-Nucleic Acids (2020) 19:905–21. doi: 10.1016/j.omtn.2019.10.043
16. Fu D, Lu C, Qu X, Li P, Chen K, Shan L, et al. LncRNA TTN-AS1 Regulates Osteosarcoma Cell Apoptosis and Drug Resistance via the miR-134-5p/MBTD1 Axis. Aging (2019) 11(19):8374. doi: 10.18632/aging.102325
17. Lin C, Zhang S, Wang Y, Wang Y, Nice E, Guo C, et al. Functional Role of a Novel Long Noncoding RNA TTN-AS1 in Esophageal Squamous Cell Carcinoma Progression and Metastasis. Clin Cancer Res (2018) 24(2):486–98. doi: 10.1158/1078-0432.CCR-17-1851
18. Falcon T, Freitas M, Mello AC, Coutinho L, Alvares-da-Silva MR, Matte U. Analysis of the Cancer Genome Atlas Data Reveals Novel Putative ncRNAs Targets in Hepatocellular Carcinoma. BioMed Res Int (2018) 2018:2864120. doi: 10.1155/2018/2864120
19. Chen P, Wang R, Yue Q, Hao M. Long non-Coding RNA TTN-AS1 Promotes Cell Growth and Metastasis in Cervical Cancer via miR-573/E2f3. Biochem Biophys Res Commun (2018) 503(4):2956–62. doi: 10.1016/j.bbrc.2018.08.077
20. Cui Z, Luo Z, Lin Z, Shi L, Hong Y, Yan C. Long non-Coding RNA TTN-AS1 Facilitates Tumorigenesis of Papillary Thyroid Cancer Through Modulating the miR-153-3p/ZNRF2 Axis. J Gene Med (2019) 21(5):e3083. doi: 10.1002/jgm.3083
21. Dong M, Peng S, Yuan Y, Luo H. LncRNA TTN-AS1 Contributes to Gastric Cancer Progression by Acting as a Competing Endogenous RNA of miR-376b-3p. Neoplasma (2019) 66(4):564–75. doi: 10.4149/neo_2018_180927N721
22. Cheng X, Yin H, Fu J, Chen C, An J, Guan J, et al. Aggregate Analysis Based on TCGA: TTN Missense Mutation Correlates With Favorable Prognosis in Lung Squamous Cell Carcinoma. J Cancer Res Clin Oncol (2019) 145(4):1027–35. doi: 10.1007/s00432-019-02861-y
23. Rhodes DR, Kalyana-Sundaram S, Mahavisno V, Varambally R, Yu J, Briggs BB, et al. Oncomine 3.0: Genes, Pathways, and Networks in a Collection of 18,000 Cancer Gene Expression Profiles. Neoplasia (2007) 9(2):166–80. doi: 10.1593/neo.07112
24. Li T, Fu J, Zeng Z, Cohen D, Li J, Chen Q, et al. TIMER2. 0 for Analysis of Tumor-Infiltrating Immune Cells. Nucleic Acids Res (2020) 48(W1):W509–W14. doi: 10.1093/nar/gkaa407
25. Győrffy B, Surowiak P, Budczies J, Lánczky A. Online Survival Analysis Software to Assess the Prognostic Value of Biomarkers Using Transcriptomic Data in non-Small-Cell Lung Cancer. PLoS One (2013) 8(12):e82241. doi: 10.1371/journal.pone.0082241
26. Nagy Á, Munkácsy G, Győrffy B. Pancancer Survival Analysis of Cancer Hallmark Genes. Sci Rep (2021) 11(1):1–10. doi: 10.1038/s41598-021-84787-5
27. Mizuno H, Kitada K, Nakai K, Sarai A. PrognoScan: A New Database for Meta-Analysis of the Prognostic Value of Genes. BMC Med Genomics (2009) 2(1):1–11. doi: 10.1186/1755-8794-2-18
28. Cerami E, Gao J, Dogrusoz U, Gross BE, Schultz N. The Cbio Cancer Genomics Portal: An Open Platform for Exploring Multidimensional Cancer Genomics Data. Cancer Discov (2012) 2(5):401–4. doi: 10.1158/2159-8290.CD-12-0095
29. Tomczak K, Czerwińska P, Wiznerowicz M. The Cancer Genome Atlas (TCGA): An Immeasurable Source of Knowledge. Contemp Oncol (2015) 19(1A):A68. doi: 10.5114/wo.2014.47136
30. Uhlén M, Fagerberg L, Hallström BM, Lindskog C, Oksvold P, Mardinoglu A, et al. Tissue-Based Map of the Human Proteome. Science (2015) 347(6220):1260419. doi: 10.1126/science.1260419
31. Uhlen M, Zhang C, Lee E Sjöstedt S, Fagerberg L, Bidkhori G, Benfeitas M Arif R, et al. A Pathology Atlas of the Human Cancer Transcriptome. Science (2017) 357(6352):660–. doi: 10.1126/science.aan2507
32. Yuan H, Yan M, Zhang G, Liu W, Deng C, Liao G, et al. CancerSEA: A Cancer Single-Cell State Atlas. Nucleic Acids Res (2019) 47(D1):D900–D8. doi: 10.1093/nar/gky939
33. Tang Z, Li C, Kang B, Gao G, Li C, Zhang Z. GEPIA: A Web Server for Cancer and Normal Gene Expression Profiling and Interactive Analyses. Nucleic Acids Res (2017) 45(W1):W98–W102. doi: 10.1093/nar/gkx247
34. Evila A, Vihola A, Sarparanta J, Raheem O, Sandell S, Eymard B, et al. Atypical Phenotypes in Titinopathies Explained by Second Titin Mutations and Compound Heterozygosity. Neuromuscular Disord (2013) 23(9-10):758–9. doi: 10.1016/j.nmd.2013.06.436
35. Adamson IY, Bowden DH. Derivation of Type 1 Epithelium From Type 2 Cells in the Developing Rat Lung. Lab Invest (1975) 32(6):736–45.
36. Evans MJ, Cabral LJ, Stephens RJ, Freeman GJE. Transformation of Alveolar Type 2 Cells to Type 1 Cells Following Exposure to NO2. Exp And Mol Pathology (1975) 22(1):142–50. doi: 10.1016/0014-4800(75)90059-3
37. Swanton C, Govindan R. Clinical Implications of Genomic Discoveries in Lung Cancer. New Engl J Med (2016) 374(19):1864–73. doi: 10.1056/NEJMra1504688
38. Xu X, Rock JR, Lu Y, Futtner C, Schwab B, Guinney J, et al. Evidence for Type II Cells as Cells of Origin of K-Ras–induced Distal Lung Adenocarcinoma. Proc Of Natl Acad Of Sci Of United States Of America (2012) 109(13):4910–5. doi: 10.1073/pnas.1112499109
39. Lin C, Song H, Huang C, Yao E, Rhodora G, Xu SM, et al. Alveolar Type II Cells Possess the Capability of Initiating Lung Tumor Development. PLoS One (2012) 7(12):e53817. doi: 10.1371/journal.pone.0053817
40. Cheung WK, Nguyen DX. Lineage Factors and Differentiation States in Lung Cancer Progression. Oncogene (2015) 34(47):5771–80. doi: 10.1038/onc.2015.85
41. Wang Z, Li Z, Zhou K, Wang C, Jiang L, Zhang L, et al. Deciphering Cell Lineage Specification of Human Lung Adenocarcinoma With Single-Cell RNA Sequencing. Nat Commun (2021) 12(1):1–15. doi: 10.1038/s41467-021-26770-2
42. Mainardi S, Mijimolle N, Francoz S, Vicente-Duenas C, Sanchez-Garcia I, Barbacid M. Identification of Cancer Initiating Cells in K-Ras Driven Lung Adenocarcinoma. Proc Of Natl Acad Of Sci Of United States Of America (2014) 111(1):255–60. doi: 10.1073/pnas.1320383110
43. Travaglini KJ, Nabhan AN, Penland L, Sinha R, Krasnow MA. A Molecular Cell Atlas of the Human Lung From Single-Cell RNA Sequencing. Nat Biomed Engineering (2020) 587(7835):1–7. doi: 10.1038/s41586-020-2922-4
44. Azimi F, Scolyer RA, Rumcheva P, Moncrieff M, Murali R, McCarthy SW, et al. Tumor-Infiltrating Lymphocyte Grade Is an Independent Predictor of Sentinel Lymph Node Status and Survival in Patients With Cutaneous Melanoma. J Clin Oncol (2012) 30(21):2678–83. doi: 10.1200/JCO.2011.37.8539
45. Ohtani H. Focus on TILs: Prognostic Significance of Tumor Infiltrating Lymphocytes in Human Colorectal Cancer. Cancer Immun (2007) 7(1):4.
46. Jia Q, Wang J, He N, He J, Zhu B. Titin Mutation Associated With Responsiveness to Checkpoint Blockades in Solid Tumors. European Journal of Immunology (2019) 49(10):1732. doi: 10.1172/jci.insight.127901
47. Su C, Wang X, Zhou J, Zhao J, Zhou F, Zhao G, et al. Titin Mutation in Circulatory Tumor DNA is Associated With Efficacy to Immune Checkpoint Blockade in Advanced Non-Small Cell Lung Cancer. Trans Lung Cancer Res (2021) 10(3):1256. doi: 10.21037/tlcr-20-1118
Keywords: lung Adenocarcinoma, TTN, prognosis, biomarker, NSCLC
Citation: Chen J, Wen Y, Su H, Yu X, Hong R, Chen C and Su C (2022) Deciphering Prognostic Value of TTN and Its Correlation With Immune Infiltration in Lung Adenocarcinoma. Front. Oncol. 12:877878. doi: 10.3389/fonc.2022.877878
Received: 17 February 2022; Accepted: 24 May 2022;
Published: 08 July 2022.
Edited by:
Mohamed Rahouma, NewYork-Presbyterian, United StatesReviewed by:
Jin Wang, Jinan University, ChinaShubhamoy Ghosh, University of California, Los Angeles, United States
Copyright © 2022 Chen, Wen, Su, Yu, Hong, Chen and Su. This is an open-access article distributed under the terms of the Creative Commons Attribution License (CC BY). The use, distribution or reproduction in other forums is permitted, provided the original author(s) and the copyright owner(s) are credited and that the original publication in this journal is cited, in accordance with accepted academic practice. No use, distribution or reproduction is permitted which does not comply with these terms.
*Correspondence: Chunxia Su, c3VzdV9tYWlsQDEyNi5jb20=; Chang Chen, Y2hlbnRob3JhY2ljQDE2My5jb20=
†These authors have contributed equally to this work
 Jianing Chen
 Yaokai Wen
 Hang Su3†
 Xin Yu
 Chunxia Su