
94% of researchers rate our articles as excellent or good
Learn more about the work of our research integrity team to safeguard the quality of each article we publish.
Find out more
ORIGINAL RESEARCH article
Front. Oncol., 13 January 2023
Sec. Radiation Oncology
Volume 12 - 2022 | https://doi.org/10.3389/fonc.2022.870432
This article is part of the Research TopicMachine Learning in Radiation Therapy for Lung CancerView all 6 articles
 Nika Guberina1*
 Christoph Pöttgen1
 Alina Santiago1Sabine Levegrün1
 Sima Qamhiyeh1
 Toke Printz Ringbaek1
 Maja Guberina1Wolfgang Lübcke1Frank Indenkämpen1
 Martin Stuschke1,2
Purpose: This study aimed to assess interfraction stability of the delivered dose distribution by exhale-gated volumetric modulated arc therapy (VMAT) or intensity-modulated arc therapy (IMAT) for lung cancer and to determine dominant prognostic dosimetric and geometric factors.
Methods: Clinical target volume (CTVPlan) from the planning CT was deformed to the exhale-gated daily CBCT scans to determine CTVi, treated by the respective dose fraction. The equivalent uniform dose of the CTVi was determined by the power law (gEUDi) and cell survival model (EUDiSF) as effectiveness measure for the delivered dose distribution. The following prognostic factors were analyzed: (I) minimum dose within the CTVi (Dmin_i), (II) Hausdorff distance (HDDi) between CTVi and CTVPlan, (III) doses and deformations at the point in CTVPlan at which the global minimum dose over all fractions per patient occurs (PDmin_global_i), and (IV) deformations at the point over all CTVi margins per patient with the largest Hausdorff distance (HDPworst). Prognostic value and generalizability of the prognostic factors were examined using cross-validated random forest or multilayer perceptron neural network (MLP) classifiers. Dose accumulation was performed using back deformation of the dose distribution from CTVi to CTVPlan.
Results: Altogether, 218 dose fractions (10 patients) were evaluated. There was a significant interpatient heterogeneity between the distributions of the normalized gEUDi values (p<0.0001, Kruskal–Wallis tests). Accumulated gEUD over all fractions per patient was 1.004–1.023 times of the prescribed dose. Accumulation led to tolerance of ~20% of fractions with gEUDi <93% of the prescribed dose. Normalized Dmin >60% was associated with predicted gEUD values above 95%. Dmin had the highest importance for predicting the gEUD over all analyzed prognostic parameters by out-of-bag loss reduction using the random forest procedure. Cross-validated random forest classifier based on Dmin as the sole input had the largest Pearson correlation coefficient (R=0.897) in comparison to classifiers using additional input variables. The neural network performed better than the random forest classifier, and the gEUD values predicted by the MLP classifier with Dmin as the sole input were correlated with the gEUD values characterized by R=0.933 (95% CI, 0.913–0.948). The performance of the full MLP model with all geometric input parameters was slightly better (R=0.952) than that based on Dmin (p=0.0034, Z-test).
Conclusion: Accumulated dose distributions over the treatment series were robust against interfraction CTV deformations using exhale gating and online image guidance. Dmin was the most important parameter for gEUD prediction for a single fraction. All other parameters did not lead to a markedly improved generalizable prediction. Dosimetric information, especially location and value of Dmin within the CTVi, are vital information for image-guided radiation treatment.
Gated radiotherapy in plain free breathing delivered during the exhalation phase is efficient with duty cycles of 30%–50% of the breathing cycle. In comparison to ungated irradiation, gated radiotherapy can substantially reduce the residual tumor motion during irradiation and consequently the doses to organs at risk (1–3). By nature, the major tumor movement is observed in lesions located adjacent to the heart, aorta, or diaphragm (4). Gated cone beam CTs (CBCT) at the end of expiration can further enhance the precision of lung tumor localization by reducing motion artifacts (5). In the past, image-guided radiotherapy based on CBCTs was primarily performed by matching implanted markers (6), a rigid 3–6-degrees-of-freedom carina or bony match (7, 8) or a rigid soft-tissue match. The latter may be achieved automatically or by aligning the center of mass and orientation of the small peripheral targets (9–12). Motion at distinct points, e.g., implanted markers or center of masses of target volumes, were traditionally used for PTV margin calculation under simplifying assumptions (13). The real-time position management (RPM) respiratory gating system allows reproducible tumor gating as external marker (14). In addition, gated radiotherapy can reduce interfractional setup uncertainties (15). However, for larger target volumes, considerable interfractional displacements (>5 mm) may be observed between the primary tumor and draining lymph nodes, characterized by systematic and random errors (10, 16). Furthermore, anatomical changes owing to tumor shrinkage can occur throughout the course of curative-intended radiation therapy. These make adaptations of the target volume necessary in order to protect normal tissue (17–21).
The purpose of this analysis is the characterization of the dosimetric and geometric parameters related to the residual deformations of the clinical target volume (CTV) in prefractional, exhale-gated CBCT scans after 6-degrees-of-freedom image guidance. Furthermore, the influence of the residual deformations on the delivered equivalent uniform dose (EUD) at each dose fraction shall be examined. Fast identification of relevant features related to the effectiveness of the dose fraction during online image guidance of radiotherapy is of high importance in order to minimize avoidable deviations of the delivered from the prescribed EUD to the target volume. The EUD represents the homogeneously delivered dose distribution within the target that leads to the same clonogenic survival fraction; thus, the same level of cell kill, as the actual non-homogeneously delivered, absorbed dose distribution (22). The EUD is determined according to the phenomenological power law model (gEUD) (23) or a cell survival model as effectiveness measure (EUDSF) (22). As the final end point, the accumulated dose shall be determined over all fractions per patient to assess the impact of residual deformations on the overall effectiveness of the treatment series and to find evidence for a possible reduction of clinical PTV margins below 5 mm. The prognostic performance of geometric features characterizing the residual deformations of the CTV and dosimetric characteristics at distinct points of the CTV shall be analyzed to predict the gEUD and EUDSF per dose fraction.
The study was approved by the local ethics committee (20-9293-BO). Patients with histologically confirmed non-small or small-cell lung cancer who underwent either definitive or neoadjuvant radiochemotherapy after interdisciplinary tumor board consensus and radiotherapeutic indication were included into this dosimetric study. Depending on the optimal plan solution, patients were treated with a hyper-fractionated [1.5 Gy bid (twice a day)] or with a conventionally fractionated [(2 Gy qed (once a day)] therapy regimen in free breathing gated delivery during the exhalation phase according to clinical standards.
Helical, contrast-enhanced computed tomography (CT), positron emission tomography/computed tomography ([18F]FDG-PET/CT), EBUS-TBNA (ultrasound-controlled transbronchial needle aspiration), and clinical assessment (viz., laboratory parameters, ECOG performance status, and lung function parameters) were completed prior to treatment planning. After visual and acoustic breathing coaching, a prospective gated planning CT in expiration was acquired with contrast medium (gating threshold, below one-third of the inspiratory amplitude). The planning CT was acquired in supine position in exhalation and as a 4D-CT at a multislice CT scanner (Siemens Healthineers, Erlangen, Forchheim, Germany). Minimization of motion may be achieved by a rigid half-body mask (in the present study, 9/10 patients). Treatment planning was performed with the help of the treatment planning system Eclipse (version V15.5, Varian Medical Systems, Palo Alto, USA). The target volume definition was according to RTOG0617 (24). The IASLC lung cancer map (25) and the Japanese Society for Radiation Oncology atlas were used for the description of involved lymph node stations (26). For patients receiving induction chemotherapy, gross tumor volume (GTV) was delineated on the basis of the post-induction chemotherapy planning CT and on the initial pre-treatment contrast-enhanced imaging and the pretreatment PET/CT in order to account for infiltrated sites and initially involve critical structures such as bronchi and intrapulmonal vessels. CTV was contoured with 5–10 mm margins around the GTV not crossing anatomic boundaries. To consider setup errors, the PTV margin was set to 5 mm, which, in individual cases, could be adapted according to the daily CBCTs. Patients who underwent a definitive radiochemotherapy received a total dose of 60–66 Gy delivered once daily (2 Gy/F qed) with or without subsequent boost. In the neoadjuvant radiochemotherapy setting prior to thoracic surgery, a total dose of 45 Gy twice daily was administered. Treatment plans were optimized by qualified medical physicists with ACUROS XB dose calculation algorithm (implemented in treatment planning system Eclipse version 15.5.) using 6–8 MV photons and a 2×2×2 mm voxel grid. Dose prescription was in accordance with International Commission on Radiation Units and Measurement ICRU 83. PTV coverage was set to D80% ≥ 100% and D95% ≥ 98%. Thresholds for organs at risk and normal tissue dose–volume constraints for conventionally fractionated radiotherapy with concurrent chemotherapy were specified according the NCCN guideline, Version 1.2023 (27).
Treatment was delivered at a TrueBeam linac (Varian Medical Systems, Palo Alto, USA) equipped with a 6-degrees-of-freedom couch. Cone-beam computed tomography (CBCT) can be acquired by a gantry mounted X-ray line. All patients were treated with 6 or 8 MV photons using static field IMRT or volumetric modulated arc therapy technique (RapidArc, Varian Medical Systems, Palo Alto, USA), which enables favorable gradients around the target volume (28).
Free breathing gated delivery during the exhalation phase was provided with the help of real-time position management (RPM) respiratory gating system (Varian). Daily low-dose kV-CBCT scans also gated during the exhalation phase served for the online setup and online adaptation with the help of a 6D-positioning table at TrueBeam (Varian) and were used for the determination of interfractional CTV deformations (CTVi) compared to the planning CT (CTVplan). Further tools used for online image guidance were set up with anterior/posterior kV radiographs, breathing coaching to a flat stable respiration at the expiration plateau, and anterior/posterior fluoroscopy with delineation of the diaphragm for documentation of the respiration amplitude relative to the RPM marker.
In order to examine the daily deviations from patient anatomy, the planning CT, which served as reference, was deformed offline to the CBCTi scans after alignment by the prefractional, rigid online match clinically applied (Eclipse v15.5, Varian). The matching region of interest was centered around the carina. The deformable registration implemented in Eclipse (Eclipse v15.5, Varian) relies on a modified, accelerated demons-based algorithm (29, 30). The deformed CTVi was copied back to the planning CT along the rigid online registration.
The Hausdorff distance (HDDi) between CTVi and CTVPlan was determined by the radius of an isotropic expansion of CTVPlan as the minimum expansion, so that the expanded CTVplan contained CTVi. HDPworst is the Hausdorff point (HDPi) with the largest HDDi over all fractions per patient. We determined the deformations of the global HDPworst_i over all fractions by determining the position of HDPworst on CTVplan by the inverse deformation vector to HDPworst and by recording the deformation fields from CTVplan to CTVi at that point over all fractions. In addition to HDPworst the dose fraction with the smallest minimum dose in the CTVi over all dose fractions per patient j was determined, and the coordinates of the respective global minimum point PDmin_global per patient j was determined on CTVplan by the inverse deformation vector to this point. Dmin_global is the global minimum overall fractions of the minimum doses in the deformed CTVi for each fraction (Dmin_CTVi); propagating PDmin_global to all CTVis by the respective deformation fields defined the coordinates of the PDmin_global_i points on the CTVi and allowed the recording of the doses at PDmin_global_i. Furthermore, we determined for each fraction i the scalar product of the deformation vector from PDmin_global to PDmin_global_i and the unit deformation vector from PDmin_global to PDmin_global_x with x as the fraction in which the global minimum dose was observed (ScalarPDmin_global_i_x) (Supplementary Figure S1, new). This feature is a surrogate for the component of deformation to PDmin_global_i in the direction of the steepest dose gradient.
In general, dose–volume histograms for the CTVi were obtained from the dose distribution calculated on CTplan. According to the static dose cloud approximation, the dose distribution might not be influenced by the small deformations between CTplan and CBCTi (31). To check this assumption, the dose distribution was recalculated on the planning CT deformed by the deformation matrix to CBCTi. The ARIA deformable registrations were exported to MIM Maestro software (MIM Software Inc., Cleveland, OH) to re-raster the CT data set into parallel layers for dose calculation. Dose was calculated with the Acuros XB algorithm on this re-rastered deformed planning CT. Gamma analysis of two given dose distributions was performed in MIM.
In order to estimate the overall effectiveness of the delivered dose distribution to the CTVi, the original equivalent uniform dose (EUD) based on the clonogen survival model (EUDSF) (22) and the phenomenological power law model as (gEUD) (23, 32) was applied to the dose–volume histogram data for the CTVi (tissue-specific parameter a= −20 for tumor). For the calculation of the EUDSF, the alpha/beta value was determined as 4 Gy according to Nix et al. (33). The cell number per tumor was regarded as 100,000,000, and a uniform cell density was assumed (34). SF2 resulting in tumor control rates of 50% at 60 Gy with 2 Gy per fraction was calculated as 0.534598229. For the calculation of the gEUD and EUDSF values, dose–volume histograms (DVHs) for the deformed CTVi were written out of the Eclipse system and calculated in SAS (SAS Institute, Cary, NC).
A central component for dose accumulation is deformable image registration (DIR). The AAPM Task Group 132 has produced guidelines for quality control of DIR algorithms, which state that results should be qualitatively assessed by image fusion of the deformed image and the reference, with emphasis on matching anatomical landmarks and boundaries (35). Two image deformation algorithms were used here, namely, Varian’s SmartAdapt V 13.6, based on an accelerated demon algorithm (36), and hybrid intensity- and structure-based algorithms from MIM Software, Cleveland, OH (37). In this study, all deformed images and structures were analyzed by an experienced thoracic radiologist and radiation oncologist. In particular, CTV boundaries were analyzed in relation to anatomical landmarks, such as mediastinal landmarks or the pericardium. In case of important violations of these boundaries, the margins of the CTVi were manually corrected in order to respect this relation. In all cases in which the supervised CTVi was manually corrected, the deformation vector field was updated using the hybrid structure-based deformation algorithm in MIM. Dose accumulation was performed with the help of the MIM software. The dose cubes on the planning CT were deformed with the inverse deformation matrix from the planning CT to the CBCTi obtained from the clinical Eclipse planning software for the manually uncorrected CTVi or by the deformation matrix of the supervised corrected CTVi to the CTV by the hybrid intensity and structure based algorithm from MIM software. These deformed dose cubes for each fraction were summed up to the cumulative dose. This cumulative dose cube was exported to Eclipse, and the DVH for the original CTVplan was determined (Supplementary Figure S2 new).
For statistical analyses, SAS software version 9.4, SAS/STAT 15.1 (SAS Institute, Cary, NC) and SPSS Statistics (version 26, IBM, Armonk, NY) were applied. p-values were considered two-sided, and p<0.05 was considered as statistically significant. Various SAS procedures including FREQ, UNIVARIATE, NPAR1WAY, CORR, GLM, HPNEURAL, and HPFOREST were used.
The high-performance analytical procedures HPFOREST and HPNEURAL of SAS Enterprise Miner 14.3 were used to create the random forest (RF) and multilayer perceptron neural network (MLP) models (SAS Institute, Cary, NC) (SAS Institute Inc. 2020, SAS® Interprise Miner 15.2™:: High performance Procedures, SAS Institute Inc., Cary, NC). The sensitivity of MLP classifier was calibrated using the relative weight factor of 2 for gEUDi values between 90% and 95% (relative weight=2) and 10 for the identification of gEUDi values <90%. The relative weights of all other gEUDi values were 1.
To assess the generalization performance of the classifier, 10-fold cross-validation was used, leaving out each patient and scoring the data from this patient by the classifier trained on the data from the other patients. This was repeated 10 times for all leave-out patients. As HPNEURAL uses a validation data set to tune hyperparameters, nested cross-validation was used (38). The outer resampling trainings data sets contained data from nine patients and were subdivided into an inner loop trainings data set containing data from six patients and the inner loop validation data set containing data of the remaining three patients. The inner loop classifier with the best correlation between the predicted gEUDi and the true gEUDi values obtained directly from the dose–volume histograms for the nine patients in the outer resampling trainings set was used to score the leave-out patient. This leave-out patient in the test data set was unseen during classifier build.
The strength of a linear relation between the true gEUDi values calculated directly from the dose–volume histograms for the CTVi from the different fractions and the gEUDi values predicted by a classifier was assessed by the Pearson correlation coefficient. Correlation coefficients from either two MLP or random forest classifiers with different input variable sets were compared by a Z-test for dependent correlation coefficients (39). In addition, the variance explained by the predictive model based on cross-validation (VEcv) was examined (40). The performance of the classifiers by the VEcv measure using Dmin alone or the complete feature set as input was compared using the signed rank test.
Altogether, 218 fractions from 10 consecutive patients were included in this study (median number of CBCTi per patient, 12.00; mean, 13.82; range, 11–40; SD, 9.52). Mean patient age was 68.8 years (range, 54–83 years). Exhale-gated daily low-dose kV CBCT scans were performed for online image guidance using a 6-degrees-of-freedom table. All patients had histopathologically confirmed lung cancer (nine NSCLC and one SCLC) and underwent neoadjuvant (n=1) or definitive (n=9) radiochemotherapy treatment after interdisciplinary tumor board consensus. Mean FEV1 in lung function test at initial staging was 2.0 l (61.3%/set point). The clinical characteristics, tumor features, localization, and clinical target volumes of these patients are given in Table 1. After expert radiologists and radio-oncologists supervision, deformed CTVi boundaries were found as incorrect in 14/218 fractions, crossing afore-respected boundaries and therefore were manually corrected. All supervised and as reliable determined deformations were used for further analyses.
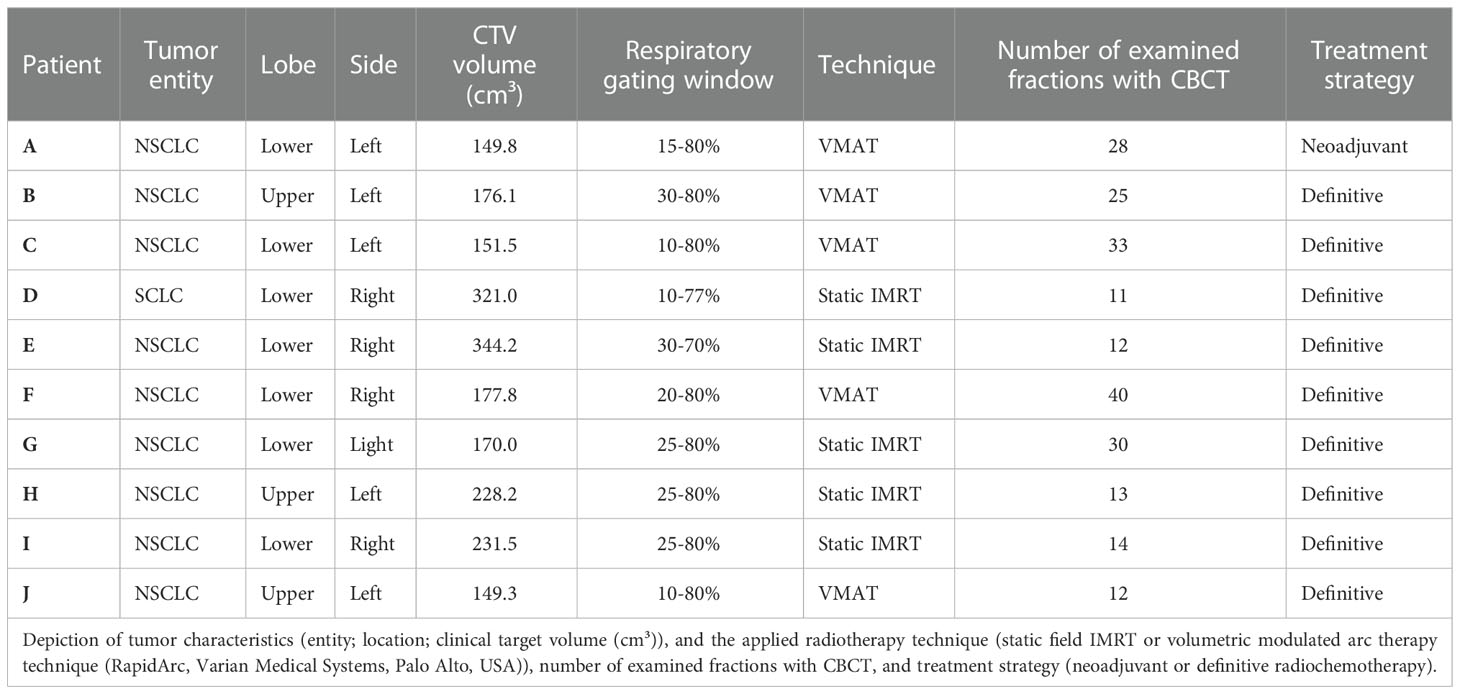
Table 1 Tumor characteristics and radiotherapy technique.
Figure 1 shows the empirical distribution functions of the gEUDi values for the deformed CTVi over the radiotherapy series for the different patients using the clinically applied dose distribution optimized on planning target volumes around the CTVPlan with a 5-mm margin. There was a significant interpatient heterogeneity between the gEUDi-distribution functions from the different patients (p < 0.0001, Kruskal–Wallis tests). All gEUDis were normalized to the prescribed dose. The median gEUDi over all fractions per patient fell in the narrow range between 1.004 and 1.037 for the different patients (Figures 1, 2). gEUDi for 11 of the 218 fractions from four patients fell below 93% of the prescribed dose. The dose gradients around the PTV were steeper around the superior and inferior surface of the PTV than at the equatorial surface at z-coordinates around the geometric center of the PTV. The median dose gradients between the 95% and the 70% isodose in cranial direction around the cranial and caudal direction at the caudal PTV border were 8.34%/mm (range, 5%/mm–12.5%/mm). The median normalized dose gradient in axial direction at z-coordinates around the geometric center of the PTV was 3.12%/mm (range, 1.92–6.25%/mm) toward the mediastinum and 2.5%/mm (range, 1.47–6.25%/mm) toward the lateral thorax.
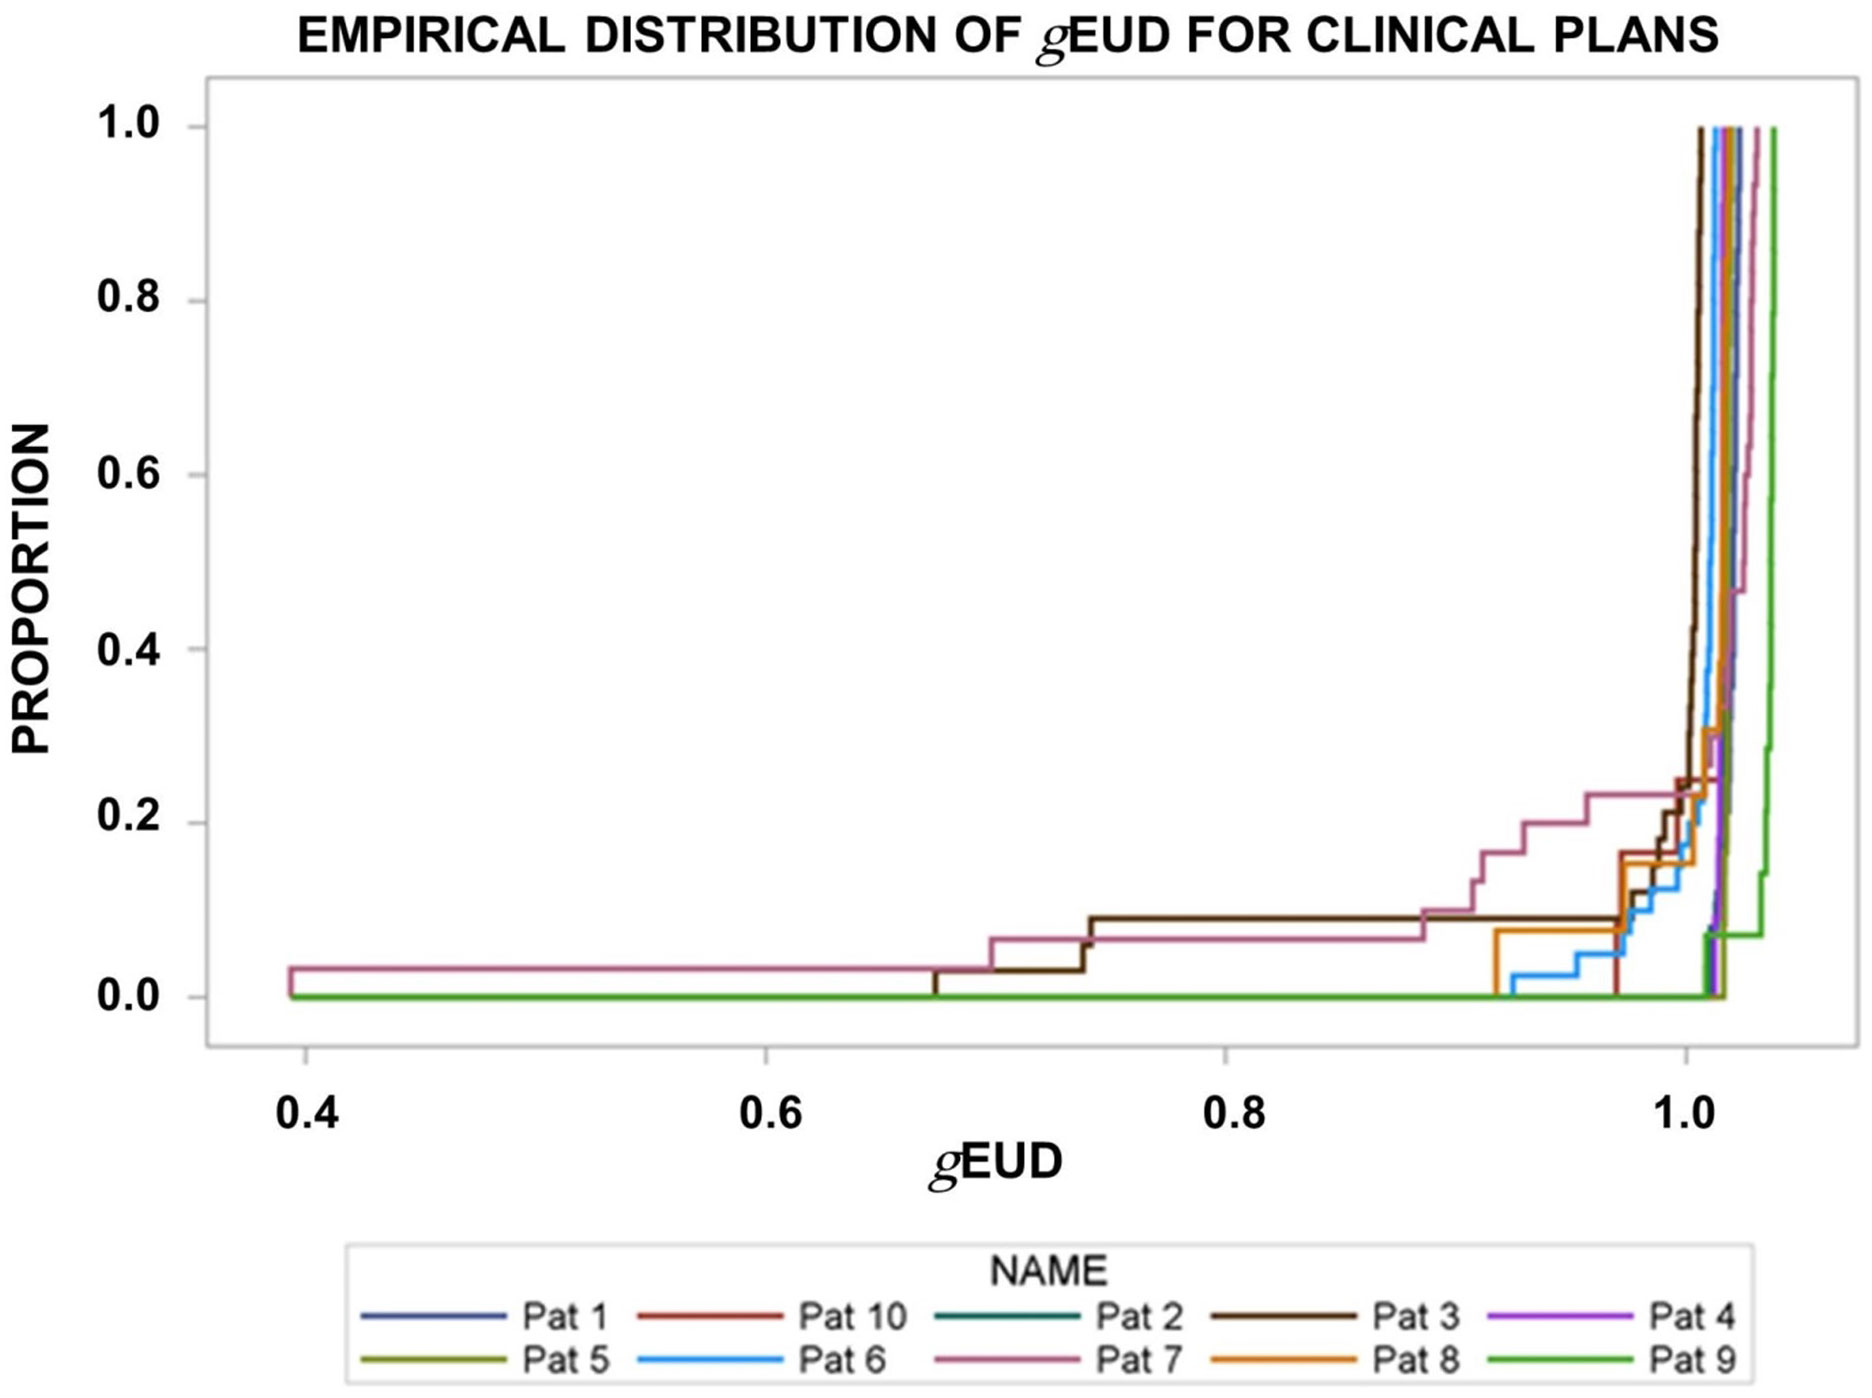
Figure 1 Empirical distribution functions of the generalized equivalent uniform dose (gEUDi) for the deformed CTVi on the pre-fraction cone beam CTs normalized by the prescribed dose. The clinically applied dose distributions were used. There was significant interpatient heterogeneity (p< 0.0001, Kruskal–Wallis test).
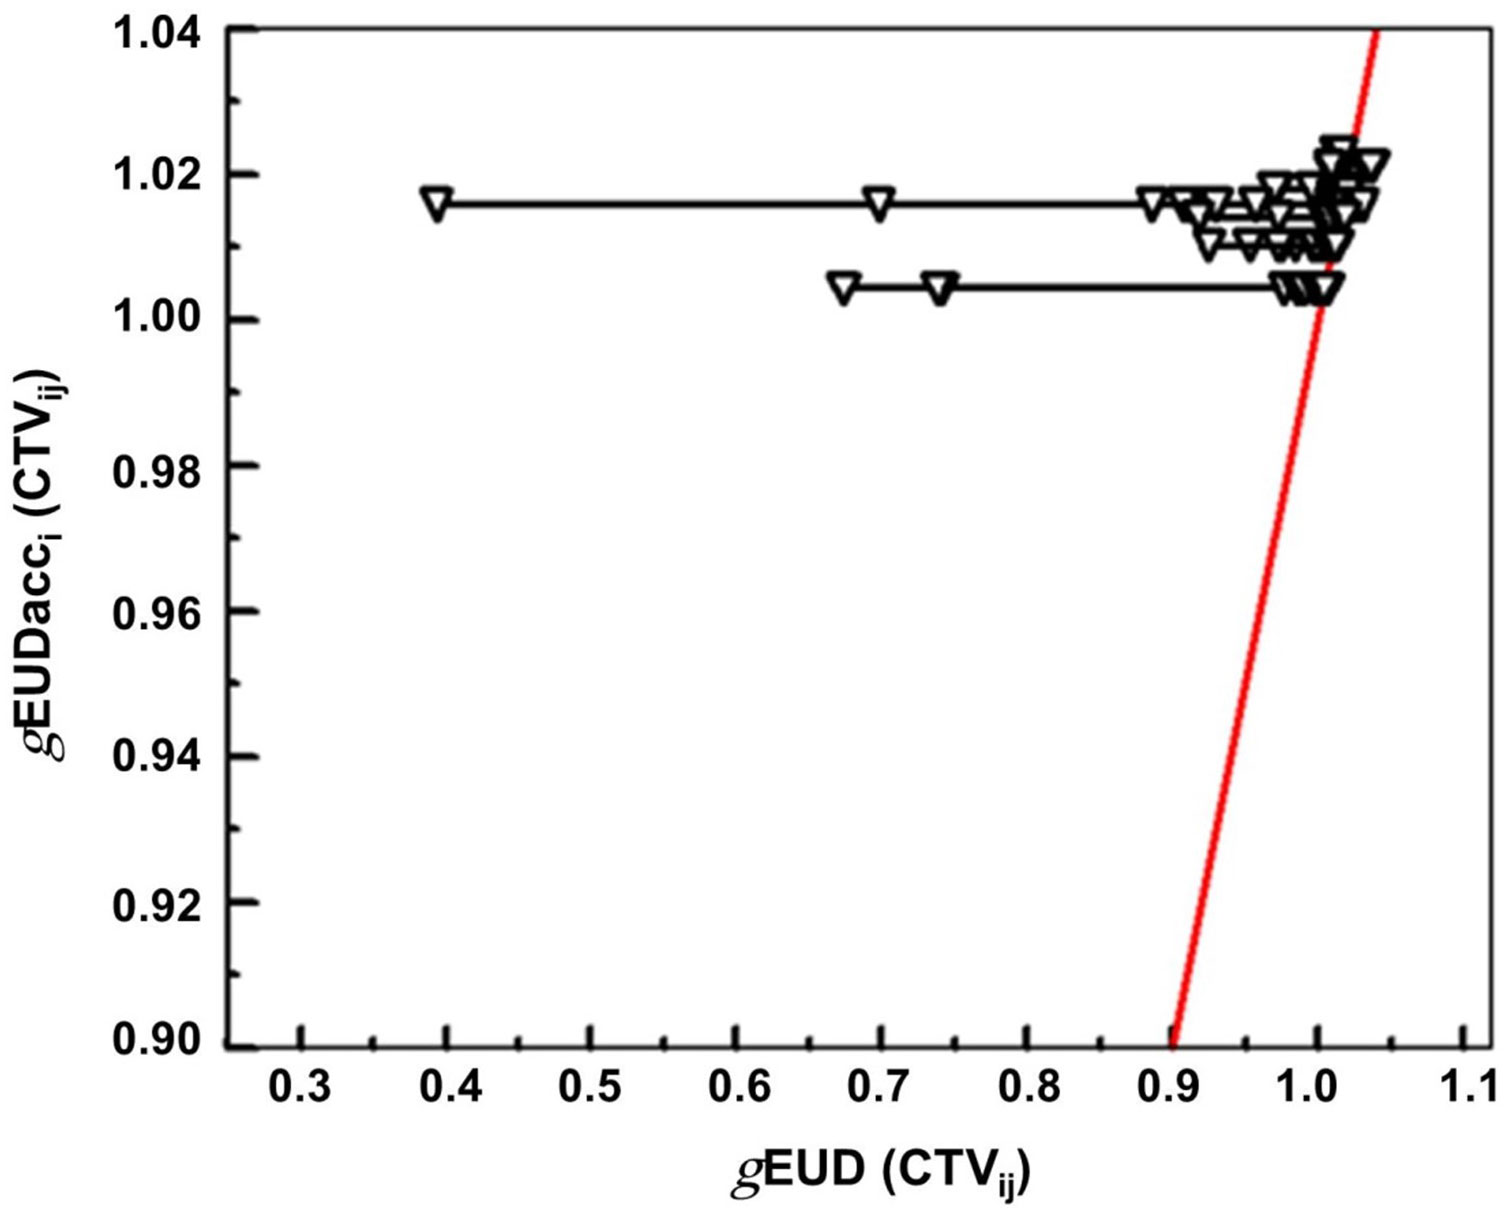
Figure 2 Plot of the normalized gEUDi values for the different dose fractions of a series versus the normalized gEUD for the accumulated dose distribution. The data are given for the clinical plan for the 10 patients. The red line represents the 1:1 line connecting the accumulated gEUDacc_j values for the different patients.
The static dose cloud approximation was analyzed in five fractions from three patients. The pass rate inside of the region of interest, i.e., CTV+15 mm, remained for the five examined fractions above 95% for the 3 mm distance to agreement (DTA) and 3% dose difference (DD) gamma criteria. The pass rates for the stricter 2 mm DTA, 2% DD criterion remained above 89%. The gEUD values calculated for the CTVi using the recalculated dose distributions on the deformed planning CTs deviated from those calculated from the original dose distribution from the planning CT by a median value of 1.6%.
For all patients, the gEUD of the accumulated dose distribution over all fractions (gEUDacc) remained above 100% of the prescription dose for the CTVPlan. Dose accumulation helped to raise the gEUDacc over all fractions per patient near the median of the gEUDi distribution overall fractions per patient (Table 2). Figure 2 shows the scatter plot for gEUDi (CTVij) versus the gEUDacci values. The red line is the 1:1 bisector line. This plot shows how tolerant the gEUDacc behaves against dose deviations at a single fraction leading to declines in gEUDi. gEUDacc for the accumulated dose distribution was stable against observed minimum doses of the accumulated dose distributions down to 72% of the prescribed dose. There was a good correlation between the gEUDi and EUDSFi values over all fractions and patients (Spearman rank correlation coefficient rs = 0.986, p < 0.0001). The best relation comprised an intercept of −0.35 ± 0.027 and a slope of 1.346 ± 0.027 (Figure 3).
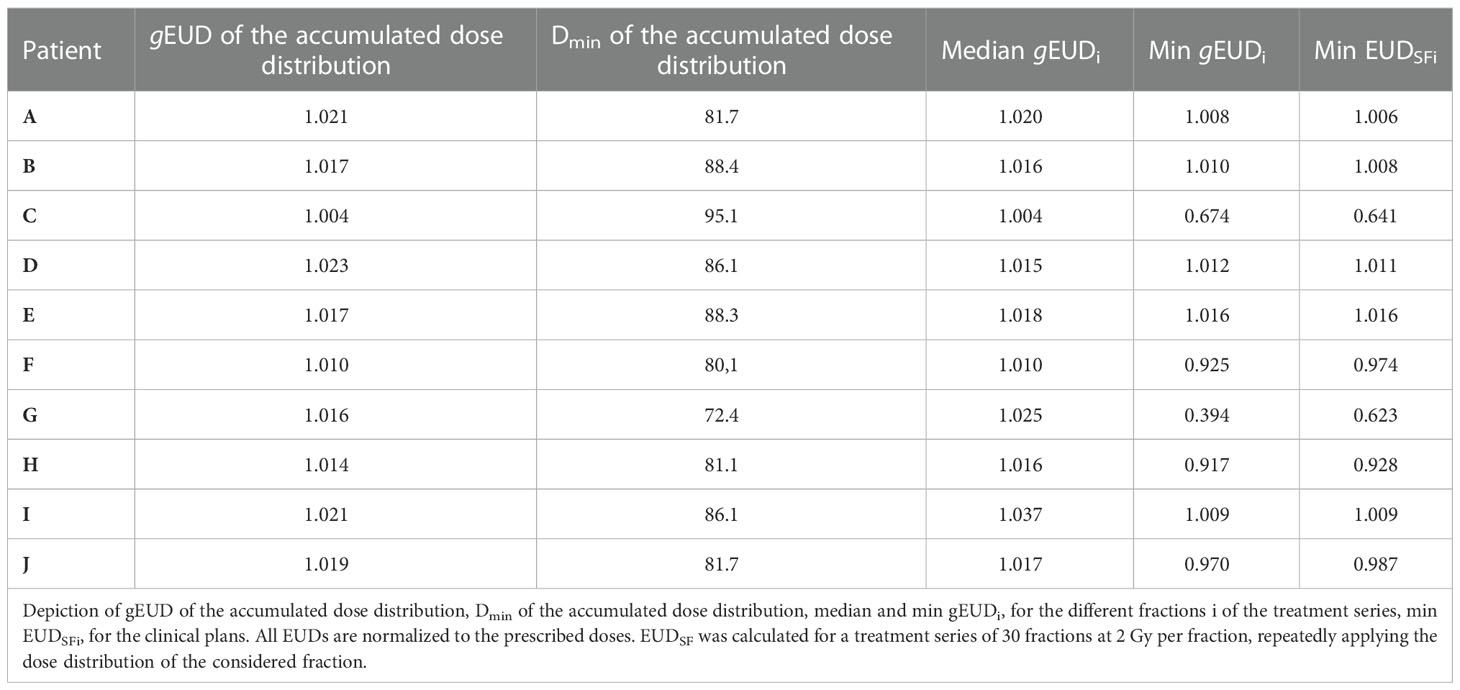
Table 2 Delivered dose parameters by the clinical plans and measures for the residual CTV deformations after image guidance.
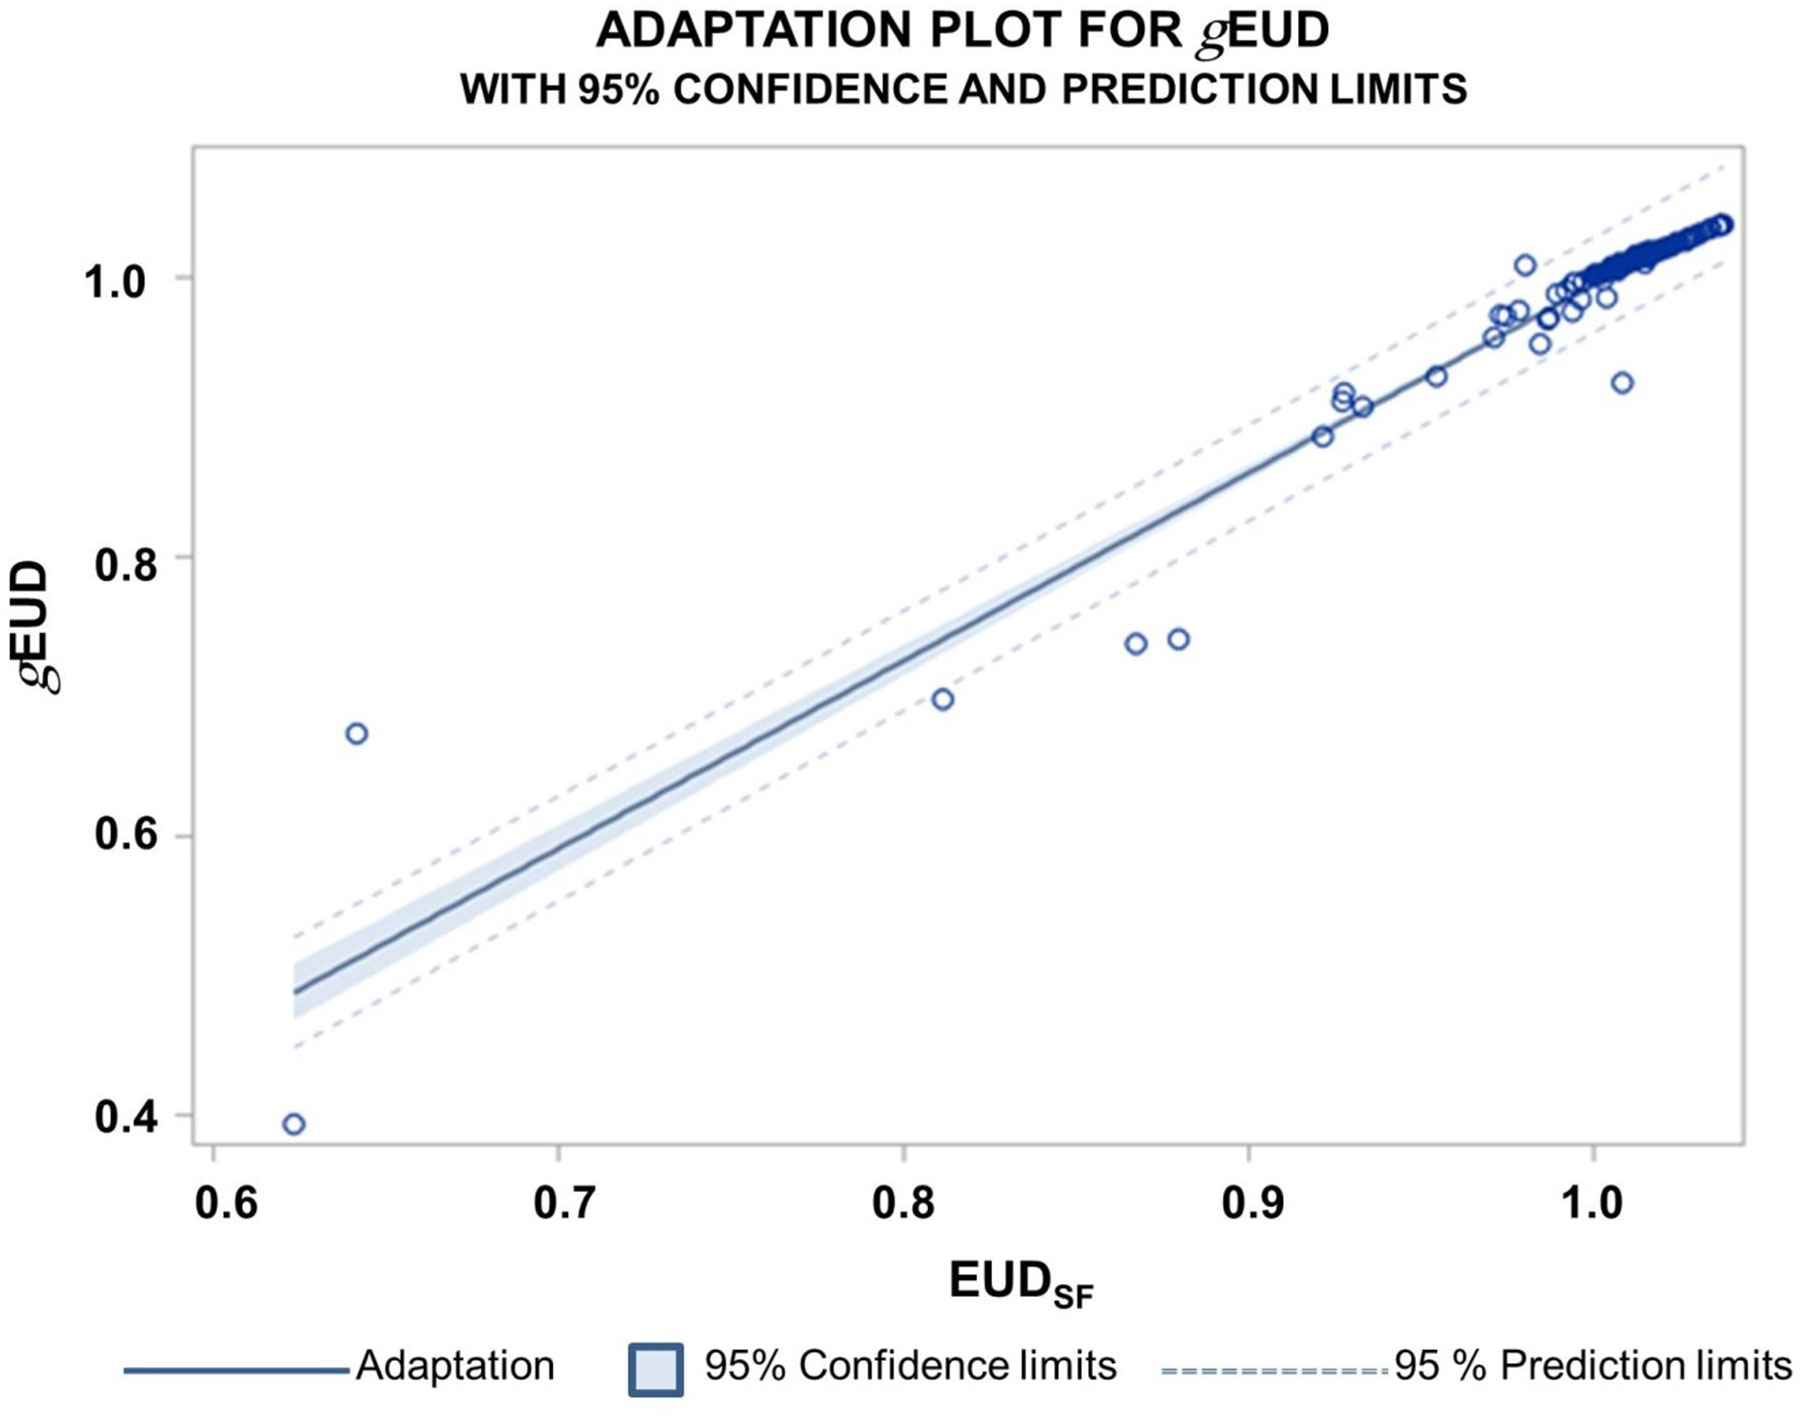
Figure 3 Relation between the gEUD normalized by the prescribed dose and normalized EUDSF values for the clinical PTV plans over all patients and all fractions. The normalized EUDSF values were calculated according to a cell survival model. The Spearman correlation coefficient was rs = 0.986; 95% confidence limits for the expected predicted values and for new predictions are indicated.
With respect to parameters characterizing the residual deformations of the CTVis, the Hausdorff distances (HDDi) as the maximum over the minimum distances between the deformed and original CTV borders were determined (Figure 4 new). Figure 5 depicts the empirical distribution functions (EDFs) for the HDDi values for different patients with significant differences from patient to patient (p < 0.0001, Kruskal–Wallis test). The median HDDi values for the different patients ranged from 3.0 to 7.0 mm.
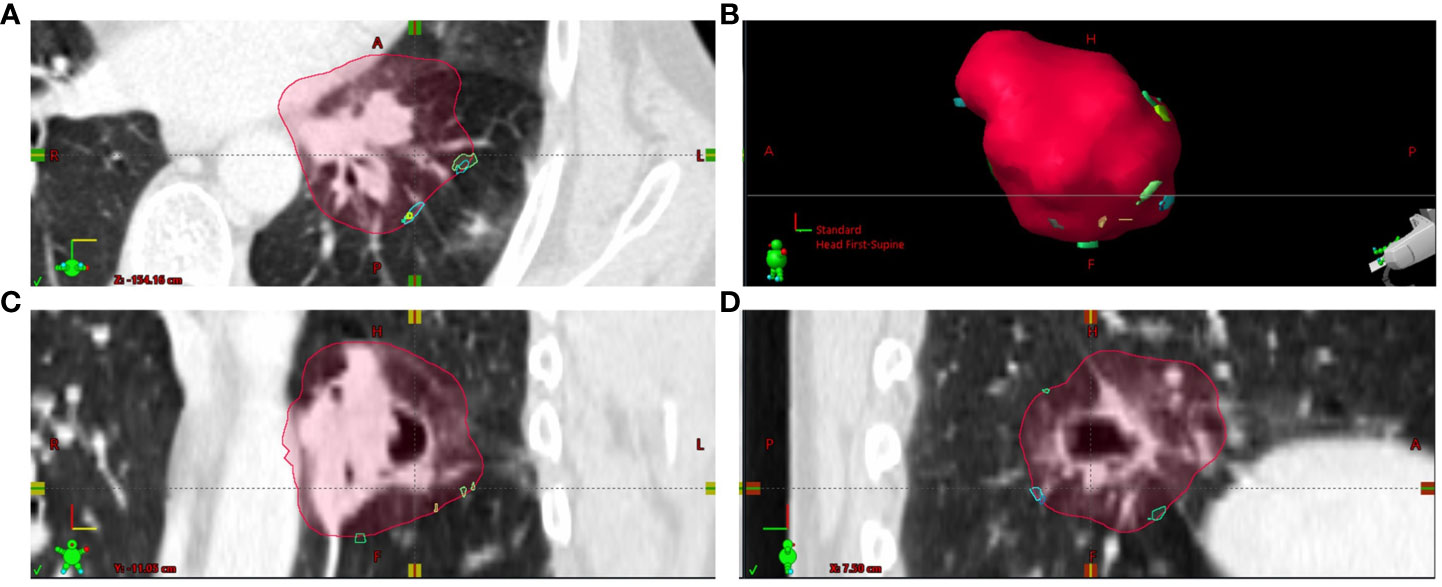
Figure 4 The localizations of Hausdorff points from the different dose fractions i (HDPi) transferred to CTplan by deformable image registration are shown at the outer edge of the CTVplan contour for patient (A) Most HDPi on the CTVplan contour were inferior to the CTVplan center. (A) Axial plane through CTVplan; (B) 3D view on CTVplan surface; (C) frontal plane through CTVplan; (D) sagittal plane through CTVplan.
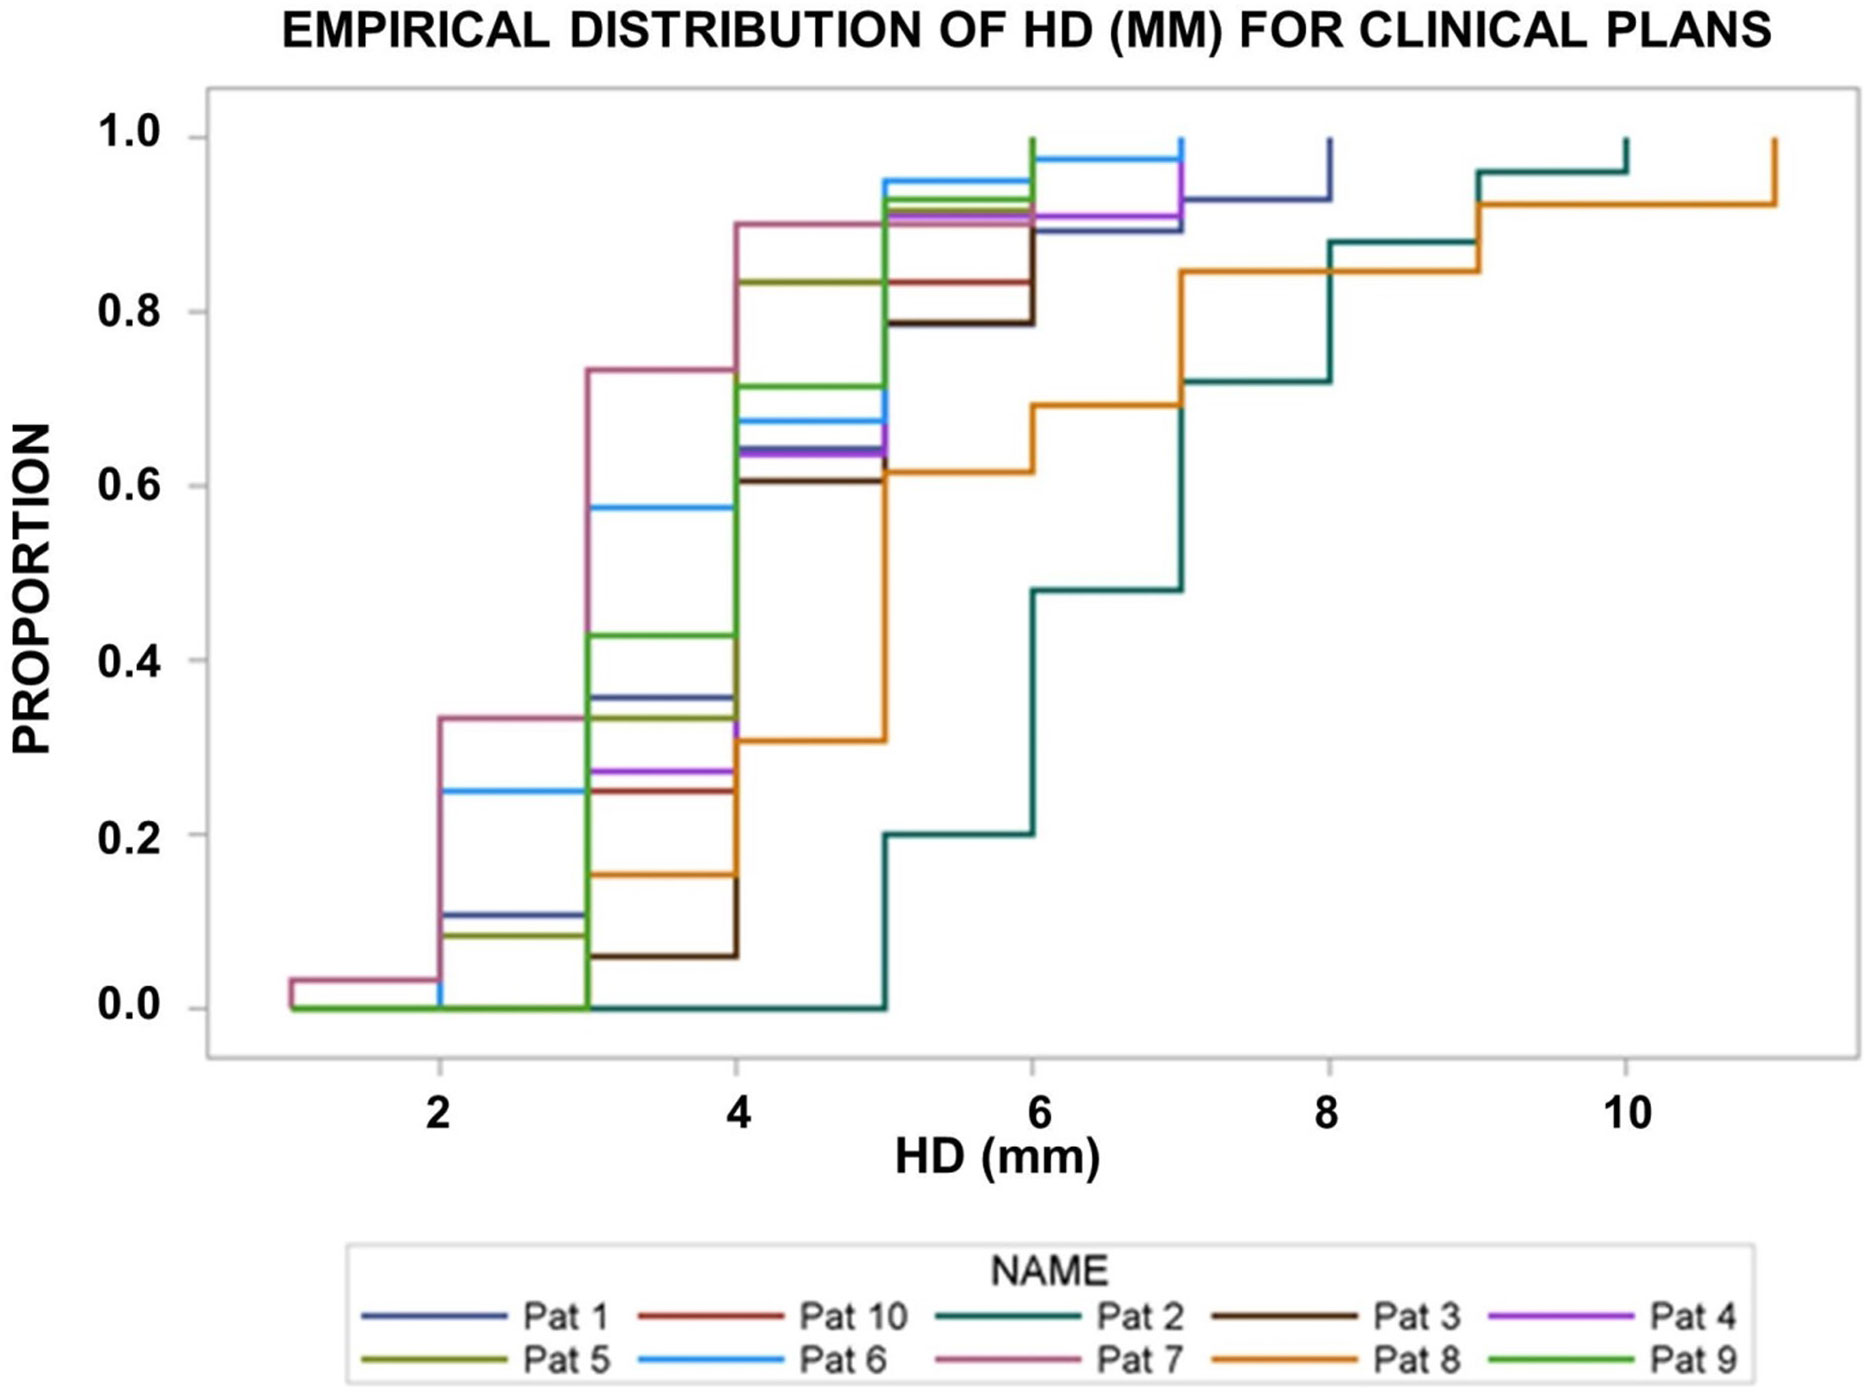
Figure 5 Empirical distribution functions of the Hausdorff distances (HD, in mm) of the deformed CTVi on the pre-fraction cone beam CTs’ from the original CTV in the planning CT. There was significant interpatient heterogeneity (p< 0.0001, Kruskal–Wallis test).
In Figures 6A–E, we analyzed the relations between geometric and dosimetric deviations at two distinct points, namely, the PDmin_global, the point with the lowest dose in the deformed CTVis over all fractions per patient, the HDPworst, the Hausdorff point with the largest distance over all fractions, and the gEUDi per fraction. Figure 6A shows the dependence of the gEUDi values on the normalized dose at PDmin_global over all fractions from all patients (D_PDmin_global_i). The regression curve was fitted up to the highest significant degree of D_PDmin_global_i that was 3. The coefficient of determination (R2) as goodness-of-fit measure was 0.694. The F-value for the fit with 3 degrees of freedom was F=96.2 (p < 0.0001). A similar goodness of fit was observed for a fit of gEUDi by ScalarPDmin_global_i_x (Figure 6B). The highest significant degree of freedom was again 3, R2 for the fit was 0.687, and the F-value for the fit was 156.3 with 3 degrees of freedom. Markedly smaller R2 were found for the fits of gEUDi by the geometric Hausdorff parameters. Figure 6C shows the relation of gEUDi and the length of the deformation vector at the global Hausdorff point (ΔLi-HDPworst). The highest significant degree of freedom of the polynomial was 3, R2 was 0.126, and the F-value for the model was 10.2 with 3 degrees of freedom (p < 0.0001). Figure 6D shows the fit of gEUDi by the HDDi values, with the highest significant degree of 3. The goodness of fit measure was even lower with R2 of 0.08 and an F-value for the model of 3.7 with 3 degrees of freedom (p = 0.0031). A much closer relation was found between gEUDi and the minimum dose in the CTVi per fraction (Dmin_CTVi), characterized by a coefficient of determination of 0.94 and an F-value for the model with 5 degrees of freedom of 680.7 (p < 0.0001) (Figure 6D). The use of a multivariable model to explain gEUDi by the above five parameters up to their highest significant degree from univariable analysis revealed only Dmin_CTVi (p < 0.0001) and HDworst length (p < 0.0005) as simultaneously significant.
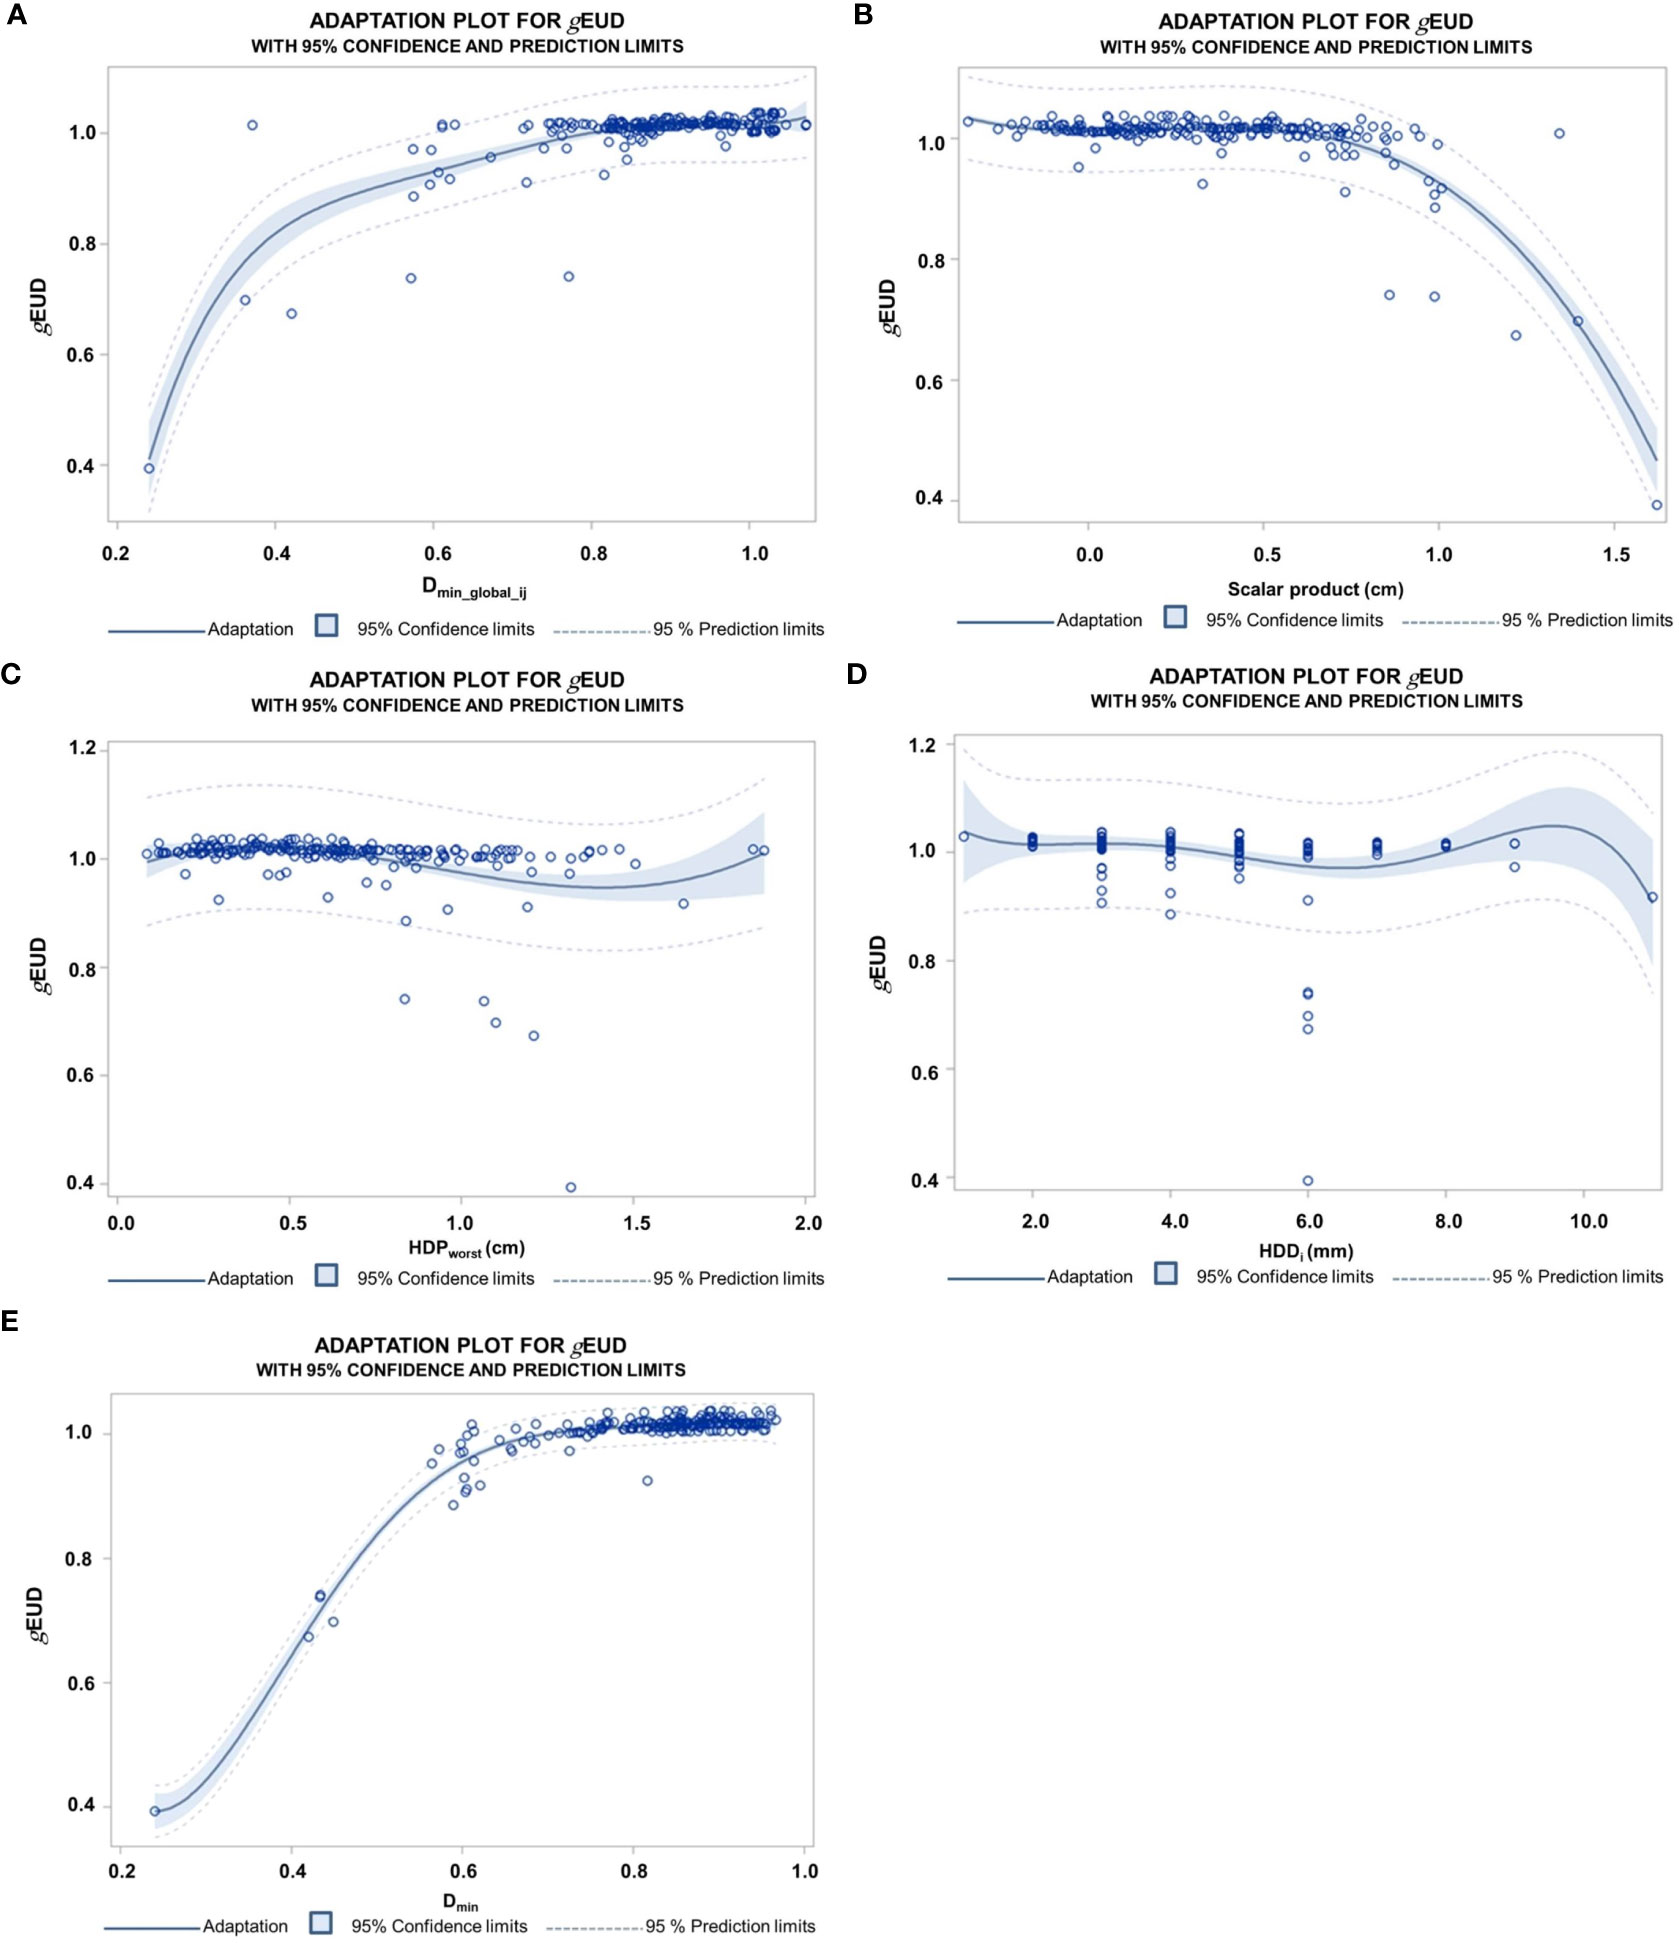
Figure 6 (A) Dependence of gEUD values normalized by the prescribed dose on the normalized dose at the global Dmin point (Dmin_global_ij) over all 218 fractions from the 10 patients approximated by a polynomial fit. The highest significant degree of the polynomial terms was 5; the coefficient of determination R square was 0.69. (B) Polynomial fit of the normalized gEUDi by the length of the deformation vector at the global minimum point of the CTV overall fractions per patients in the direction of the steepest dose decline (ScalarPDmin_global_i_x). The normalized gEUDi remained stable up to deformations of 8 mm, followed by a steep descent. The highest degree of a significant term was 3; the coefficient of determination was 0.69. The clinical PTV margin was 5–6 mm. (C) Polynomial regression of the normalized gEUDi values on the length of deformation vectors at HDPworst (ΔL-HDPworst). HDPworst represents the point on the CTV margin per patient with the largest Hausdorff distance to the deformed CTVi overall fractions and was given in cm. The degree of the polynomial is 3; the coefficient of determination is 0.13. (D) Fit of the normalized gEUD values by the Hausdorff distances HDDi between the deformed CTVi per fraction and the CTV on the planning CT overall fractions from the different patients. The degree of the polynomial is 5; the coefficient of determination is 0.08. (E) Fit of the gEUDi values normalized by the prescribed dose in dependence on the normalized Dmin over the 218 fractions from 10 patients. The degree of the fitted polynomial is 5; the coefficient of determination is 0.94.
The deformations of the CTV between the two points PDmin_global_i and HDPworst_i are depicted in Figures 7A–C. Depending on the patient, there was a marked difference between the absolute locations of the points over the fractions for the different patients (Figure 7A). The deformations in y and z directions at these points showed a broad scatter and only a moderate correlation approximately 0.5, demonstrating that there is considerable randomness in the deformations at different points of the CTV (Figures 7B, C). The random component of the differences in the deformation vectors in x, y, and z directions were 3.0, 3.3, and 3.9 mm. The systematic differences in the deformation vectors between these points in x, y, and z directions as the standard errors of the distributions of average differences per patient over all patients were 1.7, 3.0, and 2.3 mm, respectively.
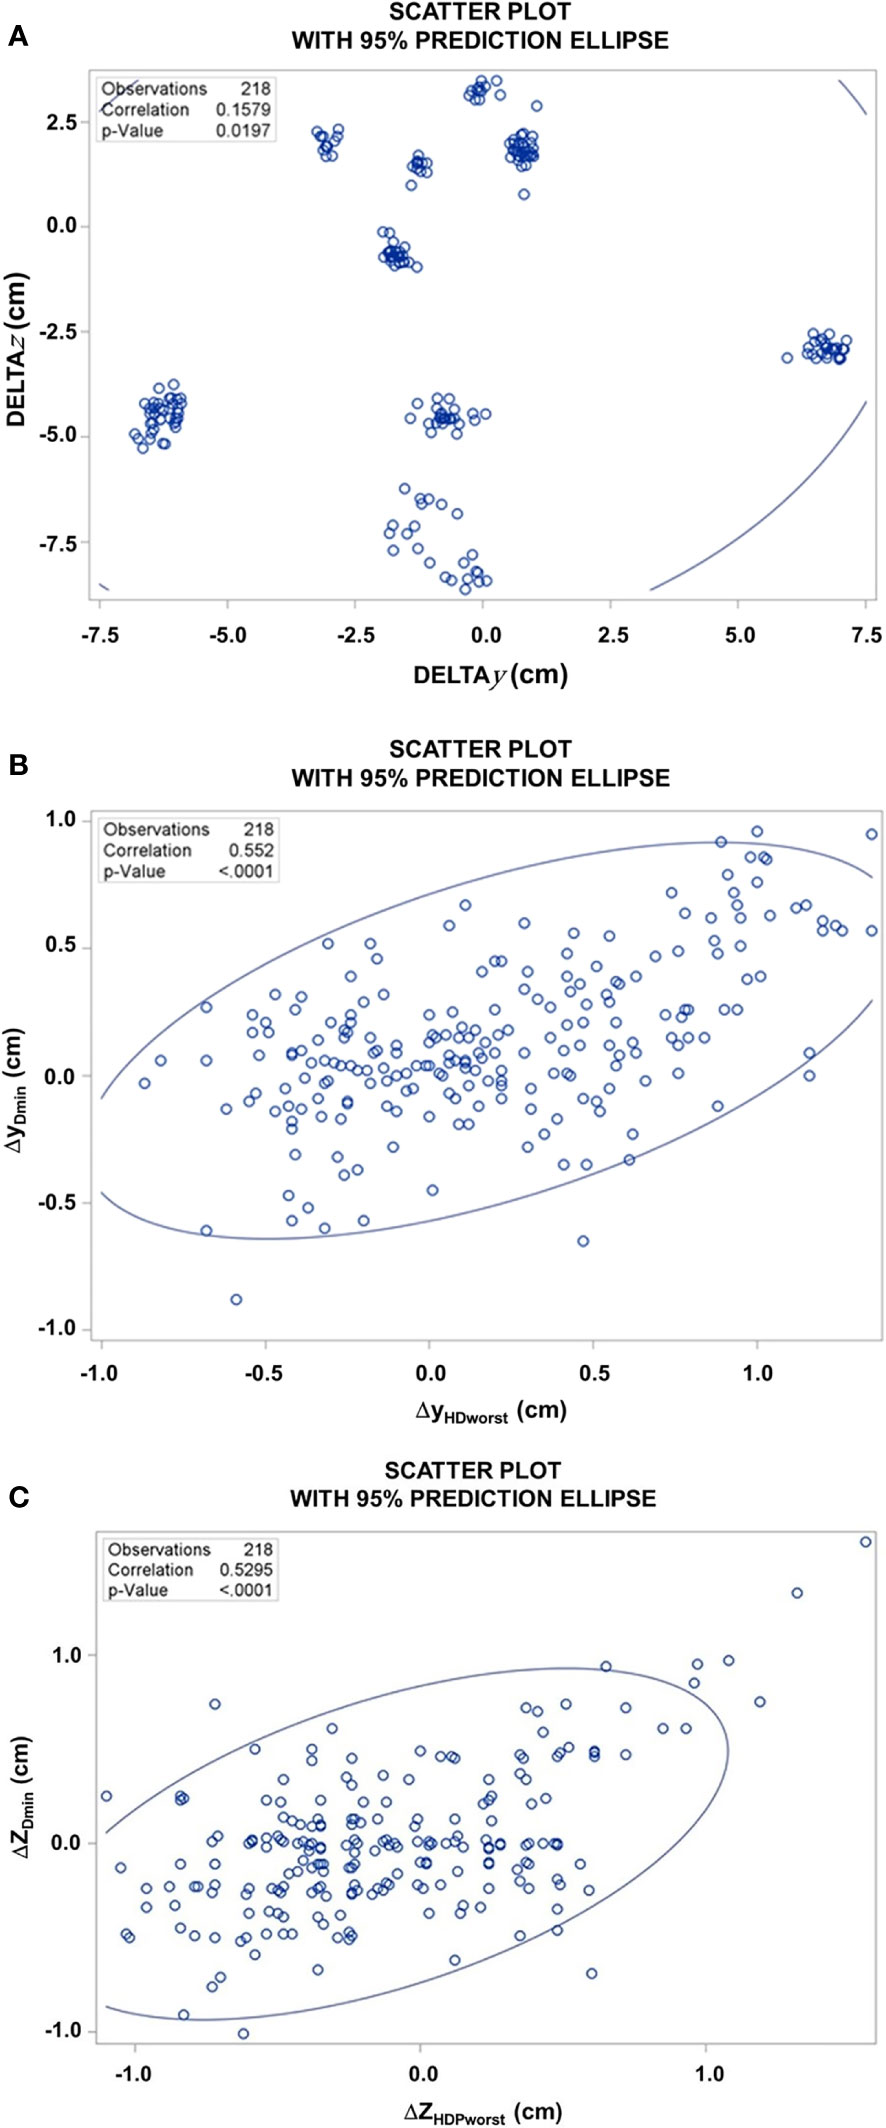
Figure 7 (A) Scatter plot of the difference of the z-coordinates of PDmin_global_i and HDPworst_i, versus the respective difference of the y-coordinates over all 218 fractions from the 10 patients, DELTAz [ZHDPWorst – ZPDmin_global] and DELTAy [YHDPWorst – YPDmin_global]. (B) Scatter plot of the y-coordinates of the deformation vectors at of PDmin_global_i versus HDPworst. (C) Scatter plot of the z-coordinates of the deformation vectors at PDmin_global_i versus HDPworst over all 218 fractions.
In the next step, we evaluated two machine learning model types for the prediction of the gEUDi by the above characterized input features, namely, Dmin, D_PDmin_global, HDDi, ScalarPDmin_global_i_x, and ΔL-HDPworst, and patient ID, indicating the data belonging to the same patient. The performance of classifiers with 10-fold cross-validation was measured by the Pearson correlation coefficient between the true gEUDi values from the dose–volume histograms and the gEUD values predicted by the classifier. The importance of the different input variables for the random forest classifier was quantified by mean square error loss reduction by the variable using the out-of-bag data (SAS Institute Inc., 2015, SAS® Enterprise miner™ 14.1: High-performance procedures, SAS Institute Inc., Cary, NC). During cross-validation loops, Dmin always showed the highest importance, followed by ScalarPDmin_global_i_x and D_PDmin_global. HDD and ΔL-HDPworst did not lead to consistent loss reductions. Figure 8A shows an overfitting plot, plotting the performance of the cross-validated random forest classification in dependence on the input features sets from Dmin alone to the full model containing all the above-mentioned variables. The Pearson correlation coefficient R was 0.897 (95% CI, 0.867–0.920) for the simplest model containing Dmin alone and was not improved by the more complex models using more features. Figure 8B shows the linear relation between the true gEUDi and predicted gEUDi values by the cross-validated random forest classifier based on Dmin alone. Furthermore, we analyzed whether the knowledge of the relation between features from fractions 1 to 5 and the respective gEUDi values of the considered patient j in addition to the data from the other patients improves the predictions of the gEUDi for the following fractions >5 of the scored leave-out patient. Figure 8C shows the dependence of the performance of the cross-validated random forest classifier based on Dmin alone in dependence of the stepwise introduction of data from fraction 1 to 5 of the considered leave-out patient in the trainings data sets. No improvements in the correlation coefficients between the true gEUD values and those predicted by the classifier were observed.
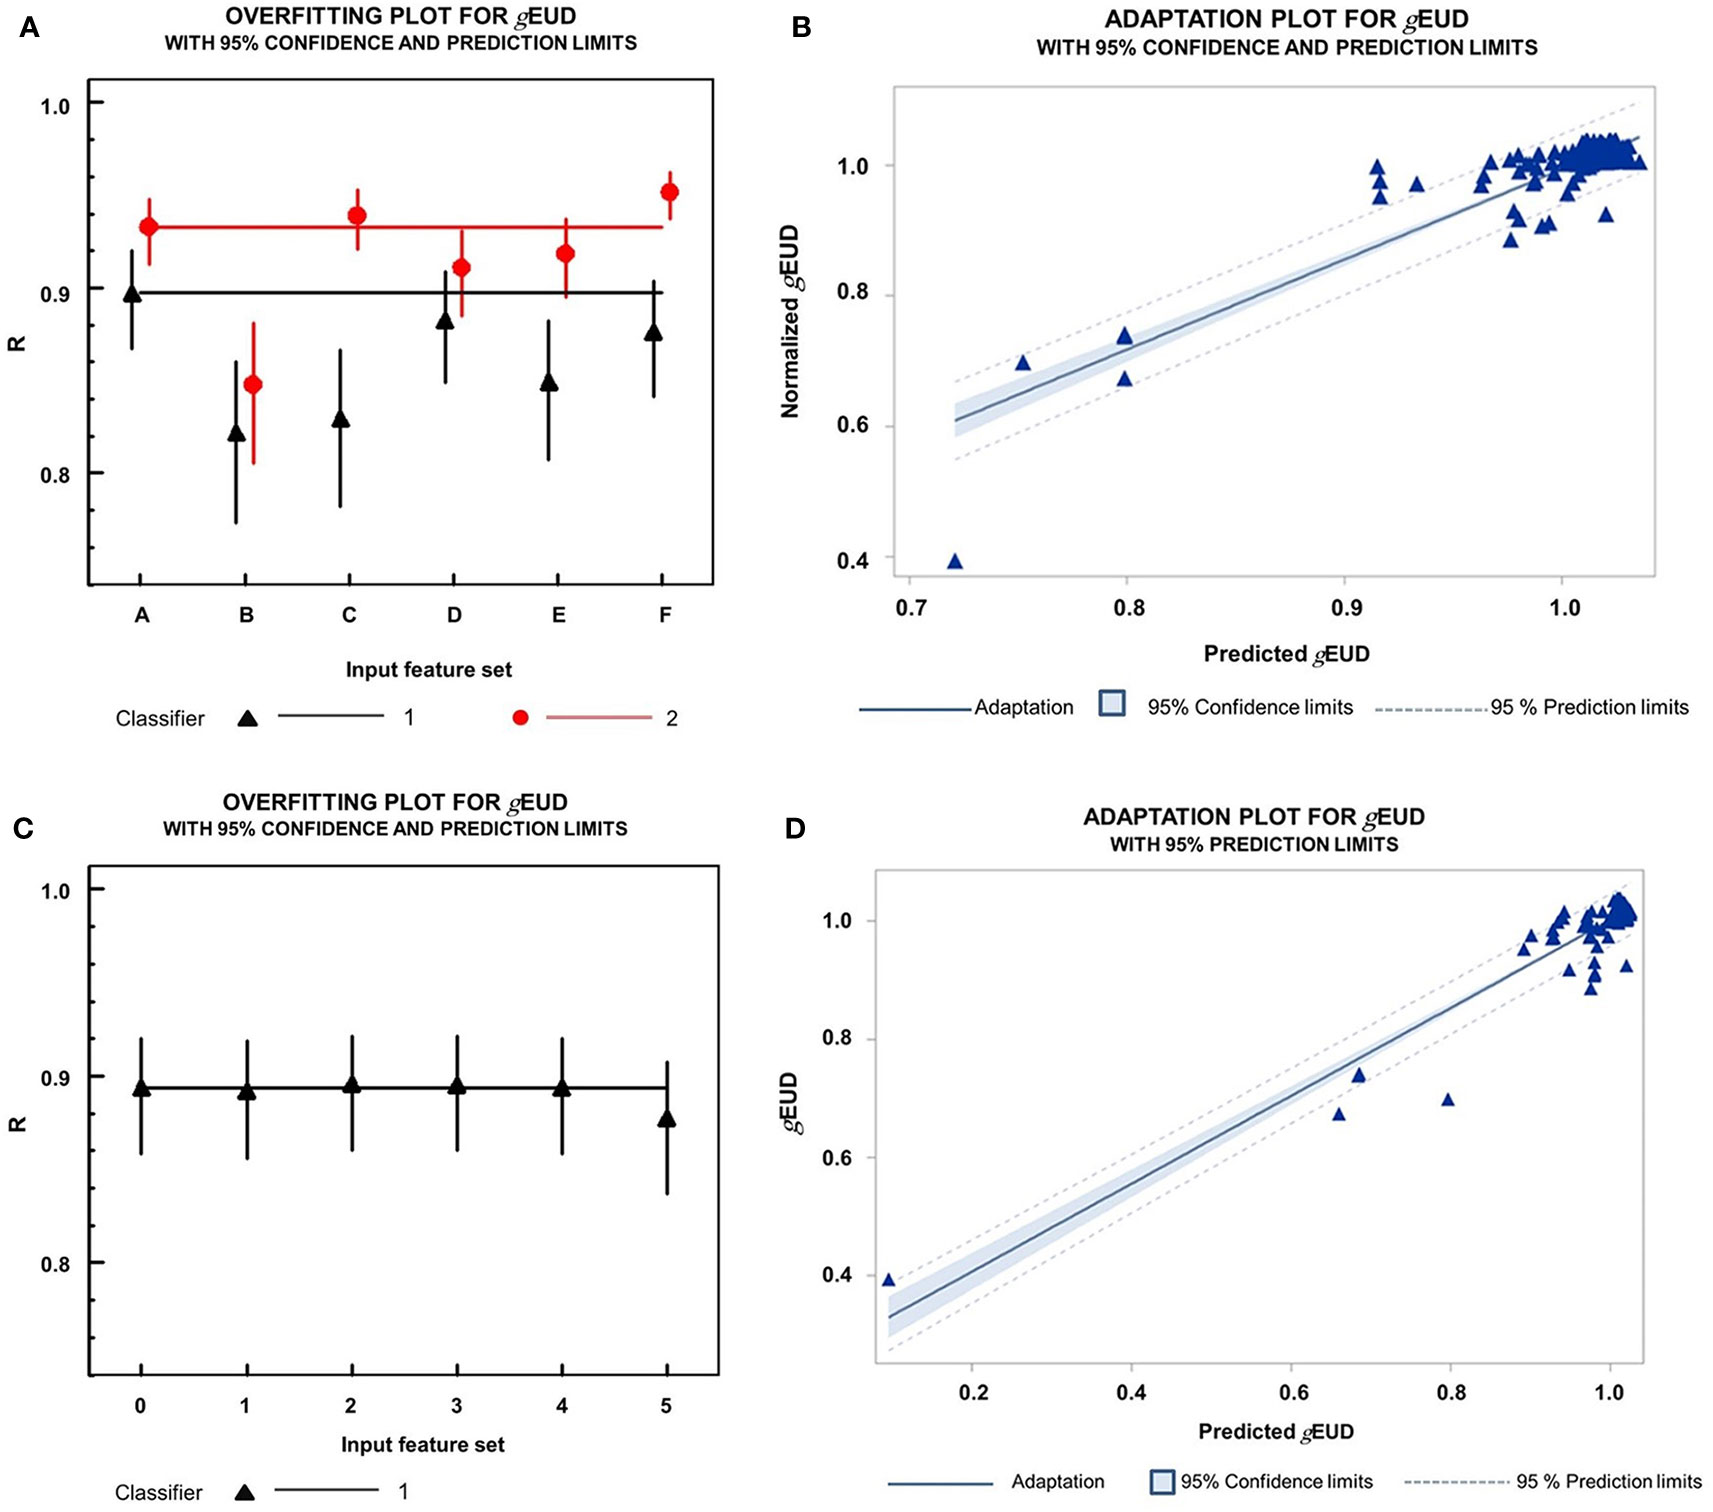
Figure 8 (A) Overfitting plot on the dependence of classifier performance with 10-fold cross-validation on the composition of the input feature set. The Pearson correlation coefficients R for the closeness of a linear relation between the gEUDi values directly calculated from the dose–volume histograms of the 218 fractions and the gEUDi values predicted by the respective classifier. Black triangles up 1  : cross-validated random forest classifiers. Red circles 2
  : nested cross-validated MLP classifiers. Correlation coefficients are given together with their 95% confidence intervals using Fisher’s transformation. Input feature sets for the different classifiers were as follows: A, Dmin; B, Dmin and scalarPDmin_global_i_x; C, Dmin, scalarPDmin_global_i_x, D_PDmin_global; D, Dmin and patient ID; E, Dmin, patient ID and HDD; F, Dmin, scalarPDmin_global_i_x, D_PDmin_global, HDDi, ΔL-HDPworst, and patient-ID. Classifier: 1: MLP neural net using 90% of the whole data set as a training and 10% as validation data set; 2. MLP with outer loop cross-validation; 80% of the data set was used for training, 10% for validation, and 10% for outer loop validation. Comparison of the correlation coefficients for the random forest classifiers revealed that B, C, and E classifiers all were significantly worse than A at alpha=0.01 (Z-test). The same hold for D and E classifiers in comparison to A for the MLP classifiers at alpha=0.01 (Z-test). Only the F-MLP classifier using the full set of input variables was slightly better than A (p=0.003, Z-test). (B) Linear relation between the true normalized gEUDi values versus the normalized gEUDi values predicted by a random forest classifier with Dmin alone as input feature using 10-fold cross-validation. The Pearson correlation coefficient is 0.897 (95% CI, 0.867–0.920). (C) Dependence of cross-validated random forest classifier performance for prediction of gEUDi for all fractions after fraction 5 with Dmin as the sole input variable on the composition of the trainings data set: 0, contained data from all other patients and no data from the leave out patient; 1, contained in addition data from fraction 1 of the leave out patient. i (ε 2–5), contained in addition data from fraction 1 to i of the leave out patient. R, Pearson correlation coefficient between the true gEUDi values and the gEUDi values predicted by the respective classifier together with their 95% confidence intervals. (D) Linear relation between the true normalized gEUDi values versus the normalized gEUDi values predicted by an MLP neural net classifier with Dmin alone as input feature using 10-fold nested cross-validation. The Pearson correlation coefficient is 0.933 (95% CI, 0.913–0.948).
In addition, MLP classifiers with nested cross-validation were studied. While their performance was generally better than that of the random forest model, no consistent improvement was observed for models containing more variables than Dmin alone. The Pearson correlation coefficient between true and predicted gEUDi values by the MLP classifier based on Dmin was R = 0.933 (95%CI, 0.913–0.948) (Figure 8D). In addition, we analyzed the performance of the MLP classifier based on the additional geometric input features D_PDmin_global, HDDi, ScalarPDmin_global_i_x, and the related ΔL-HDPworst, and patient ID using nested cross-validation (Figure 8A). The Pearson correlation coefficients for the correlation between true and predicted gEUDi was generally slightly better for the MLP in comparison to the random forest classifiers using the same input feature sets. The differences in performance became significant by the VEcv criterion using the input data sets a and c (p<0.05, signed rank test), while no significant differences were observed for the other input sets (Figure 8A). Comparing the correlation coefficients as a performance measure among the MLP classifiers, only the prediction based on the full input data set was slightly better with R = 0.952 (95% CI, 0.937–0.963) than the predictions based on Dmin as input alone (p = 0.0034, z-test). Both the widely used r-value as a measure for predictive accuracy and the VEcv measure led to the same result, in which the accuracy of the cross-validated random forest and MLP classifiers could not be increased by adding geometrical data in addition to Dmin into the input feature set.
As Dmin_i was by far the best single predictor for the gEUDi, we analyzed the correlation between other parameters from the high-dose region of the dose–volume histograms for the CTVi and Dmin_i using the 20 fractions with the lowest normalized Dmin_i from the 218 fractions studied. The correlation with Dmin_i degraded from D99.9 over D99 and D98 to D50. The respective correlation coefficients were 77.5%, 59.0%, 55.7%, and 1.7%.
The steepness of the dose–control curves for patients with locally advanced lung cancer decreases with intertumor heterogeneity in biological characteristics. This influences radio-responsiveness and impacts dosimetric parameters for dose coverage (34, 41). Retrospective analyses showed the existence of a dose–response relation for locally advanced non-small-cell lung cancer (NSCLC) (42). In addition, a randomized trial on escalation of the biological effective dose in stage-I NSCLC by stereotactic ablative radiotherapy showed a significant dose–response relation (43). However, an increasing response relation with dose was not found in the large RTOG-0617-trial, which compared standard (60 Gy) versus high-dose (74 Gy) radiation with concurrent chemotherapy for stage-III NSCLC with or without Cetuximab (44). Exploratory post-hoc analyses were performed, which found an association of worse tumor control rates with higher doses to cardio-pulmonary structures (45). Data on the delivered doses to the CTV or data on image guidance were not given. However, the median of the actually applied minimum margin between PTV and CTV was 3.9 mm (range, 0 – 9.8 mm) smaller in the dose-escalated groups than 4.5 mm (range, 0.0–9.8 mm) in the 60 Gy total dose groups (p = 0.005) (24). Yet, a PTV margin of at least 10 mm in cranio-caudal direction for breath-hold or gating approaches was specified in the protocol (24). As recalculation of delivered doses from CBCT used for image guidance was not reported in past randomized trials for stage III NSCLC, it cannot be ruled out that deviation of delivered from prescribed doses may be an important factor affecting outcome for individual patients.
In this study, Dmin within the CTV was found to be the most important factor predicting gEUDi. The primary effectiveness measure in this study, Dmin as a dosimetric measure, has been related to tumor recurrences in nasopharyngeal carcinoma (46). For lung cancer, Dmin within the gross tumor can also be sensitive to the dose-calculation algorithm. Older, more simple algorithms as the type-C algorithm used in this study, which do not take into full account the lateral electron transport in heterogeneous media, tend to overestimate Dmin in solid tumors surrounded by lung tissue (47, 48). As Dmin was the dominant predictive feature and residual deformations at distinct points as HDPworst and PDmin_global and the HDDi do not allow precise prediction of the gEUDi, Dmin should be considered during online image guidance. Without online adaptive replanning, the deformed CTVi can be centered within the dose cloud in such a way that the encompassing isodose is maximized. A similar type of dose guidance was described by Smyth et al. for prostate cancer (49). The static dose cloud approximation (31) underlying this concept without dose recalculation was shown to hold sufficient accuracy in the present study. These results are in accordance with the findings of Valdes using Monte Carlo simulation (50).
Most parts of this workflow are implemented in the ETHOS™ adaptive radiotherapy platform or MR-linacs, allowing online adaptive replanning, however at the expense of considerably prolonged treatment times (51–53). On the contrary, dose guidance without dose re-optimization can be performed faster and more efficient. The present study showed that Dmin is not well substituted by other parameters from the low-dose region of the dose–volume histogram for the CTV, as the correlation between Dmin and D99.9, D99, D98, and D50 rapidly declined. Normalized Dmin values >60% were associated with predicted gEUDi-values above 95% in the present study.
Systematic and random deviations of the distances between HDPworst and D_PDmin_global points, the points on the CTV margins with the largest geometric and dosimetric deviations throughout the series in this study, were similar to displacements between the primary tumor and lymph nodes in the study by Weiss et al. (16). However, PTV margin calculation from these displacements according to the van Herk formula is not warranted, as the dose gradients around the PTV are rather heterogeneous for locally advanced NSCLC and the assumptions for dose accumulation in rigid CTVs are not completely fulfilled in the deformed targets in lung cancer (13).
A vital part for precise dose accumulation is deformable image registration (DIR). Respecting AAPM Task Group 132 guidelines for quality control of DIR algorithms, visual inspection of deformation results is indispensable. Our preliminary analysis showed that both deformation algorithms, SmartAdapt and MiM, resulted in important deviations from real anatomy in 14/218 fractions. Unsupervised uncertainty estimation of the deformation vector fields on the bases of differences between commercially available deformation algorithms alone as discussed by Amstutz et al. (54) remains investigational to our opinion.
In previous studies on dose accumulation, only minor deviations were found from intended goals in stage-III NSCLC. Wang et al. found a maximum decline in D95% for the PTV by 0.1% (range, −7.6%–5%) in 27 patients with stage-IIIA/IIIB NSCLC using five CBCTs per patient (55). The Aarhus (ART) group performed adaptive radiotherapy of patients with stage-III NSCLC with CBCT image guidance according to a soft tissue tumor match using a PTV margin of 4 mm around the primary tumor (56). Adaptive replanning throughout the course of series was applied if changes above an intervention level were found. The ART group compared the outcome with that from patients after bony matching using considerably larger PTV margins of 10 mm around the primary tumor without replanning. One from 52 in the ART group showed a marginal failure, while 4 from 52 in the no-ART group suffered from a marginal failure, supporting adaptive radiotherapy (56). The present study showed that the gEUD for the CTV from the accumulated dose distribution is close to the median of the distribution to the gEUDis from the different dose fractions. Thus, deviations in a minority of gEUDis were tolerated. This can be explained by the randomness of the residual deformations at the CTV margin, helping to avoid accumulation of dose minima at a single point so that the CTV minimum doses for the accumulated distributions stayed above 72%.
In the present study, all patients received induction chemotherapy and had a partial response. In the land mark trial Pacific (57, 58), 27% of all patients received induction chemotherapy. After partial response on induction chemotherapy, it is known that the tumor changes are minor during the course of radiochemotherapy (59). In this study, too, no substantial changes in the volume of the macroscopic tumor were observed that would have necessitated replanning.
A potential limitation of the results of the present study and a challenge for their translation into clinical workflow is that the deformations need to be monitored by an experienced radiologist and radiation oncologist for an accurate assessment of CTV coverage. To date, there is no (semi-)automated tool that could replace this important task. In addition, it is important to calculate gEUDi and accumulated dose after supervised approval of CTVis, each of which demands a thorough knowledge of the matter required. Randomness of the residual deformations of the CTVi assured that Dmin and gEUD of the accumulated dose distribution stayed above 70% and 100% of the prescribed dose, respectively. Dmin proves to be a very important predictive feature for gEUD and outperforms geometric features associated with deformation. Dmin was the most important parameter for gEUD prediction within the CTV for a single-dose fraction. Thus, the location and the value of Dmin within the CTV are very important information for the evaluation of the CBCT during online image guidance.
Residual deformations of the CTV after online image guidance affected the distribution of the gEUDi per fraction but not the EUDacc for the accumulated dose distribution over series of more than 10 fractions using conventional PTV margins of 5 mm in lung cancer. The smaller is the number of fractions, the more the individual gEUDi will determine the outcome of the treatment series. Dmin_i and not geometric parameters characterizing the residual deformation of the CTV was important for the prediction of the gEUDi. Dosimetric information during image guidance, at least as isodose contours linked to the planning CT, should be displayed, in order to center the CTV within the scheduled dose distribution to maximize the effectiveness of radiotherapy.
The original contributions presented in the study are included in the article/Supplementary Material. Further inquiries can be directed to the corresponding author.
The studies involving human participants were reviewed and approved by Ethics committee of University Duisburg-Essen. Written informed consent for participation was not required for this study in accordance with the national legislation and the institutional requirements.
Conceptualization, NG and MS. Methodology, NG and MS. Software, MS. Validation, NG, MG, MS. Formal analysis, MS. Investigation, NG. Resources, NG. Data curation, MS. Writing—original draft preparation, NG. Writing—review and editing, NG, MG, CP, WL, FI, SQ, SL, AS, TR, MS. Visualization, MS. Supervision, MS. Project administration, MS. Funding acquisition, MS. All authors contributed to the article and approved the submitted version.
We acknowledge support of the Open Access Publication Fund of the University of Duisburg-Essen. This research did not receive any specific grant from funding agencies in the public, commercial, or not-for-profit sectors.
The authors declare that the research was conducted in the absence of any commercial or financial relationships that could be construed as a potential conflict of interest.
All claims expressed in this article are solely those of the authors and do not necessarily represent those of their affiliated organizations, or those of the publisher, the editors and the reviewers. Any product that may be evaluated in this article, or claim that may be made by its manufacturer, is not guaranteed or endorsed by the publisher.
The Supplementary Material for this article can be found online at: https://www.frontiersin.org/articles/10.3389/fonc.2022.870432/full#supplementary-material
Supplementary Figure 1 | new. Block diagram highlighting means and direction of 6 degrees of freedom (6DoFi) rigid online registration and deformation (DIRi) for obtaining the minimum dose Dmin_i and the Hausdorff point HDPi for the deformed clinical target volume CTVi on the cone beam CT per fraction i. HDPworst is the Hausdorff point with the maximum deformation over all HDPi, PDmin_global_i is the point with the minimum Dmini over all fractions. HDPworst and PDglobalmin were identified on the respective CTVi, then back-deformed to CTVplan, and then deformed to the CTVi for all other dose fractions using the respective deformations. Dashed line denoting deformable registration (DIRi), drawn line indicating the performed 6DoFi rigid online registration per fraction i. DIR-1i and 6DoF-1i are the inverse deformations or rigid registrations.
Supplementary Figure 2 | new. Block diagram delineating the process of deformable image registration (DIR) in addition to the 6DoF (6 degrees of freedom online match) for final dose accumulation. Stirred line denoting deformable registration. 6Dof-1i: the inverse of the 6 degrees of freedom online match vector for dose fraction i; DIRi: density based deformable image registration; CTplan: planning CT, CBCTi: pretreatment cone beam CT from fraction i; CTVi: clinical target volume contour for dose fraction i.
1. Yorke E, Rosenzweig KE, Wagman R, Mageras GS. Interfractional anatomic variation in patients treated with respiration-gated radiotherapy. J Appl Clin Med Phys (2005) 6:19–32. doi: 10.1120/jacmp.v6i2.2048
2. Berbeco RI, Nishioka S, Shirato H, Jiang SB. Residual motion of lung tumors in end-of-inhale respiratory gated radiotherapy based on external surrogates. Med Phys (2006) 33:4149–56. doi: 10.1118/1.2358197
3. Kraus KM, Simonetto C, Kundrát P, Waitz V, Borm KJ, Combs SE. Potential morbidity reduction for lung stereotactic body radiation therapy using respiratory gating. Cancers (Basel) (2021) 13:5092. doi: 10.3390/cancers13205092
4. Ross CS, Hussey DH, Pennington EC, Stanford W, Doornbos JF. Analysis of movement of intrathoracic neoplasms using ultrafast computerized tomography. Int J Radiat Oncol Biol Phys (1990) 18:671–7. doi: 10.1016/0360-3016(90)90076-V
5. Dzyubak O, Kincaid R, Hertanto A, Hu YC, Pham H, Rimner A, et al. Evaluation of tumor localization in respiration motion-corrected cone-beam CT: prospective study in lung. Med Phys (2014) 41:101918. doi: 10.1118/1.4896101
6. Schroeder C, Hejal R, Linden PA. Coil spring fiducial markers placed safely using navigation bronchoscopy in inoperable patients allows accurate delivery of CyberKnife stereotactic radiosurgery. J Thorac Cardiovasc Surg (2010) 140:1137–42. doi: 10.1016/j.jtcvs.2010.07.085
7. Higgins J, Bezjak A, Franks K, Le LW, Cho BC, Payne D, et al. Comparison of spine, carina, and tumor as registration landmarks for volumetric image-guided lung radiotherapy. Int J Radiat Oncol Biol Phys (2009) 73:1404–13. doi: 10.1016/j.ijrobp.2008.06.1926
8. Lavoie C, Higgins J, Bissonnette JP, Le LW, Sun A, Brade A, et al. Volumetric image guidance using carina vs spine as registration landmarks for conventionally fractionated lung radiotherapy. Int J Radiat Oncol Biol Phys (2012) 84:1086–92. doi: 10.1016/j.ijrobp.2012.02.012
9. Cuijpers JP, Dahele M, Jonker M, Kraan B, Senan S, Slotman B, et al. Analysis of components of variance determining probability of setup errors in CBCT-guided stereotactic radiotherapy of lung tumors. Med Phys (2017) 44:382–8. doi: 10.1002/mp.12074
10. Hoffmann L, Holt MI, Knap MM, Khalil AA, Møller DS. Anatomical landmarks accurately determine interfractional lymph node shifts during radiotherapy of lung cancer patients. Radiother Oncol (2015) 116:64–9. doi: 10.1016/j.radonc.2015.06.009
11. Li W, Purdie TG, Taremi M, Fung S, Brade A, Cho BC, et al. Effect of immobilization and performance status on intrafraction motion for stereotactic lung radiotherapy: analysis of 133 patients. Int J Radiat Oncol Biol Phys (2011) 81:1568–75. doi: 10.1016/j.ijrobp.2010.09.035
12. Yeung AR, Li JG, Shi W, Newlin HE, Chvetsov A, Liu C, et al. Tumor localization using cone-beam CT reduces setup margins in conventionally fractionated radiotherapy for lung tumors. Int J Radiat Oncol Biol Phys (2009) 74:1100–7. doi: 10.1016/j.ijrobp.2008.09.048
13. van Herk M, Remeijer P, Rasch C, Lebesque JV. The probability of correct target dosage: dose-population histograms for deriving treatment margins in radiotherapy. Int J Radiat Oncol Biol Phys (2000) 47:1121–35. doi: 10.1016/S0360-3016(00)00518-6
14. Oh SA, Yea JW, Kim SK. Statistical determination of the gating windows for respiratory-gated radiotherapy using a visible guiding system. PloS One (2016) 11:e0156357. doi: 10.1371/journal.pone.0156357
15. Starkschall G, Balter P, Britton K, McAleer MF, Cox JD, Mohan R. Interfractional reproducibility of lung tumor location using various methods of respiratory motion mitigation. Int J Radiat Oncol Biol Phys (2011) 79:596–601. doi: 10.1016/j.ijrobp.2010.03.039
16. Weiss E, Robertson SP, Mukhopadhyay N, Hugo GD. Tumor, lymph node, and lymph node-to-tumor displacements over a radiotherapy series: analysis of interfraction and intrafraction variations using active breathing control (ABC) in lung cancer. Int J Radiat Oncol Biol Phys (2012) 82:e639–45. doi: 10.1016/j.ijrobp.2011.08.021
17. Hoegen P, Lang C, Akbaba S, Häring P, Splinter M, Miltner A, et al. Cone-Beam-CT guided adaptive radiotherapy for locally advanced non-small cell lung cancer enables quality assurance and superior sparing of healthy lung. Front Oncol (2020) 10:564857. doi: 10.3389/fonc.2020.564857
18. Kavanaugh J, Roach M, Ji Z, Fontenot J, Hugo GD. A method for predictive modeling of tumor regression for lung adaptive radiotherapy. Med Phys (2021) 48:2083–94. doi: 10.1002/mp.14529
19. Meng Y, Luo W, Xu H, Wang W, Zhou S, Tang X, et al. Adaptive intensity-modulated radiotherapy with simultaneous integrated boost for stage III non-small cell lung cancer: Is a routine adaptation beneficial? Radiother Oncol (2021) 158:118–24. doi: 10.1016/j.radonc.2021.02.019
20. Ramella S, Fiore M, Silipigni S, Zappa MC, Jaus M, Alberti AM, et al. Local control and toxicity of adaptive radiotherapy using weekly CT imaging: Results from the LARTIA trial in stage III NSCLC. J Thorac Oncol (2017) 12:1122–30. doi: 10.1016/j.jtho.2017.03.025
21. Zhong H, Siddiqui SM, Movsas B, Chetty IJ. Evaluation of adaptive treatment planning for patients with non-small cell lung cancer. Phys Med Biol (2017) 62:4346–60. doi: 10.1088/1361-6560/aa586f
22. Niemierko A. Reporting and analyzing dose distributions: a concept of equivalent uniform dose. Med Phys (1997) 24:103–10. doi: 10.1118/1.598063
23. Niemierko A. A generalized concept of equivalent uniform dose (EUD). In: 41st annual meeting of the American association of physicists in medicine. Nashville, Tennessee: aapm online (1999).
24. Bradley JD, Paulus R, Komaki R, Masters G, Blumenschein G, Schild S, et al. Standard-dose versus high-dose conformal radiotherapy with concurrent and consolidation carboplatin plus paclitaxel with or without cetuximab for patients with stage IIIA or IIIB non-small-cell lung cancer (RTOG 0617): a randomised, two-by-two factorial phase 3 study. Lancet Oncol (2015) 16:187–99. doi: 10.1016/S1470-2045(14)71207-0
25. Rusch VW, Asamura H, Watanabe H, Giroux DJ, Rami-Porta R, Goldstraw P. The IASLC lung cancer staging project: a proposal for a new international lymph node map in the forthcoming seventh edition of the TNM classification for lung cancer. J Thorac Oncol (2009) 4:568–77. doi: 10.1097/JTO.0b013e3181a0d82e
26. Itazawa T, Tamaki Y, Komiyama T, Nishimura Y, Nakayama Y, Ito H, et al. The Japan lung cancer society-Japanese society for radiation oncology consensus-based computed tomographic atlas for defining regional lymph node stations in radiotherapy for lung cancer. J Radiat Res (2017) 58:86–105. doi: 10.1093/jrr/rrw076
27. National Comprehensive Cancer Network (NCCN). Clinical practice guidelines in oncology. Non-Small Cell Lung Cancer 1 (2023) NSCL-C 1-11.
28. Holt A, van Vliet-Vroegindeweij C, Mans A, Belderbos JS, Damen EM. Volumetric-modulated arc therapy for stereotactic body radiotherapy of lung tumors: a comparison with intensity-modulated radiotherapy techniques. Int J Radiat Oncol Biol Phys (2011) 81:1560–7. doi: 10.1016/j.ijrobp.2010.09.014
29. Wang H, Dong L, O'Daniel J, Mohan R, Garden AS, Ang KK, et al. Validation of an accelerated 'demons' algorithm for deformable image registration in radiation therapy. Phys Med Biol (2005) 50:2887–905. doi: 10.1088/0031-9155/50/12/011
30. Thirion JP. Image matching as a diffusion process: an analogy with maxwell's demons medical image analysis. Med Image Anal (1998) 2:243–60. doi: 10.1016/s1361-8415(98)80022-4
31. Unkelbach J, Bortfeld T, Martin BC, Soukup M. Reducing the sensitivity of IMPT treatment plans to setup errors and range uncertainties via probabilistic treatment planning. Med Phys (2009) 36:149–63. doi: 10.1118/1.3021139
32. Choi B, Deasy JO. The generalized equivalent uniform dose function as a basis for intensity-modulated treatment planning. Phys Med Biol (2002) 47:3579–89. doi: 10.1088/0031-9155/47/20/302
33. Nix MG, Rowbottom CG, Vivekanandan S, Hawkins MA, Fenwick JD. Chemoradiotherapy of locally-advanced non-small cell lung cancer: Analysis of radiation dose-response, chemotherapy and survival-limiting toxicity effects indicates a low α/β ratio. Radiother Oncol (2020) 143:58–65. doi: 10.1016/j.radonc.2019.07.026
34. Suit H, Skates S, Taghian A, Okunieff P, Efird JT. Clinical implications of heterogeneity of tumor response to radiation therapy. Radiother Oncol (1992) 25:251–60. doi: 10.1016/0167-8140(92)90244-O
35. Brock KK, Mutic S, McNutt TR, Li H, Kessler ML. Use of image registration and fusion algorithms and techniques in radiotherapy: Report of the AAPM radiation therapy committee task group no. 132. Med Phys (2017) 44:e43–76. doi: 10.1002/mp.12256
36. Ramadaan IS, Peick K, Hamilton DA, Evans J, Iupati D, Nicholson A, et al. Validation of varian's SmartAdapt® deformable image registration algorithm for clinical application. Radiat Oncol (2015) 10:73. doi: 10.1186/s13014-015-0372-1
37. Kadoya N, Nakajima Y, Saito M, Miyabe Y, Kurooka M, Kito S, et al. Multi-institutional validation study of commercially available deformable image registration software for thoracic images. Int J Radiat Oncol Biol Phys (2016) 96:422–31. doi: 10.1016/j.ijrobp.2016.05.012
38. Stone M. Cross-validatory choice and assessment of statistical predictions. J R Statist Soc Sries B (1974) 36:111–14. doi: 10.1111/j.2517-6161.1974.tb00994.x
39. Neill JJ, Dun OJ. Equality of dependent correlation coefficients. Biometrics (1975) 31:531–43. doi: 10.2307/2529435
40. Li J. Assessing the accuracy of predictive models for numerical data: Not r nor r2, why not? Then what? PloS One (2017) 12:e0183250. doi: 10.1371/journal.pone.0183250
41. Brahme A. Dosimetric precision requirements in radiation therapy. Acta Radiol Oncol (1984) 23:379–91. doi: 10.3109/02841868409136037
42. Partridge M, Ramos M, Sardaro A, Brada M. Dose escalation for non-small cell lung cancer: analysis and modelling of published literature. Radiother Oncol (2011) 99:6–11. doi: 10.1016/j.radonc.2011.02.014
43. Ball D, Mai GT, Vinod S, Babington S, Ruben J, Kron T, et al. TROG 09.02 CHISEL investigators. stereotactic ablative radiotherapy versus standard radiotherapy in stage 1 non-small-cell lung cancer (TROG 09.02 CHISEL): a phase 3, open-label, randomised controlled trial. Lancet Oncol (2019) 20:494–503. doi: 10.1016/S1470-2045(18)30896-9
44. Bradley JD, Hu C, Komaki RR, Masters GA, Blumenschein GR, Schild SE, et al. Long-term results of NRG oncology RTOG 0617: Standard- versus high-dose chemoradiotherapy with or without cetuximab for unresectable stage III non-Small-Cell lung cancer. J Clin Oncol (2020) 38:706–14. doi: 10.1200/JCO.19.01162
45. Thor M, Deasy JO, Hu C, Gore E, Bar-Ad V, Robinson C, et al. Modeling the impact of cardiopulmonary irradiation on overall survival in NRG oncology trial RTOG 0617. Clin Cancer Res (2020) 26:4643–50. doi: 10.1158/1078-0432.CCR-19-2627
46. Xue F, Hu C, He X. Impact of minimum point dose on local control and toxicity in T3-4 nasopharyngeal carcinoma treated with intensity-modulated radiation therapy plus chemotherapy. Jpn J Clin Oncol (2018) 48:265–71. doi: 10.1093/jjco/hyx183
47. Zhou Y, Sheng X, Deng F, Wang H, Shen L, Zeng Y, et al. Radiation-induced muscle fibrosis rat model: establishment and valuation. Radiat Oncol (2018) 13:160. doi: 10.1186/s13014-018-1104-0
48. Troeller A, Garny S, Pachmann S, Kantz S, Gerum S, Manapov F, et al. Stereotactic radiotherapy of intrapulmonary lesions: comparison of different dose calculation algorithms for oncentra MasterPlan®. Radiat Oncol (2015) 10:51. doi: 10.1186/s13014-015-0354-3
49. Smyth G, McCallum HM, Lambert EL, Lawrence GP. A dose distribution overlay technique for image guidance during prostate radiotherapy. Br J Radiol (2008) 81:890–6. doi: 10.1259/bjr/55773072
50. Valdes G, Chan MF, Lim SB, Scheuermann R, Deasy JO, Solberg TD. IMRT QA using machine learning: A multi-institutional validation. J Appl Clin Med Phys (2017) 18:279–84. doi: 10.1002/acm2.12161
51. Byrne M, Archibald-Heeren B, Hu Y, Teh A, Beserminji R, Cai E, et al. Varian Ethos online adaptive radiotherapy for prostate cancer: Early results of contouring accuracy, treatment plan quality, and treatment time. J Appl Clin Med Phys (2022) 23:e13479. doi: 10.1002/acm2.13479
52. Daamen LA, de Mol van Otterloo SR, van Goor IWJM, Eijkelenkamp H, Erickson BA, Hall WA, et al. Online adaptive MR-guided stereotactic radiotherapy for unresectable malignancies in the upper abdomen using a 1.5T MR-linac. Acta Oncol (2022) 61:111–5. doi: 10.1080/0284186X.2021.2012593
53. van Timmeren JE, Chamberlain M, Krayenbuehl J, Wilke L, Ehrbar S, Bogowicz M, et al. Treatment plan quality during online adaptive re-planning. Radiat Oncol (2020) 15:203. doi: 10.1186/s13014-020-01641-0
54. Amstutz F, Nenoff L, Albertini F, Ribeiro CO, Knopf AC, Unkelbach J, et al. An approach for estimating dosimetric uncertainties in deformable dose accumulation in pencil beam scanning proton therapy for lung cancer. Phys Med Biol (2021) 66(10). doi: 10.1088/1361-6560/abf8f5
55. Wang B, Wang DQ, Lin MS, Lu SP, Zhang J, Chen L, et al. Accumulation of the delivered dose based on cone-beam CT and deformable image registration for non-small cell lung cancer treated with hypofractionated radiotherapy. BMC Cancer (2020) 20:1112. doi: 10.1186/s12885-020-07617-3
56. Tvilum M, Khalil AA, Møller DS, Hoffmann L, Knap MM. Clinical outcome of image-guided adaptive radiotherapy in the treatment of lung cancer patients. Acta Oncol (2015) 54:1430–7. doi: 10.3109/0284186X.2015.1062544
57. Antonia SJ, Villegas A, Daniel D PACIFIC Investigators. Overall survival with durvalumab after chemoradiotherapy in stage III NSCLC. N Engl J Med (2018) 379:2342–50. doi: 10.1056/NEJMoa1809697
58. Wang C, Rimner A, Hu YC, Tyagi N, Jiang J, Yorke E, et al. Toward predicting the evolution of lung tumors during radiotherapy observed on a longitudinal MR imaging study via a deep learning algorithm. Med Phys (2019) 46:4699–707. doi: 10.1002/mp.13765
59. Pöttgen C, Levegrün S, Theegarten D, Marnitz S, Grehl S, Pink R, et al. Value of 18F-fluoro-2-deoxy-D-glucose-positron emission tomography/computed tomography in non-small-cell lung cancer for prediction of pathologic response and times to relapse after neoadjuvant chemoradiotherapy. Clin Cancer Res (2006) 12:97–106. doi: 10.1158/1078-0432.CCR-05-0510
Keywords: Hausdorff-distance, cold spot, respiratory gating, planning target volume margin, lung cancer, clinical target volume
Citation: Guberina N, Pöttgen C, Santiago A, Levegrün S, Qamhiyeh S, Ringbaek TP, Guberina M, Lübcke W, Indenkämpen F and Stuschke M (2023) Machine-learning-based prediction of the effectiveness of the delivered dose by exhale-gated radiotherapy for locally advanced lung cancer: The additional value of geometric over dosimetric parameters alone. Front. Oncol. 12:870432. doi: 10.3389/fonc.2022.870432
Received: 06 February 2022; Accepted: 08 December 2022;
Published: 13 January 2023.
Edited by:
James Chow, University of Toronto, CanadaReviewed by:
Yuenan Wang, Shenzhen Hospital, Peking University, ChinaCopyright © 2023 Guberina, Pöttgen, Santiago, Levegrün, Qamhiyeh, Ringbaek, Guberina, Lübcke, Indenkämpen and Stuschke. This is an open-access article distributed under the terms of the Creative Commons Attribution License (CC BY). The use, distribution or reproduction in other forums is permitted, provided the original author(s) and the copyright owner(s) are credited and that the original publication in this journal is cited, in accordance with accepted academic practice. No use, distribution or reproduction is permitted which does not comply with these terms.
*Correspondence: Nika Guberina, bmlrYS5ndWJlcmluYUB1ay1lc3Nlbi5kZQ==
Disclaimer: All claims expressed in this article are solely those of the authors and do not necessarily represent those of their affiliated organizations, or those of the publisher, the editors and the reviewers. Any product that may be evaluated in this article or claim that may be made by its manufacturer is not guaranteed or endorsed by the publisher.
Research integrity at Frontiers
Learn more about the work of our research integrity team to safeguard the quality of each article we publish.