- 1Department of Ultrasound, First Clinical College of Jinan University, Second Clinical College of Jinan University, First Affiliated Hospital of Southern University of Science and Technology, Shenzhen People’s Hospital, Shenzhen, China
- 2Research and Development Department, Microport Prophecy, Shanghai, China
- 3Research and Development Department, Illuminate Limited Liability Company, Shenzhen, China
- 4The Key Laboratory of Cardiovascular Remodeling and Function Research, Chinese Ministry of Education and Chinese Ministry of Health, and The State and Shandong Province Joint Key Laboratory of Translational Cardiovascular Medicine, Cheeloo College of Medicine, Shandong University, Qilu Hospital of Shandong University, Jinan, China
Purpose: The purpose of this study was to explore the performance of different parameter combinations of deep learning (DL) models (Xception, DenseNet121, MobileNet, ResNet50 and EfficientNetB0) and input image resolutions (REZs) (224 × 224, 320 × 320 and 488 × 488 pixels) for breast cancer diagnosis.
Methods: This multicenter study retrospectively studied gray-scale ultrasound breast images enrolled from two Chinese hospitals. The data are divided into training, validation, internal testing and external testing set. Three-hundreds images were randomly selected for the physician-AI comparison. The Wilcoxon test was used to compare the diagnose error of physicians and models under P=0.05 and 0.10 significance level. The specificity, sensitivity, accuracy, area under the curve (AUC) were used as primary evaluation metrics.
Results: A total of 13,684 images of 3447 female patients are finally included. In external test the 224 and 320 REZ achieve the best performance in MobileNet and EfficientNetB0 respectively (AUC: 0.893 and 0.907). Meanwhile, 448 REZ achieve the best performance in Xception, DenseNet121 and ResNet50 (AUC: 0.900, 0.883 and 0.871 respectively). In physician-AI test set, the 320 REZ for EfficientNetB0 (AUC: 0.896, P < 0.1) is better than senior physicians. Besides, the 224 REZ for MobileNet (AUC: 0.878, P < 0.1), 448 REZ for Xception (AUC: 0.895, P < 0.1) are better than junior physicians. While the 448 REZ for DenseNet121 (AUC: 0.880, P < 0.05) and ResNet50 (AUC: 0.838, P < 0.05) are only better than entry physicians.
Conclusion: Based on the gray-scale ultrasound breast images, we obtained the best DL combination which was better than the physicians.
Highlights
1. Different combinations [model_resolution (REZ)] will yield different performance for the 2D grayscale breast ultrasound image classification, with Xception_448, MobileNet_224, EfficientNetB0_320, ResNet50_448, and DenseNet121_448 being the best choices.
2. MobileNet_224, EfficientNetB0_320 and Xception_448 can achieve equivalent performance as senior physicians.
3. The lightweight model, such as MobileNet_224, is more dominant in small REZ images, which also indicates that it is suitable for mobile application scenarios.
4. Image REZ has a slight effect on time consuming for model prediction, with a slight increase in time consuming for large REZ.
Introduction
Breast cancer is the leading cause of death among women worldwide, with the highest incidence and the second highest mortality rate (1). Detecting and intervening in early stage could significantly improve 5-year-survival rate (2, 3).
Due to its portability and affordability, ultrasound (US) is most practical screening modality in different types of breasts, especially in dense breast (4). Since the fact that US is more accessible than mammography (5, 6), it is the first choice for breast early screening. However, the US is not sensitive enough to detect calcifications (7) and non-mass breast lesions (8, 9). Diagnose performance of US is highly operator-dependent. Therefore, there is an urgent need to find a method that is less operator-dependent and objectively reflects the nature of the tumor for breast cancer.
Deep learning (DL) can extract a large number of quantitative features from medical images, including features that are invisible to human eyes but could greatly improve diagnose accuracy (10–13). Breast US Artificial Intelligence (AI) can accurately identify breast masses in relation to the volume of masses (14–16). In addition, it can improve the diagnosis of early breast cancer, providing a reference for early diagnosis of non-mass lesions (17), determining the molecular subtypes (18, 19), pathological types (20), status of axillary lymph node metastasis (21, 22) and prognosis (23, 24). However, by analyzing and summarizing the current studies on intelligent discrimination based on breast US data, relationship of model_REZ and diagnose performance is not deeply explored. Lacking systematic review of model and parameters selection, no comparison between lightweight models (e.g., MobileNet, Xception, EfficientNetB0, etc.) (25–27) and heavyweight models (e.g., such as DenseNet121、ResNet50, etc.) (28, 29), no analysis and comparison of models under different image input REZs, and lack of comparison with physician diagnosis results. Therefore, the accuracy and precision of breast cancer diagnostic models and image combinations can be statistically determined by cross-comparison of multiple DL models and multiple image input REZs. Different models have different depth of networks, and the network depths are related to the input resolution. If we want to guarantee the best results of DL models, we should study the best combination of model depth and input REZ to ensure that a reasonably optimal models is used (30, 31).
Therefore, this study performed extensive cross-comparison of model_REZ and generalization tests: 1. Lightweight models (MobileNet, Xception and EfficientNetB0) and heavyweight models (DensNet121, and ResNet50). 2. Three dominant REZs (224 × 224 pixels, 320 × 320 pixels and 448×448 pixels). The above scientific hypotheses were verified by cross-comparisons: the diagnostic accuracy of the AI combinations (model_REZ) based on breast images is higher than senior physicians.
Materials and Methods
Research Objects
This multicenter study retrospectively examined 2D grayscale US breast images recruited from 2 Chinese hospitals from July 2015 to December 2020 with appropriate approval from the respective ethics committees. All benign and malignant nodules were confirmed pathologically after US testing.
Inclusion criteria: a. US-detected breast nodules, which diameter between 5.0 and 30.0 mm. b. Ability to show at least 3.0 mm of breast tissue around the nodule. c. Nodules must be Breast Imaging Reporting and Data System (BI-RADS) 0, 2, 3, 4a, 4b, 4c or 5. d. The nodules have not undergone interventional or surgery prior to the US examination. e. The patient underwent surgery or biopsy within 1 week of US data collection and pathology results were obtained.
Exclusion criteria: a. Normal breast. b. History of breast surgery or intervention. c. Poor image quality. d. without pathological results.
Instruments
The Philips, GE, and Mindray equipment were chosen to increase the model’s adaptability. The image sources are spread randomly and uniformly. The details of the instrument are listed below.
a. LOGIQ E9 (GE Medical Systems Ultrasound and Primary Care Diagnostics, USA) with ML6-15-D linear array probe.
b. EPIQ 5 (Philips Ultrasound, Inc. USA) with L12-5 linear array probe.
c. Resonan 7 (Mindray, China) with L11-3U linear array probe.
Data Preparation
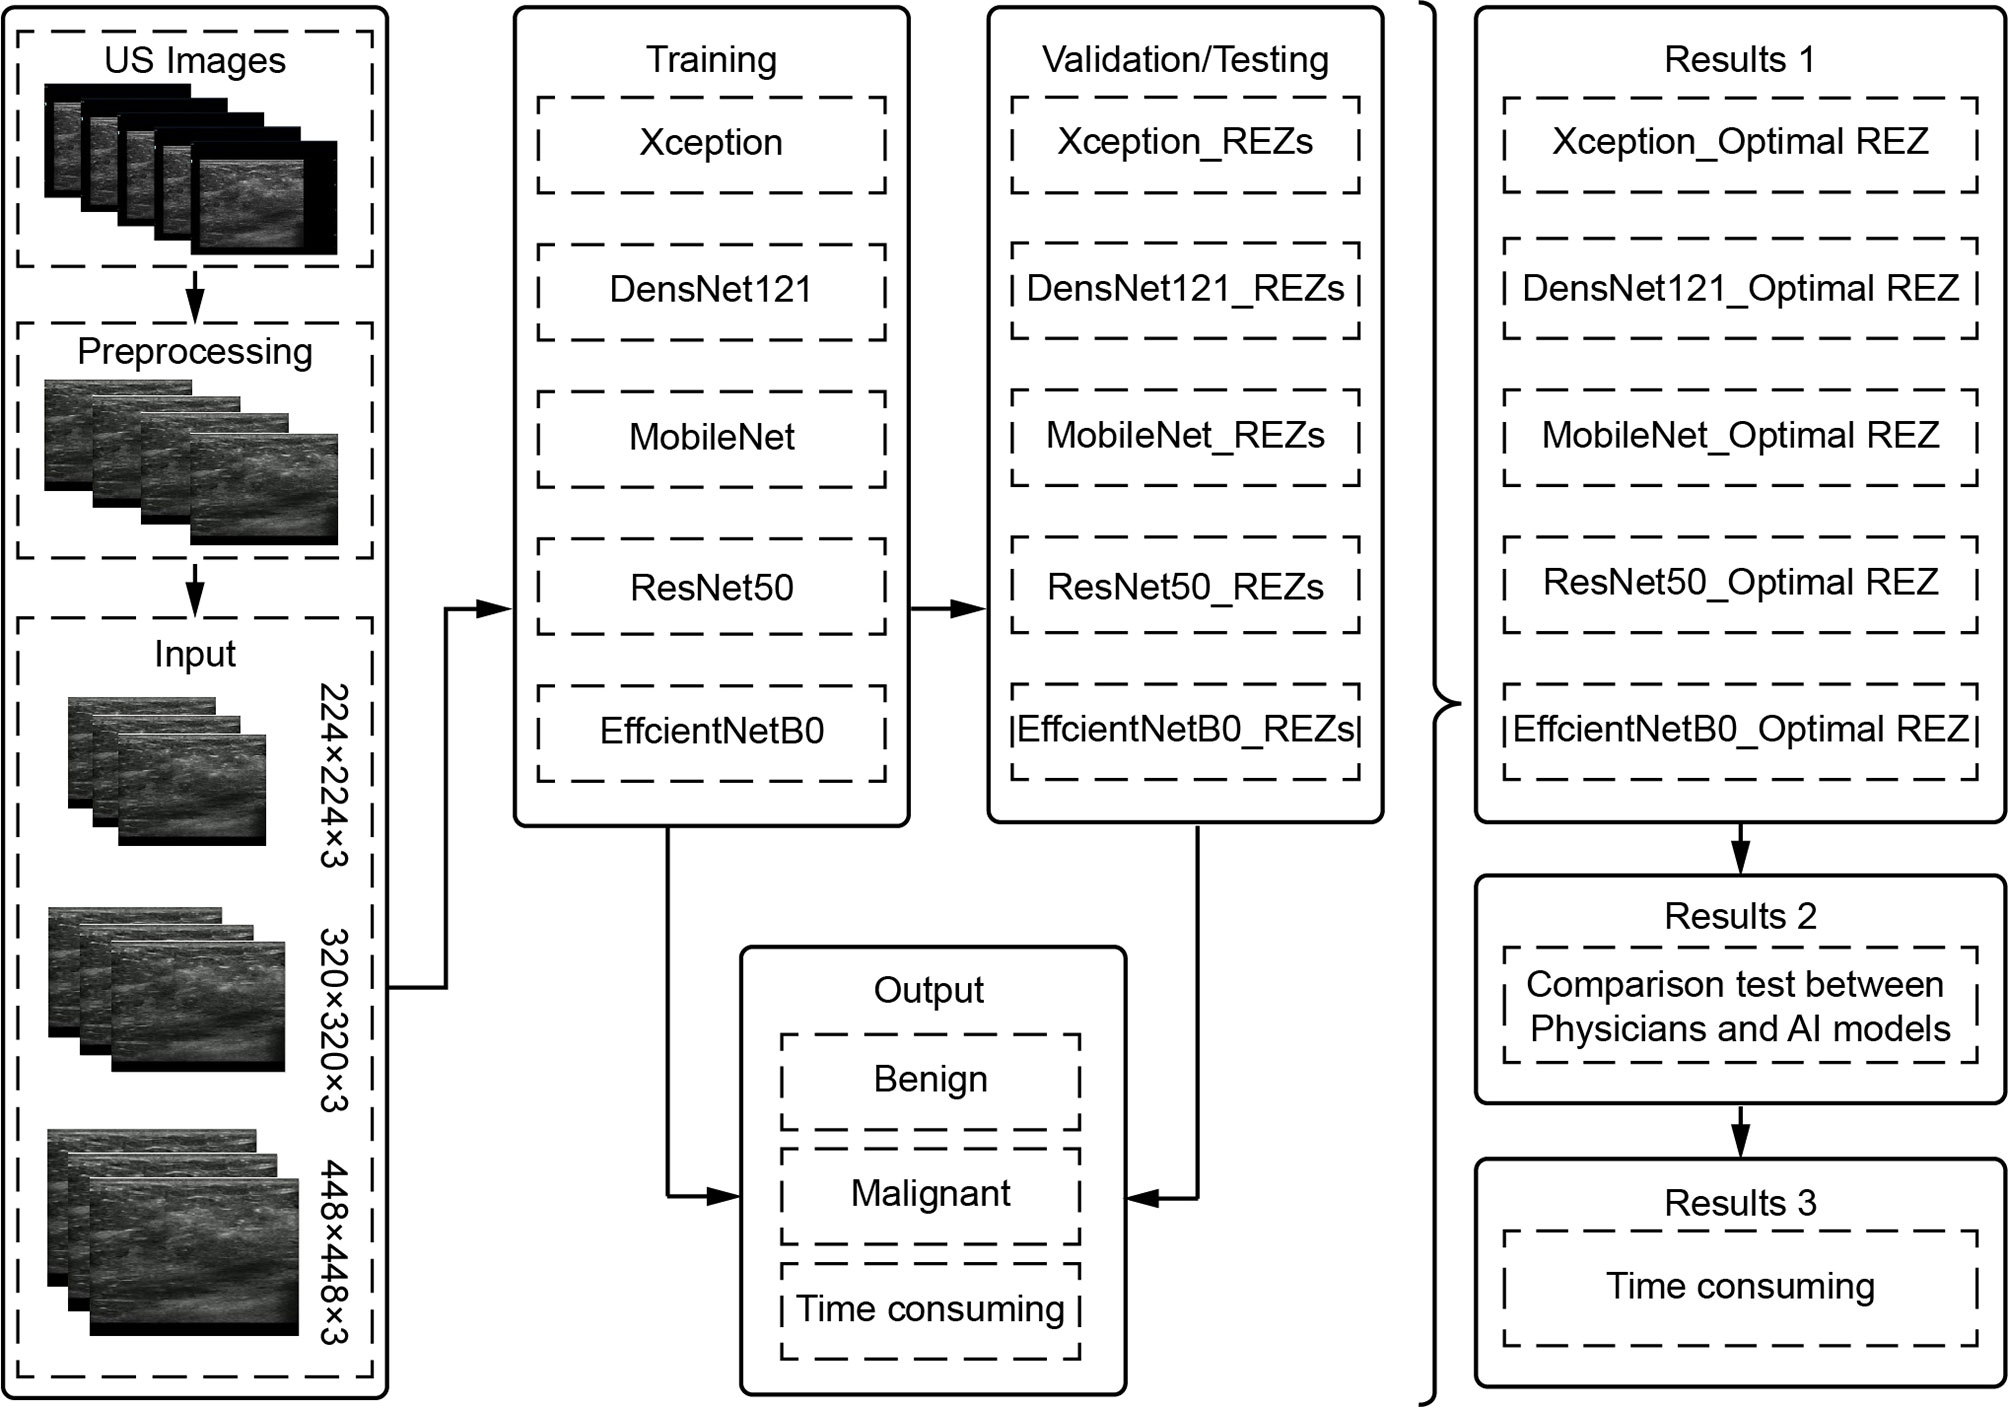
To filter the combinations (model REZ) suited for breast cancer US picture classification, three REZs (224×224、320×320 and 448×448) and five deep learning models (Xception, DenseNet121, MobileNet, ResNet50, and EfficientNetB0) were trained and tested (Figure 1).
Image Preprocessing
Image Cropping
The field-of-view (FOV) is extracted from the original image using image processing techniques by cropping out the device and patient-related information and keeping only the image window. Each FOV images is filled into a square and scaled to 224 × 224, 320 × 320, and 448 × 448, used as input data for model training and testing.
Image Enhancement
Prior to training the model, all image enhancements were performed using Python 3.9 as an automatic pre-processing process. This included Gaussian noise probability: 0.3, left-right flip probability: 0.5, rotation angle: -0.1: 0.1, X-axis shift: -0.1: 0.1, Y-axis shift: -0.1: 0.1, scaling. 0.7: 1, gamma correction. 0.6 to 1.6, stretching (left-right 50px, down 100px) and non-local average denoising (filter strength = 3, template window size = 7, search window size = 21).
Model Training and Validation
The data were divided into training, validation and test set in a ratio of 8:1:1. Also, it was ensured that all images of the same patient appeared in the same set.
The default setting of training 100 epochs, while setting EarlyStop, 15 epochs of validation set loss does not drop will end the training early. The default setting of batch_size is (32).
Model Testing
Internal and external tests were included in the test set. Three hundred images were randomly chosen from the test set for a comparison test of physicians and AI models, with the goal of determining not only the clinical usefulness of the models, but also whether the models’ diagnostic capabilities exceed those of physicians. The physcians did not known the results of AI and pathology. The process is as follows:
a. The AI combinations (model_REZ) make diagnoses independently.
b. Two physicians each from entry (<2 years), junior (2-5 years), and senior (>5 years) levels performed the diagnosis based on BI-RADS (33), which includes features such as size, shape, orientation, margin, echo pattern, posterior features, calcification and associated features.
Statistical Analysis
Python 3.9 was applied for statistical analysis. The significance level was set at P = 0.05. In physician-model test, P = 0.1 was considered statistically significant.
The Kolmogorov-Smirnov test was used as a normality test. If the normal distribution was matched, variables were expressed as mean ± standard deviation (SD). If not, the median and interquartile range (IQR) are reported. The values of categorical variables are expressed as number (%). Within-group differences were compared using the paired-samples to test for continuous variables conforming to a normal distribution, and the Mann-Whitney U test for non-normal continuous variables. The Wilcoxon test was used to compare the error between physicians and AI combinations. The Kappa test was used to determine the intra-group consistency among different levels of physicians. The Specificity, sensitivity, accuracy, receiver operating characteristic curve (ROC), area under the curve (AUC) and 95% confidence interval (95% CI) were used for evaluation.
Result
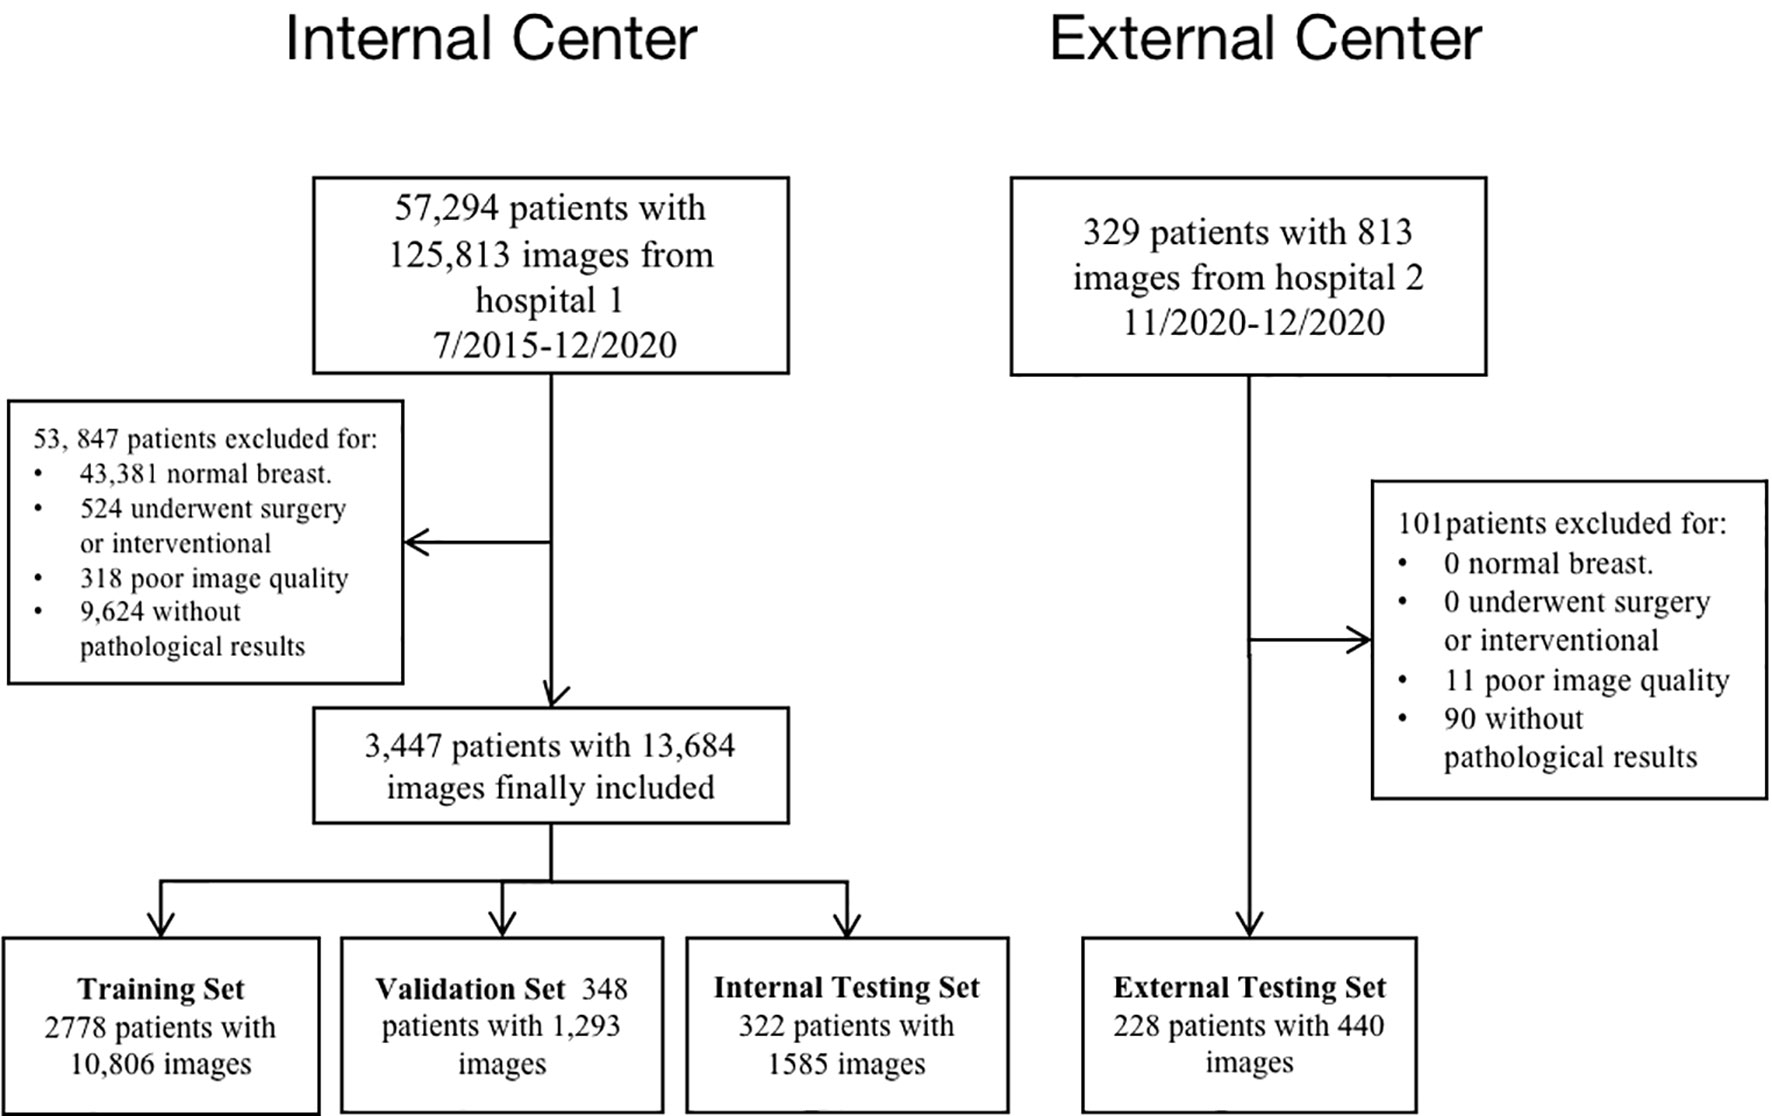
A final total of 13,684 grayscale US images from 3,447 female patients were included according to the inclusion and exclusion criteria from July 2015 to December 2020. On average, 4 valid grayscale US images were available for each patient. Of these, 2457 were benign tumors (9102 images) and 990 were malignant tumors (4582 images). The training set, validation set, and internal test set are 10,806, 1,293, and 1,585 images, respectively, according to the 8:1:1 of the number of patients. The external testing set are 440 images respectively. Table 1 show the distribution of baseline characteristics of the collected patients. Appendix Tables 1, 2 demonstrate the distribution of the study sample across trials. The flow chart is shown in Figure 2.
Diagnosis of AI Models
Internal Test
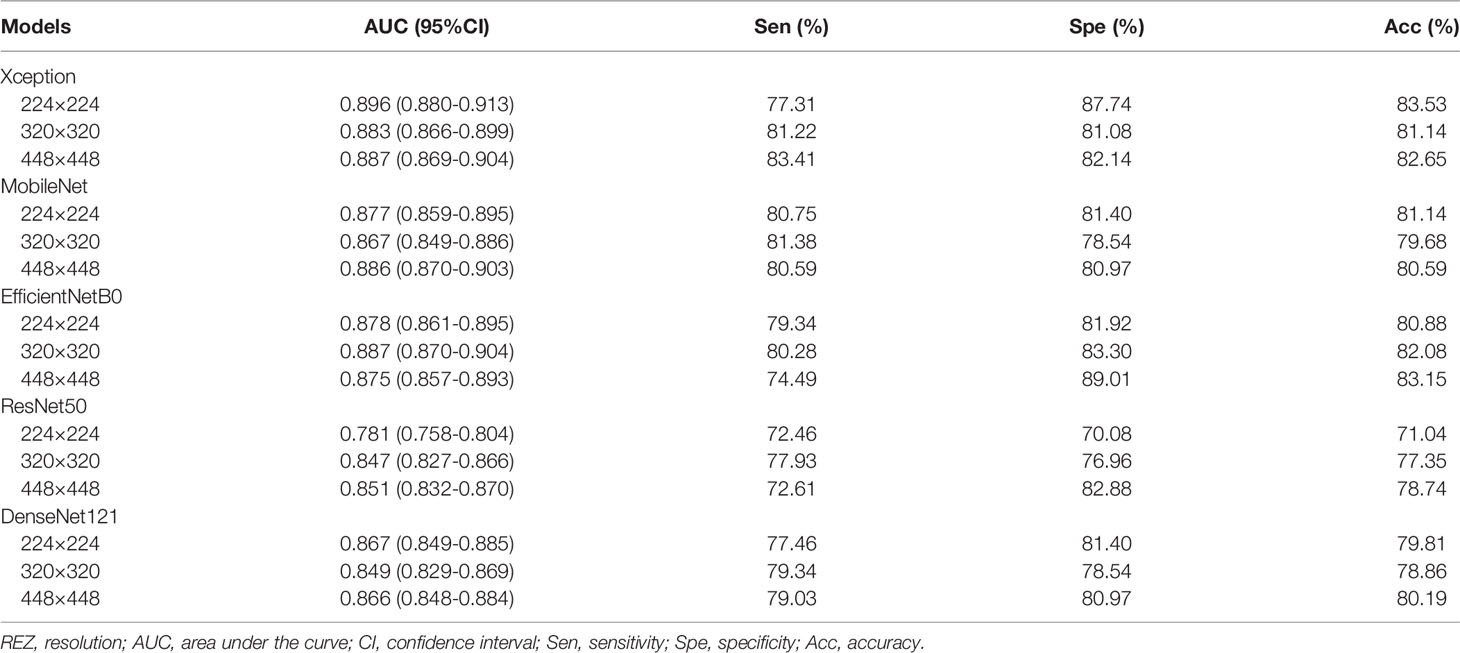
For MobileNet, 448 REZ achieve the best AUC (0.886), with sensitivity 80.59%, specificity 80.97% and accuracy 80.59%. For Xception, 224 REZ achieve the best AUC (0.896), with sensitivity 77.31%, specificity 87.74, accuracy 83.53%. For EfficientNetB0, 320 REZ achieve the best AUC (0.887), with sensitivity 80.28%, specificity 83.30% and accuracy 82.08%. For DenseNet121, 224 REZ achieve the best AUC (0.867), with sensitivity 77.46%, specificity 81.40% and accuracy 79.81%. For ResNet50, 448 REZ achieve the best AUC (0.851), with sensitivity 72.61%, specificity 82.88% and accuracy 78.74%. The detailed results were summarized in Table 2.
External Test
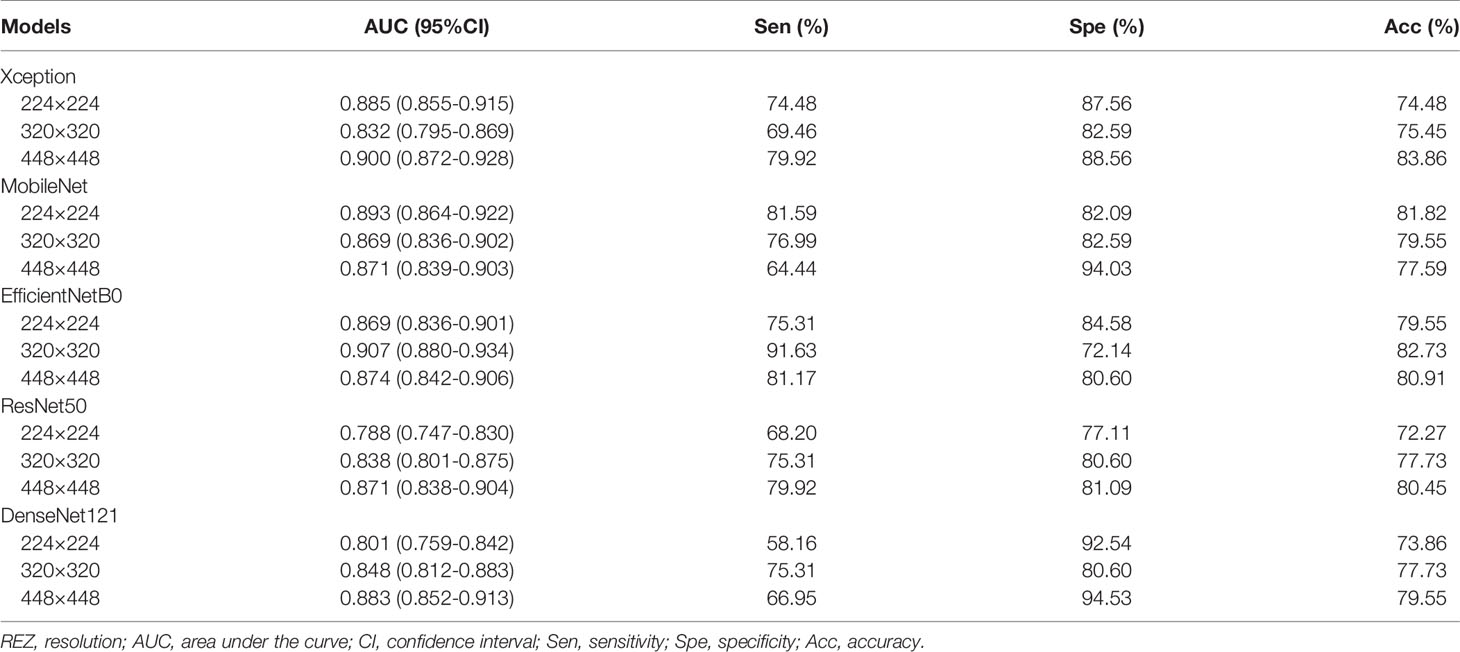
For MobileNet, 224 REZ achieve the best AUC (0.893), with sensitivity 81.59%, specificity 82.09% and accuracy 81.82%. For Xception, 448 REZ achieve the best AUC (0.900), with sensitivity 79.92%, specificity 88.56% and accuracy 83.86%. For EfficientNetB0, 320 REZ achieve the best AUC (0.907), with sensitivity 91.63%, specificity 72.14% and accuracy 82.73%. For DenseNet121, 448 REZ achieve the best AUC (0.883), with sensitivity 66.95%, specificity 94.53% and accuracy 79.55%. For ResNet50, 448 REZ achieve the best AUC (0.871), with sensitivity 79.92%, specificity 81.09% and accuracy 80.45%. The statistical results in detail are outlined in Table 3.
Physician-AI Test Set
The consistency and accuracy of the diagnosis improved with the clinical experience of the physicians. The above results are shown in Appendix Table 3.
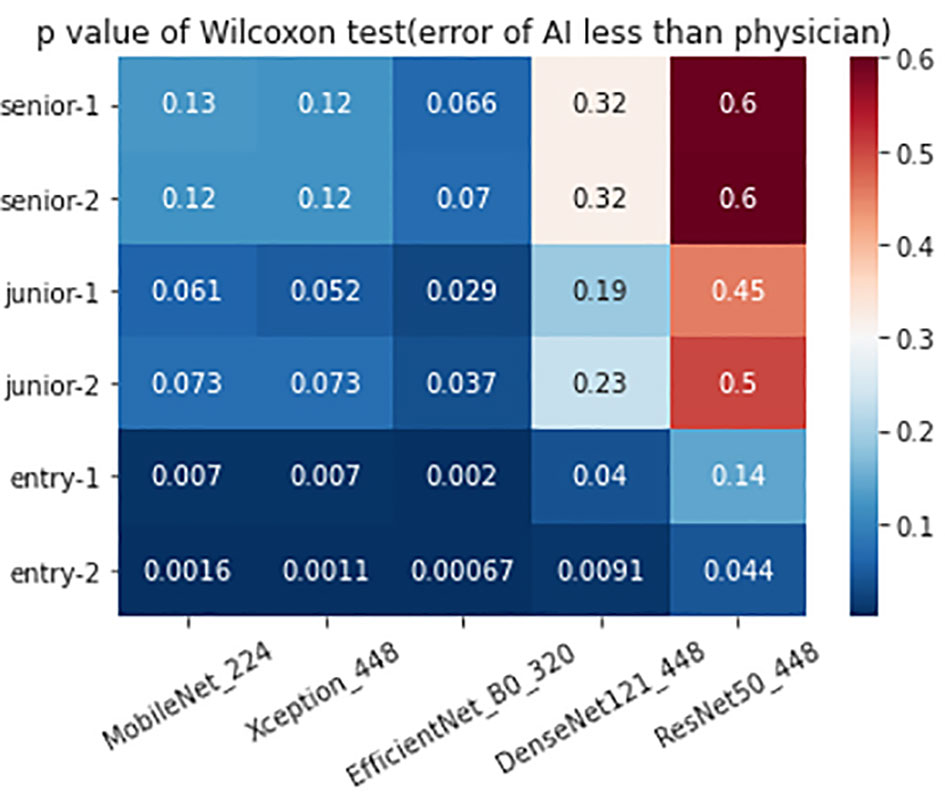
The 320 REZ for EfficientNetB0 (AUC: 0.896, P < 0.1) is better than senior physicians. The 224 REZ for MobileNet (AUC: 0.878, P < 0.1), 448 REZ for Xception (AUC: 0.895, P < 0.1) are better than junior physicians. The 448 REZ for DenseNet121 (AUC: 0.880, P < 0.05) and ResNet50 (AUC: 0.838, P < 0.05) are only better than entry physicians. The more detailed findings are presented in Figures 3, 4.
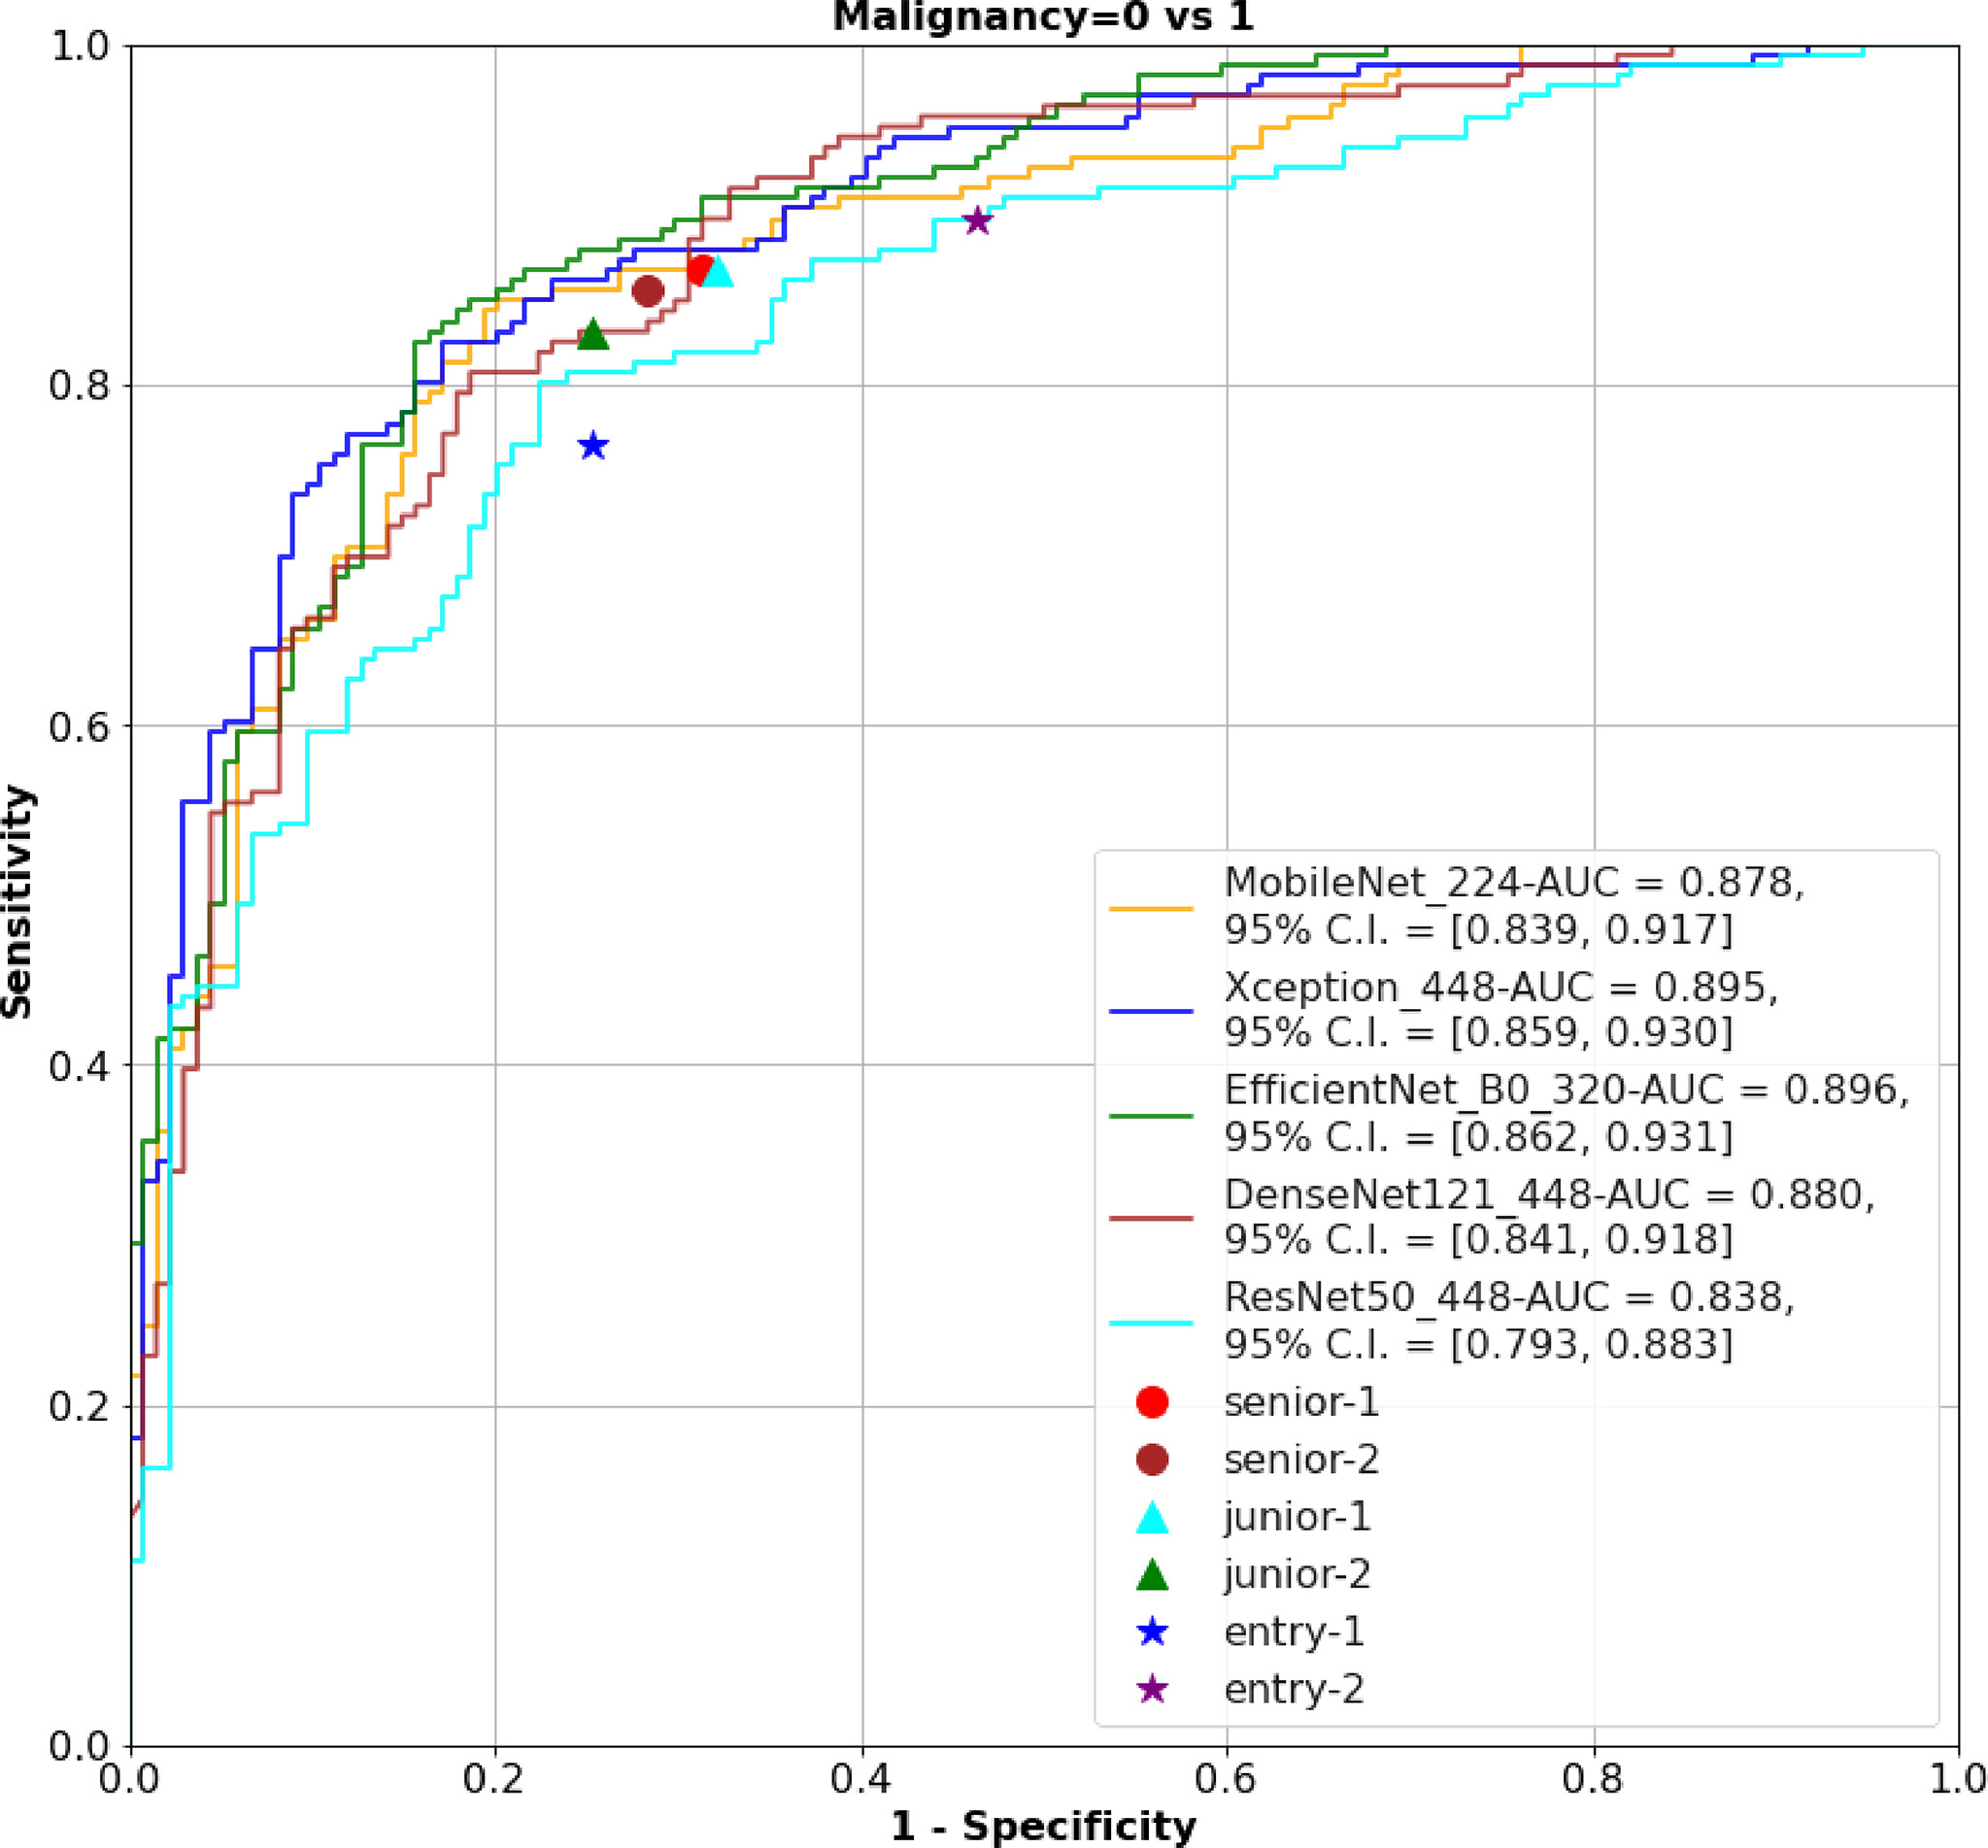
Figure 3 The ROC of the AI models and physicians. ROC, receiver operating characteristic; AI, Artificial Intelligence; AUC, area under curve.
Time Consuming
Time Consuming to Training Models
Each Epoch took 11.06 ± 1.26 min (P < 0.0001); each Batch required 1.97 ± 0.22 s (P < 0.0001), and theoretical training of 50 Epochs took 9.22 ± 1.05 h (P < 0.0001), with statistically significant variations (Appendix Table 4).
The Average Time of Predicting an Image
The difference in the average time taken by different models to predict an image is statistically significant. MobileNet_224 and 320 are the fastest models, both predicting within 0.02 s. The frame rate can reach 50 Frame/s, which is almost 1/4-1/3 of the Densenet121 time (Figure 5). REZ had an effect on the elapsed time of the model. A slight increase in elapsed time was observed for high REZ model predictions, with statistically significant differences within groups (Table 4; Figure 5).
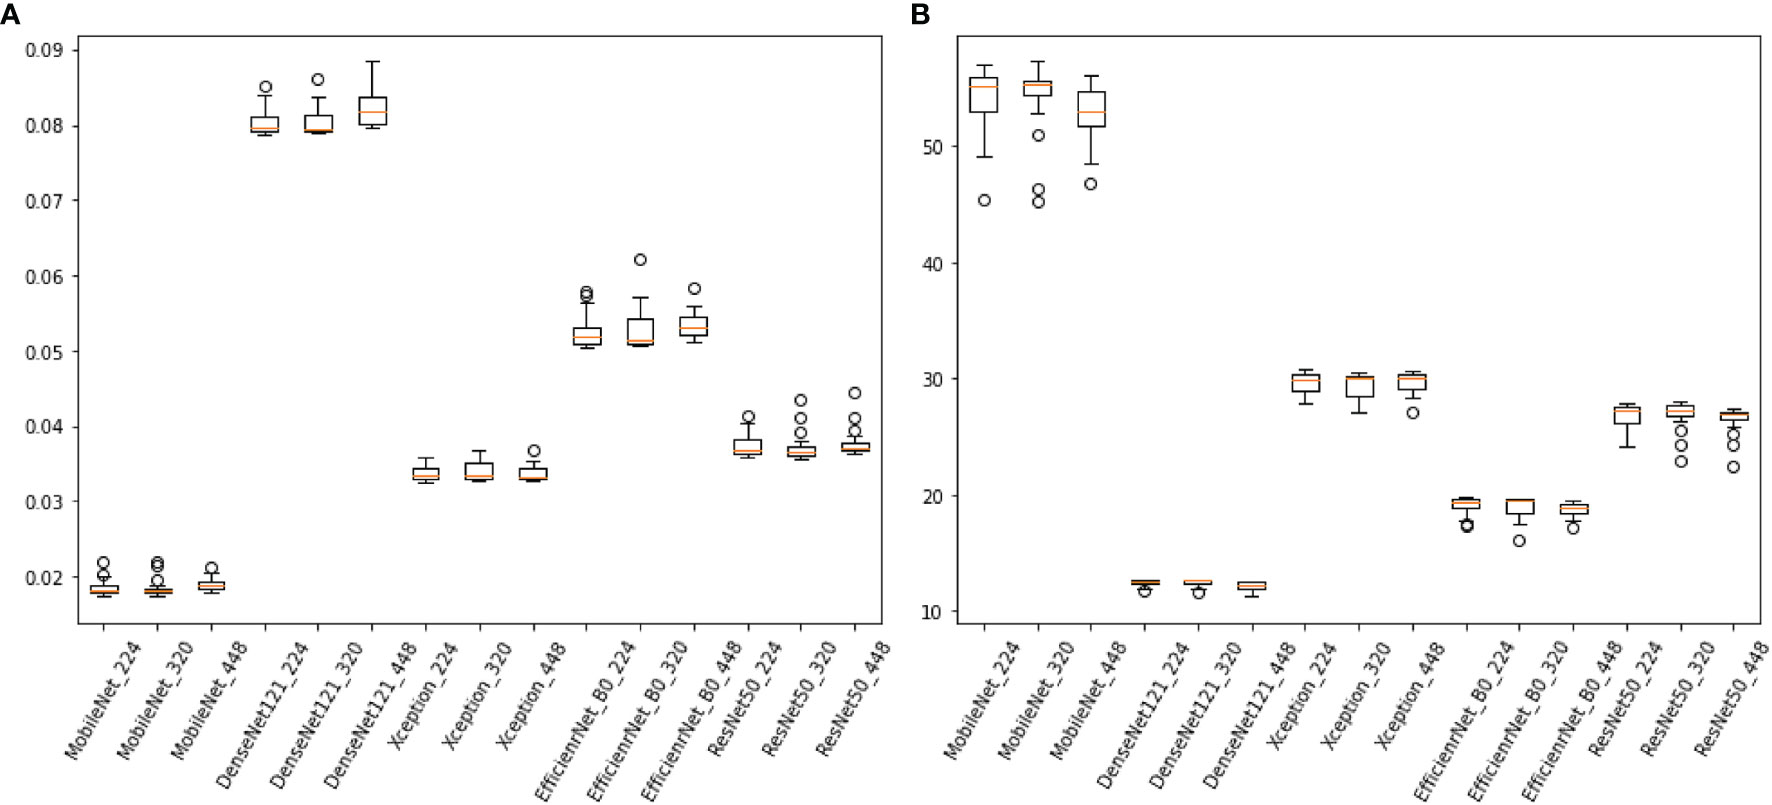
Figure 5 (A), the consuming time of predicting an image of models (sec/frame). (B) the frame rate of models (sec/frame).
Discussion
This study used 15 models to classify breast cancers at a higher degree than previous studies (32–35). The results showed that MobileNet_224, Xception_448 and EfficientNetB0_320 models showed the best diagnostic ability in tests set and physician-AI test set. This is the first study that we are aware of that specifically describes intra/intergroup comparisons of multiple models and REZs based on grayscale US breast images.
End-to-end philosophy of DL has benefited a lot for reducing the heavy workload preparing datasets. Only pathological findings were used as markers in this investigation, with no annotation of US pictures. It significantly reduces the initial workload. This study and a previous study (36) of our team found that, not only did this DL method produce good diagnostic results, but the diagnostic idea was similar to that of the physician.
The 224×224, 320×320 and 448×448 pixels were adopted in this study because these three REZs are commonly used in engineering (18, 22, 37). They are both obtained after scaling on the original size, and the different REZs react to the same model affecting the size of the convolutional kernel field of perception (38). In convolutions, images with small REZs do consume less computation time than large REZ, but may lose more information and produce misleading results (39). In this research, we found an increase in the consumption time of the model fed by high-REZ images, which is consistent with what has been reported in the literatures (40).
In both the external and physician-AI tests, MobileNet_224, EfficientNetB0_320, and Xception_448 surpass the other four models and all physicians. MobileNet can be a vision model built on handheld and mobile equipment. Although small image REZ has its own drawbacks (39), we can appropriately reduce the image REZ to increase speed to benefit portable US devices while having good accuracy and efficiency (25). While the high REZ of the input image (320×320) may increase computational cost, EfficientNetB0 uses an efficient convolutional neural networks architecture to process slightly larger images at a relatively similar cost to smaller images (41, 42). Using depth-segmented convolution in Xception provides similar properties to the original module, while being as easy to use as a normal convolutional layer. The convergence process is faster and more accurate when the nonlinear activation function is not used (43). Thus, when the input REZ is further increased to 448 × 448, Xception_448 is the best. This study found some difficulties in the selection of image inputs for ResNet50 and DenseNet121. In physician-AI test set, ResNet50_448 and DenseNet121_448 had only higher AUCs than those of entry physicians.
More data and richer data types are obvious ways to improve the efficiency of model diagnosis (44). The imbalance of the sample has an effect on the model. If all the data are trained together, it may appear balanced on the surface, but this can be masked in the real world. Sample imbalance at different aspects can have an impact on the final results of the model (45). Therefore, developing “one model for all situations” may still be a long process. Currently, more breast AI experiments of US with targeted and multimodal have been designed to address some problems on a smaller scale. They may become a more achievable goal in the short term, such as the prediction of lymph node metastasis, molecular subtypes and pathological types of breast cancer (18–22).
The hypothesis of this study is that AI is superior to physicians. And in order to reduce the type 2 errors in statistics and prevent the result that AI dominates the physician’s diagnosis, we argue that setting P to 0.1 is critical in the physician-AI test set. This is because AI is supposed to be an assistant not a decision maker that substitutes the doctor. If the type 2 error is too large, it will lead to more reliance on AI, which is a bad news for medicine, especially for hospitals in remote areas or less experienced physicians.
Numerous breast AI of US studies have demonstrated the amazing utility and reliability of this technique (14–24). But previous efforts have focused more on what AI can do and how far it can go, ignoring the differences in models across REZs, devices, and even users. Therefore, a study of these combinations (model_REZ) is necessary. It balances the efficiency, accuracy and reliability of breast AI of US, and provide a theoretical basis for specific equipment demands in future.
The data is often divided into training, validation and test sets following a ratio of 8:1:1 and 7:1:2 (46–48). When the sample size is small and the test set needs more, 7:1:2 is preferred. In this study, the sample size is 13,684, which is relatively large in ultrasound AI researches, thus we choose the ratio of 8:1:1. The sample size of the study by Ren was close to our study (47).
There are some limitations to this research. a: The study’s sample size was small, and the pathology was unevenly distributed. The origin of the instruments was not differentiated. Subsequently, more subgroups could be added for analysis. b: This study is a retrospective analysis with only a small amount of external validation data. c: Only static images were analyzed in this study. Video data and a multi-omics data can be added later to improve the richness of training.
Conclusion
Based on unlabeled 2D grayscale images of breast US, this study obtained the optimal combinations (model_REZ) and outperformed the entry, junior and senior practitioners. This study also reveals the promising application of unlabeled ROI in medical imaging of DL, which greatly reduces the cost and time.
Data Availability Statement
The data analyzed in this study is subject to the following licenses/restrictions: We have further studies that require this database. Requests to access these datasets should be directed to HW,MjM0NzIxODAwQHFxLmNvbQ==.
Ethics Statement
The studies involving human participants were reviewed and approved by Shenzhen people’s hospital of the ethics committee. The patients/participants provided their written informed consent to participate in this study.
Author Contributions
HW contributed to the study concepts, designed the study, HW and XY collected and organized all the images; YJ contributed to the model training, validation, testing, and statistical analysis. HW and YJ contributed to data analysis and interpreted the data and HW prepared the manuscript. They contributed to the study equally and shared the first authorship.
Funding
This project was supported by Commission of Science and Technology of Shenzhen (GJHZ20200731095401004).
Conflict of Interest
Authors YJ, CC and SS were employed by Microport Prophecy and Illuminate Limited Liability Company.
The remaining authors declare that the research was conducted in the absence of any commercial or financial relationships that could be construed as a potential conflict of interest.
Publisher’s Note
All claims expressed in this article are solely those of the authors and do not necessarily represent those of their affiliated organizations, or those of the publisher, the editors and the reviewers. Any product that may be evaluated in this article, or claim that may be made by its manufacturer, is not guaranteed or endorsed by the publisher.
Acknowledgments
This project was supported by Commission of Science and Technology of Shenzhen (GJHZ20200731095401004). Thanks for the support and help of our D.team of ultrasound department Shenzhen People’s Hospital.
Supplementary Material
The Supplementary Material for this article can be found online at: https://www.frontiersin.org/articles/10.3389/fonc.2022.869421/full#supplementary-material
Abbreviations
AI, Artificial Intelligence; AUC, area under curve; BI-RADS, breast imaging reporting and data system; CI, confidence interval; DL, Deep Learning; IQR, interquartile range; ML, Machine Learning; ROC, receiver operating characteristic; ROI, region of interest; SD, standard deviation; SL, supervised learning; SSL, semi-supervised learning; US, Ultrasound.
References
1. Siegel RL, Miller KD, Fuchs HE, Jemal A. Cancer Statistics, 2021. CA Cancer J Clin (2021) 71(1):7–33. doi: 10.3322/caac.21654
2. Cedolini C, Bertozzi S, Londero AP, Bernardi S, Seriau L, Concina S, et al. Type of Breast Cancer Diagnosis, Screening, and Survival. Clin Breast Cancer (2014) 14(4):235–40. doi: 10.1016/j.clbc.2014.02.004
3. Massat NJ, Dibden A, Parmar D, Cuzick J, Sasieni PD, Duffy SW. Impact of Screening on Breast Cancer Mortality: The UK Program 20 Years on. Cancer Epidemiol Biomarkers Prev (2016) 25(3):455–62. doi: 10.1158/1055-9965.EPI-15-0803
4. Osako T, Takahashi K, Iwase T, Iijima K, Miyagi Y, Nishimura S, et al. Diagnostic Ultrasonography and Mammography for Invasive and Noninvasive Breast Cancer in Women Aged 30 to 39 Years. Breast Cancer (2007) 14(2):229–33. doi: 10.2325/jbcs.891
5. Jin ZQ, Lin MY, Hao WQ, Jiang HT, Zhang L, Hu WH, et al. Diagnostic Evaluation of Ductal Carcinoma in Situ of the Breast: Ultrasonographic, Mammographic and Histopathologic Correlations. Ultrasound Med Biol (2015) 41(1):47–55. doi: 10.1016/j.ultrasmedbio.2014.09.023
6. Su X, Lin Q, Cui C, Xu W, Wei Z, Fei J, et al. Non-Calcified Ductal Carcinoma in Situ of the Breast: Comparison of Diagnostic Accuracy of Digital Breast Tomosynthesis, Digital Mammography, and Ultrasonography. Breast Cancer (2017) 24(4):562–70. doi: 10.1007/s12282-016-0739-7
7. Yang WT, Tse G. Sonographic, Mammographic, and Histopathologic Correlation of Symptomatic Ductal Carcinoma In Situ. AJR Am J Roentgenol (2004) 182(1):101–10. doi: 10.2214/ajr.182.1.1820101
8. Spick C, Baltzer PA. Diagnostic Utility of Second-Look US for Breast Lesions Identified at MR Imaging: Systematic Review and Meta-Analysis. Radiology (2014) 273(2):401–9. doi: 10.1148/radiol.14140474
9. Spick C, Schernthaner M, Pinker K, Kapetas P, Bernathova M, Polanec SH, et al. MR-Guided Vacuum-Assisted Breast Biopsy of MRI-Only Lesions: A Single Center Experience. Eur Radiol (2016) 26(11):3908–16. doi: 10.1007/s00330-016-4267-9
10. Hinton G. Deep Learning-A Technology With the Potential to Transform Health Care. JAMA (2018) 320(11):1101–2. doi: 10.1001/jama.2018.11100
11. Huang YQ, Liang CH, He L, Tian J, Liang CS, Chen X, et al. Development and Validation of a Radiomics Nomogram for Preoperative Prediction of Lymph Node Metastasis in Colorectal Cancer. J Clin Oncol (2016) 34(18):2157–64. doi: 10.1200/JCO.2015.65.9128
12. Huang Y, Liu Z, He L, Chen X, Pan D, Ma Z, et al. Radiomics Signature: A Potential Biomarker for the Prediction of Disease-Free Survival in Early-Stage (I or II) Non-Small Cell Lung Cancer. Radiology (2016) 281(3):947–57. doi: 10.1148/radiol.2016152234
13. Ouyang D, He B, Ghorbani A, Yuan N, Ebinger J, Langlotz CP, et al. Video-Based AI for Beat-to-Beat Assessment of Cardiac Function. Nature (2020) 580(7802):252–6. doi: 10.1038/s41586-020-2145-8
14. Cao Z, Duan L, Yang G, Yue T, Chen Q. An Experimental Study on Breast Lesion Detection and Classification From Ultrasound Images Using Deep Learning Architectures. BMC Med Imaging (2019) 19(1):51. doi: 10.1186/s12880-019-0349-x
15. Wang Y, Wang N, Xu M, Yu J, Qin C, Luo X, et al. Deeply-Supervised Networks With Threshold Loss for Cancer Detection in Automated Breast Ultrasound. IEEE Trans Med Imaging (2020) 39(4):866–76. doi: 10.1109/TMI.2019.2936500
16. Wang F, Liu X, Yuan N, Qian B, Ruan L, Yin C, et al. Study on Automatic Detection and Classification of Breast Nodule Using Deep Convolutional Neural Network System. J Thorac Dis (2020) 12(9):4690–701. doi: 10.21037/jtd-19-3013
17. Xiang H, Huang YS, Lee CH, Chang Chien TY, Lee CK, Liu L, et al. 3-D Res-CapsNet Convolutional Neural Network on Automated Breast Ultrasound Tumor Diagnosis. Eur J Radiol (2021) 138:109608. doi: 10.1016/j.ejrad.2021.109608
18. Zhou BY, Wang LF, Yin HH, Wu TF, Ren TT, Peng C, et al. Decoding the Molecular Subtypes of Breast Cancer Seen on Multimodal Ultrasound Images Using an Assembled Convolutional Neural Network Model: A Prospective and Multicentre Study. EBioMedicine (2021) 74:103684. doi: 10.1016/j.ebiom.2021.103684
19. Jiang M, Zhang D, Tang SC, Luo XM, Chuan ZR, Lv WZ, et al. Deep Learning With Convolutional Neural Network in the Assessment of Breast Cancer Molecular Subtypes Based on US Images: A Multicenter Retrospective Study. Eur Radiol (2021) 31(6):3673–82. doi: 10.1007/s00330-020-07544-8
20. Qian L, Lv Z, Zhang K, Wang K, Zhu Q, Zhou S, et al. Application of Deep Learning to Predict Underestimation in Ductal Carcinoma in Situ of the Breast With Ultrasound. Ann Transl Med (2021) 9(4):295. doi: 10.21037/atm-20-3981
21. Zhou LQ, Wu XL, Huang SY, Wu GG, Ye HR, Wei Q, et al. Lymph Node Metastasis Prediction From Primary Breast Cancer US Images Using Deep Learning. Radiology (2020) 294(1):19–28. doi: 10.1148/radiol.2019190372
22. Zheng X, Yao Z, Huang Y, Yu Y, Wang Y, Liu Y, et al. Deep Learning Radiomics can Predict Axillary Lymph Node Status in Early-Stage Breast Cancer. Nat Commun (2020) 11(1):1236. doi: 10.1038/s41467-020-15027-z
23. Guo Y, Hu Y, Qiao M, Wang Y, Yu J, Li J, et al. Radiomics Analysis on Ultrasound for Prediction of Biologic Behavior in Breast Invasive Ductal Carcinoma. Clin Breast Cancer (2018) 18(3):e335–e44. doi: 10.1016/j.clbc.2017.08.002
24. Qian L, Lv Z, Zhang K, Wang K, Zhu Q, Zhou S, et al. Application of Deep Learning to Predict Underestimation in Ductal Carcinoma in Situ of the Breast With Ultrasound. Ann Transl Med (2021) 9(4):295. doi: 10.21037/atm-20-3981
25. Howard AG, Zhu M, Chen B, Kalenichenko D, Wang W, Weyand T, et al. MobileNets: Efficient Convolutional Neural Networks for Mobile Vision Applications. arXiv pre-print arXiv (2017):1704.04861. doi: 10.48550/arXiv.1704.04861
26. Chollet F. (2017). Xception: Deep Learning With Depthwise Separable Convolutions, in: Proceedings of the IEEE conference on computer vision and pattern recognition, pp. 1251–8.
27. Tan M, Le Q. (2019) EfficientNet: Rethinking Model Scaling for Convolutional Neural Networks. In International conference on machine learning. pp. 6105–14 PMLR.
28. Huang G, Liu Z, van der Maaten L, Weinberger KQ. Densely Connected Convolutional Networks. In Proceedings of the IEEE conference on computer vision and pattern recognition(2017) 4700–8. doi: 10.1109/CVPR.2017.243
29. He K, Zhang X, Ren S, Sun J. Deep Residual Learning for Image Recognition. In Proceedings of the IEEE conference on computer vision and pattern recognition (2016):770–8. doi: 10.1109/CVPR.2016.90
30. Esteva A, Kuprel B, Novoa RA, Ko J, Swetter SM, Blau HM, et al. Dermatologist-Level Classification of Skin Cancer With Deep Neural Networks. Nature (2017) 542(7639):115–8. doi: 10.1038/nature21056
31. Erickson BJ, Korfiatis P, Kline TL, Akkus Z, Philbrick K, Weston AD. Deep Learning in Radiology: Does One Size Fit All? J Am Coll Radiol (2018) 15(3 Pt B):521–6. doi: 10.1016/j.jacr.2017.12.027
32. Yap MH, Pons G, Martí J, Ganau S, Sentís M, Zwiggelaar R, et al. Automated Breast Ultrasound Lesions Detection Using Convolutional Neural Networks. IEEE J Biomed Health Inform (2017) 22(4):1218–26. doi: 10.1109/JBHI.2017.2731873
33. Qi X, Zhang L, Chen Y, Pi Y, Chen Y, Lv Q, et al. Automated Diagnosis of Breast Ultrasonography Images Using Deep Neural Networks. Med image Analysis (2019) 52:185–98. doi: 10.1016/j.media.2018.12.006
34. Cheng J-Z, Ni D, Chou Y-H, Qin J, Tiu C-M, Chang Y-C, et al. Computer-Aided Diagnosis With Deep Learning Architecture: Applications to Breast Lesions in US Images and Pulmonary Nodules in CT Scans. Sci Rep (2016) 6(1):1–13. doi: 10.1038/srep24454
35. Han S, Kang HK, Jeong JY, Park MH, Kim W, Bang WC, et al. A Deep Learning Framework for Supporting the Classification of Breast Lesions in Ultrasound Images. Phys Med Biol (2017) 62(19):7714. doi: 10.1088/1361-6560/aa82ec
36. Dong F, She R, Cui C, Shi S, Hu X, Zeng J, et al. One step further into the blackbox: a pilot study of how to build more confidence around an AI-based decision system of breast nodule assessment in 2D ultrasound. Eur Radiol (2021) 31(7):4991–5000. doi: 10.1007/s00330-020-07561-7
37. Patil SM, Tong L, Wang MD. Generating Region of Interests for Invasive Breast Cancer in Histopathological Whole-Slide-Image. Proc COMPSAC (2020):723–28.
38. Erickson BJ, Korfiatis P, Kline TL, Akkus Z, Philbrick K, Weston AD, et al. Deep learning in radiology: does one size fit all? J Am College Radiol (2008) 15(3):521–6.
39. Pinto N, Cox DD, Di Carlo JJ. Why is real-world visual object recognition hard? PLoS Computational Biology (2008) 4(1):e27.
40. Ma P, Zhang H, Fan W, Wang C, Wen G, Zhang X. A Novel Bearing Fault Diagnosis Method Based on 2D Image Representation and Transfer Learning-Convolutional Neural Network. Measurement Sci Technol (2019) 30(5):055402. doi: 10.1088/1361-6501/ab0793
41. Gao P, Lu K, Xue J (2020). EfficientFAN: Deep Knowledge Transfer for Face Alignment, in: Proceedings of the 2020 International Conference on Multimedia Retrieval, pp. 215–23.
42. Laschowski B, McNally W, Wong A, McPhee J. Environment Classification for Robotic Leg Prostheses and Exoskeletons Using Deep Convolutional Neural Networks. Front Neurorobot (2022) 15:730965. doi: 10.3389/fnbot.2021.730965
43. Hirahara D. (2019). Preliminary Assessment for the Development of CADe System for Brain Tumor in MRI Images Utilizing Transfer Learning in Xception Model, In: 2019 IEEE 8th Global Conference on Consumer Electronics (GCCE), pp. 922–924 . IEEE.
44. Chougrad H, Zouaki H, Alheyane O. Deep Convolutional Neural Networks for Breast Cancer Screening. Comput Methods Programs Biomed (2018) 157:19–30. doi: 10.1016/j.cmpb.2018.01.011
45. Geleijnse G, Chiang RC-J, Sieswerda M, Schuurman M, Lee KC, Van Soest J, et al. Prognostic Factors Analysis for Oral Cavity Cancer Survival in the Netherlands and Taiwan Using a Privacy-Preserving Federated Infrastructure. Sci Rep(2020) 10(1):20526. doi: 10.1038/s41598-020-77476-2
46. Huang Z, Liu X, Wang R, Chen Z, Yang Y, Liu X, et al. Learning a Deep CNN Denoising Approach Using Anatomical Prior Information Implemented With Attention Mechanism for Low-Dose CT Imaging on Clinical Patient Data From Multiple Anatomical Sites. IEEE J BioMed Health Inform (2021) 25(9):3416–27. doi: 10.1109/JBHI.2021.3061758
47. Ren X, Li T, Yang X, Wang S, Ahmad S, Xiang L, et al. Regression Convolutional Neural Network for Automated Pediatric Bone Age Assessment From Hand Radiograph. IEEE J BioMed Health Inform (2019) 23(5):2030–8. doi: 10.1109/JBHI.2018.2876916
Keywords: breast cancer, deep learning, ultrasound, resolution, artifical intelligence
Citation: Wu H, Ye X, Jiang Y, Tian H, Yang K, Cui C, Shi S, Liu Y, Huang S, Chen J, Xu J and Dong F (2022) A Comparative Study of Multiple Deep Learning Models Based on Multi-Input Resolution for Breast Ultrasound Images. Front. Oncol. 12:869421. doi: 10.3389/fonc.2022.869421
Received: 04 February 2022; Accepted: 23 May 2022;
Published: 07 July 2022.
Edited by:
Siuly Siuly, Victoria University, AustraliaReviewed by:
Ujjwal Raghunandan Baid, Shri Guru Gobind Singhji Institute of Engineering and Technology, IndiaWenwu Ling, Sichuan University, China
Copyright © 2022 Wu, Ye, Jiang, Tian, Yang, Cui, Shi, Liu, Huang, Chen, Xu and Dong. This is an open-access article distributed under the terms of the Creative Commons Attribution License (CC BY). The use, distribution or reproduction in other forums is permitted, provided the original author(s) and the copyright owner(s) are credited and that the original publication in this journal is cited, in accordance with accepted academic practice. No use, distribution or reproduction is permitted which does not comply with these terms.
*Correspondence: Jinfeng Xu, eHVqaW5mZW5nQHlhaG9vLmNvbQ==; Fajin Dong, ZG9uZ2ZhamluQHN6aG9zcGl0YWwuY29t
†These authors share first authorship
 Huaiyu Wu
 Xiuqin Ye1†
 Yitao Jiang
 Hongtian Tian
 Keen Yang
 Yan Liu
 Jinfeng Xu
 Fajin Dong