 Yi-Rong Liu
 Hong-Hui He
 Jian Wu
- 1School of Medicine, Tsinghua University, Beijing, China
- 2Tsinghua Shenzhen International Graduate School, Tsinghua University, Shenzhen, China
As for optical techniques, it is difficult for the 5-aminolevulinic (5-ALA) fluorescence guidance technique to completely detect glioma due to residual cells in the blind area and the dead angle of vision under microscopy. The purpose of this research is to characterize different microstructural information and optical properties of formalin-soaked unstained glioblastoma (GBM) and non-GBM tissue with the polarization imaging technique (PIT), and provide a novel method to detect GBM during surgery. In this paper, a 3×3 Mueller matrix polarization experimental system in backscattering mode was built to detect the GBM and non-GBM tissue bulk. The Mueller matrix decomposition and transformation parameters of GBM and non-GBM tissue were calculated and analyzed, and showed that parameters (1−Δ) and t are good indicators for distinguishing GBM from non-GBM tissues. Furthermore, the central moment coefficients (CMCs) of the frequency distribution histogram (FDH) were also calculated and used to distinguish the cancerous tissues. The results of the experiments confirmed the feasibility of PIT applied in the clinic to detect glioma, laying the foundation for the subsequent non-invasive, non-staining glioma detection.
1 Introduction
Glioma is a type of malignant primary brain tumor that originated from glial cells. Tumor invasiveness makes it difficult to distinguish tumors from normal brain tissues visually, and the residual invasive cancer cells always lead to glioma recurrence and a negative impact on overall survival. Therefore, it is critical to distinguish between the glioma and normal brain tissues in glioma surgery; preoperative and intraoperative imaging methods can help determine the location of glioma and improve the resection rate of glioma while preserving the brain function of the patients (1). Clinically, the intraoperative imaging methods of glioma include ultrasound (US), magnetic resonance imaging (MRI), and various other optical techniques. However, MRI has low specificity and cannot completely identify the residual invasive glioma cells (2–4), and the use of intraoperative MRI may prolong the operative time and increase the risk of infection (3). The identification of glioma by US, although being cost-effective and easy to operate, depends mostly on the experience and skill of surgeons. As for optical techniques, it is difficult for the 5-aminolevulinic acid (5-ALA) fluorescence guidance technique to completely resect glioma due to residual cells in the blind area and the dead angle of vision under microscopy.
In fact, the occurrence and development of glioma can be characterized by different optical features from the normal brain white matter; therefore, in this paper we applied a new technique to detect glioma: polarization imaging technique (PIT). PIT is a potentially powerful and non-invasive method that carries rich microstructural optical information about biological tissues (5–8) and can be used to detect pathological changes (6, 9). The detected sample’s polarization information is carried out in a Mueller matrix (10–12), which has shown to be a comprehensive description and potential diagnostic tool for various complex tissues, and has been widely applied on biomedical diagnosis, especially cancer detection (13–21). Furthermore, conventional polarimetry combined with interferometry (22) techniques is promising to assess the 3D morphology of biological tissues and help confirm diagnosis of the disease (23).
PIT can provide optical difference and useful contrasts between the lesion and the healthy region when it is insufficient to be observed using conventional unpolarized-light-source intensity imaging methods. In the past few years, based on histological examination of the detected sample as the gold standard, various PIT images of cancers have been reported to differentiate between healthy and cancerous tissue (13, 24–30). In particular, tissue polarimetry was used to effectively analyze how the myocardial tissues were affected by disease for definitive diagnostics in forensic medicine (31). Machine learning algorithms were used to extract particular features for human ex vivo colon specimen classification between healthy and tumor zones (32). As for the nervous system, PIT combined with optical correlation tomography (OCT) has been reported to distinguish brain white matter and glioma tissues (33), which confirmed the feasibility of PIT being clinically applied to detect glioma.
In this paper, it is proposed that different polarization features are obtained to distinguish between GBM and non-GBM brain tissue using PIT combined with frequency distribution histogram (FDH) distribution and high-order statistical moments analysis. Specifically, we introduced the experimental setup based on backward scattered 3×3 Mueller matrix measurement without the circular polarizations; it significantly simplifies the experimental geometry, which is particularly appropriate for clinical PIT measurement (34, 35). It also allows the measurement of the clinical GBM tissue bulks. Then, applying it on the detection of GBM and non-GBM brain tissue, the PIT parameters (1−Δ) and t were calculated using the Mueller matrix polar decomposition (MMPD) and Mueller matrix transformation (MMT) techniques (36, 37), which confirmed that parameters (1−Δ) and t can be good indicators for distinguishing GBM from non-GBM tissues. Furthermore, we conducted FDH distributions and central moment coefficients (CMCs) (38) to examine in detail the dominant differences of normal and glioma tissues from a statistical perspective.
The determination of the different polarization characteristics of GBM and non-GBM brain tissue lays the foundation for the subsequent intraoperative PIT detection, and it is expected to make up for the shortcomings in clinical applications of the other imaging methods mentioned above.
2 Materials and Methods
2.1 Polarization Imaging Experimental Setup
The 3×3 Mueller matrix polarization experimental system used in this study is an upgraded version of the one described earlier (39), which consisted of a light source, a PSG, an objective table, a PSA, and a CCD camera, shown in Figure 1. It is in backscattering mode to detect the GBM and non-GBM tissue bulk. Briefly, a collimated light source (630 nm, BT-TCL24, BTOS Telecentric Optical, China) is used to create a circular illumination area of 60 mm in diameter to illuminate the GBM and non-GBM tissue; the polarization states of the incident beam from the light source are modulated by a Polarization State Generator (PSG), and the back scattered beam with the polarization information of the GBM and non-GBM sample is analyzed with a Polarization State Analyzer (PSA). Two DC servo motors (MR-J3-40A, Mitsubishi Electric, China) rotated the polarizers covered on the driven gears to generate different PSG and PSA states, and a monochrome industry camera (MER-503-36U3M/C, Daheng Imaging, China) captures the polarization images. Through careful calibration, the maximum errors for the absolute values of Mueller matrix elements were reduced to 0.04, and the characteristic polarization information of GBM and non-GBM tissues was obtained.

Figure 1 The schematic diagram of the experimental setup.
2.2 Polarization Theory
Mueller matrix can provide samples’ abundant comprehensive microstructural information and optical polarization properties. Specifically, the Mueller matrix of the detected sample is unique, which is experimentally measured and calculated by analyzing the polarization state of the outgoing light of the sample with
where Sin represents the stokes vector of the incident light, Sout represents the stokes vector of outgoing light, and Msample represents the Mueller matrix of the detected sample. In this paper, a 3×3 Mueller matrix, composed of the first three rows and the first three columns (40), and the backscattering configuration are used, which is particularly appropriate for in vivo polarimetry in clinics (34, 35).
2.2.1 MMPD and MMT Methods
To solve the problem that the relationship between microstructures of the sample and the specific Mueller matrix elements is unclear, there have been several methods (36, 37, 41–46) proposed to transform the Mueller matrix into polarization parameters with clear physical meanings when it comes to the clinical applications, and several polarization parameters are proposed to characterize different features of the cancerous region. In this paper, we analyzed the PIT images of GBM and non-GBM samples and provided quantitative lines of evidence to distinguish them based on MMPD and MMT parameters: the MMPD method (37) has been widely applied to biomedical studies, and this method decomposes the Mueller matrix (M) into three main interactions between the polarized light and the sample: diattenuation (D), retardance (δ), and depolarization (Δ):
where MD represents a diattenuator, MR represents a retarder, and MΔ represents a depolarizer. Since the 3×3 Mueller matrix calculation was adopted in this study, parameter Δ should be derived as follows according to Swami (37, 40):
Hence, the retardance (δ) and depolarization (Δ) are obtained. In particular, the parameter Δ demonstrates the depolarization maintaining power, while (1−Δ) demonstrates the depolarization power (40). Furthermore, parameter t from the MMT method is calculated below, which is related to the magnitude of anisotropy for the samples (36).
2.2.2 FDH Distributions and CMCs
Using high-order statistical moments to analyze the PIT information is significant and effective when it comes to the auxiliary diagnosis for different tissues (47–49) and biological fluids (50). However, in order to extract the dominant microstructural features of the GBM and non-GBM tissues from two-dimensional images of the 3×3 Mueller matrix with rich information, we transfer the Mueller matrix images to FDHs and then calculate the CMCs of FDHs (38). The percentages of different intensity levels are given in the form of histogram of Mueller matrix elements. That is, the frequency and distribution of the same intensity level in the image. To evaluate the FDH distributions from the perspective of mathematical statistics, the CMCs, i.e., expected value (P1), variance (P2), skewness (P3), and kurtosis (P4), are calculated for a random variable X, and provide more detailed quantitative information about the sample:
where P1 is the mean value of FDH, P2 is the standard deviation, P3 represents the degree of asymmetry in FDH distribution, and P4 represents the sharpness of the peak. Among them, P1 is sensitive to the anisotropy features of the sample, P2 is related to the complexity of the microstructures, P3 represents the heterogeneity, while P4 represents the concentration of data. Besides, the CMCs (except P1) are insensitive to sample orientation directions (38). By observing the value of the CMCs, the characteristics of the FDH distribution curve are roughly obtained.
2.3 Human Brain Glioma Samples
In order to testify the potential application of PIT on human brain glioma samples, especially when it was used to identify brain glioma from non-glioma brain tissue during surgical operation, the methods mentioned above were used on the human brain glioma samples: 20 formalin-soaked unstained GBM samples with brain white matter region (theoretically contains no glioma cells) used in this study were provided by Department of Neurosurgery of General Hospital of Tianjin Medical University, and the samples shown in Figure 2 were grayscale image of the formalin-soaked unstained thick bulk of the GBM samples with non-GBM brain tissue cut from the patient’s cranial cavity during the surgery, with two regions marked and boundary delineated. The GBM sample is cut purely from the center of the tumor. It ensures that the polarization characterization of the GBM is reasonable, which is the first step and foundation of the further research about the identification of GBM residual during operation. However, with the imaging conditions strictly controlled, various intraoperative interference factors (such as blood) can be eliminated in in vitro glioma PIT experiments. For pathological comparisons, the corresponding hematoxylin-eosin (HE)-stained 6-μm-thick slices of GBM and non-GBM were also prepared and are shown in Figure 3 to evaluate the PIT images and reveal the relationship between the pathological features and PIT images of the samples, showing that the GBM region was with a darker stained color (which means high cellular density, and denser and larger cell nuclei) than the non-GBM region. The use of the clinical glioma samples in this study was approved by the Administrative Committee on Animal Research of the Shenzhen International Graduate School, Tsinghua University. All experiments and methods were performed in accordance with the relevant guidelines and regulations.
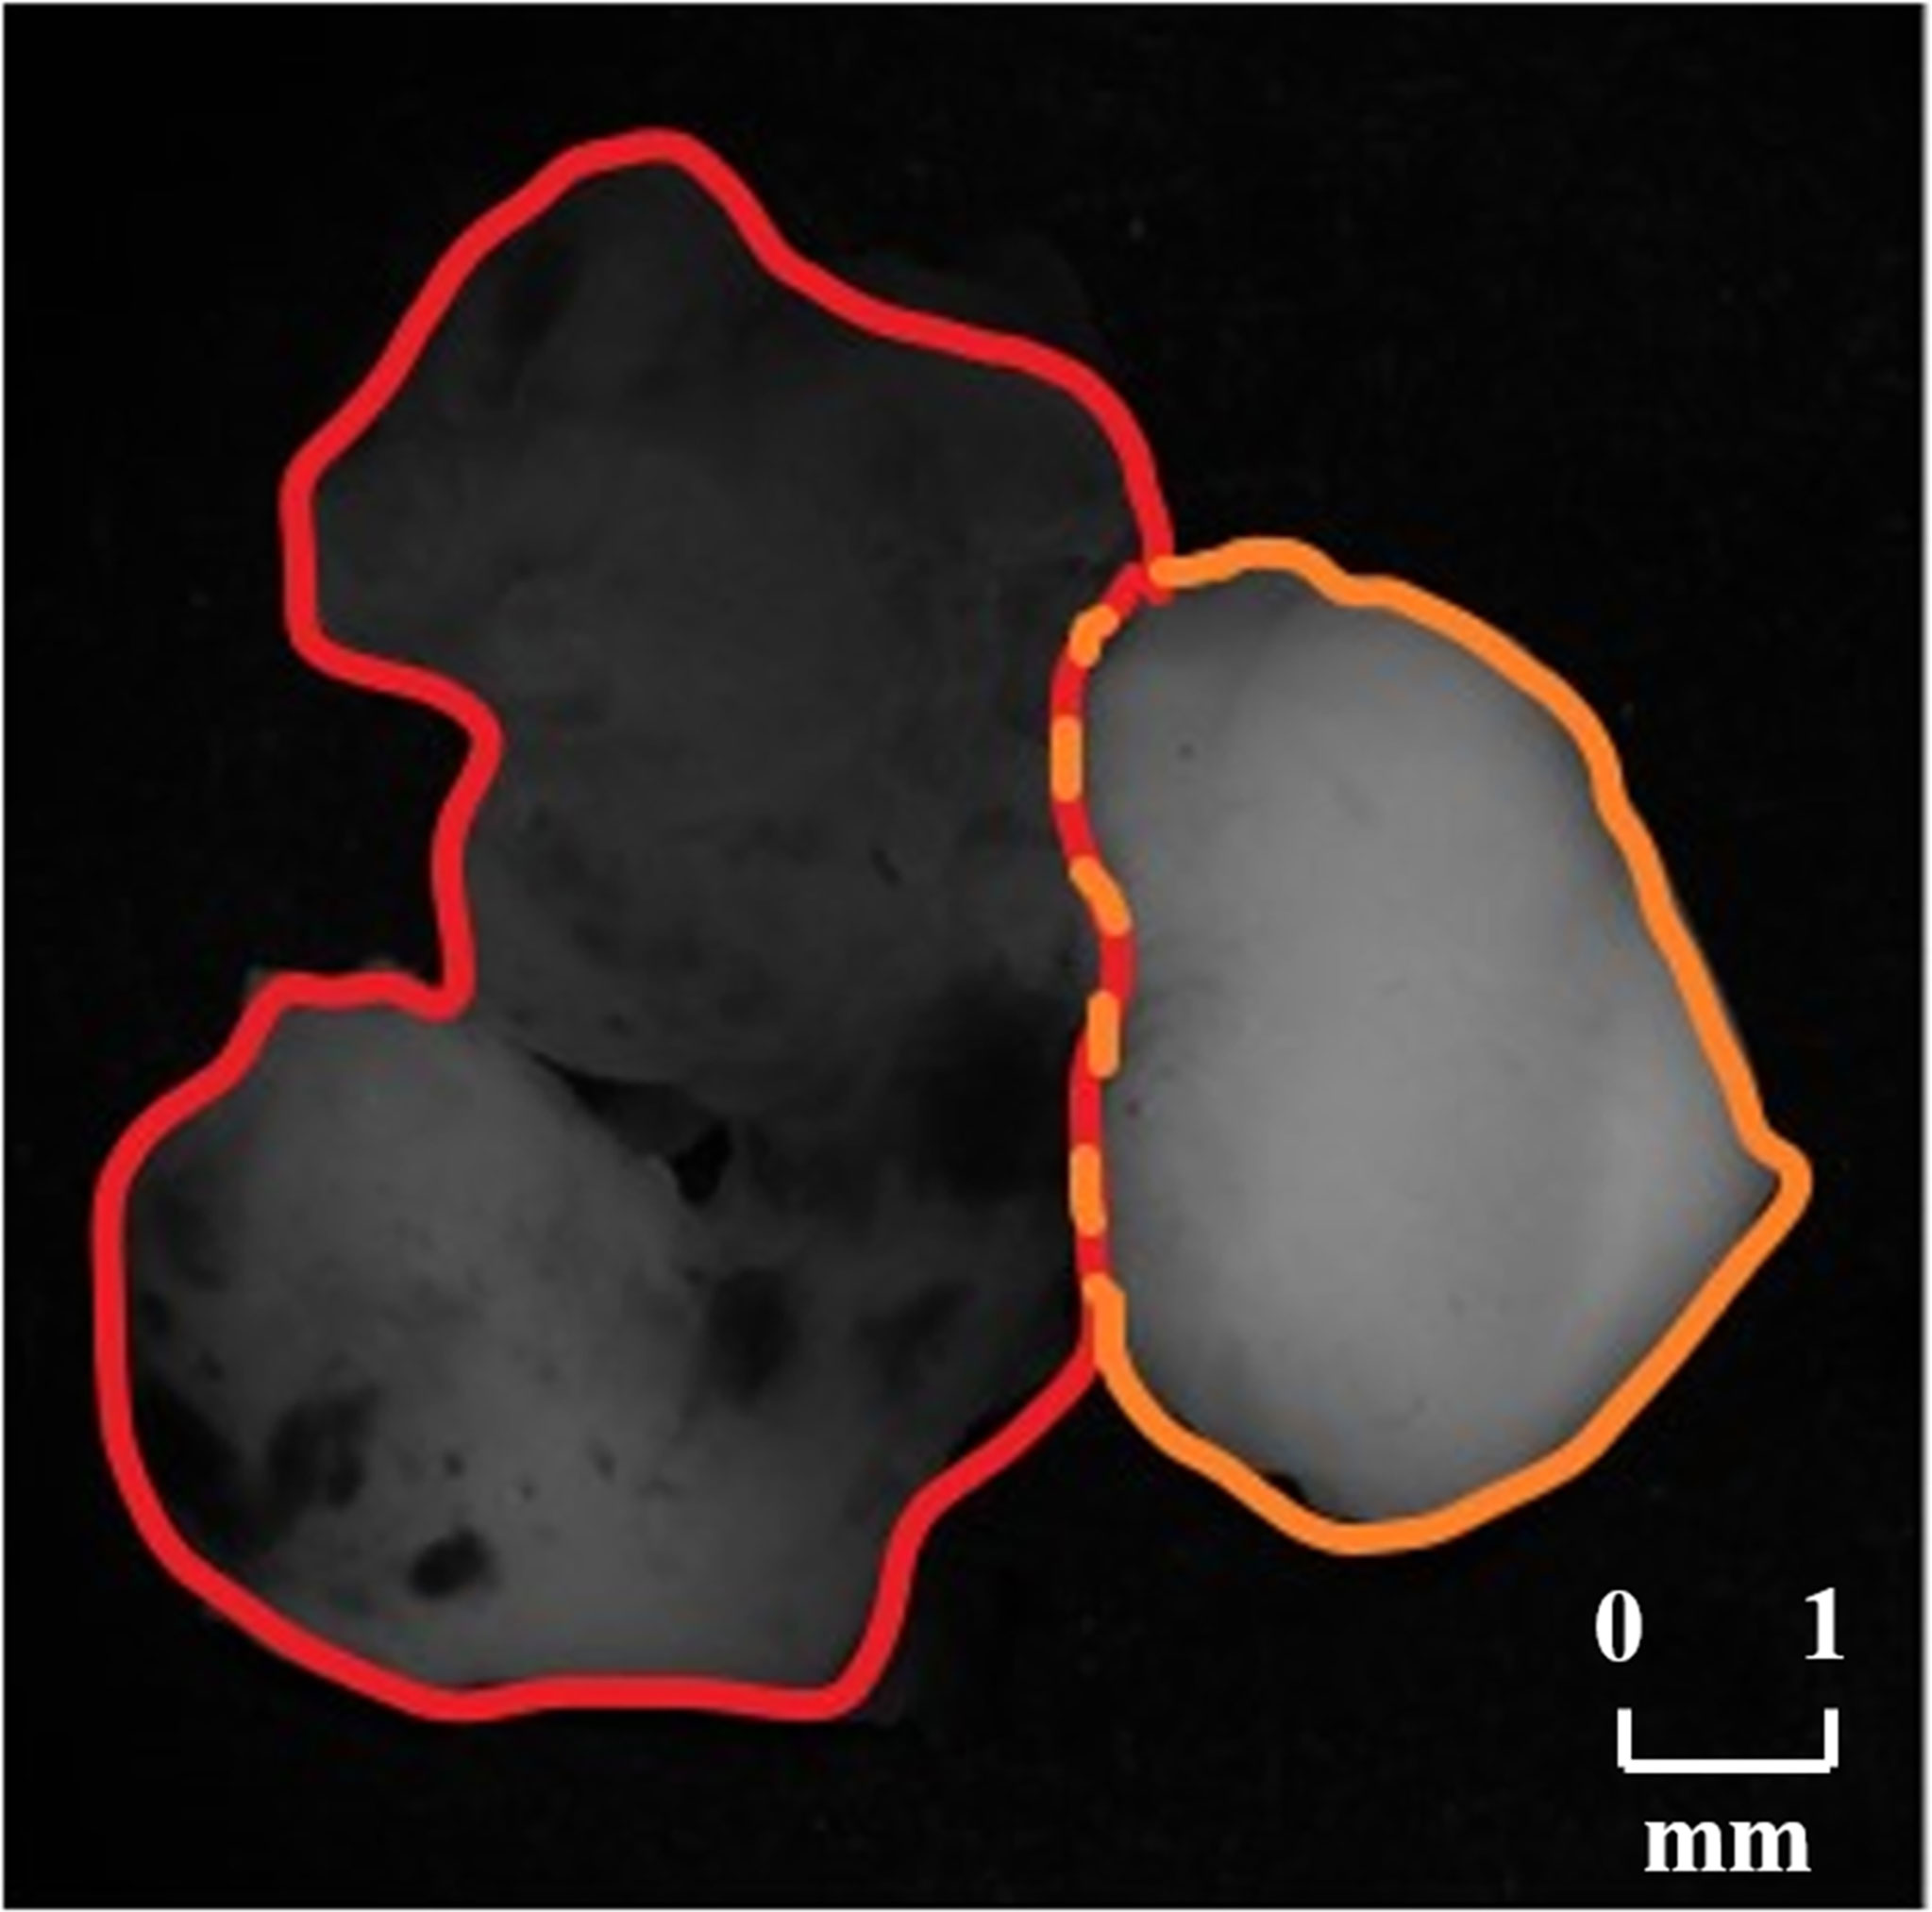
Figure 2 Grayscale images of the GBM sample with non-GBM brain tissue, where the GBM region is marked with red boundary delineated and the non-GBM region is marked with orange boundary delineated.
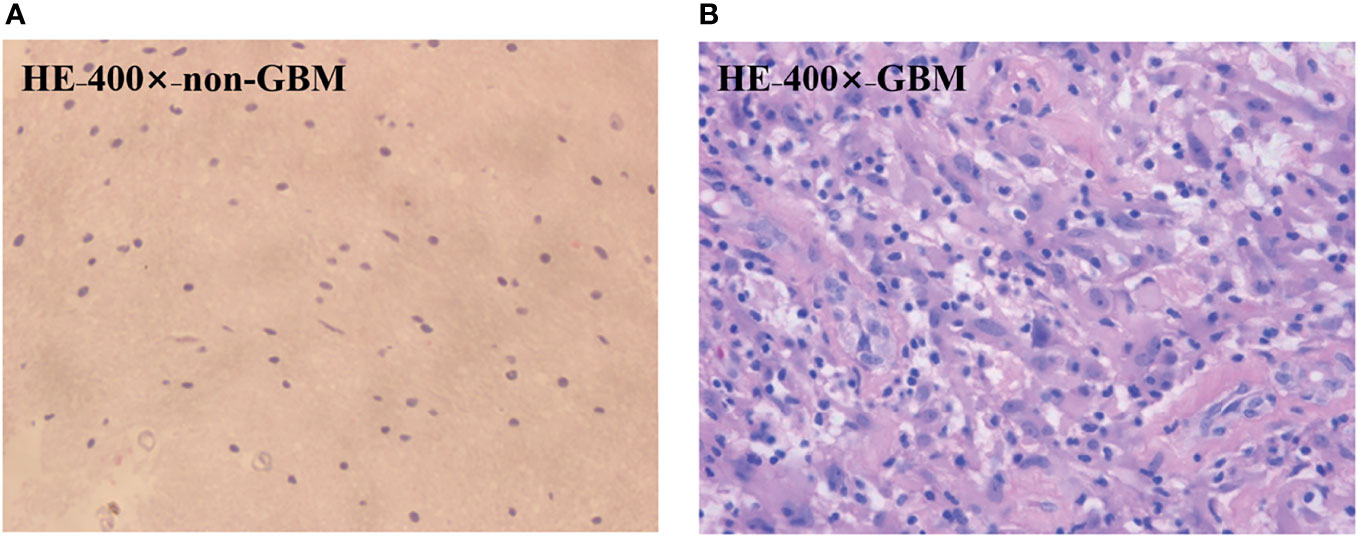
Figure 3 HE-stained 6-μm-thick slice of the GBM (A) region and the non-GBM (B) region from the same region of PIT images.
3 Results
3.1 Characteristic Features in Backscattering Mueller Matrix Elements
Examining the characteristic behaviors of the backscattering 3×3 Mueller matrix elements of GBM samples with non-GBM brain tissue reveal rich information on the optical differences and microstructural properties, and these differences distinguish GBM from non-GBM tissues well.
The structure gets disorganized in the GBM region, so its morphological and optical polarization features changed with respect to that in non-GBM brain tissue, which are directly reflected on the images and values of Mueller matrix elements. The experimental results of the backscattering 3×3 Mueller matrix of GBM tissue and non-GBM brain tissue are shown in Figure 4 and Table 1. In Figure 4, the contrast between the sample and the background is clearly enhanced in the elements of Mueller matrix m22 and m33 with respect to the intensity image m11 (at the top left corner), and the borders and detailed information in GBM and non-GBM brain regions are easily distinguished, showing the potential of the PIT for glioma detection. In Table 1, the average values of the Mueller matrix elements for both GBM and non-GBM tissue are listed in Table 1, and the characterization of PIT differences between them are clearly observed, e.g., the values of m22 for GBM and non-GBM regions are 0.32 and 0.09, while the values of m33 are −0.33 and −0.09. It should be mentioned that all the elements are normalized by m11. Besides, it can be observed that these Mueller matrices were essentially diagonal, and the magnitudes of the diagonal elements are equal:
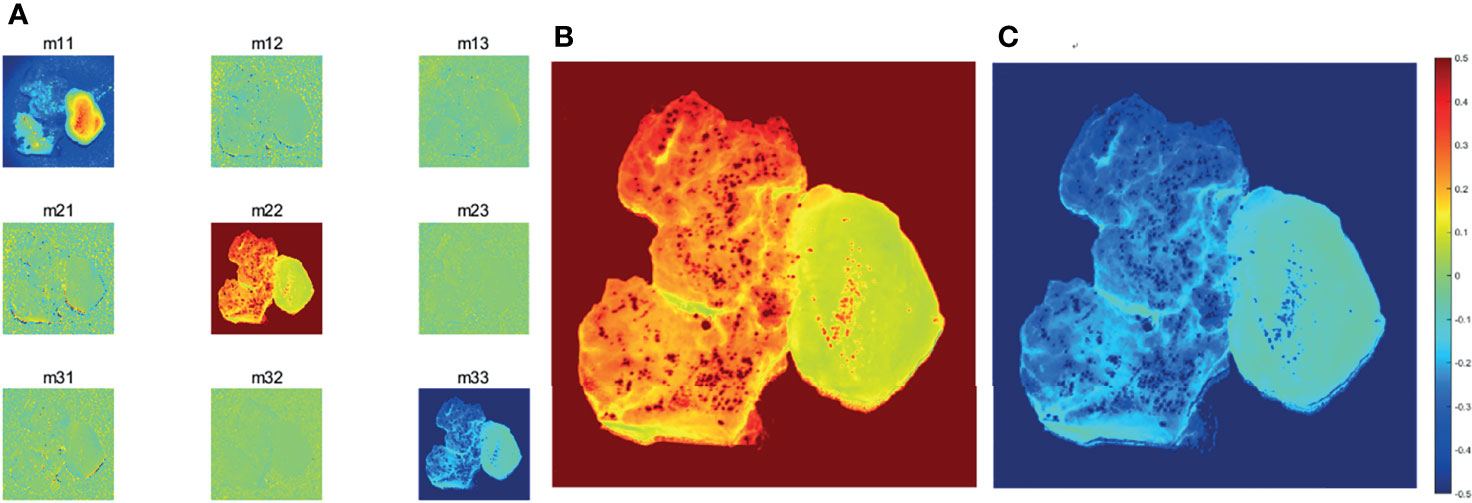
Figure 4 (A) Images of 3×3 Mueller matrix elements of detected GBM samples with non-GBM brain tissue. All the Mueller matrix elements of the sample are (except m11) divided by m11. (B)m22 image of GBM samples with non-GBM brain tissue.(C)m33 image of GBM samples with non-GBM brain tissue. The scale of the normalized elements is given by the color bar.
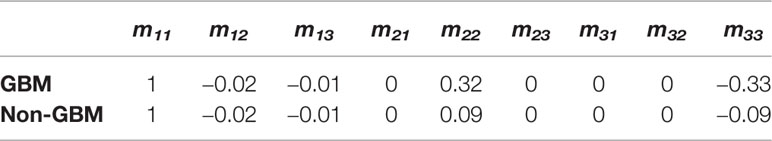
Table 1 Average values of 3×3 Mueller matrix elements of detected GBM samples with non-GBM brain tissues.
Furthermore, since the magnitudes of diagonal elements are closely related to the depolarization capabilities of the samples, the non-GBM tissue has smaller diagonal m22 and m33 elements in Table 1, showing a stronger depolarization power than the GBM tissue, which are indicators to distinguish between GBM and non-GBM tissue from the perspective of Mueller matrix characterization. Combined with the corresponding pathological results shown in Figure 3, it is reasonable to consider that the difference in depolarization power between GBM and non-GBM tissue is related to the changes in cell density and glial fibers compared with non-GBM tissue (15).
3.2 Characteristic Features of PIT Parameters
Transforming the Mueller matrix into PIT parameters to separate the different effects is crucial, so MMPD and MMT parameters were calculated to characterize the PIT features of GBM and non-GBM samples. The images of parameter (1−Δ) from the MMPD method and parameter t from the MMT method of GBM and non-GBM tissue are calculated and presented as follows:
From Figure 5, GBM and non-GBM tissue are easy to identify. Then, the average values of parameters (1−Δ) and t of both GBM and non-GBM regions are calculated, which, in specific regions, remain almost the same in repeat measurements with 20 samples, and they are good indicators to distinguish a GBM region from a non-GBM region.
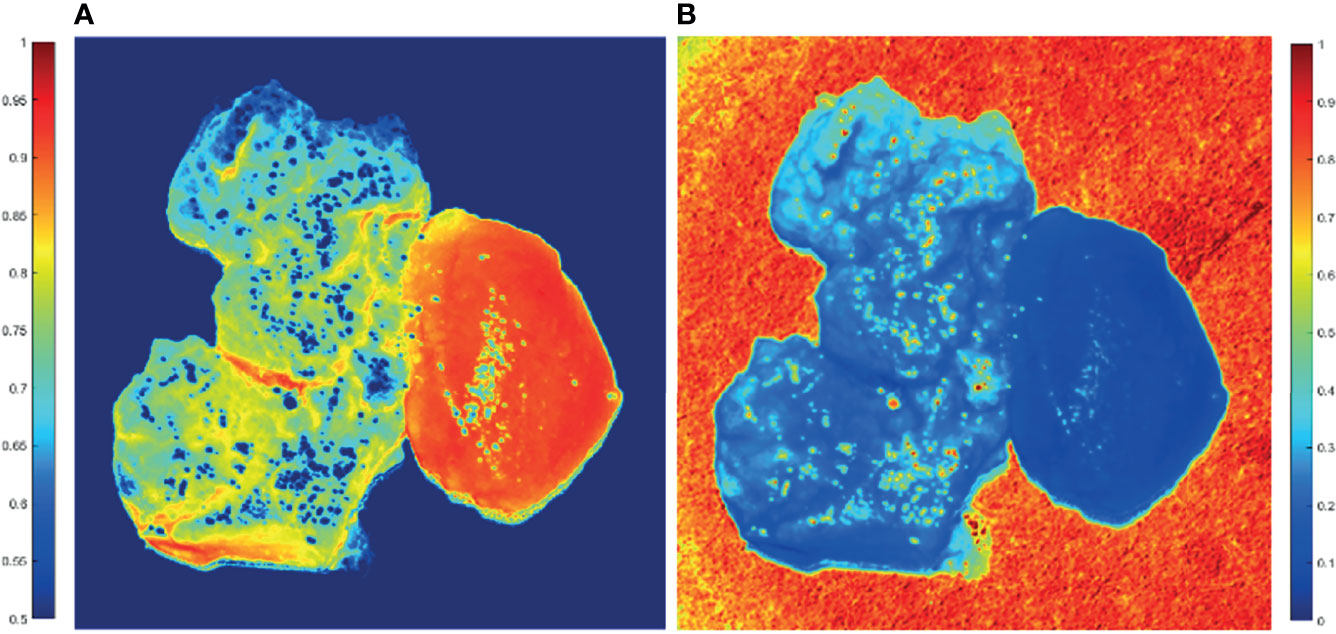
Figure 5 2D PIT images of PIT parameters of GBM samples with non-GBM brain tissue. The scale of the normalized elements is given by the color bar. (A) Parameter (1−Δ). (B) Parameter t.
The average (1−Δ) value of GBM region is 0.65, while the average (1−Δ) value of non-GBM region is 0.91; that is, the GBM tissue (left on the image) has smaller values of (1−Δ) than the non-GBM tissue. Combined with the results of the HE-stained slice of GBM and non-GBM shown in Figure 3, it could be that the glioma cells had a higher metabolism level, and GBM tissue contained larger density of cells and metabolism-related organelles (small scatterers, such as lysosomes and mitochondria) compared to non-GBM brain tissue caused by the uncontrolled cellular growth, resulting in a weaker depolarization power than the non-GBM tissue [smaller value of (1−Δ)]. This interpretation is further supported by the results of FDH distributions and analysis of CMCs.
Meanwhile, the average t value of the GBM region is 0.33, while the average t value of the non-GBM region is 0.09; the GBM tissue has a larger value of parameter t compared with the value in the non-GBM tissue, caused by inflammatory reactions induced by carcinoma cells, which is supported by comparison with the corresponding HE-stained slices shown in Figure 3.
Based on these results, the differences between GBM and non-GBM tissue are identified by detecting the polarization characteristics and reflect on the PIT images and parameters. The experimental results in this section confirmed that both the PIT images and parameters (1−Δ) and t are good indicators to quantitatively analyze and distinguish GBM from non-GBM tissues.
Furthermore, the significance test method in the statistical t-test for m22, m33, and parameters (1−Δ) and t between glioma and non-glioma tissues was used to determine the stability of the PIT characterization for GBM and non-GBM regions. t-tests showed a statistically significant difference (p < 0.05 is significant) for all the tested parameters. The t-test results and the values of the corresponding m22, m33, and parameters (1−Δ) and t of 20 GBM and non-GBM samples are presented in bar charts (Figure 6), in which p is the p-value of GBM and non-GBM tissues of experimental data in different Mueller matrix elements and PIT parameters.
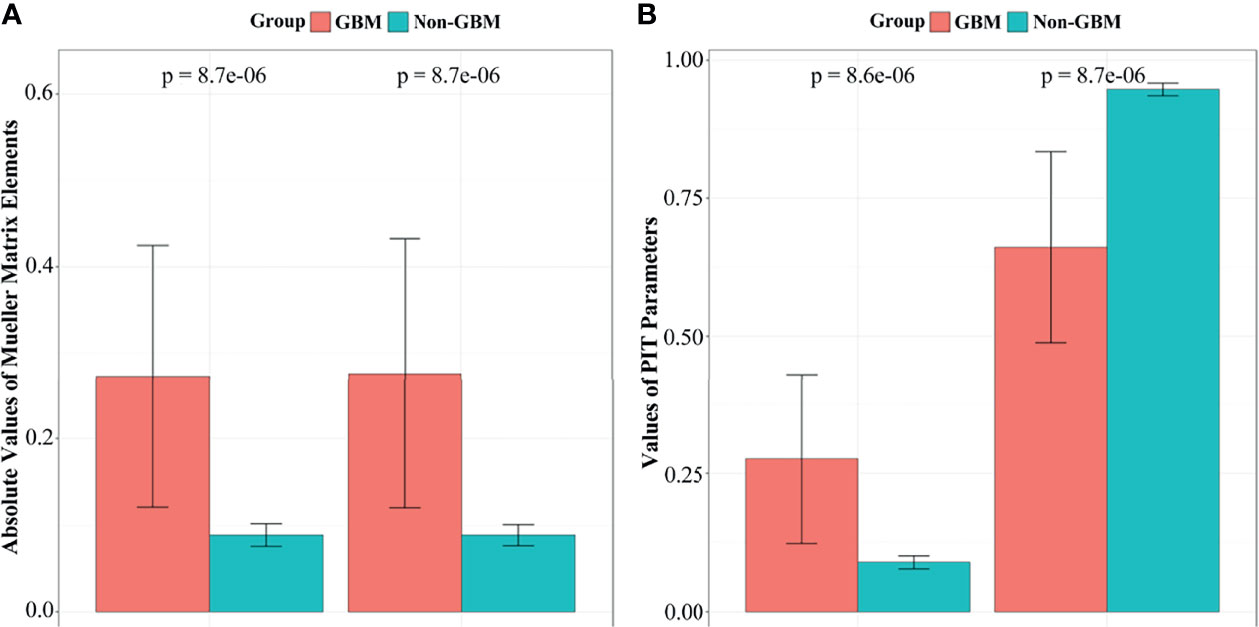
Figure 6 The t-test results and the values of corresponding m22, m33, parameters (1−Δ) and t of GBM and non-GBM samples: (A)m22 and m33 elements, (B) parameter (1−Δ) and t.
3.3 Features of FDH and CMCs Characterization
We calculated the FDHs (as shown in Figures 7, 8) and CMCs (P1, P2, P3, and P4, as shown in Table 3) of the Mueller matrix elements of the GBM and non-GBM region to extract dominant tissue microstructural features. The area under the curve of each FDH distribution is 1. The calculation of FDH and CMCs were performed on all detected samples, which had a good consistency.

Figure 7 FDH distributions of diagonal Mueller matrix elements of GBM (red lines) and non-GBM tissue (black lines).
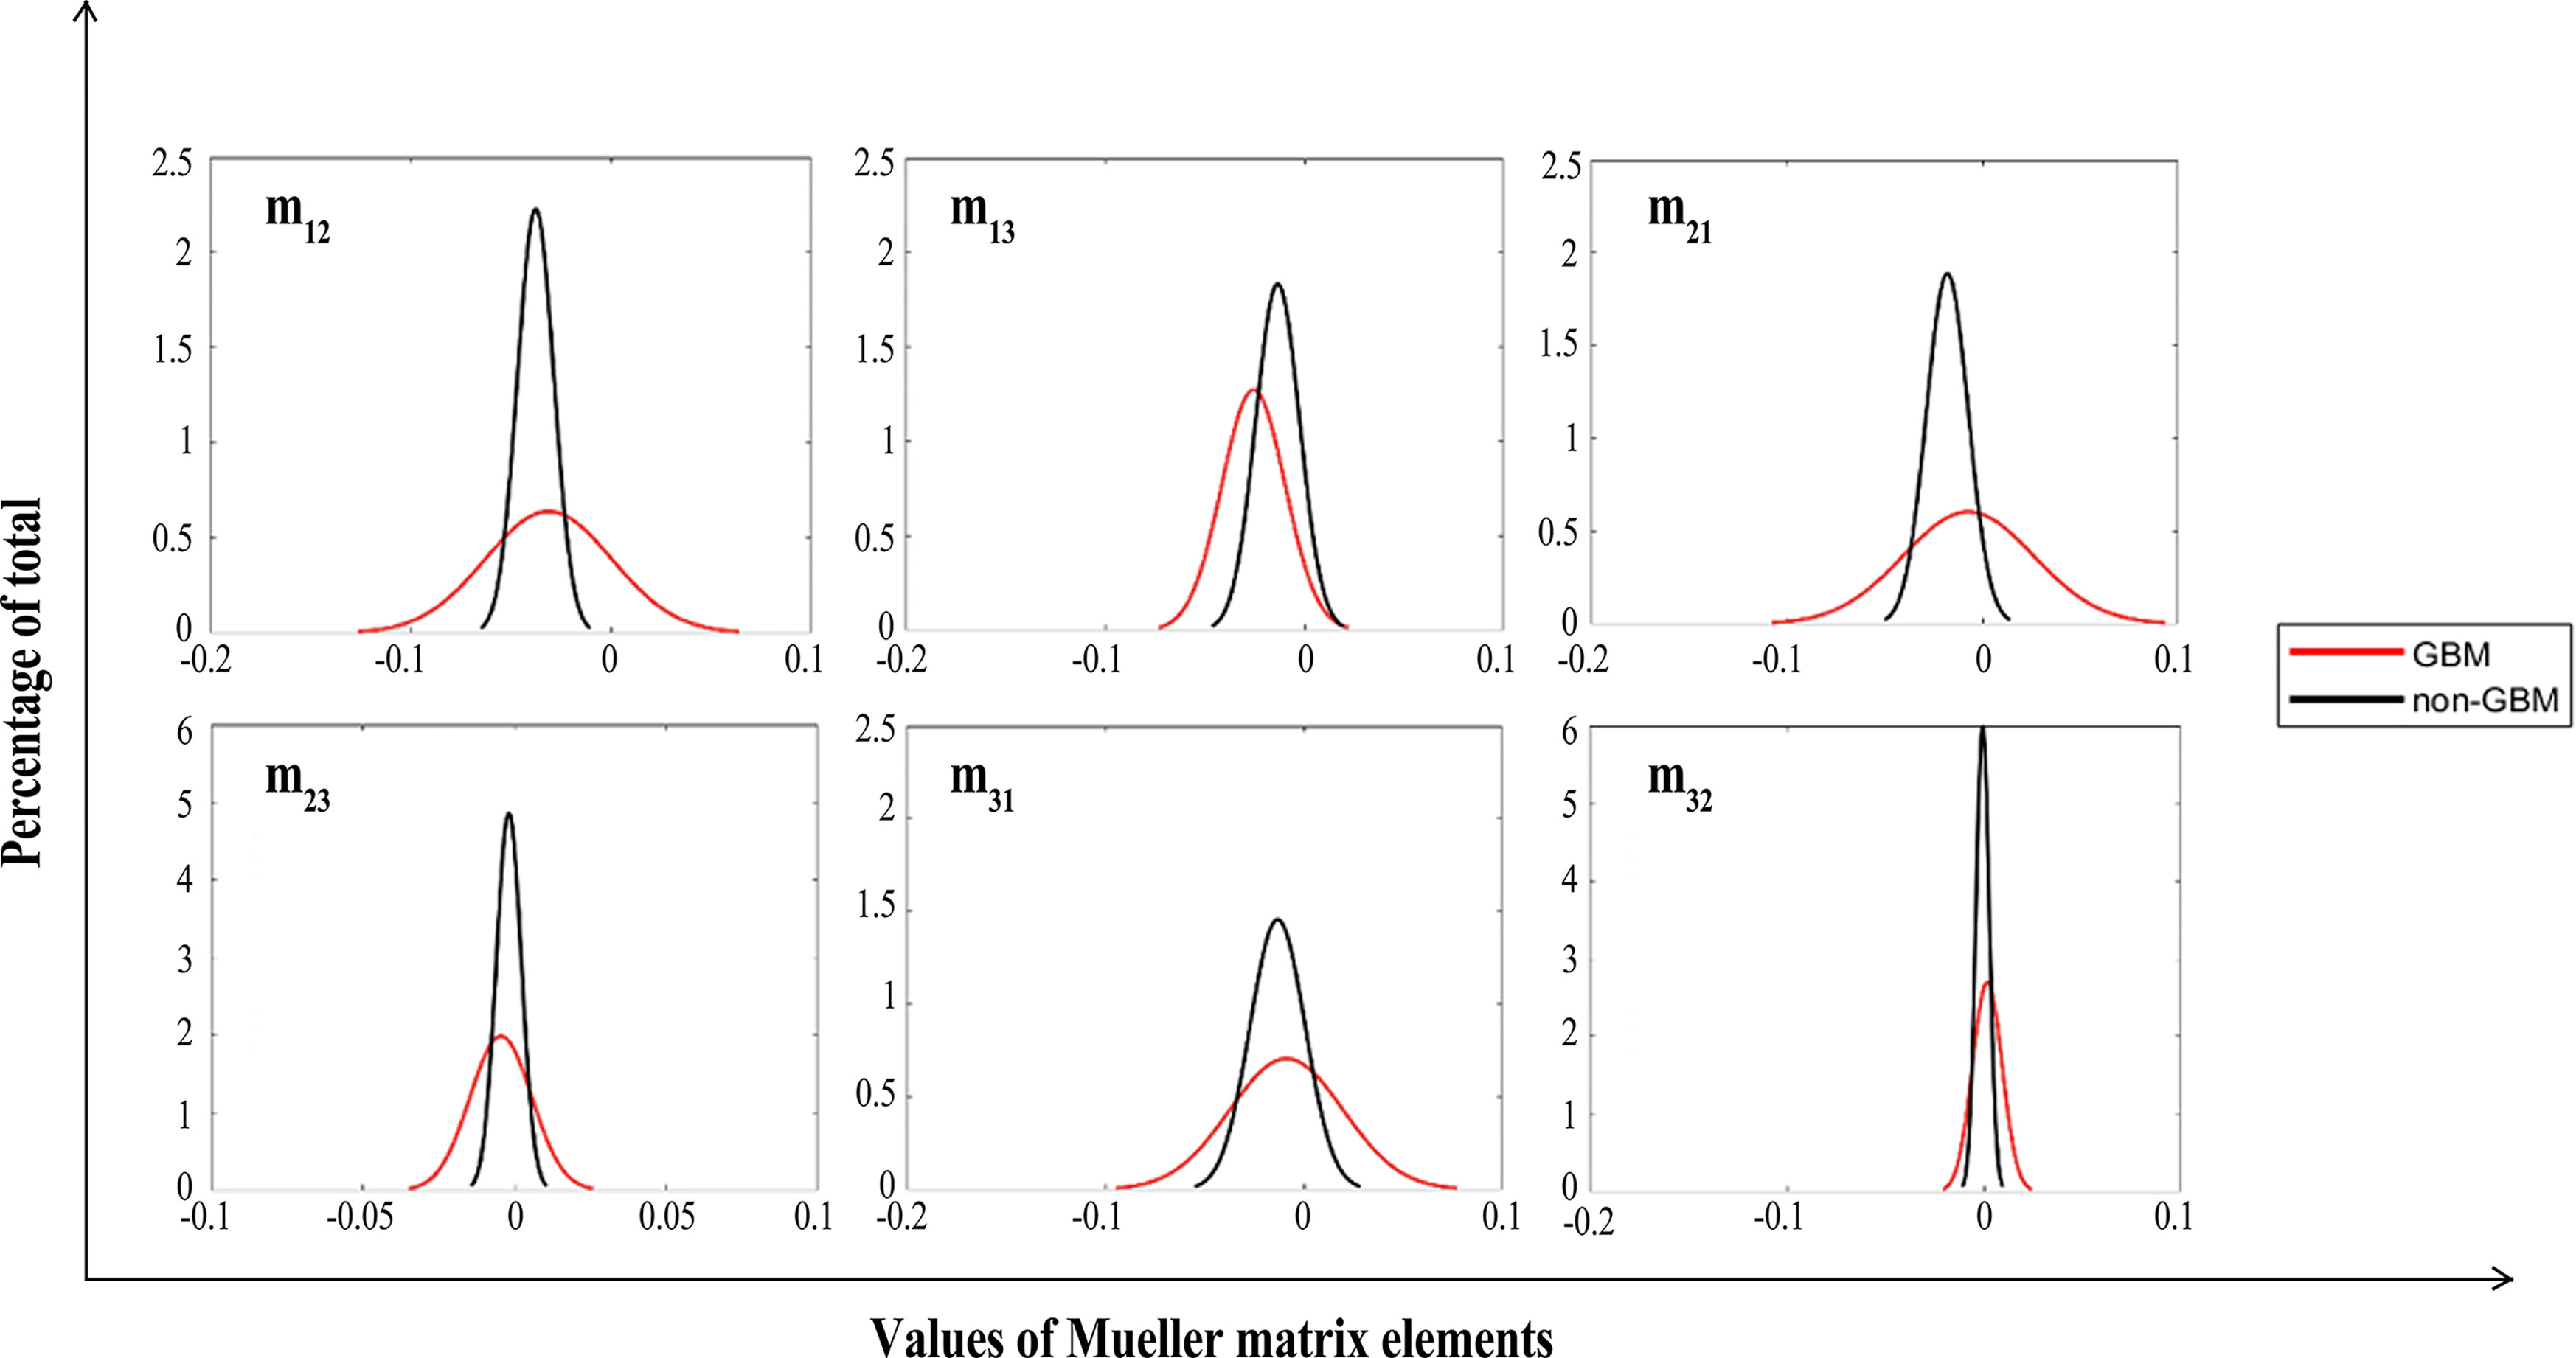
Figure 8 FDHs of off-diagonal Mueller matrix elements of GBM (red lines) and non-GBM tissue (black lines).
As in Figures 7, 8, we present the FDH results of one of those samples, and show that GBM and non-GBM tissues are easily differentiated from their FDH distributions. To be specific, for diagonal elements m22 and m33 of the Mueller matrix, the width of FDH distributions of non-GBM regions is smaller than those of the GBM regions, while the peak values of FDH distributions of non-GBM regions are much larger than those of the GBM regions. Furthermore, the average peak values (h) of FDH distributions of non-GBM regions (h-non-GBM) and GBM regions (h-GBM) are listed in Table 2, and the FDH distributions of non-GBM regions are much closer to the point of origin than the GBM regions’ FDH distributions.
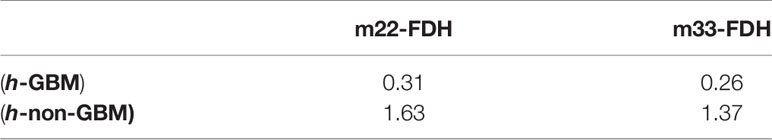
Table 2 The average peak values (h) of FDH distributions of GBM and non-GBM regions.
As for off-diagonal elements of the Mueller matrix, the characteristics of the FDH distributions are in great agreement with those for diagonal elements of both GBM and non-GBM regions. However, the FDH distributions of both GBM and non-GBM regions are closer to the point of origin. Theoretically, the occurrence and development of the GBM changed the scattering and absorption of the incident light, making the Mueller matrix of GBM tissue different from that of non-GBM tissue; therefore, the FDH distributions of GBM and non-GBM regions differed greatly, e.g., as for the FDH distribution of the m22 element, the values are mostly distributed approximately 0.1 in GBM regions, while it is mostly distributed approximately 0.2–0.3 in non-GBM regions, and the peak value of FDH distributions in the non-glioma region is much larger than that in the GBM region.
The CMCs of the Mueller matrix elements of different regions are listed in Table 3. Firstly, the value of P1 of m22 and m33 of GBM tissue is 3.09 and −2.79, while the value of P1 of m22 and m33 of non-GBM tissue is 2.46 and −2.34, respectively. The absolute values of P1 of diagonal elements in GBM regions are larger than those in non-GBM regions, which are in great agreement with the results presented in Table 1, which demonstrated the relation between the value of diagonal elements and the depolarizing power of the GBM and non-GBM samples. Secondly, the values of P2 shown in Table 3 are highly susceptible to the complexity of the microstructures in the GBM and non-GBM samples, and the values of P2 of the Mueller matrix elements in non-GBM regions are significantly larger than those in GBM regions, suggesting that the non-GBM tissue including neurons and neuroglia cells is more complicated and sophisticated than the GBM tissue, which mainly contains glioma cells. Furthermore, the values of P3 associated with the heterogeneity of the GBM and non-GBM samples. In the diagonal elements of the Mueller matrix, GBM regions have lower P3 values so that the microstructures in this tissue are basically consistent fiber arrangement compared with non-GBM regions. As for the P4 values shown in Table 3, it showed smaller variation in non-GBM tissue, indicating that most of the values are distributed to the mean value closely.
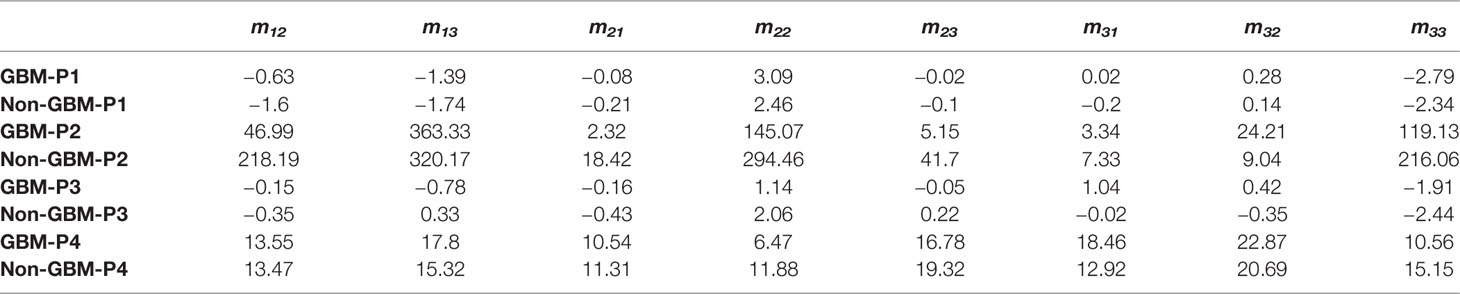
Table 3 CMCs of the Mueller matrix elements for GBM (red lines) and non-GBM regions.
In brief, the results confirmed that our interpretations are in accordance with the relation between the Mueller matrix elements and PIT characteristics presented in Section 3.1. The density of the cells and complexity of glial fiber in GBM and non-GBM tissue make them different in polarization properties, and reflect on the features of FDH distribution and CMC characterization, which are also indicators to distinguish between GBM from non-GBM tissue.
4 Discussion
In this paper, ex vivo PIT measurements combined with the FDH and CMC characterization of unstained formalin-soaked GBM and non-GBM tissue are performed with a 3×3 Mueller matrix polarization experimental system at a wavelength of 630 nm, and the preliminary results showed that the GBM tissue is distinguished from the non-GBM tissue. However, since this study is the first step towards realization of glioma intraoperative imaging and residual detection, it is difficult to apply in clinical applications, and the resolution of our experimental setup should be improved. There is ongoing work towards collecting fresh human glioma samples from surgery without soaking in formalin to simulate the in vivo and intraoperative environment, and the updated version of the PIT experimental setup is being built and intended to characterize the PIT features of the fresh glioma samples to promote the achievement of accurately identifying glioma residues intraoperatively.
5 Conclusions
In summary, we applied PIT to facilitate the quantitative detection of the GBM and non-GBM tissue. The 2D images of MMPD and MMT parameters (1−Δ) and t of unstained GBM and non-GBM tissues were calculated and analyzed. For more quantitative comparisons, FDH distribution and CMCs were also calculated to characterize the statistical differences in the 2D images of Mueller matrix elements of GBM and non-GBM tissue. The experimental results indicated that, although more detailed information was needed, PIT images and retrieved parameters may have potential to be indices that can distinguish glioma from non-glioma tissues. This paper demonstrated the potential of using the PIT method for glioma detection during surgery and showed a good diagnosis application prospect.
Data Availability Statement
The original contributions presented in the study are included in the article/supplementary material. Further inquiries can be directed to the corresponding author.
Ethics Statement
The studies involving human participants were reviewed and approved by the Administrative Committee on Animal Research of the Shenzhen International Graduate School, Tsinghua University. The patients/participants provided their written informed consent to participate in this study.
Author Contributions
Y-RL carried out the experiment, performed the data analysis, and was responsible for the writing of the manuscript. JW and H-HH supervised the work. All authors contributed to revising the manuscript and approved the final version.
Funding
This work was supported by the Overseas Research Cooperation project of Tsinghua Shenzhen International Graduate School (HW2018005), the National Key R&D Program of China (2019YFC0119500), and the Knowledge Innovation Program of Basic Research Projects of Shenzhen Grant (JCYJ20160428182053361 and JCY20200109142805928)
Conflict of Interest
The authors declare that the research was conducted in the absence of any commercial or financial relationships that could be construed as a potential conflict of interest.
Publisher’s Note
All claims expressed in this article are solely those of the authors and do not necessarily represent those of their affiliated organizations, or those of the publisher, the editors and the reviewers. Any product that may be evaluated in this article, or claim that may be made by its manufacturer, is not guaranteed or endorsed by the publisher.
Acknowledgments
The authors are thankful to Prof. Xuejun Yang from Beijing Tsinghua Changgung Hospital, Dr. Kai Zhang from First Teaching Hospital of Tianjin University of Traditional Chinese Medicine, and Xuya Wang from General Hospital of Tianjin Medical University for their kind help and for providing the glioma samples with histological preparation and pathological diagnosis used in this study.
References
1. Hervey-Jumper SL, Berger MS. Role of Surgical Resection in Low-and High-Grade Gliomas. Curr Treat Option Neurol (2014) 16(4):284. doi: 10.1007/s11940-014-0284-7
2. Morin F, Courtecuisse H, Reinertsen I, Le Lann F, Palombi O, Payan Y, et al. Brain-Shift Compensation Using Intraoperative Ultrasound and Constraint-Based Biomechanical Simulation. Med Mage Anal (2017) 40:133–53. doi: 10.1016/j.media.2017.06.003
3. Lu C-Y, Chen X-L, Chen X-L, Fang X-J, Zhao Y-LJM. Clinical Application of 3.0 T Intraoperative Magnetic Resonance Combined with Multimodal Neuronavigation in Resection of Cerebral Eloquent Area Glioma. Medicine (2018) 97:(34). doi: 10.1097/MD.0000000000011702
4. Xiao Y, Rivaz H, Chabanas M, Fortin M, Machado I, Ou Y, et al. Evaluation of Mri to Ultrasound Registration Methods for Brain Shift Correction: The Curious2018 Challenge. IEEE Trans Med Imaging (2019) 39(3):777–86. doi: 10.1109/TMI.2019.2935060
5. Tuchin VV. Polarized Light Interaction with Tissues. J Biomed Optic (2016) 21(7):071114. doi: 10.1117/1.JBO.21.7.071114
6. Alali S, Vitkin A. Polarized Light Imaging in Biomedicine: Emerging Mueller Matrix Methodologies for Bulk Tissue Assessment. J Biomed Optic (2015) 20(6):061104. doi: 10.1117/1.JBO.20.6.061104
7. Ghosh N, Vitkin IA. Tissue Polarimetry: Concepts, Challenges, Applications, and Outlook. J Biomed Optic (2011) 16(11):110801. doi: 10.1117/1.3652896
8. Tuchin VV, Wang LV, Zimnyakov DA. Tissue Structure and Optical Models. In: Optical Polarization in Biomedical Applications. Springer (2006). p. 7–28.
9. Ivanov D, Dremin V, Bykov A, Borisova E, Genova T, Popov A, et al. Colon Cancer Detection by Using Poincaré Sphere and 2d Polarimetric Mapping of Ex Vivo Colon Samples. J Biophoto (2020) 13(8):e202000082. doi: 10.1002/jbio.202000082
10. Pezzaniti JL, Chipman RA. Mueller Matrix Imaging Polarimetry. Optic Eng (1995) 34(6):1558–68. doi: 10.1117/12.206161
11. Jacques SL, Ramella-Roman JC eds. Propagation of Polarized Light Beams through Biological Tissues. In: Laser-Tissue Interaction XI: Photochemical, Photothermal, and Photomechanical. San Jose, CA, United States: International Society for Optics and Photonics.
12. Chung J-R, Baba JS, DeLaughter AH, Cote GL eds. Development and Use of a Novel Automated Mueller Matrix Polarization Imaging System for In-Vivo Imaging of Lesions. In: Optical Biopsy IV. San Jose, CA, United States: International Society for Optics and Photonics.
13. Pierangelo A, Nazac A, Benali A, Validire P, Cohen H, Novikova T, et al. Polarimetric Imaging of Uterine Cervix: A Case Study. Optic Exp (2013) 21(12):14120–30. doi: 10.1364/OE.21.014120
14. Antonelli M-R, Pierangelo A, Novikova T, Validire P, Benali A, Gayet B, et al. Mueller Matrix Imaging of Human Colon Tissue for Cancer Diagnostics: How Monte Carlo Modeling Can Help in the Interpretation of Experimental Data. Optic Exp (2010) 18(10):10200–8. doi: 10.1364/OE.18.010200
15. Qi J, Ye M, Singh M, Clancy NT, Elson DS. Narrow Band 3× 3 Mueller Polarimetric Endoscopy. Biomed Optic Exp (2013) 4(11):2433–49. doi: 10.1364/BOE.4.002433
16. Clancy NT, Arya S, Qi J, Stoyanov D, Hanna GB, Elson DS. Polarised Stereo Endoscope and Narrowband Detection for Minimal Access Surgery. Biomed Optic Exp (2014) 5(12):4108–17. doi: 10.1364/BOE.5.004108
17. Ushenko YA, Sidor M, Bodnar GJ. Mueller-Matrix Mapping of Optically Anisotropic Fluorophores of Biological Tissues in the Diagnosis of Cancer. Quant Electron (2014) 44(8):785. doi: 10.1070/QE2014v044n08ABEH015295
18. Hielscher AH, Eick AA, Mourant JR, Shen D, Freyer JP, Bigio I. Diffuse Backscattering Mueller Matrices of Highly Scattering Media. Optic Exp (1997) 1(13):441–53. doi: 10.1364/OE.1.000441
19. Smith MH, Burke PD, Lompado A, Tanner EA, Hillman LW eds. Mueller Matrix Imaging Polarimetry in Dermatology. In: Biomedical Diagnostic, Guidance, and Surgical-Assist Systems II. San Jose, CA, United States International Society for Optics and Photonics.
20. Ushenko VA, Hogan BT, Dubolazov A, Piavchenko G, Kuznetsov SL, Ushenko AG, et al. 3d Mueller Matrix Mapping of Layered Distributions of Depolarisation Degree for Analysis of Prostate Adenoma and Carcinoma Diffuse Tissues. Sci Rep (2021) 11(1):1–12. doi: 10.1038/s41598-021-83986-4
21. Ivanov D, Dremin V, Borisova E, Bykov A, Novikova T, Meglinski I, et al. Polarization and Depolarization Metrics as Optical Markers in Support to Histopathology of Ex Vivo Colon Tissue. Biomed Optic Exp (2021) 12(7):4560–72. doi: 10.1364/BOE.426713
22. Kasaragod DK, Lu Z, Jacobs J, Matcher SJ. Experimental Validation of an Extended Jones Matrix Calculus Model to Study the 3d Structural Orientation of the Collagen Fibers in Articular Cartilage Using Polarization-Sensitive Optical Coherence Tomography. Biomed Optic Exp (2012) 3(3):378–87. doi: 10.1364/BOE.3.000378
23. Ushenko VA, Hogan BT, Dubolazov A, Grechina AV, Boronikhina TV, Gorsky M, et al. Embossed Topographic Depolarisation Maps of Biological Tissues with Different Morphological Structures. Sci Rep (2021) 11(1):1–8. doi: 10.1038/s41598-021-83017-2
24. Pierangelo A, Manhas S, Benali A, Fallet C, Totobenazara J-L, Antonelli MR, et al. Multispectral Mueller Polarimetric Imaging Detecting Residual Cancer and Cancer Regression after Neoadjuvant Treatment for Colorectal Carcinomas. J Biomed Optic (2013) 18(4):046014. doi: 10.1117/1.JBO.18.4.046014
25. Pierangelo A, Benali A, Antonelli M-R, Novikova T, Validire P, Gayet B, et al. Ex-Vivo Characterization of Human Colon Cancer by Mueller Polarimetric Imaging. Optic Exp (2011) 19(2):1582–93. doi: 10.1364/OE.19.001582
26. He C, He H, Chang J, Dong Y, Liu S, Zeng N, et al. Characterizing Microstructures of Cancerous Tissues Using Multispectral Transformed Mueller Matrix Polarization Parameters. Biomed Optic Exp (2015) 6(8):2934–45. doi: 10.1364/BOE.6.002934
27. Jacques SL, Roman JR, Lee K. Surgery. Imaging Superficial Tissues with Polarized Light. Laser Surg Med (2000) 26(2):119–29. doi: 10.1002/(SICI)1096-9101(2000)26:2<119::AID-LSM3>3.0.CO;2-Y
28. Jacques SL, Ramella-Roman JC, Lee K. Imaging Skin Pathology with Polarized Light. J Biomed Optic (2002) 7(3):329–40. doi: 10.1117/1.1484498
29. Kunnen B, Macdonald C, Doronin A, Jacques S, Eccles M, Meglinski I. Application of Circularly Polarized Light for Non-Invasive Diagnosis of Cancerous Tissues and Turbid Tissue-Like Scattering Media. J Biophoto (2015) 8(4):317–23. doi: 10.1002/jbio.201400104
30. Gurjar RS, Backman V, Perelman LT, Georgakoudi I, Badizadegan K, Itzkan I, et al. Imaging Human Epithelial Properties with Polarized Light-Scattering Spectroscopy. Nat Med (2001) 7(11):1245–8. doi: 10.1038/nm1101-1245
31. Hogan BT, Ushenko VA, Syvokorovskaya A-V, Dubolazov AV, Vanchulyak OY, Ushenko AG, et al. 3d Mueller Matrix Reconstruction of the Optical Anisotropy Parameters of Myocardial Histopathology Tissue Samples. Front Phys (2021) 563. doi: 10.3389/fphy.2021.737866
32. Ivanov D, Dremin V, Genova T, Bykov A, Novikova T, Ossikovski R, et al. Polarization-Based Histopathology Classification of Ex Vivo Colon Samples Supported by Machine Learning. Front Phys (2022) 9. doi: 10.3389/fphy.2021.814787
33. Li Y-Q, Chiu K-S, Liu X-R, Hsiao T-Y, Zhao G, Li S-J, et al. Polarization-Sensitive Optical Coherence Tomography for Brain Tumor Characterization. IEEE J Selec Topic Quant Electron (2019) 25(1):1–7. doi: 10.1109/JSTQE.2018.2885487
34. Khaliq A, Ashraf S, Gul B, Ahmad I. Comparative Study of 3 X 3 Mueller Matrix Transformation and Polar Decomposition. Optic Commun (2021) 485:126756. doi: 10.1016/j.optcom.2021.126756
35. Forward S, Gribble A, Alali S, Lindenmaier AA, Vitkin IA. Flexible Polarimetric Probe for 3× 3 Mueller Matrix Measurements of Biological Tissue. Sci Rep (2017) 7(1):1–12. doi: 10.1038/s41598-017-12099-8
36. He H, Zeng N, Du E, Guo Y, Li D, Liao R, et al. A Possible Quantitative Mueller Matrix Transformation Technique for Anisotropic Scattering Media/Eine Mögliche Quantitative Müller-Matrix-Transformations-Technik Für Anisotrope Streuende Medien. Photo Laser Med (2013) 2(2):129–37. doi: 10.1515/plm-2012-0052
37. Lu S-Y, Chipman RA. Interpretation of Mueller Matrices Based on Polar Decomposition. J Optic Soc America (1996) 13(5):1106–13. doi: 10.1364/JOSAA.13.001106
38. He C, He H, Li X, Chang J, Wang Y, Liu S, et al. Quantitatively Differentiating Microstructures of Tissues by Frequency Distributions of Mueller Matrix Images. J Biomed Optic (2015) 20(10):105009. doi: 10.1117/1.JBO.20.10.105009
39. Yirong L, Weizheng S, Honghui H, Ilui M, Jian W eds. (2020). Polarization Characterization and Evaluation of Healing Process of the Damaged-Skin Applied with Chitosan and Silicone Hydrogel Applicator, In: 2020 13th International Congress on Image and Signal Processing, BioMedical Engineering and Informatics (CISP-BMEI). Yantai, China: IEEE.
40. Swami M, Manhas S, Buddhiwant P, Ghosh N, Uppal A, Gupta P. Polar Decomposition of 3× 3 Mueller Matrix: A Tool for Quantitative Tissue Polarimetry. Optic Exp (2006) 14(20):9324–37. doi: 10.1364/OE.14.009324
41. Ossikovski R, Anastasiadou M, Ben Hatit S, Garcia-Caurel E, De Martino AJ. Depolarizing Mueller Matrices: How to Decompose Them? Phys Status Solidi-Rap Res Lett (2008) 205(4):720–7. doi: 10.1002/pssa.200777793
42. Ossikovski R. Analysis of Depolarizing Mueller Matrices through a Symmetric Decomposition. J Optic Soc America (2009) 26(5):1109–18. doi: 10.1364/JOSAA.26.001109
43. Ossikovski R. Differential Matrix Formalism for Depolarizing Anisotropic Media. Optic Lett (2011) 36(12):2330–2. doi: 10.1364/OL.36.002330
44. Ortega-Quijano N, Arce-Diego JL. Depolarizing Differential Mueller Matrices. Optic Lett (2011) 36(13):2429–31. doi: 10.1364/OL.36.002429
45. Azzam R. Propagation of Partially Polarized Light through Anisotropic Media with or without Depolarization: A Differential 4× 4 Matrix Calculus. J Optic Soc America (1978) 68(12):1756–67. doi: 10.1364/JOSA.68.001756
46. Qi J, Elson DS. Mueller Polarimetric Imaging for Surgical and Diagnostic Applications: A Review. J Biophoto (2017) 10(8):950–82. doi: 10.1002/jbio.201600152
47. Peyvasteh M, Tryfonyuk L, Ushenko V, Syvokorovskaya A-V, Dubolazov A, Vanchulyak O, et al. 3d Mueller-Matrix-Based Azimuthal Invariant Tomography of Polycrystalline Structure within Benign and Malignant Soft-Tissue Tumours. Laser Phys Lett (2020) 17(11):115606. doi: 10.1088/1612-202X/abbee0
48. Sdobnov AY, Dubolazov AV, Gritsuk M, Ushenko YA, Bykov AV, Meglinski IV, et al. Stokes-Correlometry Analysis of Biological Tissues with Polycrystalline Structure. IEEE J Selec Topic Quant Electron (2019) 25:1–12. doi: 10.1109/JSTQE.2018.2865443
49. Trifonyuk L, Sdobnov A, Baranowski W, Ushenko V, Olar O, Dubolazov A, et al. Differential Mueller Matrix Imaging of Partially Depolarizing Optically Anisotropic Biological Tissues. Laser Med Sci (2020) 35(4):877–91. doi: 10.1007/s10103-019-02878-2
Keywords: polarization imaging technique, 3×3 Mueller matrix, clinical human GBM tissue, polarization parameters, frequency distribution histogram
Citation: Liu Y-R, He H-H and Wu J (2022) Differentiation of Human GBM From Non-GBM Brain Tissue With Polarization Imaging Technique. Front. Oncol. 12:863682. doi: 10.3389/fonc.2022.863682
Received: 07 February 2022; Accepted: 22 March 2022;
Published: 28 April 2022.
Edited by:
Tatiana Novikova, École Polytechnique, FranceReviewed by:
Oriol Arteaga, University of Barcelona, SpainIgor Meglinski, Aston University, United Kingdom
Alexander Bykov, University of Oulu, Finland
Hee Ryung Lee, Korea Institute of Science and Technology (KIST), South Korea
Copyright © 2022 Liu, He and Wu. This is an open-access article distributed under the terms of the Creative Commons Attribution License (CC BY). The use, distribution or reproduction in other forums is permitted, provided the original author(s) and the copyright owner(s) are credited and that the original publication in this journal is cited, in accordance with accepted academic practice. No use, distribution or reproduction is permitted which does not comply with these terms.
*Correspondence: Jian Wu, d3VqQHN6LnRzaW5naHVhLmVkdS5jbg==