
94% of researchers rate our articles as excellent or good
Learn more about the work of our research integrity team to safeguard the quality of each article we publish.
Find out more
ORIGINAL RESEARCH article
Front. Oncol., 14 April 2022
Sec. Hematologic Malignancies
Volume 12 - 2022 | https://doi.org/10.3389/fonc.2022.862473
This article is part of the Research TopicThe Role of Imaging in Hematologic MalignanciesView all 6 articles
 Fei Liu1,2,3,4,5†Bingxin Gu1,2,3,4,5†
 Nan Li1,2,3,4,5Herong Pan1,2,3,4,5Wen Chen1,2,3,4,5Ying Qiao1,2,3,4,5
 Shaoli Song1,2,3,4,5
 Xiaosheng Liu1,2,3,4,5*
Objectives: Mantle cell lymphoma (MCL) represents a group of highly heterogeneous tumors, leading to a poor prognosis. Early prognosis prediction may guide the choice of therapeutic regimen. Thus, the purpose of this study was to investigate the potential application value of heterogeneity index (HI) in predicting the prognosis of MCL.
Methods: A total of 83 patients with histologically proven MCL who underwent baseline fluorine-18-fluorodeoxyglucose positron emission tomography/computed tomography (18F-FDG PET/CT) were retrospectively enrolled. The clinicopathologic index and PET/CT metabolic parameters containing maximum and mean standard uptake value (SUVmax and SUVmean), metabolic tumor volume (MTV), total lesion glycolysis (TLG), and HI were evaluated. Receiver operating characteristic (ROC) curve analyses were performed to determine the optimal cutoff values of the parameters for progression-free survival (PFS) and overall survival (OS). Univariate and multivariate Cox regression were used to assess relationships between risk factors and recurrence. Kaplan–Meier plots were applied for survival analyses.
Results: In univariate analyses, age [HR = 2.51, 95% CI = 1.20–5.24, p = 0.041 for body weight (BW)] and HI-BW (HR = 4.17, 95% CI = 1.00–17.38, p = 0.050) were significantly correlated with PFS. In multivariate analyses, age (HR = 2.61, 95% CI = 1.25–5.47, p = 0.011 for BW) and HI-BW (HR = 4.41, 95% CI = 1.06–18.41, p = 0.042) were independent predictors for PFS, but not for OS. B symptoms (HR = 5.00, 95% CI = 1.16–21.65, p = 0.031 for BW) were an independent prognostic factor for OS, but not for PFS. The other clinicopathologic index and PET/CT metabolic parameters were not related to outcome survival in MCL.
Conclusion: The age and HI derived from baseline PET/CT parameters were significantly correlated with PFS in MCL patients.
Mantle cell lymphoma (MCL) is a group of invasive small B-cell lymphoma derived from primary and secondary lymphoid follicle mantle lymphocytes, accounting for 3% to 10% of all non-Hodgkin lymphoma (NHL) (1). According to the 2016 WHO classification, MCL is divided into classical, inert leukemic non-nodal, and in situ mantle cell tumor subtypes (2, 3). As most patients with MCL are diagnosed at advanced stage (Ann Arbor III–IV), the prognosis is very poor (4). Thus, a comprehensive assessment before treatment may benefit patients with MCL (5).
MCL international prognostic index (MIPI) score is usually used in the prognosis evaluation of MCL, which classifies the patients into low-risk, medium-risk, and high-risk groups (6). In 2008, a combined biologic index (MIPI-b), integrating MIPI and the Ki-67 index, was established as a prognostic tool for treatment response, recurrence, and survival prediction of MCL (7). In 2016, Hoster et al. demonstrated that a modified combination of Ki-67 index and MIPI (MIPI-c) could further divide MCL patients into four groups with different prognosis (8). Other biologic markers (e.g., p53 and microRNAs) have also been combined with MIPI as the prognostic tools (9, 10). Although these biologic markers are promising, they could not adequately be consistent with the heterogeneity of clinical outcomes. Herein, it is urgent to find more comprehensive prognostic factors of MCL (8).
Fluorine-18-fluorodeoxyglucose positron emission tomography/computed tomography (18F-FDG PET/CT) is a recommended and useful tool to evaluate the prognosis and treatment response of MCL (4). Bailly et al. (11) demonstrated a significant correlation between maximum standard uptake value (SUVmax) with progression-free survival (PFS) and overall survival (OS) using a threshold value of 10.3, while no significant correlation was observed with a threshold value of 4.7. However, Bodet-Milin et al. (12) and Hosein et al. (13) reported no significant association between SUVmax with PFS or OS using a threshold value of 6.0. Furthermore, metabolic tumor volume (MTV) was considered significant with PFS and OS only for univariate analyses. Moreover, another study reported a significant difference in PFS and OS with MTV and total lesion glycolysis (TLG) (14).
The above results showed that the potential role of the parameters in MCL prognostication were controversial and no shared prognostic indexes to identify this subset of NHL are available currently. The reason may be related to the heterogeneity of MCL. At present, MCL is considered to be a group of tumors with strong heterogeneity in biology, morphology, immunophenotype, and clinical process (15–17). The heterogeneity index (HI) of SUV measured by PET/CT is a potential index that is associated with tumor heterogeneity (18–21). Gong et al. showed that HI measured at baseline 18F-FDG PET/CT was a potential predicator for first-line treatment outcome in triple-negative breast cancer patients (21). Lee et al. revealed that HI may be a useful prognostic marker in uterine leiomyosarcoma (19). However, there are few heterogeneity-related factors that have been investigated in MCL. In this study, we aim to investigate the relationship between survival outcome with clinicopathologic and PET/CT parameters, and to verify the potential application of HI derived from PET/CT in predicting the prognosis of MCL.
We retrospectively identified MCL patients with pathological results who had undergone baseline 18F-FDG PET/CT from Fudan University Shanghai Cancer Center (FUSCC) between January 2011 and December 2020. Patients were excluded if they had no baseline 18F-FDG PET/CT, had a previous cancer history, had undergone surgery before 18F-FDG PET/CT scan, or had incomplete clinical data or follow-up (Figure 1). All patients were treated according to the latest Chinese Lymphoma Guidelines Consensus. The study was approved by the Ethics Committee of FUSCC and informed consents were waived.
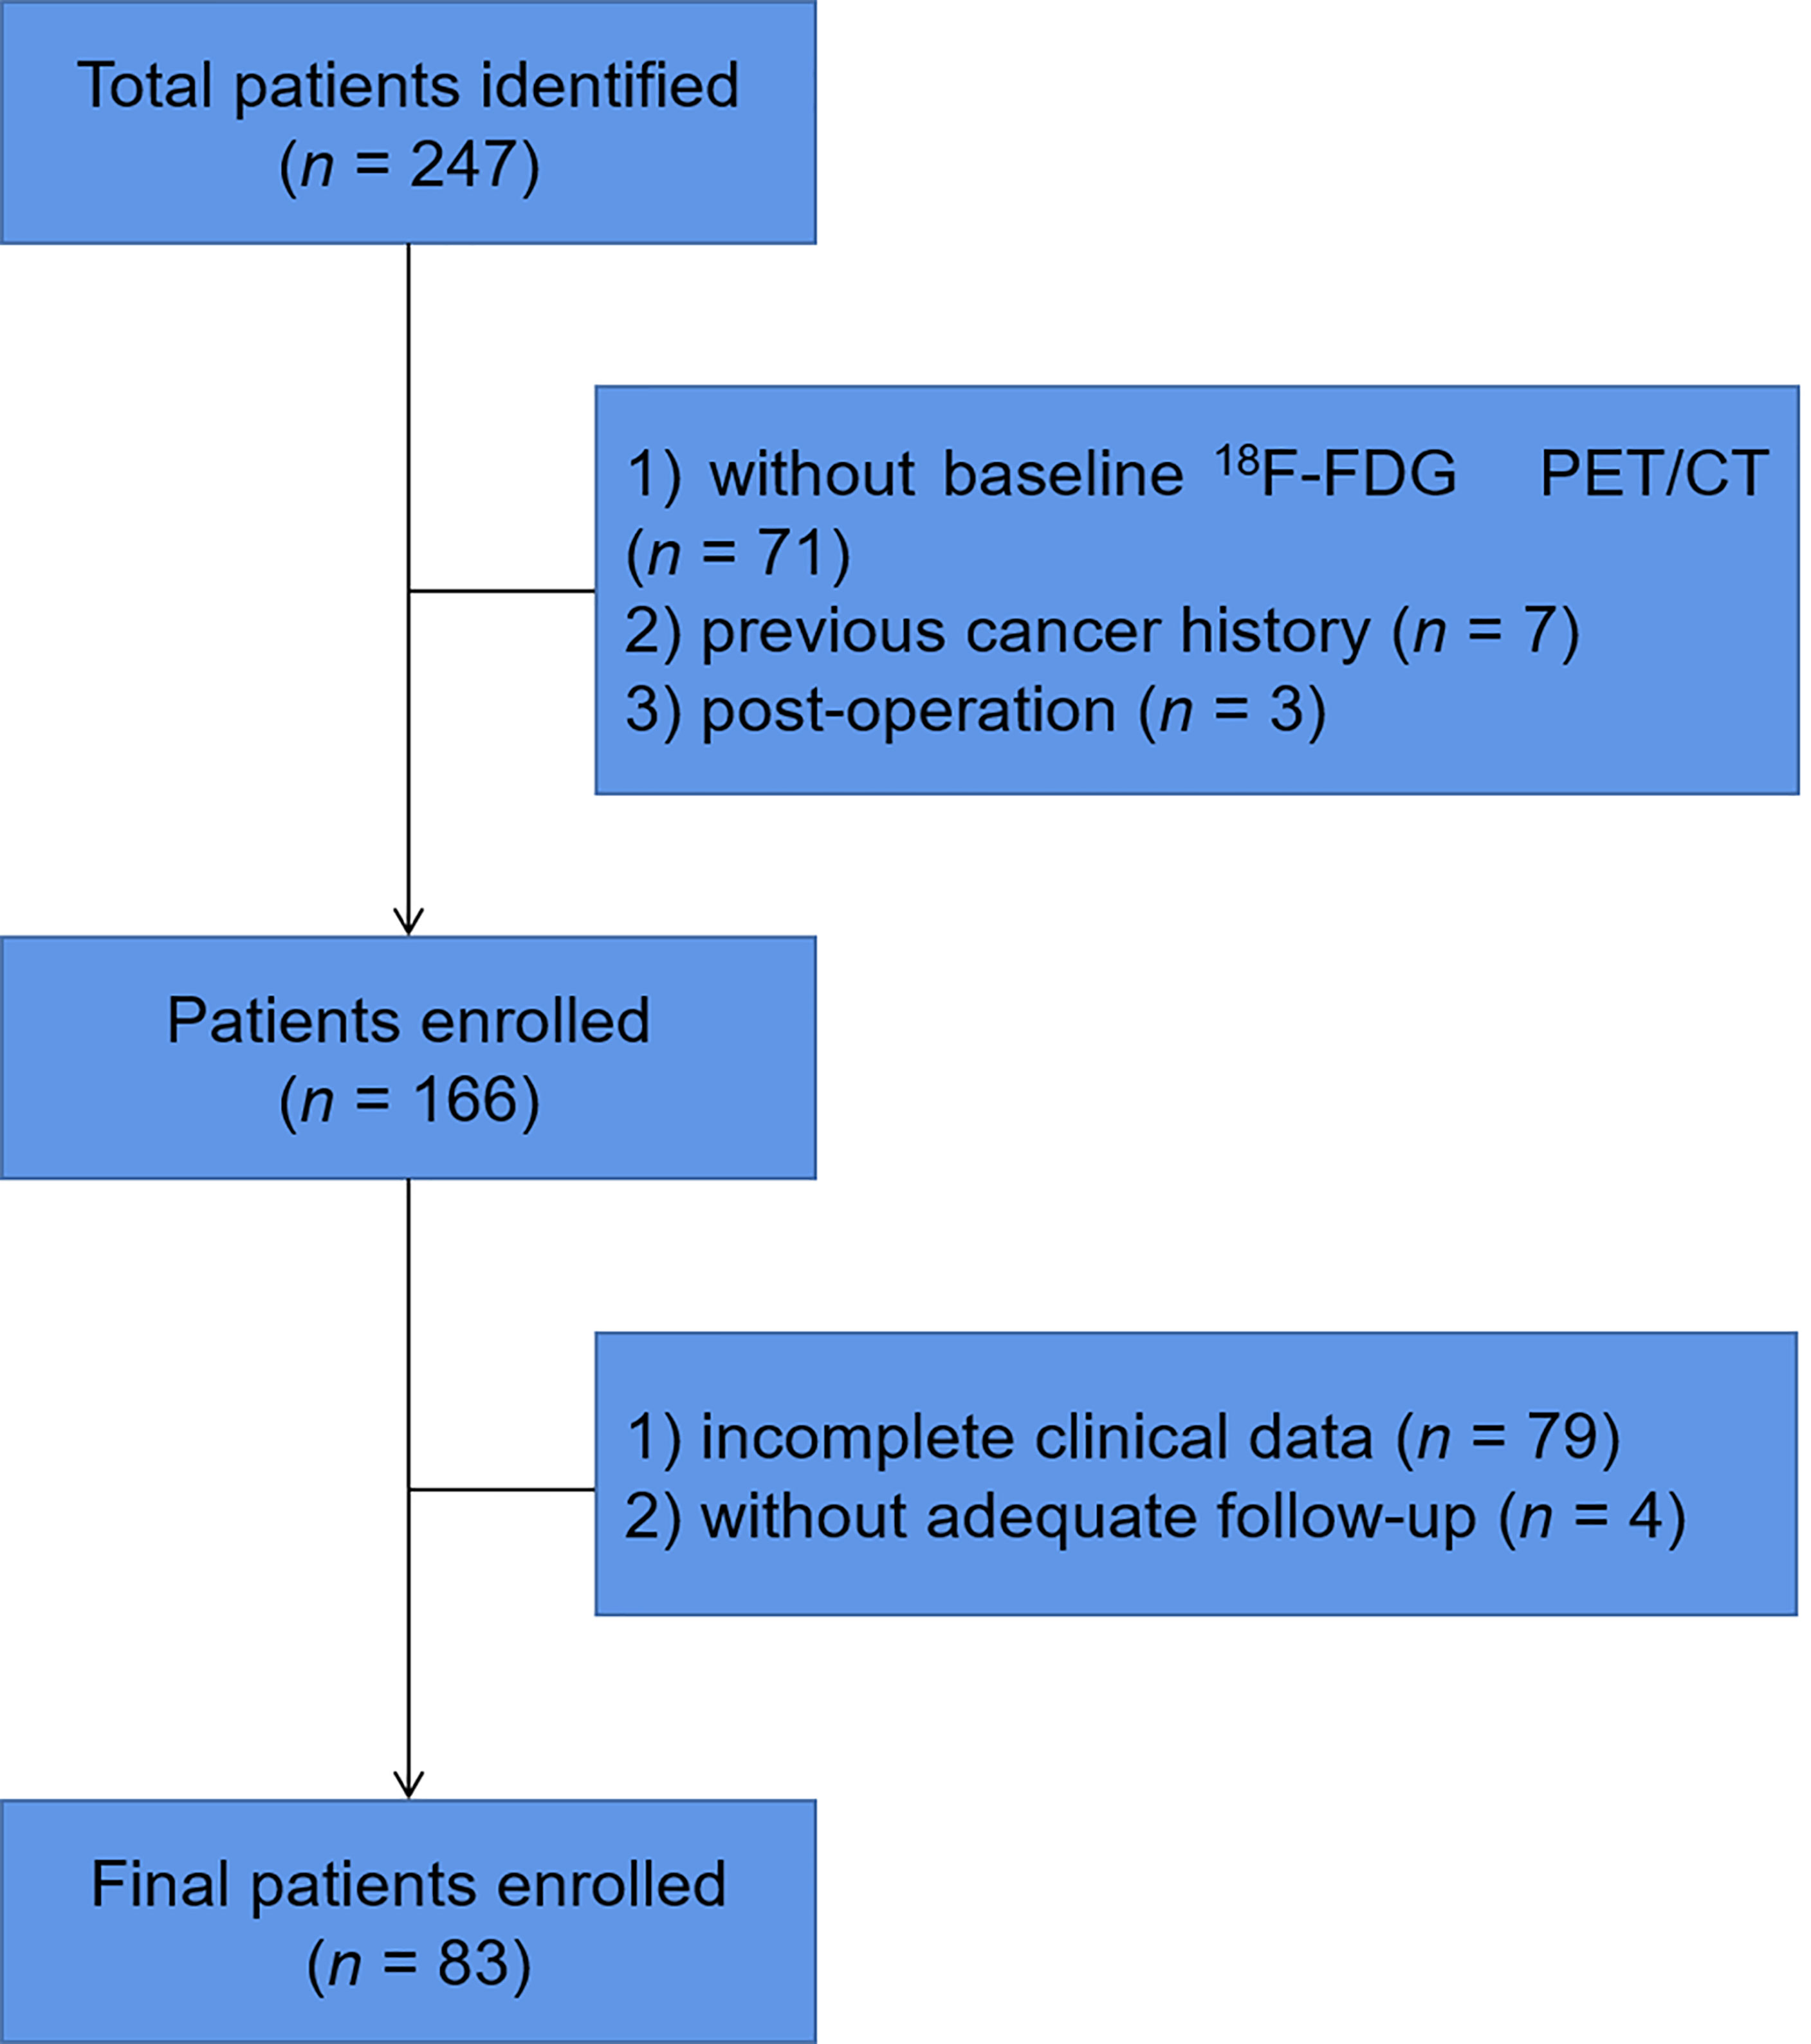
Figure 1 Flow chart of patient selection and exclusion.
A total of 83 patients with histologically proven MCL were recruited into this study. We reviewed the medical records of these patients and the following clinical, laboratory, and biological features: age, sex, body mass index (BMI), Ann Arbor stage, B symptoms, bulky disease, splenomegaly, lactate dehydrogenase (LDH), β2-microglobulin levels, MIPI score, Ki-67 proliferation index, and metabolic features derived from the baseline 18F-FDG PET/CT scans. The LDH and β2-microglobulin levels were divided into two groups with the cutoff value of 245 U/L and 2.8 mg/L, respectively. Bulky disease was defined with CT when the mass was ≥10 cm, while splenomegaly was defined when the maximum length diameter of spleen was >13 cm (22). The patients were divided into high Ki-67 (>20%) and low Ki-67 (≤20%) groups according to the Ki-67 expression level. Patients with a MIPI score higher than 2 were classified in the high MIPI score group.
All the patients underwent baseline 18F-FDG PET/CT imaging using a Siemens biograph PET/CT scanner (Knoxville, Tennessee, USA). The patients were fasted for at least 6 h and the blood glucose was maintained below 10 mmol/L before the examination. Each patient was intravenously injected with 18F-FDG at a dose of 3.7 MBq/kg and continued to rest for approximately 60 min before a PET/CT scan from the head to the mid-thigh was performed. Before PET scanning, a CT scan was performed with the following parameters: 120 kV, 80–250 mA, slice thickness 5 mm, and 0.5 s per rotation. PET images were reconstructed using a three-dimensional ordered subsets expectation maximum (OSEM) algorithm with CT for attenuation.
PET and CT scans were fused and reviewed using the Fusion Viewer software from the manufacturer. The PET/CT images were read by two experienced nuclear medicine physicians blinded to the prior reports. For quantitative analyses, region of interest (ROI) was drawn using Syngo.via software (Siemens) over the regions of tumors. The SUVmax and mean standard uptake value (SUVmean) adjusted to body weight (BW), lean body mass (LBM), and body surface area (BSA) were automatically generated. MTV was calculated automatically according to the threshold of 41% SUVmax in hypermetabolic regions, and TLG was calculated as SUVmean × MTV (23). HI was calculated as dividing SUVmax by SUVmean to evaluate the heterogeneity of tumors (24).
All statistical analyses were carried out using SPSS software (version 26.0, IBM, New York, USA). Receiver operating characteristic (ROC) curve analyses for PFS and OS of 5 years were performed to determine the optimal cutoff values of the parameters, and parameters with an area under the ROC curve (AUC) greater than 0.5 were retained for further analyses. PFS was defined from the date of baseline 18F-FDG to the first disease progression, recurrence, or death (months), and progression/recurrence was considered when the number or dimension of previous lesion increased or new lesion appeared. OS was defined from the date of baseline PET/CT scan until the time of death due to any cause, or the date of last follow-up. Univariate and multivariate Cox regression were used to determine factors in relation to PFS and OS, and variables with a p-value of less than 0.1 in the univariate analyses were included in the further multivariate analyses. Kaplan–Meier plots were performed for survival curves, and the log-rank test were used to determine differences between two curves. A p-value of less than 0.05 was defined as statistically significant.
The characteristics of the 83 MCL patients (64 men and 19 women; average age, 59.76 years; range 43–76 years) are presented in Table 1 and Supplementary Table S1. The average BMI was 23.20 kg/m2 with a range of 16.02–30.80 kg/m2. All patients were staged according to the Ann Arbor system, of whom 1% were stage I, 6% stage II, 22% stage III, and 71% stage IV. Of the 83 patients, 13 (16%) had B symptoms, 19 (23%) had bulky disease, and 27 (33%) had splenomegaly status. High LDH and β2-microglobulin levels were presented in 11 (13%) and 25 (30%) patients, respectively. Fifty-two (63%) patients had high MIPI score of >2 and high Ki-67 score was available for 64 (77%) patients.
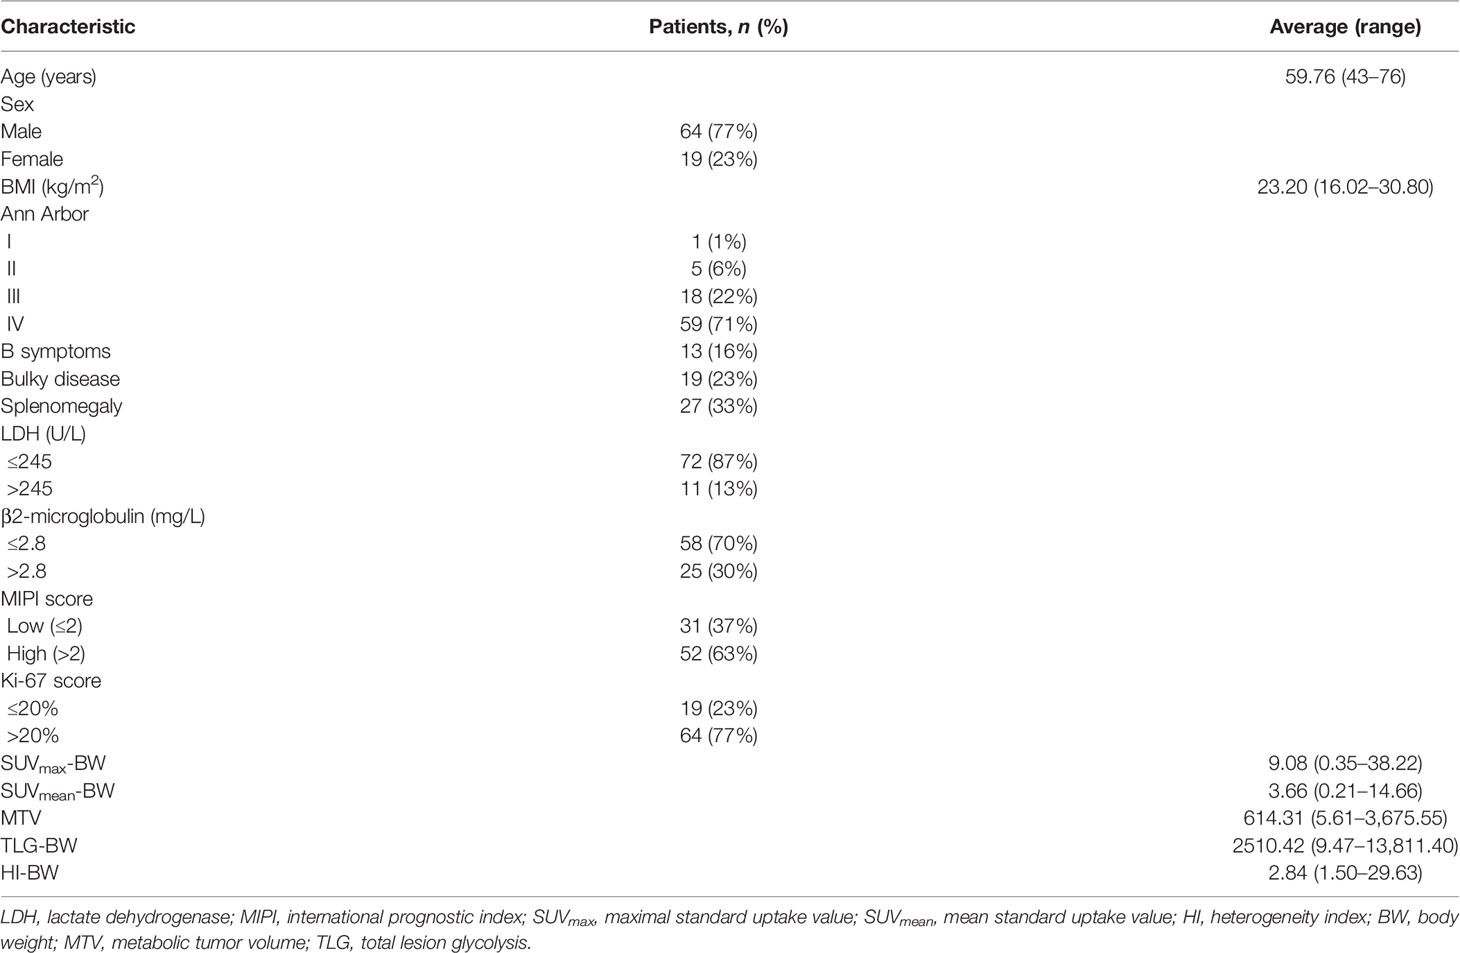
Table 1 Baseline characteristics of patients (n = 83).
All patients underwent a baseline PET/CT scan and FDG avidity was identified in 100% of the MCL patients. PET/CT parameters adjusted to BW, SUVmax-BW, and SUVmean-BW were 9.08 (range 0.35–38.22) and 3.66 (range 0.21–14.66), and the MTV, TLG-BW, and HI-BW were 614.31 (range 5.61–3,675.55), 2,510.42 (range 9.47–13,811.40), and 2.84 (range 1.50–29.63) (Table 1). For the parameters adjusted to LBM, the SUVmax-LBM and SUVmean-LBM were 7.13 (range 0.37–29.88) and 2.91 (range 0.23–11.98), and the TLG-LBM and HI-LBM were 2003.46 (range 7.44–11,487.70) and 2.51 (range 1.49–5.54). For the parameters adjusted to BSA, the SUVmax-BSA and SUVmean-BSA were 2.43 (range 0.33–9.76) and 1.01 (range 0.20–3.92), and the TLG-BSA and HI-BSA were 682.52 (range 2.43–4,073.61) and 2.50 (range 0.73–5.54) (Supplementary Table S1).
Of the 83 patients, 35 (42%) had disease progression/recurrence at a median of 20.06 months, and death occurred in 8 (10%) patients at a median of 31.50 months. The ROC survival curve analyses for PFS and OS are presented in Table 2 and Supplementary Table S2. The study used the 5-year PFS and OS rates as the main study end point, making ROC curves for the clinical and metabolic factors, and the maximum cross-sectional AUCs were defined as the optimal cutoff values.
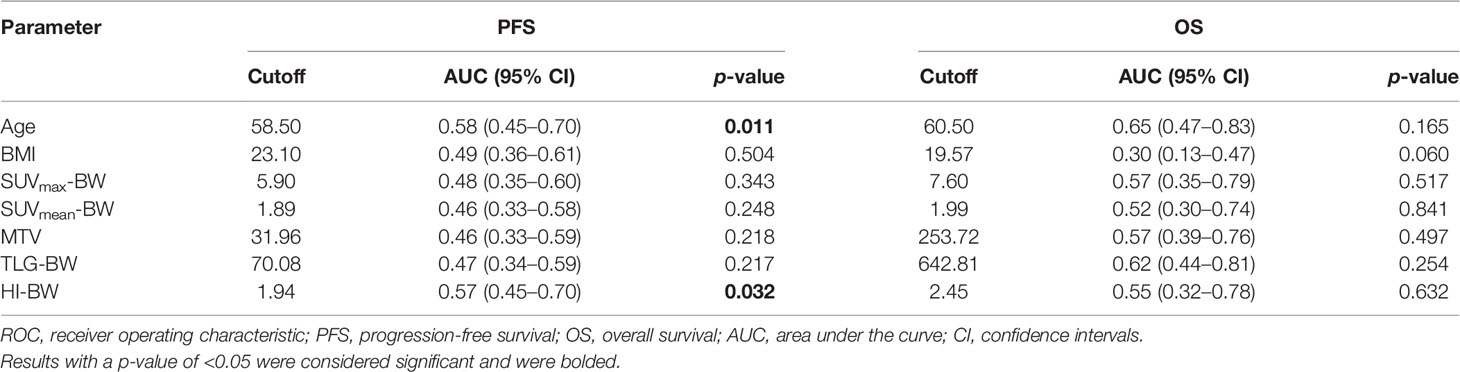
Table 2 ROC curve analyses of prognostic factors for PFS and OS in MCL.
As shown in Table 2, considering PFS, the optimal cutoff values of age and HI-BW were 58.5 years and 1.94, the AUCs were 0.58 (range 0.45–0.70) and 0.57 (range 0.45–0.70), and the p-values were 0.011 and 0.032, respectively. We performed SPSS analyses with LBM- and BSA-related SUV parameters, with similar results (Supplementary Table S2). For HI-LBM and HI-BSA, the optimal cutoff values were 1.98 and 1.94, the AUCs were 0.57 (range 0.45–0.7) and 0.59 (range 0.47–0.71), and the p-values were 0.041 and 0.029 for PFS.
Taking the 5-year PFS and OS as the end points, the clinical and metabolic factors were included into the univariate Cox survival analyses, as shown in Table 3, and age over 58.50 years and high HI-BW were significantly related to PFS (p = 0.041 and 0.050), but not with OS (p = 0.128 and 0.253). B symptoms were significantly related to OS (p = 0.004), but not with PFS (p = 0.780). Similarly, for LBM- and BSA-related SUV parameters, high HI-BLM and HI-BSA showed significance with PFS (p = 0.055 and 0.046), but not with OS (p = 0.253 and 0.596, Supplementary Table S3, S4). However, SUVmax, SUVmean, MTV, and TLG were not significantly correlated with both PFS and OS (Table 3 and Supplementary Tables S3, S4).
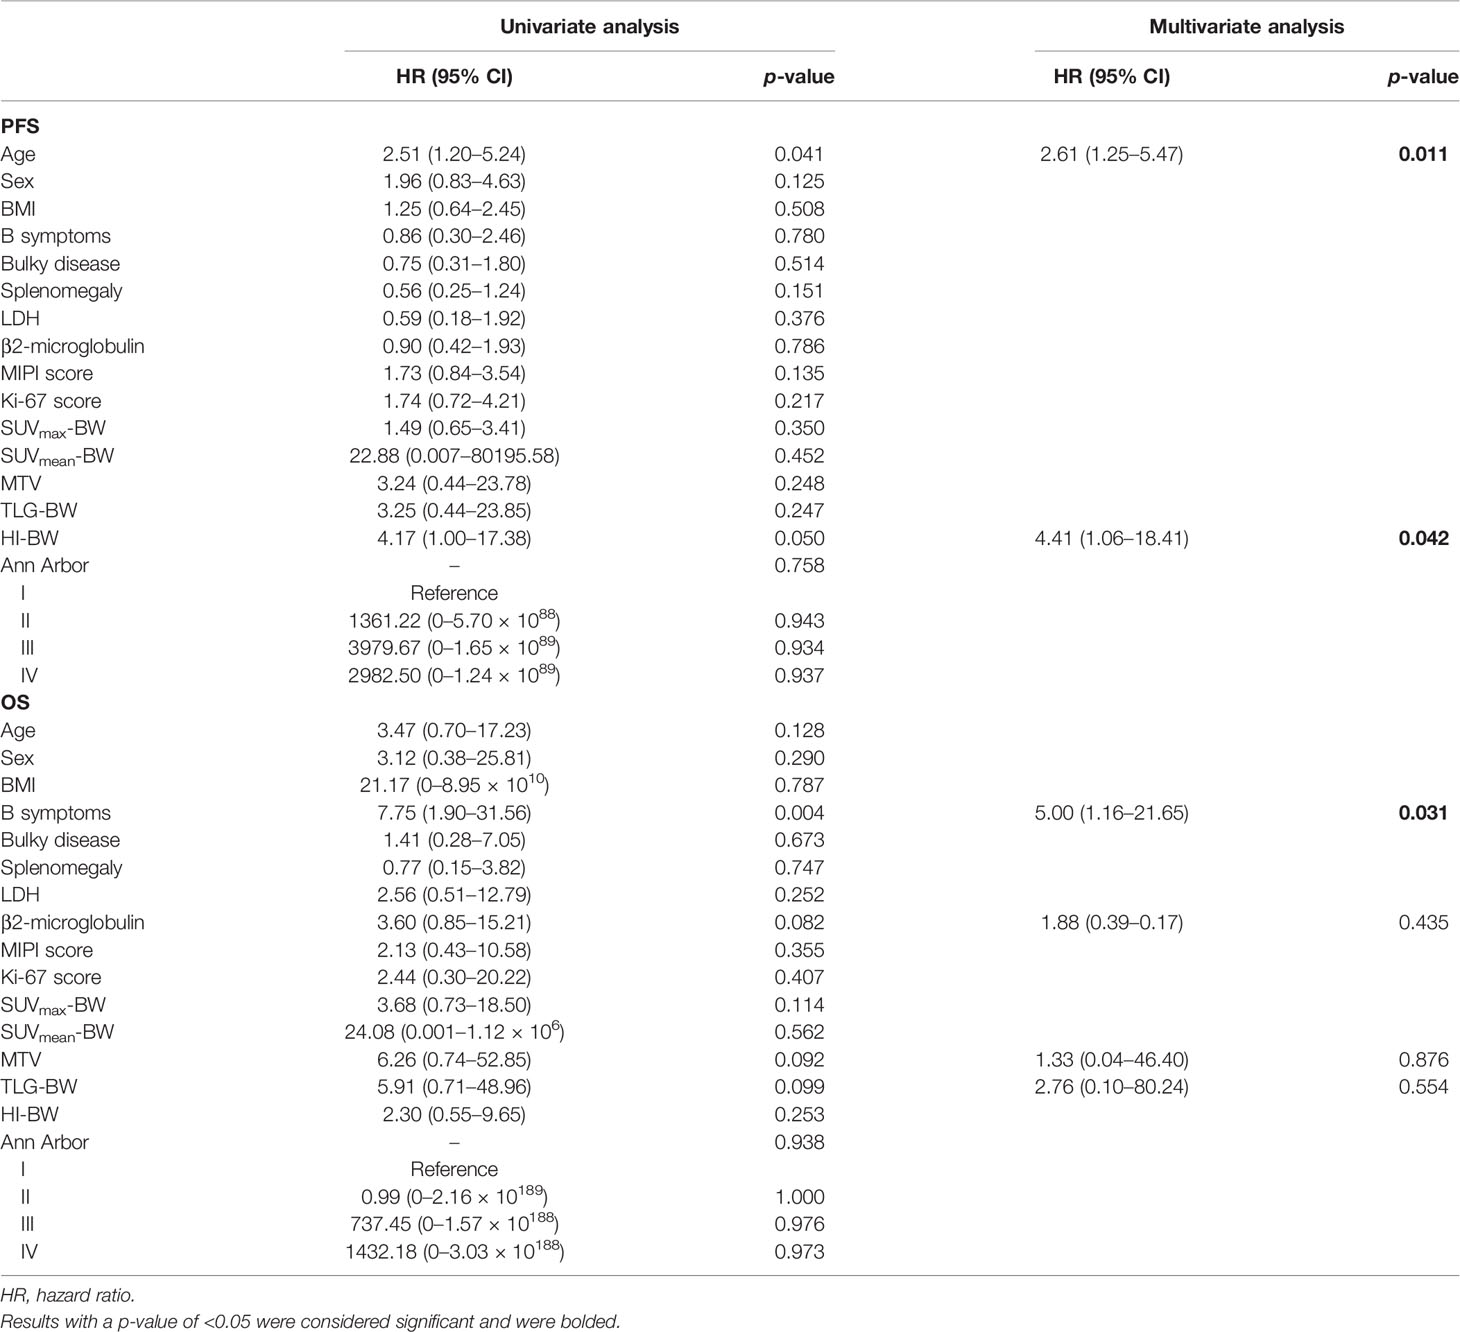
Table 3 Univariate and multivariate analyses of BW-related prognostic factors in relation to PFS and OS using the Cox regression model.
At multivariate analyses, patients with old age (>58.50 years) had a significantly shorter PFS (30 months versus 54 months), and the PFS of patients with high HI (>1.94 for HI-BW and HI-BSA, >1.98 for HI-LBM) was significantly shorter than that of patients with low HI (31 months versus not-reached for HI-BW, HI-LBM, and HI-BSA). Age (HR = 2.61, 95% CI = 1.25–5.47, p = 0.011 for BW; HR = 2.66, 95% CI = 1.27–5.58, p = 0.010 for LBM; HR = 2.63, 95% CI = 1.26–5.50, p = 0.010 for BSA), HI-BW (HR = 4.41, 95% CI = 1.06–18.41, p = 0.042), HI-LBM (HR = 3.46, 95% CI = 1.05–11.33, p = 0.041), and HI-BSA (HR = 4.54, 95% CI = 1.09–18.96, p = 0.038) were proved to be correlated prognostic factors for PFS. B symptoms showed significant correlation with OS (HR = 5.00, 95% CI = 1.16–21.65, p = 0.031 for BM; HR = 9.04, 95% CI = 1.89–43.16, p = 0.006 for LBM; HR = 4.97, 95% CI = 1.15–21.52, p = 0.032 for BSA), but were not significantly correlated with prognosis considering PFS (Table 3 and Supplementary Tables S3, S4). Kaplan–Meier PFS and OS curves of the parameters are displayed in Figures 2, 3 and Supplementary Figure S1. Representative images of 18F-FDG with high and low HI are shown in Figure 4.
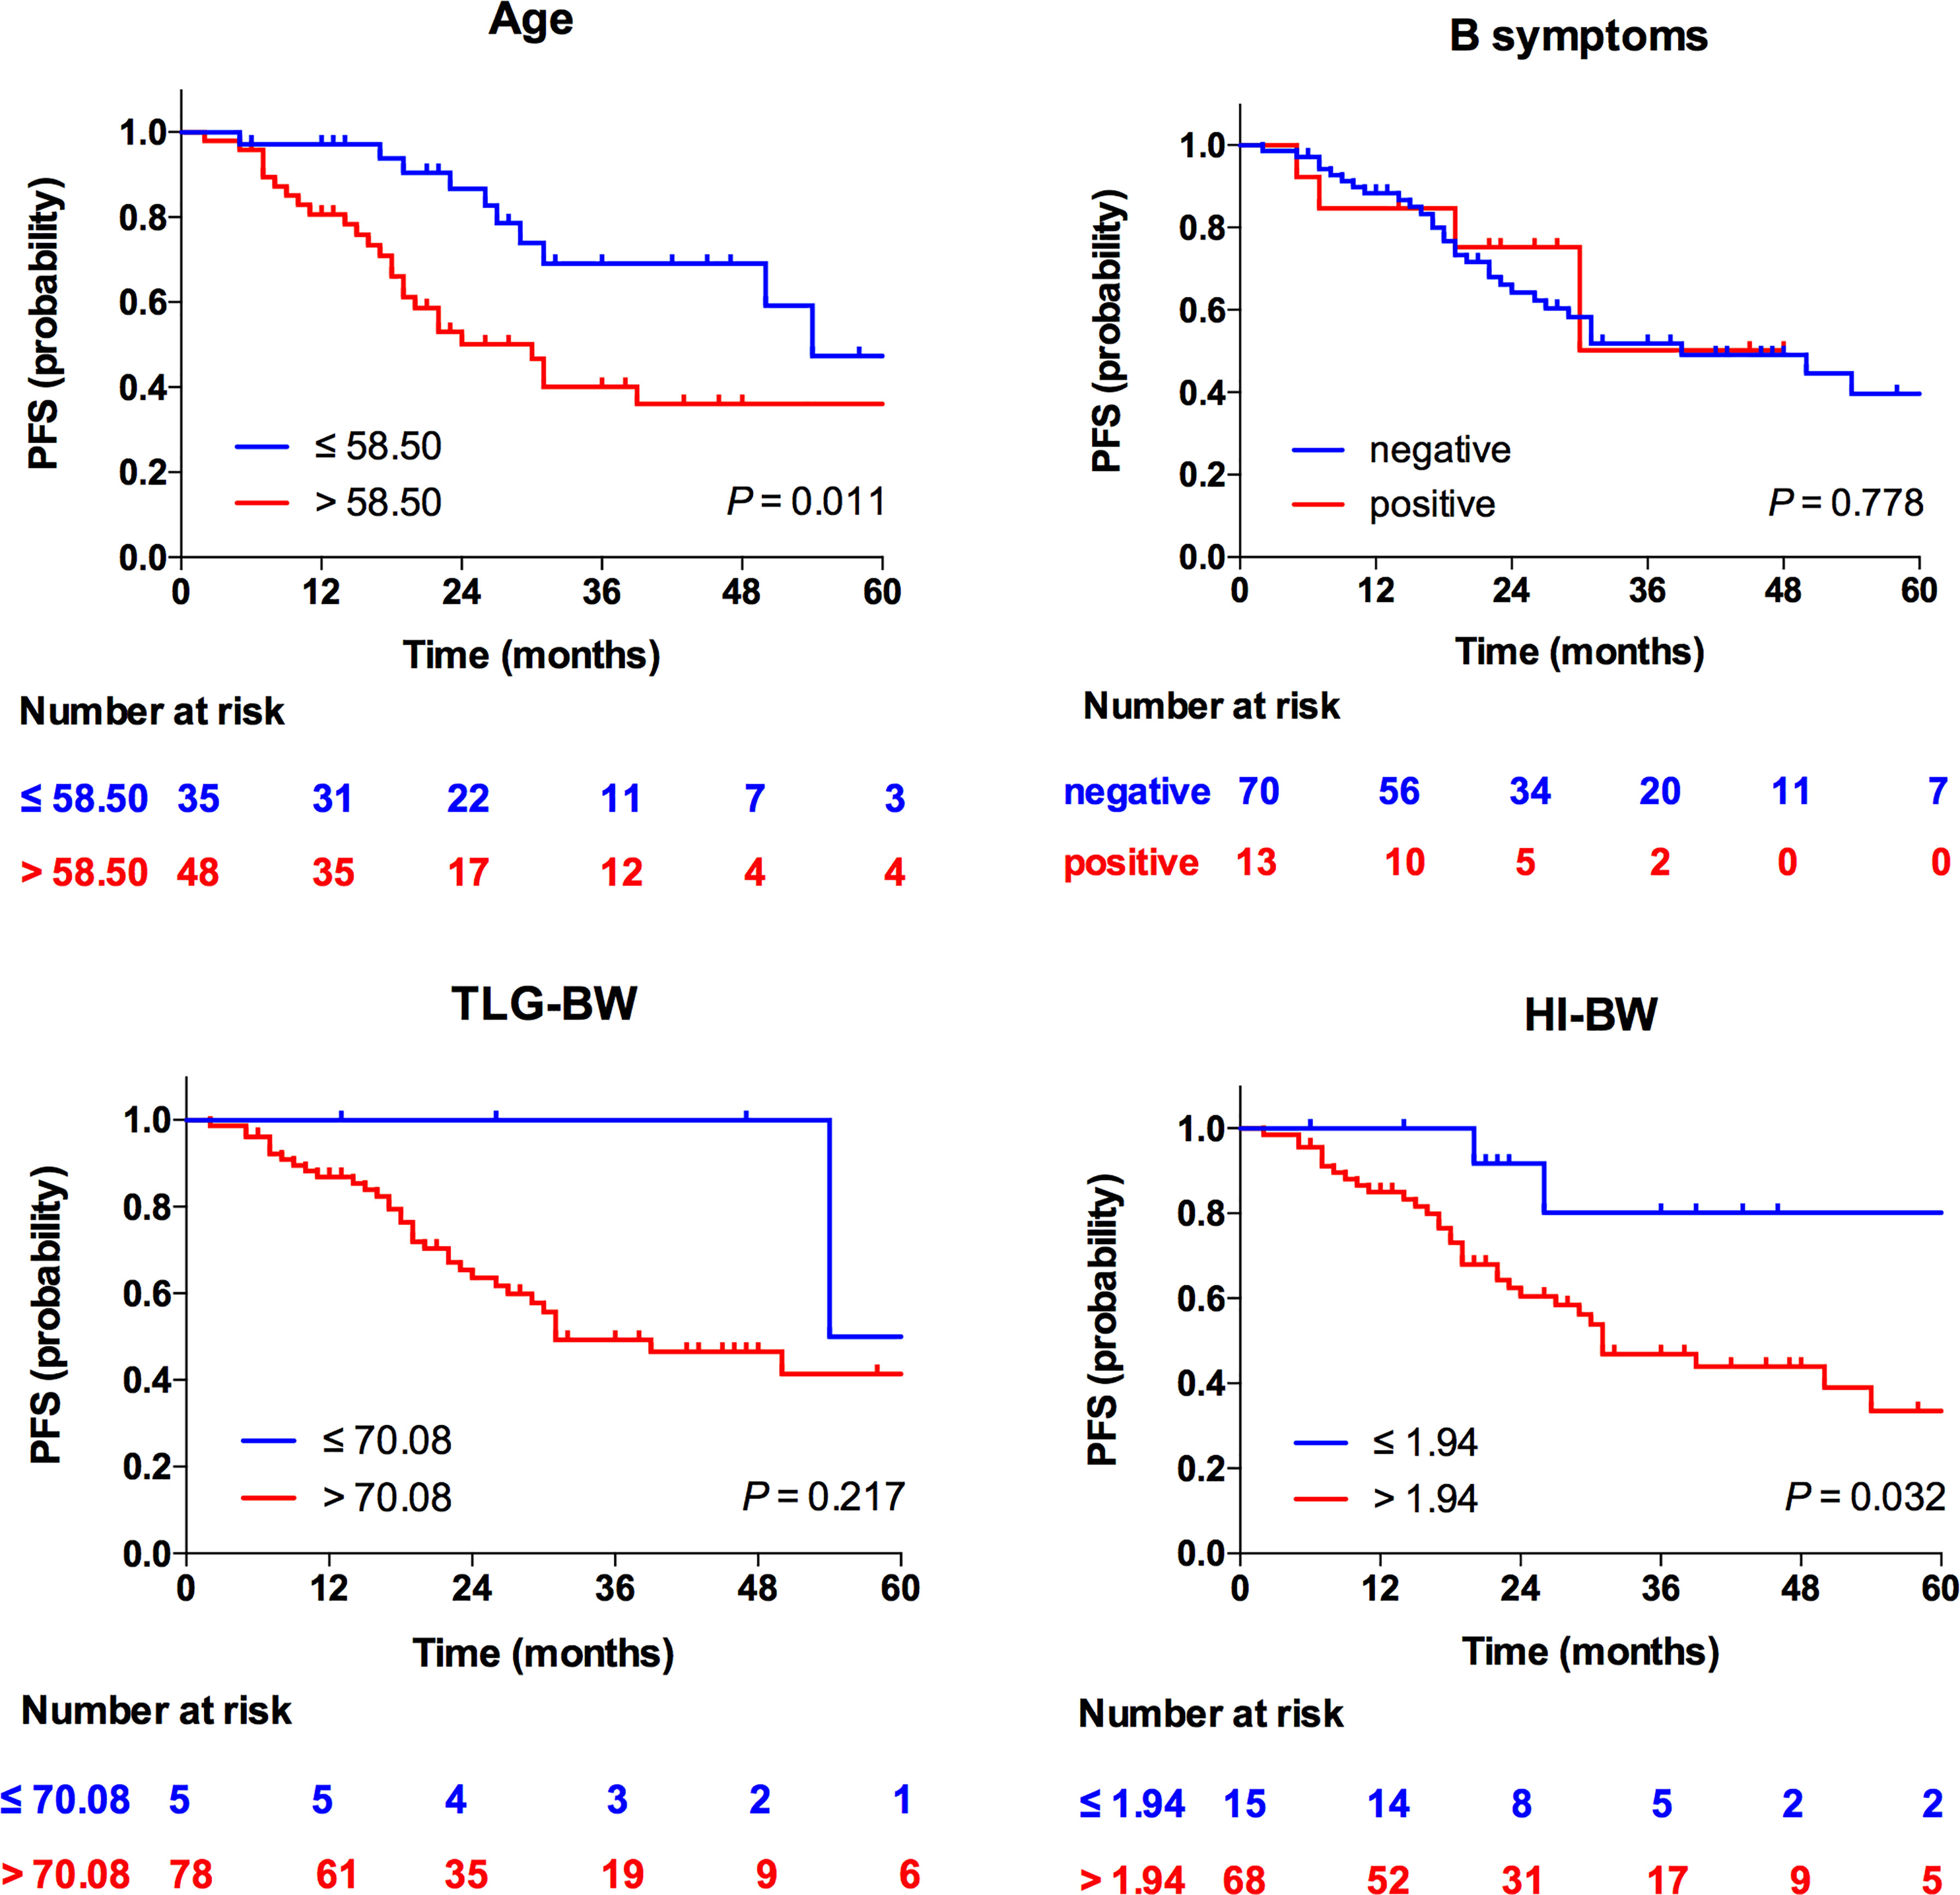
Figure 2 Kaplan–Meier curves for PFS according to age, B symptoms, TLG-BW, and HI-BW.
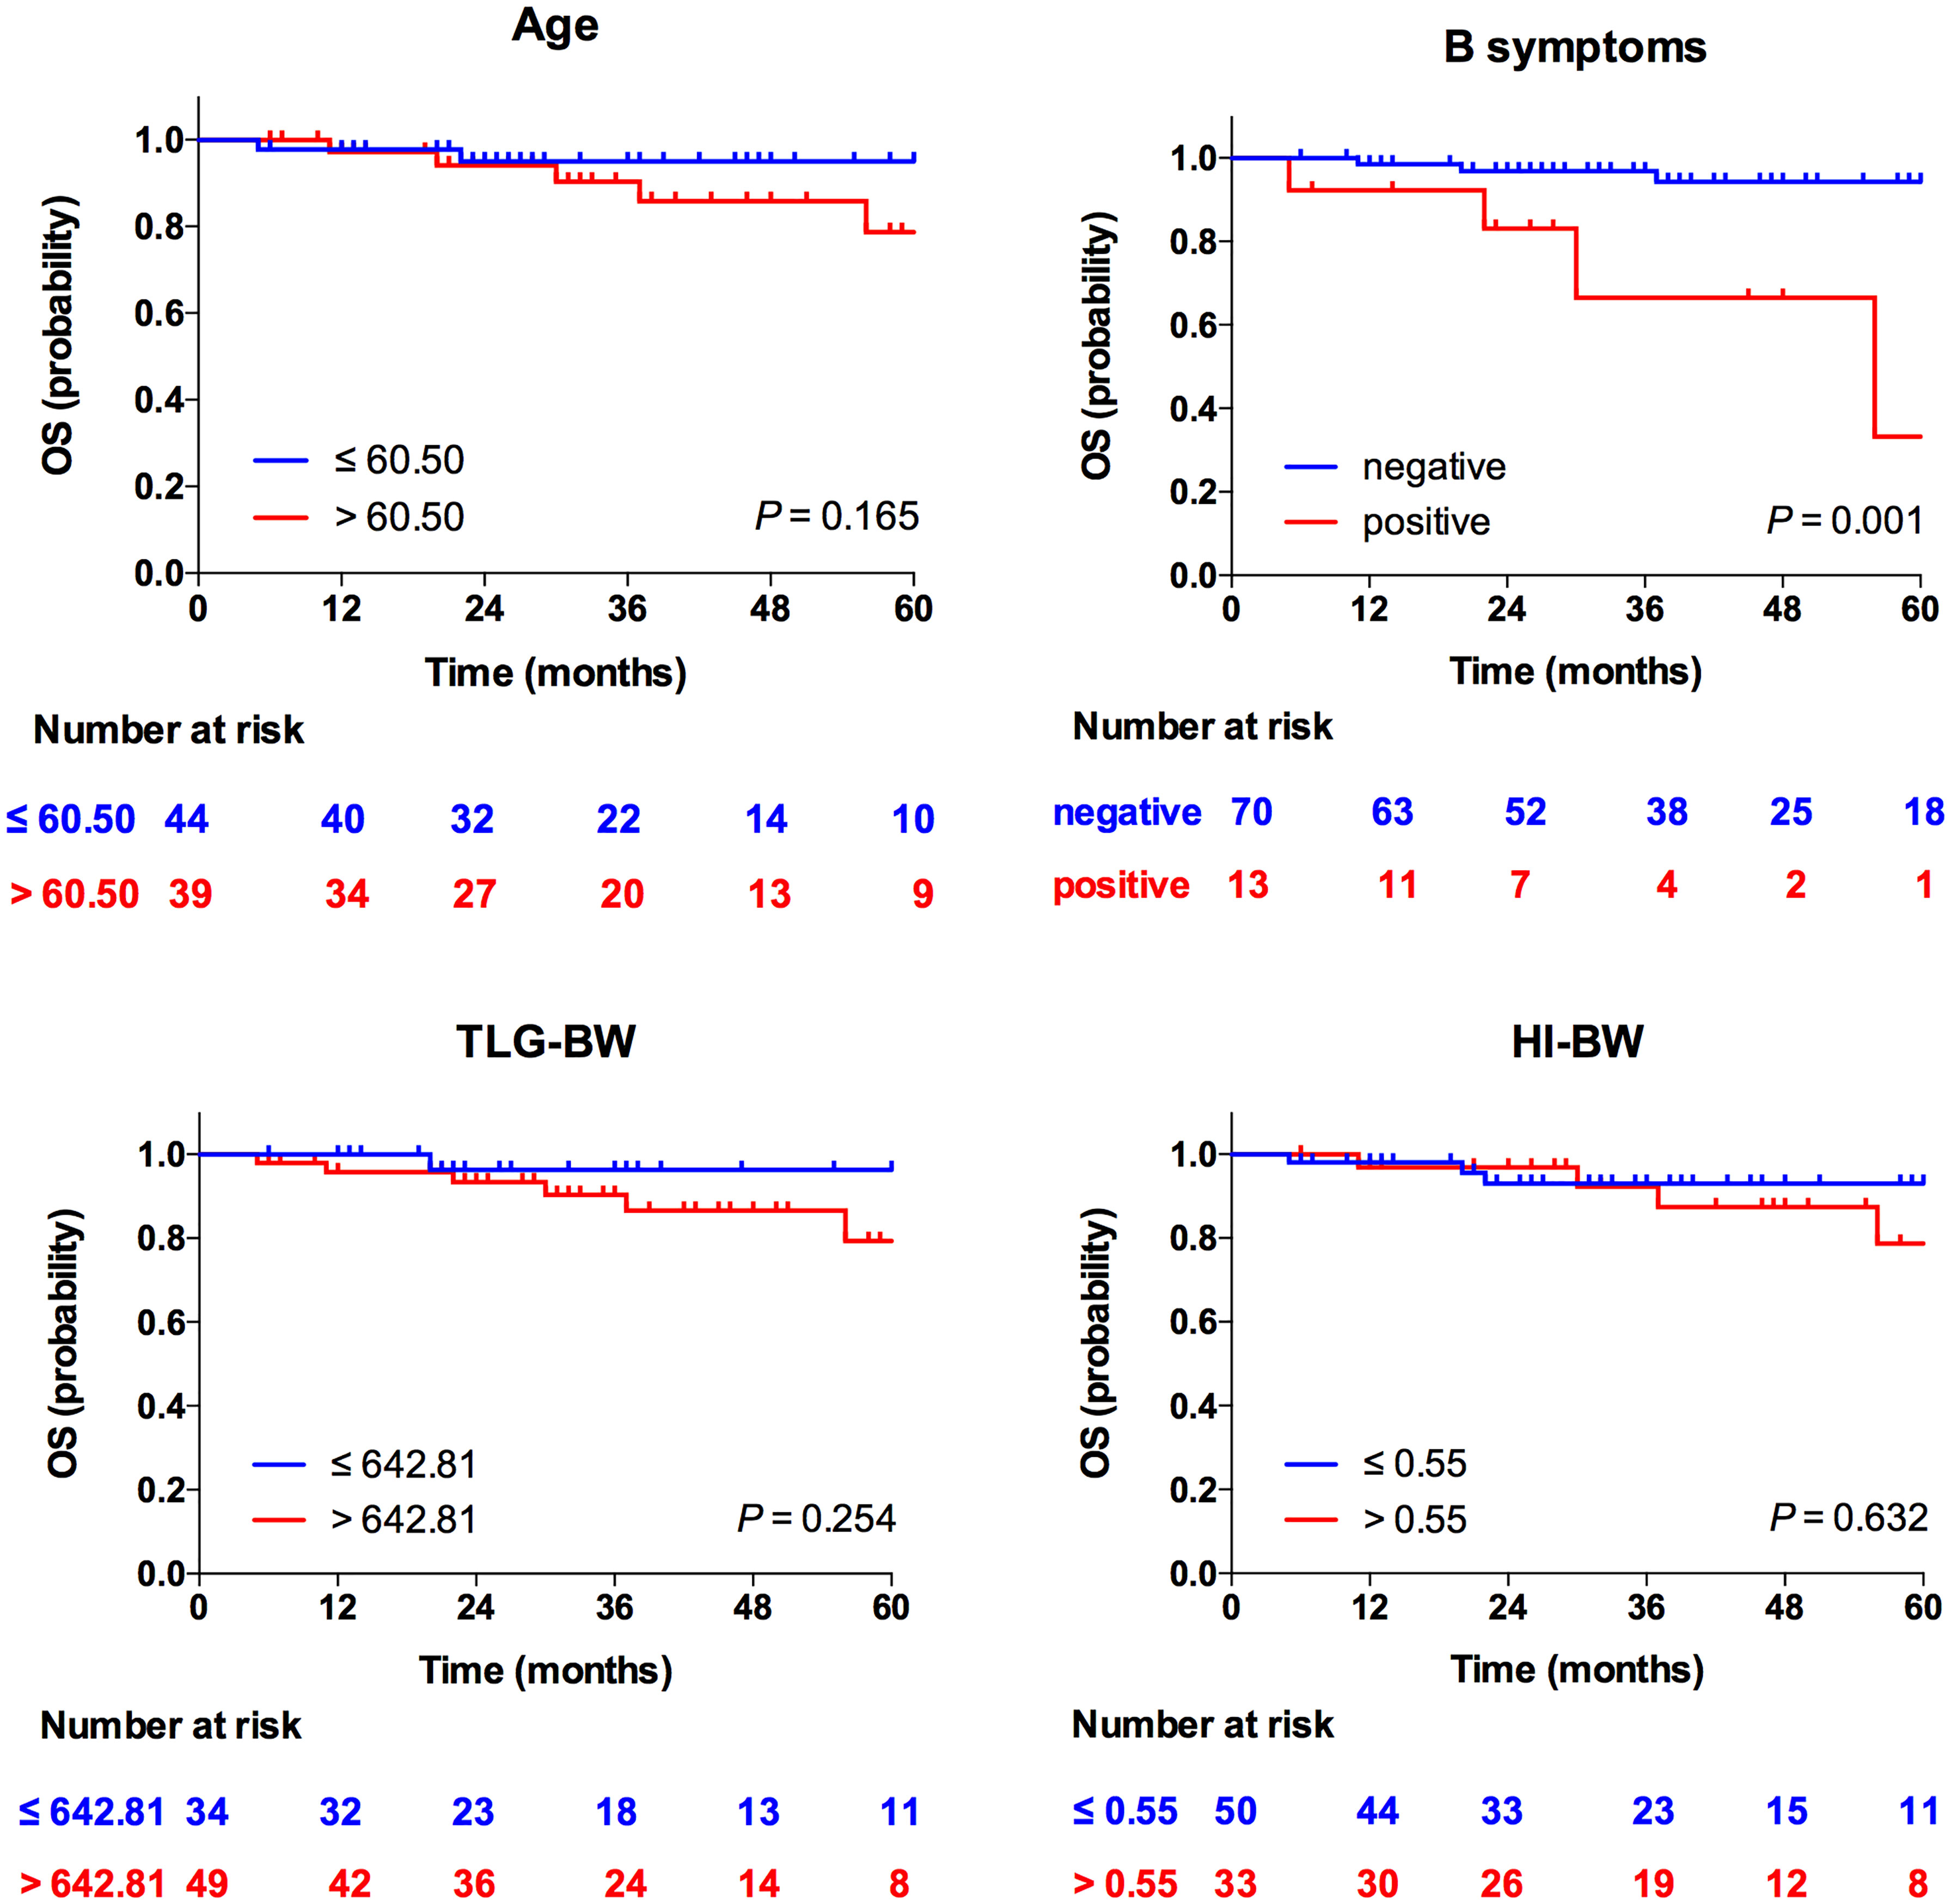
Figure 3 Kaplan–Meier curves for OS according to age, B symptoms, TLG-BW, and HI-BW.
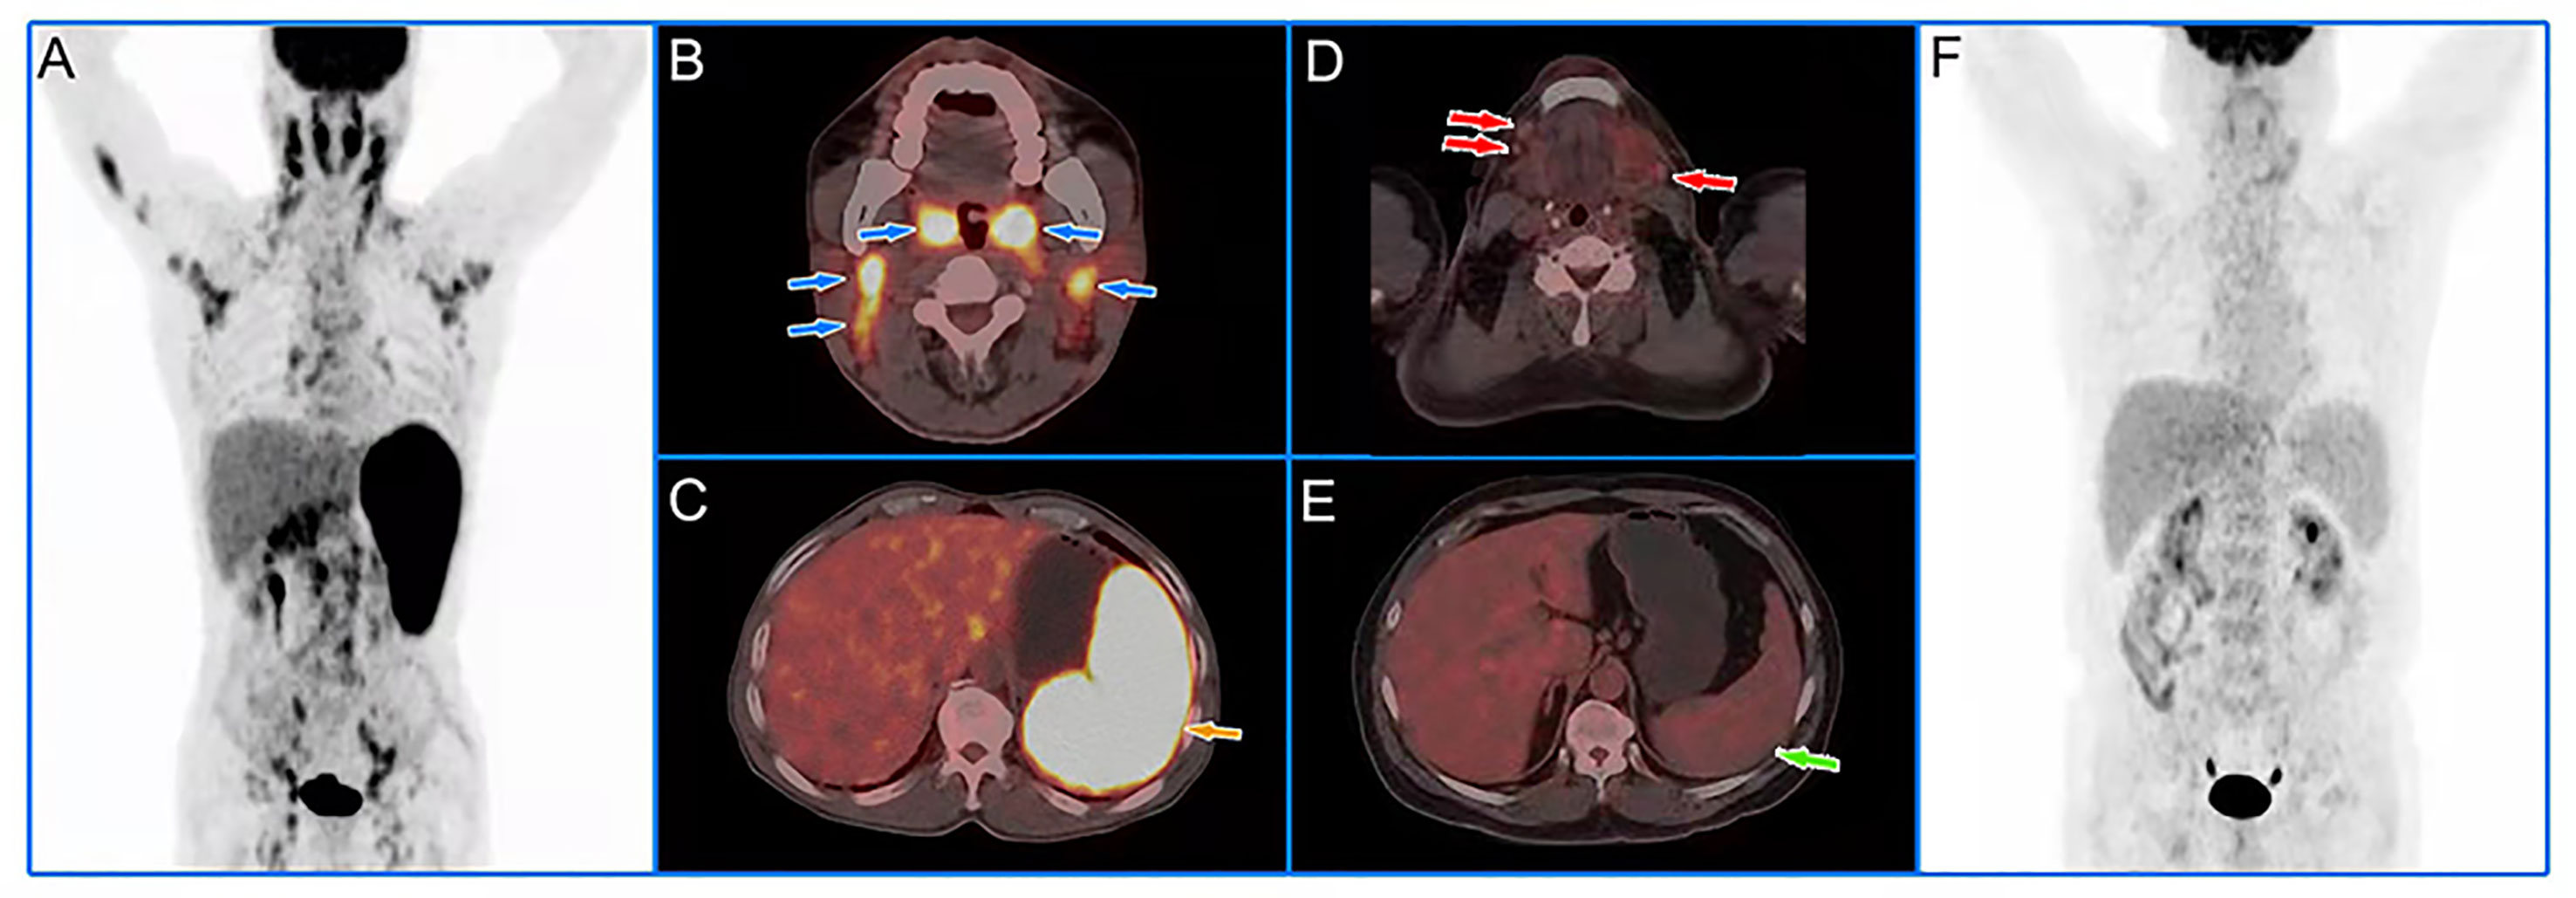
Figure 4 Representative cases of baseline 18F-FDG PET/CT images. A 60-year-old male patient with low HI had extensive lymph node lymphoma invasion and lymphoma infiltration into the oropharynx and spleen (A). The blue and yellow arrows represented the oropharynx, cervical lymph nodes (B), and spleen (C), respectively. The lesions had an SUVmax of 11.09, an SUVmean of 7.10, and a HI of 1.56. We followed up for 39 months and the patient had no recurrence. A 55-year-old male patient with high HI had extensive critical-sized lymph node lymphoma invasion and no lymphoma infiltration into the organs (F). The red and green arrows represented the submaxillary lymph nodes (D) and spleen (E), respectively. The lesions had an SUVmax of 3.35, an SUVmean of 1.13, and a HI of 2.96. The patient developed local recurrence after 29 months of follow-up.
MCL has the characteristics of both invasive and inert lymphoma, and the prognosis of MCL is very poor. Despite the more aggressive treatment, the progression/recurrence of the disease is still frequent; accurate and effective treatment is very important for MCL patients (25, 26). Research showed that the heterogeneity of MCL leads to different treatment effects. How to identify the heterogeneity of MCL and its corresponding clinical characteristics in order to seek more individualized treatment is a long-term research goal (17, 27, 28). HI, the SUVmax/SUVmean ratio, which is calculated from PET/CT images parameters, has been investigated in tumors recently. A previous study has showed that baseline 18F-FDG HI could be used to predict the survival rate of patients with advanced nasopharyngeal carcinoma (29) and that the HI derived from 18F-fluoroestradiol (18F-FES) PET/CT could reflect the estrogen receptor (ER) expression in breast cancer patients (30). To the best of our knowledge, our study is the first research that demonstrated a significant correlation of HI with MCL PFS prognosis, which may further guide the clinical treatment decision-making of MCL patients and benefit the patients to the maximum extent. SUV has traditionally been used to define glucose metabolic activity in PET/CT imaging, and when calculating SUV, BW is usually used as body size measurement; however, some researchers may prefer LBM or BSA to measure body size (31). Our study showed that the prognostic value of HI in MCL patients did not differ in the above three measurement modes. However, in our study, HI showed no significant difference for OS; this might be due to the fact that the number of death events was only 8, and our findings might be inaccurate due to the small sample size.
MIPI score is the most commonly used model in MCL, which combines Eastern Cooperative Oncology Group (ECOG) performance status, age, leukocyte count, and lactate dehydrogenase (6). The 2018 British Society for Haematology (BSH) MCL guidelines point out that the patients’ age, complications, PS scores, and treatment objectives are the factors to be considered before treatment. For patients aged ≤65 years or generally in good condition and suitable for autologous stem cell transplantation (ASCT), induction therapy with high-dose cytarabine should be selected, ASCT consolidation should be performed after remission, and treatment with rituximab can be further beneficial. For patients aged >65 years or generally in poor condition and unsuitable for ASCT, immunochemotherapy with less adverse reactions and better tolerance should be selected (32). In our study, age was an independent prognostic factor for PFS in MCL patients, which was consistent with the guidelines. MCL patients can cause systemic manifestations in the body; patients who have any of the following symptoms are defined as B symptoms positive: unexplained fever (often over 38.0°C), weight loss of more than 10% within 6 months, and night sweats. The presence of B symptoms usually predicts a poor prognosis (33). In our research, B symptoms were an independent prognostic factor for OS.
SUVmax, SUVmean, MTV, and TLG are common PET/CT parameters used in clinical research. Tsukamoto et al. stated that SUVmax ≤ 6.5 had significant correlation with PFS in patients with relapsed indolent lymphoma treated with 90Y-ibritumomab tiuxetan (34). Feng et al. indicated that baseline SUVmax measured on 18F-FDG in T-cell lymphoblastic lymphoma was significantly related to PFS and OS (35). Okuyucu et al. demonstrated that SUVmean was a potential risk factor for OS in primary extranodal lymphoma (36). Instead, in our research, SUVmax and SUVmean showed no significance with PFS or OS in MCL patients. MTV and TLG reflect the volume and total glycolysis of metabolically active tumors, respectively, and MTV and TLG have been proven to be useful indicators to measure tumor invasiveness and predict the treatment response of tumors (37). Albano et al. demonstrated that baseline MTV and TLG were significantly correlated with PFS in MCL patients (14); however, in our study, the metabolic tumor features (MTV and TLG) showed no significant relationship with both PFS and OS. Previous studies showed similar results; Mayerhoefer et al. demonstrated that TLG was an independent prognostic factor of 2-year PFS in mucosa-associated lymphoid tissue (MALT) lymphoma treated with CD20-antibody-based immunotherapy, but another study claimed that the PET/CT parameters (MTV and TLG) were not related to PFS or OS in MALT lymphoma (38, 39). The possible reason for the results may arise from the heterogeneity of patients recruited.
However, this study still has some limitations. Firstly, the number of patients recruited was low and the interim/post-treatment response evaluation using 18F-FDG PET/CT was absent, which needs to be further validated. Secondly, the number of death events was small, and our findings on OS prognosis might be inaccurate. Thirdly, the results also lack further confirmation by multicenter and prospective studies in MCL patients.
In conclusion, our findings showed that age and HI derived from PET/CT metabolic factors were helpful independent prognostic factors to predict long-term PFS in MCL patients. However, larger-scale clinical studies are needed to better verify the prognostic role of HI in MCL patients.
The original contributions presented in the study are included in the article/Supplementary Material. Further inquiries can be directed to the corresponding author.
Written informed consent was not obtained from the individual(s) for the publication of any potentially identifiable images or data included in this article.
FL and BG designed the studies. FL wrote the manuscript. NL, HP, WC, and YQ gathered the data. FL and BG analyzed the data. SS and XL participated in revising the manuscript. All authors contributed to the article and approved the submitted version.
This work was funded by the National Natural Science Foundation of China (Grant number 82102097, 81771861, 81971648, and 81901778), the Talent Introduction Fund of Fudan University Shanghai Cancer Center (Grant number YJRC202104), the National Key Research and Development Program of China (Grant number 2020YFA0909000), and Shanghai Anticancer Association Program (Grant number HYXH2021004).
The authors declare that the research was conducted in the absence of any commercial or financial relationships that could be construed as a potential conflict of interest
All claims expressed in this article are solely those of the authors and do not necessarily represent those of their affiliated organizations, or those of the publisher, the editors and the reviewers. Any product that may be evaluated in this article, or claim that may be made by its manufacturer, is not guaranteed or endorsed by the publisher.
The Supplementary Material for this article can be found online at: https://www.frontiersin.org/articles/10.3389/fonc.2022.862473/full#supplementary-material
1. Swerdlow SH, Campo E, Pileri SA, Harris NL, Stein H, Siebert R, et al. The 2016 Revision of the World Health Organization Classification of Lymphoid Neoplasms. Blood (2016) 127(20):2375–90. doi: 10.1182/blood-2016-01-643569
2. Teras LR, DeSantis CE, Cerhan JR, Morton LM, Jemal A, Flowers CR. 2016 Us Lymphoid Malignancy Statistics by World Health Organization Subtypes. CA Cancer J Clin (2016) 66(6):443–59. doi: 10.3322/caac.21357
3. Maddocks K. Update on Mantle Cell Lymphoma. Blood (2018) 132(16):1647–56. doi: 10.1182/blood-2018-03-791392
4. Albano D, Treglia G, Gazzilli M, Cerudelli E, Giubbini R, Bertagna F. (18)F-FDG PET or Pet/Ct in Mantle Cell Lymphoma. Clin Lymphoma Myeloma Leuk (2020) 20(7):422–30. doi: 10.1016/j.clml.2020.01.018
5. Navarro A, Beà S, Jares P, Campo E. Molecular Pathogenesis of Mantle Cell Lymphoma. Hematol Oncol Clin North Am (2020) 34(5):795–807. doi: 10.1016/j.hoc.2020.05.002
6. Vose JM. Mantle Cell Lymphoma: 2017 Update on Diagnosis, Risk-Stratification, and Clinical Management. Am J Hematol (2017) 92(8):806–13. doi: 10.1002/ajh.24797
7. Hoster E, Dreyling M, Klapper W, Gisselbrecht C, van Hoof A, Kluin-Nelemans HC, et al. A New Prognostic Index (Mipi) for Patients With Advanced-Stage Mantle Cell Lymphoma. Blood (2008) 111(2):558–65. doi: 10.1182/blood-2007-06-095331
8. Hoster E, Rosenwald A, Berger F, Bernd HW, Hartmann S, Loddenkemper C, et al. Prognostic Value of Ki-67 Index, Cytology, and Growth Pattern in Mantle-Cell Lymphoma: Results From Randomized Trials of the European Mantle Cell Lymphoma Network. J Clin Oncol (2016) 34(12):1386–94. doi: 10.1200/jco.2015.63.8387
9. Nordström L, Sernbo S, Eden P, Grønbaek K, Kolstad A, Räty R, et al. Sox11 and Tp53 Add Prognostic Information to Mipi in a Homogenously Treated Cohort of Mantle Cell Lymphoma–a Nordic Lymphoma Group Study. Br J Haematol (2014) 166(1):98–108. doi: 10.1111/bjh.12854
10. Husby S, Ralfkiaer U, Garde C, Zandi R, Ek S, Kolstad A, et al. Mir-18b Overexpression Identifies Mantle Cell Lymphoma Patients With Poor Outcome and Improves the Mipi-B Prognosticator. Blood (2015) 125(17):2669–77. doi: 10.1182/blood-2014-06-584193
11. Bailly C, Carlier T, Berriolo-Riedinger A, Casasnovas O, Gyan E, Meignan M, et al. Prognostic Value of Fdg-Pet in Patients With Mantle Cell Lymphoma: Results From the Lyma-Pet Project. Haematologica (2020) 105(1):e33-e6. doi: 10.3324/haematol.2019.223016
12. Bodet-Milin C, Touzeau C, Leux C, Sahin M, Moreau A, Maisonneuve H, et al. Prognostic Impact of 18f-Fluoro-Deoxyglucose Positron Emission Tomography in Untreated Mantle Cell Lymphoma: A Retrospective Study From the Goelams Group. Eur J Nucl Med Mol Imaging (2010) 37(9):1633–42. doi: 10.1007/s00259-010-1469-2
13. Hosein PJ, Pastorini VH, Paes FM, Eber D, Chapman JR, Serafini AN, et al. Utility of Positron Emission Tomography Scans in Mantle Cell Lymphoma. Am J Hematol (2011) 86(10):841–5. doi: 10.1002/ajh.22126
14. Albano D, Bosio G, Bianchetti N, Pagani C, Re A, Tucci A, et al. Prognostic Role of Baseline 18f-Fdg Pet/Ct Metabolic Parameters in Mantle Cell Lymphoma. Ann Nucl Med (2019) 33(7):449–58. doi: 10.1007/s12149-019-01354-9
15. Jain P, Wang M. Mantle Cell Lymphoma: 2019 Update on the Diagnosis, Pathogenesis, Prognostication, and Management. Am J Hematol (2019) 94(6):710–25. doi: 10.1002/ajh.25487
16. Pararajalingam P, Coyle KM, Arthur SE, Thomas N, Alcaide M, Meissner B, et al. Coding and Noncoding Drivers of Mantle Cell Lymphoma Identified Through Exome and Genome Sequencing. Blood (2020) 136(5):572–84. doi: 10.1182/blood.2019002385
17. Hanel W, Epperla N. Emerging Therapies in Mantle Cell Lymphoma. J Hematol Oncol (2020) 13(1):79. doi: 10.1186/s13045-020-00914-1
18. Seban RD, Nemer JS, Marabelle A, Yeh R, Deutsch E, Ammari S, et al. Prognostic and Theranostic 18f-Fdg Pet Biomarkers for Anti-Pd1 Immunotherapy in Metastatic Melanoma: Association With Outcome and Transcriptomics. Eur J Nucl Med Mol Imaging (2019) 46(11):2298–310. doi: 10.1007/s00259-019-04411-7
19. Lee JW, Park JY, Lee HJ, Lee JJ, Moon SH, Kang SY, et al. Preoperative [(18)F]FDG PET/CT Tumour Heterogeneity Index in Patients With Uterine Leiomyosarcoma: A Multicentre Retrospective Study. Eur J Nucl Med Mol Imaging (2018) 45(8):1309–16. doi: 10.1007/s00259-018-3975-6
20. Castelli J, Depeursinge A, Devillers A, Campillo-Gimenez B, Dicente Y, Prior JO, et al. Pet-Based Prognostic Survival Model After Radiotherapy for Head and Neck Cancer. Eur J Nucl Med Mol Imaging (2019) 46(3):638–49. doi: 10.1007/s00259-018-4134-9
21. Gong C, Ma G, Hu X, Zhang Y, Wang Z, Zhang J, et al. Pretreatment (18)F-Fdg Uptake Heterogeneity Predicts Treatment Outcome of First-Line Chemotherapy in Patients With Metastatic Triple-Negative Breast Cancer. Oncologist (2018) 23(10):1144–52. doi: 10.1634/theoncologist.2018-0001
22. Cheson BD, Fisher RI, Barrington SF, Cavalli F, Schwartz LH, Zucca E, et al. Recommendations for Initial Evaluation, Staging, and Response Assessment of Hodgkin and Non-Hodgkin Lymphoma: The Lugano Classification. J Clin Oncol (2014) 32(27):3059–68. doi: 10.1200/jco.2013.54.8800
23. Boellaard R, Delgado-Bolton R, Oyen WJ, Giammarile F, Tatsch K, Eschner W, et al. FDG PET/CT: Eanm Procedure Guidelines for Tumour Imaging: Version 2.0. Eur J Nucl Med Mol Imaging (2015) 42(2):328–54. doi: 10.1007/s00259-014-2961-x
24. Salamon J, Derlin T, Bannas P, Busch JD, Herrmann J, Bockhorn M, et al. Evaluation of Intratumoural Heterogeneity on ¹8f-FDG PET/CT for Characterization of Peripheral Nerve Sheath Tumours in Neurofibromatosis Type 1. Eur J Nucl Med Mol Imaging (2013) 40(5):685–92. doi: 10.1007/s00259-012-2314-6
25. Tam CS, Anderson MA, Pott C, Agarwal R, Handunnetti S, Hicks RJ, et al. Ibrutinib Plus Venetoclax for the Treatment of Mantle-Cell Lymphoma. N Engl J Med (2018) 378(13):1211–23. doi: 10.1056/NEJMoa1715519
26. Wang M, Rule S, Zinzani PL, Goy A, Casasnovas O, Smith SD, et al. Acalabrutinib in Relapsed or Refractory Mantle Cell Lymphoma (Ace-Ly-004): A Single-Arm, Multicentre, Phase 2 Trial. Lancet (2018) 391(10121):659–67. doi: 10.1016/s0140-6736(17)33108-2
27. Witzig TE. What Is Responsible for Heterogeneity in Mantle Cell Lymphoma Biology and Outcomes? Hematol Oncol Clin North Am (2020) 34(5):825–35. doi: 10.1016/j.hoc.2020.06.001
28. Wang L, Mo S, Li X, He Y, Yang J. Single-Cell Rna-Seq Reveals the Immune Escape and Drug Resistance Mechanisms of Mantle Cell Lymphoma. Cancer Biol Med (2020) 17(3):726–39. doi: 10.20892/j.issn.2095-3941.2020.0073
29. Yang Z, Shi Q, Zhang Y, Pan H, Yao Z, Hu S, et al. Pretreatment (18)F-Fdg Uptake Heterogeneity Can Predict Survival in Patients With Locally Advanced Nasopharyngeal Carcinoma–a Retrospective Study. Radiat Oncol (2015) 10:4. doi: 10.1186/s13014-014-0268-5
30. Yang Z, Sun Y, Xu X, Zhang Y, Zhang J, Xue J, et al. The Assessment of Estrogen Receptor Status and Its Intratumoral Heterogeneity in Patients With Breast Cancer by Using 18f-Fluoroestradiol PET/Ct. Clin Nucl Med (2017) 42(6):421–7. doi: 10.1097/rlu.0000000000001587
31. Tatcı E, Uslu Biner İ, Emir S, Tanyıldız HG, Özmen Ö, Alagöz E, et al. The Correlation Between Pre-Treatment Fluorodeoxyglucose Positron Emission Tomography/Computed Tomography Parameters and Clinical Prognostic Factors in Pediatric Hodgkin Lymphoma. Mol Imaging Radionucl Ther (2017) 26(1):9–16. doi: 10.4274/mirt.94914
32. McKay P, Leach M, Jackson B, Robinson S, Rule S. Guideline for the Management of Mantle Cell Lymphoma. Br J Haematol (2018) 182(1):46–62. doi: 10.1111/bjh.15283
33. Zheng W, Ren H, Ke X, Xue M, Zhang Y, Xie Y, et al. Peg-Asparaginase in Bfm-90 Regimen Improves Outcomes in Adults With Newly Diagnosed Lymphoblastic Lymphoma. Chin J Cancer Res (2017) 29(1):66–74. doi: 10.21147/j.issn.1000-9604.2017.01.08
34. Tsukamoto N, Yokohama A, Higuchi T, Mitsui T, Koiso H, Takizawa M, et al. Tumor Long-Axis Diameter and Suvmax Predict Long-Term Responders in 90y-Ibritumomab Tiuxetan Monotherapy. Int J Hematol (2019) 109(1):91–7. doi: 10.1007/s12185-018-2526-z
35. Feng X, Wen X, Li L, Sun Z, Li X, Zhang L, et al. Baseline Total Metabolic Tumor Volume and Total Lesion Glycolysis Measured on 18f-Fdg Pet-Ct Predict Outcomes in T-Cell Lymphoblastic Lymphoma. Cancer Res Treat (2021) 53(3):837–46. doi: 10.4143/crt.2020.123
36. Okuyucu K, Ozaydın S, Alagoz E, Ozgur G, Ince S, Oysul FG, et al. Prognosis Estimation Under the Light of Metabolic Tumor Parameters on Initial Fdg-Pet/Ct in Patients With Primary Extranodal Lymphoma. Radiol Oncol (2016) 50(4):360–9. doi: 10.1515/raon-2016-0045
37. Lawal IO, Nyakale NE, Harry LM, Modiselle MR, Ankrah AO, Msomi AP, et al. The Role of F-18 Fdg PET/CT in Evaluating the Impact of Hiv Infection on Tumor Burden and Therapy Outcome in Patients With Hodgkin Lymphoma. Eur J Nucl Med Mol Imaging (2017) 44(12):2025–33. doi: 10.1007/s00259-017-3766-5
38. Mayerhoefer ME, Staudenherz A, Kiesewetter B, Weber M, Simonitsch-Klupp I, Gibbs P, et al. Pre-Therapeutic Total Lesion Glycolysis on [(18)F]FDG-PET Enables Prognostication of 2-Year Progression-Free Survival in Malt Lymphoma Patients Treated With CD20-Antibody-Based Immunotherapy. Mol Imaging Biol (2019) 21(6):1192–9. doi: 10.1007/s11307-019-01329-2
Keywords: heterogeneity index, mantle cell lymphoma, PET/CT, progression-free survival, ROC
Citation: Liu F, Gu B, Li N, Pan H, Chen W, Qiao Y, Song S and Liu X (2022) Prognostic Value of Heterogeneity Index Derived from Baseline 18F-FDG PET/CT in Mantle Cell Lymphoma. Front. Oncol. 12:862473. doi: 10.3389/fonc.2022.862473
Received: 26 January 2022; Accepted: 23 March 2022;
Published: 14 April 2022.
Edited by:
Stefano Luminari, University of Modena and Reggio Emilia, ItalyReviewed by:
Stephane Chauvie, Azienda Sanitaria Ospedaliera S.Croce e Carle Cuneo, ItalyCopyright © 2022 Liu, Gu, Li, Pan, Chen, Qiao, Song and Liu. This is an open-access article distributed under the terms of the Creative Commons Attribution License (CC BY). The use, distribution or reproduction in other forums is permitted, provided the original author(s) and the copyright owner(s) are credited and that the original publication in this journal is cited, in accordance with accepted academic practice. No use, distribution or reproduction is permitted which does not comply with these terms.
*Correspondence: Xiaosheng Liu, bGl1Lm1pYUBxcS5jb20=
†These authors have contributed equally to this work
Disclaimer: All claims expressed in this article are solely those of the authors and do not necessarily represent those of their affiliated organizations, or those of the publisher, the editors and the reviewers. Any product that may be evaluated in this article or claim that may be made by its manufacturer is not guaranteed or endorsed by the publisher.
Research integrity at Frontiers
Learn more about the work of our research integrity team to safeguard the quality of each article we publish.