
94% of researchers rate our articles as excellent or good
Learn more about the work of our research integrity team to safeguard the quality of each article we publish.
Find out more
ORIGINAL RESEARCH article
Front. Oncol. , 17 March 2022
Sec. Neuro-Oncology and Neurosurgical Oncology
Volume 12 - 2022 | https://doi.org/10.3389/fonc.2022.861078
 Elena Tirrò1,2*†
 Michele Massimino1,3†
 Giuseppe Broggi4
 Chiara Romano1,3
 Simone Minasi5
 Francesca Gianno5
 Manila Antonelli5
 Gianmarco Motta1
 Francesco Certo6
 Roberto Altieri6
 Livia Manzella1,3
 Rosario Caltabiano4
 Giuseppe Maria Vincenzo Barbagallo6
 Francesca Romana Buttarelli5
 Gaetano Magro4
 Felice Giangaspero5,7
 Paolo Vigneri1,3
The management of patients with Central Nervous System (CNS) malignancies relies on the appropriate classification of these tumors. Recently, the World Health Organization (WHO) has published new criteria underlining the importance of an accurate molecular characterization of CNS malignancies, in order to integrate the information generated by histology. Next generation sequencing (NGS) allows single step sequencing of multiple genes, generating a comprehensive and specific mutational profile of the tumor tissue. We developed a custom NGS-based multi-gene panel (Glio-DNA panel) for the identification of the correct glioma oncotype and the detection of its essential molecular aberrations. Specifically, the Glio-DNA panel targets specific genetic and chromosomal alterations involving ATRX chromatin remodeler (ATRX), cyclin dependent kinase inhibitor 2A (CDKN2A), isocitrate dehydrogenase (NADP+) 1 (IDH1) and the telomerase reverse transcriptase (TERT) promoter while also recognizing the co-deletion of 1p/19q, loss of chromosome 10 and gain of chromosome 7. Furthermore, the Glio-DNA panel also evaluates the methylation level of the O-6-methylguanine-DNA methyltransferase (MGMT) gene promoter that predicts temozolomide efficacy. As knowledge of the mutational landscape of each glioma is mandatory to define a personalized therapeutic strategy, the Glio-DNA panel also identifies alterations involving “druggable” or “actionable” genes. To test the specificity of our panel, we used two reference mutated DNAs verifying that NGS allele frequency measurement was highly accurate and sensitive. Subsequently, we performed a comparative analysis between conventional techniques - such as immunohistochemistry or fluorescence in situ hybridization - and NGS on 60 diffuse glioma samples that had been previously characterized. The comparison between conventional testing and NGS showed high concordance, suggesting that the Glio-DNA panel may replace multiple time-consuming tests. Finally, the identification of alterations involving different actionable genes matches glioma patients with potential targeted therapies available through clinical trials. In conclusion, our analysis demonstrates NGS efficacy in simultaneously detecting different genetic alterations useful for the diagnosis, prognosis and treatment of adult patients with diffuse glioma.
Diffuse gliomas are the most frequent primary brain tumors in the adult population accounting for more than 70% of all central nervous system (CNS) malignancies (1). They represent a heterogeneous group of tumors displaying different morphologic, genetic and epigenetic aberrations and an extremely variable response to therapy (2). Although diffuse gliomas comprise <1% of all newly diagnosed cancers, they are associated with significant morbidity and mortality (3).
The World Health organization (WHO) classification of CNS tumors has undergone major changes in 2016 and, subsequently, in 2021 (CNS 5 WHO). According to CNS WHO, a diagnosis of diffuse astrocytic or oligodendroglial gliomas must be based on histology but also on different molecular markers (4, 5).
Adult diffuse gliomas were usually characterized and classified by three major genetic events: i] mutations in isocitrate dehydrogenase (NADP+) 1 (IDH1) or isocitrate dehydrogenase (NADP+) 2 (IDH2) genes, ii] detection of the 1p/19q chromosomal co-deletion and iii] nuclear retention or loss of the ATRX chromatin remodeler (ATRX) (6). On the basis of the 2021 updated classification, additional molecular biomarkers have become essential to categorize adult gliomas including: H3.3 Histone A (H3.3A) mutations for diffuse midline gliomas, telomerase reverse transcriptase (TERT) promoter mutations, epidermal growth factor receptor (EGFR) gene amplification and chromosome 7 gain combined with loss of chromosome 10 for glioblastoma (GBM), and homozygous deletions of both cyclin dependent kinase inhibitor 2A (CDKN2A) and cyclin dependent kinase inhibitor 2B (CDKN2B) loci for IDH-mutant astrocytoma (7). In addition, the detection of tumor protein p53 (TP53) mutations (linked to an inferior prognosis and lower response to chemotherapy) (8), or the assessment of O-6-methylguanine-DNA methyltransferase (MGMT) promoter methylation status (useful to guide the use of alkylating agents), represent further molecular biomarkers deserving of careful investigation in diffuse low or high grade gliomas (9).
A genomic landscape investigation of GBM samples carried out by The Cancer Genome Atlas (TCGA) consortium in over 500 tumor samples revealed that the aberrant activation of PI3K/AKT, TP53 or RB signaling pathways are correlated with treatment response or survival (10). It has also been reported that genetic alterations, such as loss or mutations in the phosphate and tensin homologue (PTEN) gene or overexpression of the platelet-derived growth factor receptor alpha (PDGFRA) gene, represent additional molecular biomarkers that may be correlated with tumor evolution and poor prognosis (11, 12). Finally, different receptor tyrosine kinases (RTKs) and their ligands represent promising therapeutic targets for the treatment of GBM because they are involved in disease invasiveness, angiogenesis and cancer cell survival (13, 14).
Since the diagnosis and treatment of malignant brain tumors represents one of the most challenging problems in clinical oncology, the use of novel techniques such as next generation sequencing (NGS) embodies a versatile solution for the simultaneous analysis of different genes associated with tumor development, progression, and resistance to therapy (15–18). Indeed, NGS interrogates multiple genes and target variants simultaneously, employing a small amount of tumor sample (19) and can identify single nucleotide variants (SNVs), short insertions or deletion mutations (indel) and large regions of loss of heterozygosis (LOH) (20).
Aim of this study was to investigate the efficacy of a custom NGS panel, called Glio-DNA panel, to guide diagnosis and molecular characterization of low and high-grade gliomas, through the simultaneous detection of the main mutations and copy number alterations (CNAs) occurring in these tumors. Furthermore, we investigated the clinical usefulness of this panel in the detection of alterations involving druggable and actionable genes, in order to define potential therapeutic approaches for glioma patients.
Glioma samples were collected from 60 patients surgically treated in the Neurosurgery Unit of the A.O.U. Policlinico “G. Rodolico - San Marco”, Catania - Italy, between January 2015 and July 2021. All tumors were classified following the 2021 CNS WHO guidelines (5). Our cohort included: 44 GBMs, 5 astrocytomas, 5 oligodendrogliomas, 4 gangliogliomas, 1 gliosarcoma (GS) and 1 diffuse midline glioma. Clinical and pathological data were retrospectively retrieved from institutional medical records. Formalin-fixed paraffin-embedded (FFPE) tumor tissues of archival glioma cases were obtained from the Pathology Department “G.F. Ingrassia” of the University of Catania - Italy. The study was approved by the local ethics committee (protocol code 166/2015/PO). All patients signed a specific informed consent before surgery in accordance with the Declaration of Helsinki. Data were anonymized before analysis to protect the patients’ identity.
For each specimen, 5-micron thick sections were cut from FFPE blocks using a standard microtome. Tumor content was determined with hematoxylin and eosin stained slides by a pathologist. DNA extraction and molecular analyses were performed at the Center for Experimental Oncology and Hematology of A.O.U. Policlinico “G. Rodolico - San Marco” in Catania, Italy. For genomic DNA extraction, the tumor area was macro-dissected from unstained slides with a sterile scalpel and processed using the QS Gene Read FFPE Treatment kit and QIAsymphony DNA Mini Kit (both from Qiagen) employing the automated QIAsymphony instrument according to the manufacturer’s instruction. DNA concentration was measured with the Qubit 3.0 fluorometer (ThermoFisher Scientific), using the dsDNA HS Assay kit (ThermoFisher Scientific). For the MGMT promoter methylation analysis, bisulfite modification was performed on 100 ng of genomic DNA using the EpiTech Bisulfite kit (Qiagen) according to the manufacturer’s instructions. Single-stranded bisulfite converted DNA was quantified using the Qubit ssDNA Assay kit (ThermoFisher Scientific) on a Qubit 3.0 fluorometer.
Libraries were prepared using a custom primer panel designed using the Ion AmpliSeq Designer tool (https://www.ampliseq.com/login/login.action). The panel encompasses 2361 amplicons in 3 primer pools covering the coding DNA sequencing (CDS) of 65 genes associated with the diagnosis and potential treatment response of glioma patients (Supplementary Table 1). In addition, 70 primer pairs for the analysis of specific single nucleotide polymorphisms (SNPs) were added in order to detect the loss of heterozygosity (LOH) of chromosomes 1p, 19q, 7 and 10, as previously reported (21). DNA libraries were generated with the Ion AmpliSeq library kit plus (ThermoFisher Scientific) using 30 nanograms of genomic DNA (10 nanograms per primer pool). Libraries were barcoded employing the Ion Xpress barcode adapter kit (ThermoFisher Scientific).
The TERT promoter and MGMT promoter libraries were prepared using the Ion Plus Fragment Library kit (ThermoFisher Scientific) according to the manufacturer’s instructions containing specific details about library preparation without fragmentation. Specifically, for the amplification of the TERT promoter, 40 ng of genomic DNA were amplified with the Platinum PCR SuperMix High Fidelity (ThermoFisher Scientific) using the following forward 5’-TTCCCACGTGCGCAGCAG-3’ and reverse 5’-GCTCCCAGTGGATTCGCG-3’ primers. For the amplification of the MGMT promoter, 70 ng of bisulfite treated genomic DNA were used, employing the Phusion U Hot Start PCR master mix (ThermoFisher Scientific) and the following forward 5’-TTTCGGATATGTTGGGATAG-3’ and reverse 5’-GATTTGGTGAGTGTTTGGGT-3’converted primers.
All libraries were then quantified by qPCR with the Ion Library TaqMan Quantitation kit (ThermoFisher Scientific) employing the ABI 7500 Real-Time PCR System (Applied Biosystem) and diluted to equimolar amounts before pooling. Manual template preparation and enrichment were performed employing the Ion PGM HiQ OT2 kit on the Ion OneTouch 2 system and the Ion One Touch ES instrument (all from ThermoFisher Scientific). Enriched libraries were then loaded on the Ion 318 v2 BC chip and massive parallel sequencing was carried out using the Ion PGM HiQ Sequencing kit on the Ion Torrent Personal Genome Machine (Ion PGM) platform according to the manufacture’s instruction (all from Thermo Fisher Scientific).
Sequencing raw data were aligned to the hg19 (GRCh37) reference genome. The Ion PGM Torrent Suite v.5.8.0 (ThermoFisher Scientific) was employed to perform initial quality control including chip loading density, median read length and number of mapped reads. Ion Reporter v5.12.0 (ThermoFisher Scientific) was used for SNV annotation. Variants were filtered considering a cut off of 3% for variant allele frequency (VAF), read depth >100, a Phred quality score >40 and a p-value <0.0001 in order to exclude false positive variants. Variants were subsequently annotated against the Cancer Mutation Census (CMC) version 94 database (22) and only mutations categorized as tier 1, 2, and 3 were considered pathogenic.
To identify somatic copy number alterations (CNAs), a reference baseline consisting of ten male subjects not displaying CNAs was created on the Ion Reporter software. The call of a CNA was made for samples showing a MAPD (Median of the Absolute values of all Pairwise Differences) <0.45, a metric that evaluates whether panel data can be used for CNA analysis and filtered to exclude regions with confidence lower that 30.
To evaluate the methylation status of the MGMT promoter, the detection call rate for four CpG islands (5’-CGACGCCCGCAGGTCCTCG-3’, underlined bases) was determined using the Torrent Suite Variant Caller plugin. An average methylation percentage below 10% was considered unmethylated, between 10 and 50% was scored as moderately methylated and above 50% highly methylated. Bisulfite conversion efficiency was evaluated by examining cytosine to thymine conversion for cytosines not in CpG motifs. Variant calling to assess TERT promoter mutations was also performed using the above indicated plugin.
The initial performance of the Glio-DNA panel was evaluated using two reference standard DNA samples purchased from Horizon Discovery. OncoSpan gDNA Reference Standard (catalog ID HD827) and OncoSpan FFPE Reference Standard (catalog ID HD832) were used as positive controls for variant calling. OncoSpan gDNA is a reference standard harboring 386 variants in 152 genes while OncoSpan FFPE contains over 380 variants across 152 key cancer genes.
Hot-spot mutation in IDH1, the TERT and MGMT promoters were analyzed by direct Sanger sequencing after PCR-based amplification of the specific locus. Fifty nanograms of genomic DNA were amplified with the Platinum PCR SuperMix High Fidelity following the manufacturer’s instructions. The hot-spot mutation in IDH1 was detected with the following forward 5’-AAGTTGAAACAAATGTGGAAATCACCAAA-3’ and reverse 5’-CCAACATGACTTACTTGATCCCCATA-3’ primers. PCR-based amplification of TERT and MGMT promoters were performed using the previously described primer pairs. The obtained PCR products were then resolved on agarose gel electrophoresis, purified and sequenced.
To evaluate the percentage of the MGMT promoter methylation, the ratio of cytosine to thymine at each specific CpG site was determined. The CpG sites were classified as ‘methylated’ if the peak in the cytosine/thymine ratio was >20%, or were scored as unmethylated if the ratio was <20%. An average methylation percentage was then calculated.
Each tumor underwent immunohistochemistry, as previously described (23, 24), using the standard streptavidin-biotin-labeling system. Briefly, deparaffinized tissue sections were incubated with antibodies against p53 (mouse monoclonal, clone DO-7, Santa Cruz Biotechnology, Dallas, TX, USA), ATRX (mouse monoclonal, clone AX1; Dianova), IDH1 R132H (mouse monoclonal, clone H09, Dianova) and H3.3 K27M (rabbit monoclonal, clone RM-192, ThermoFisher Scientific). Immunohistochemical staining for p53, ATRX and H3.3 K27M were considered as positive if brown chromogen was present within the cell nuclei, while cytoplasmic reactivity for IDH1 R132H was interpreted as positive.
Five-micron sections were cut from FFPE samples for fluorescence in situ hybridization (FISH) analysis with Leica Biosystems Tissue Digestion Kit (Leica Biosystems). Slides were deparaffinized in an oven at 70°C for 60 minutes and exposed to xylene for 10 minutes, dehydrated in ethanol and treated with pretreatment solution (1 mol/L sodium thiocyanate) for 30 minutes at 80°C; samples were then digested in pepsin solution (0,65% in protease buffer) for 30 minutes, washed twice in SSC1x buffer, and air-dried. The mix for each probe (5 to 15 μl) was added to each slide according to the manufacturer’s instructions (Abbott Molecular). The analysis of 1p/19q co-deletion status was performed using the Vysis LSI 1p36/1q25 and 19q13/19p13 Dual-Color Probe kit (04N60-020). Chromosome 10 loss was analyzed using the Vysis LSI PTEN (10q23)/CEP 10 FISH Probe Kit (04N62-020). The determination of chromosome 7 gain and EGFR amplification were both analyzed with LSI EGFR (7p11)/CEP 7 probe set (01N35-020). CDKN2A homozygous loss was assessed using the Vysis LSI CDKN2A (9p21)/CEP 9 Probe kit (04N61-020).
Target DNA and probes were co-denatured at 80°C for 5 minutes and incubated at 37°C overnight in a humidified hybridization chamber (ThermoBrite TopBrite). Post-hybridization washes were performed in wash solution at 74°C for 2 minutes. Sections were finally counterstained with DAPI (4′, 6-diamidino-2-phenylindole), cover slipped, and stored in the dark prior to microscope analysis.
FISH sections were examined with an Axio Imager M1 microscope (Carl Zeiss) equipped with Z-stack and appropriate filters by two independent investigators (SM, FRB). The most representative areas of each tumor were previously selected with H&E staining by expert pathologists. Signals were counted in at least 200 neoplastic nuclei for each sample, and images were captured using a Metasystem station (Zeiss MetaSystems) with sequential DAPI, FITC, and rhodamine filter settings; the resulting images were automatically reconstituted with blue, green, and orange colors by the software. For all analyzed probe kits, orange (O) and green (G) signals were enumerated under the fluorescence microscope and then re-counted in the acquired images. Ratio was calculated by dividing the number of LSI orange signals by the number of green reference signals, according to published methods. Samples were considered positive for 1p/19q co-deletion loss when ≥30% of neoplastic nuclei exhibited 1O/2G signals for both 1p36/1q25 and 19q13/19p13, considering a ratio ≤0.70 as allelic loss (25, 26).
Regarding EGFR amplification, a signal ratio between 1-2 was considered as gain, while a ratio >2 (5O/2G) was considered as amplification; in particular, specimens were considered amplified for EGFR when more than 10% of tumor cells exhibited either a ratio >2 or innumerable clusters of orange LSI signals (27). For whole-chromosome 7 gain and whole-chromosome 10, samples were considered positive when ≥30% of neoplastic cells showed 3O/3G signals (gain of chromosome 7) and 1O/1G signals (loss of chromosome 10), respectively. However, the limitation of FISH analysis for entire chromosome alterations should be considered.
Finally, samples were evaluated as positive for CDKN2A homozygous deletion when ≥20% of tumor cells exhibited the absence of both orange signals in the presence of at least 1 reference green signal (0O/1-2G) (27, 28).
Simple linear regression analysis was used to analyze the correlation between expected and measured mutation allele frequencies of the reference standard. Statistical analysis was carried out using the GraphPad Prism v 5.0a software. Cohen’s κ was calculated to assess the consistency of immunohistochemistry staining, Sanger sequencing or FISH versus NGS. Cohen’s κ <0.4 was considered weak, ≥0.4 but <0.8 was considered moderate and ≥0.8 was considered strong. Statistical analysis was performed with the GraphPadQuickCalc software (https://www.graphpad.com/quickcalcs/index.cfm). Sensitivity was calculated according to the formula [true positive/(true positive + false negative)] × 100, while the specificity was determined employing the formula [true negative/(true negative + false positive)] × 100.
To assess the accuracy of the Glio-DNA panel, we employed a cell-line derived DNA reference harboring mutations in 26 of the 66 genes included in our panel. Moreover, in order to reproduce the extraction method employed for our glioma samples, we also employed an FFPE DNA reference harboring the same variants. Both DNA references were sequenced twice to compare variant detection and their VAF. Overall, we detected 53 alterations with a VAF >2% out of the 55 different gene alterations (Supplementary Tables 2, 3). As expected, two mutations in the EGFR gene went undetected as their allele frequency (AF) was below our pre-established limit of detection. We also evaluated the correlation between the expected and measured AF by regression analysis. The slope of the regression line for genomic DNA was 0.9443 with an r2 of 0.96479 (Figure 1A), while FFPE-extracted DNA exhibited a regression line of 0.97941 with an r2 of 0.9824 (Figure 1B). These results indicate that AF measurements with the Glio-DNA panel were highly accurate with a panel sensitivity of 96.1%.
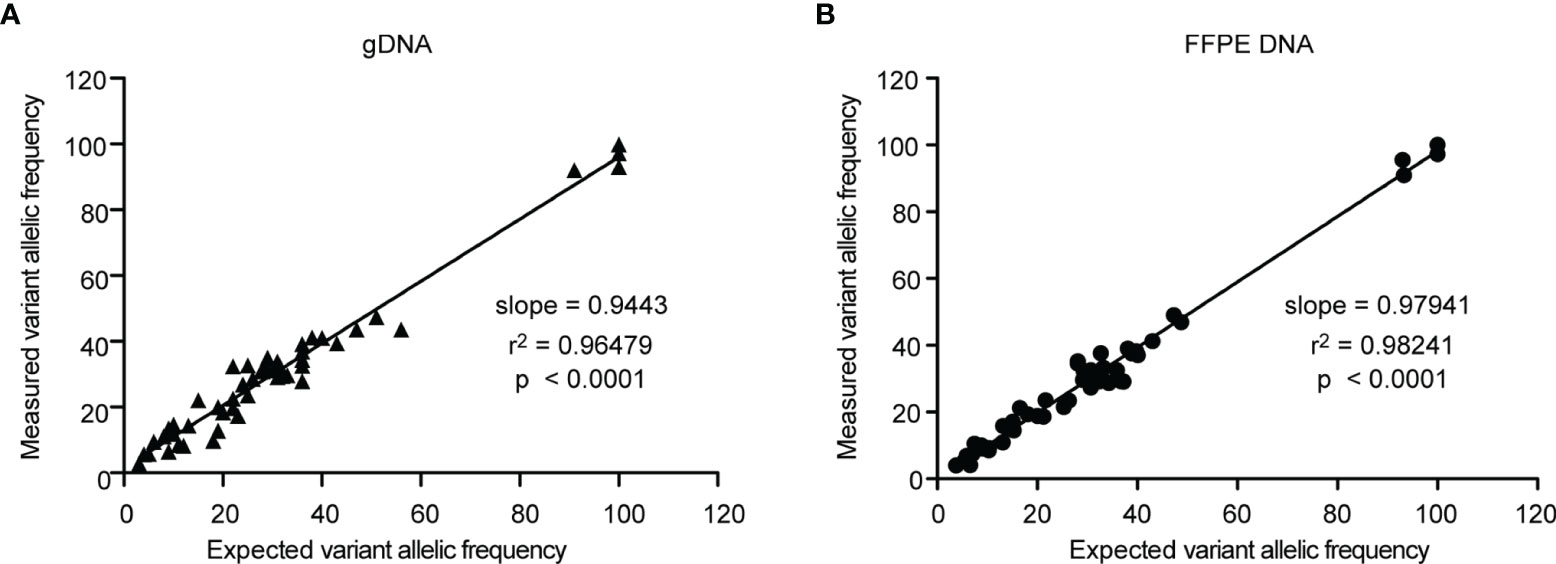
Figure 1 Linear regression analysis of the expected allele frequencies versus measured allele frequencies employing the Glio-DNA panel. Correlation between expected and measured variant allele frequencies (expressed as percentage) evaluated by regression analysis for genomic (left panel) and FFPE (right panel) standard DNA using the Glio-DNA panel.
The use of different diagnostic assays as part of routine clinical testing for the 60 glioma specimens provided us an opportunity to compare NGS performance with those of more conventional methodologies such as immunohistochemistry (IHC), Sanger sequencing and FISH. The concordance data between conventional testing and NGS are reported in Table 1. In this analysis we included five gliomas WHO grade 2 (namely three oligodendrogliomas, one astrocytoma and one ganglioglioma) and 55 WHO grade 3 or 4 gliomas. The latter included: two oligodendrogliomas, four astrocytomas, three gangliogliomas, one GS, one diffuse midline glioma and forty-four GBMs.

Table 1 Concordance between conventional testing and NGS.
According to the CNS 5 WHO classification and cIMPACT-NOW recommendations, identification of multiple molecular biomarkers is pivotal for the correct categorization of diffuse gliomas, especially in the adult population (29, 30).
When we compared the NGS results obtained for IDH1 with IDH1-R132H IHC conventional testing we found that IHC analysis was concordant with NGS results (Figures 2A, C), with the exception of one case (case 49) (Table 1 and Supplementary Table 4). Interestingly, this astrocytoma was negative for IDH1-R132H expression by IHC (Figure 2B) analysis but NGS showed the non-canonical variant IDH1-R132S (Figure 2D) usually associated with a more favorable clinical outcome (31). Sanger sequencing was used to confirm NGS results for investigated variants (Figures 2E, F).
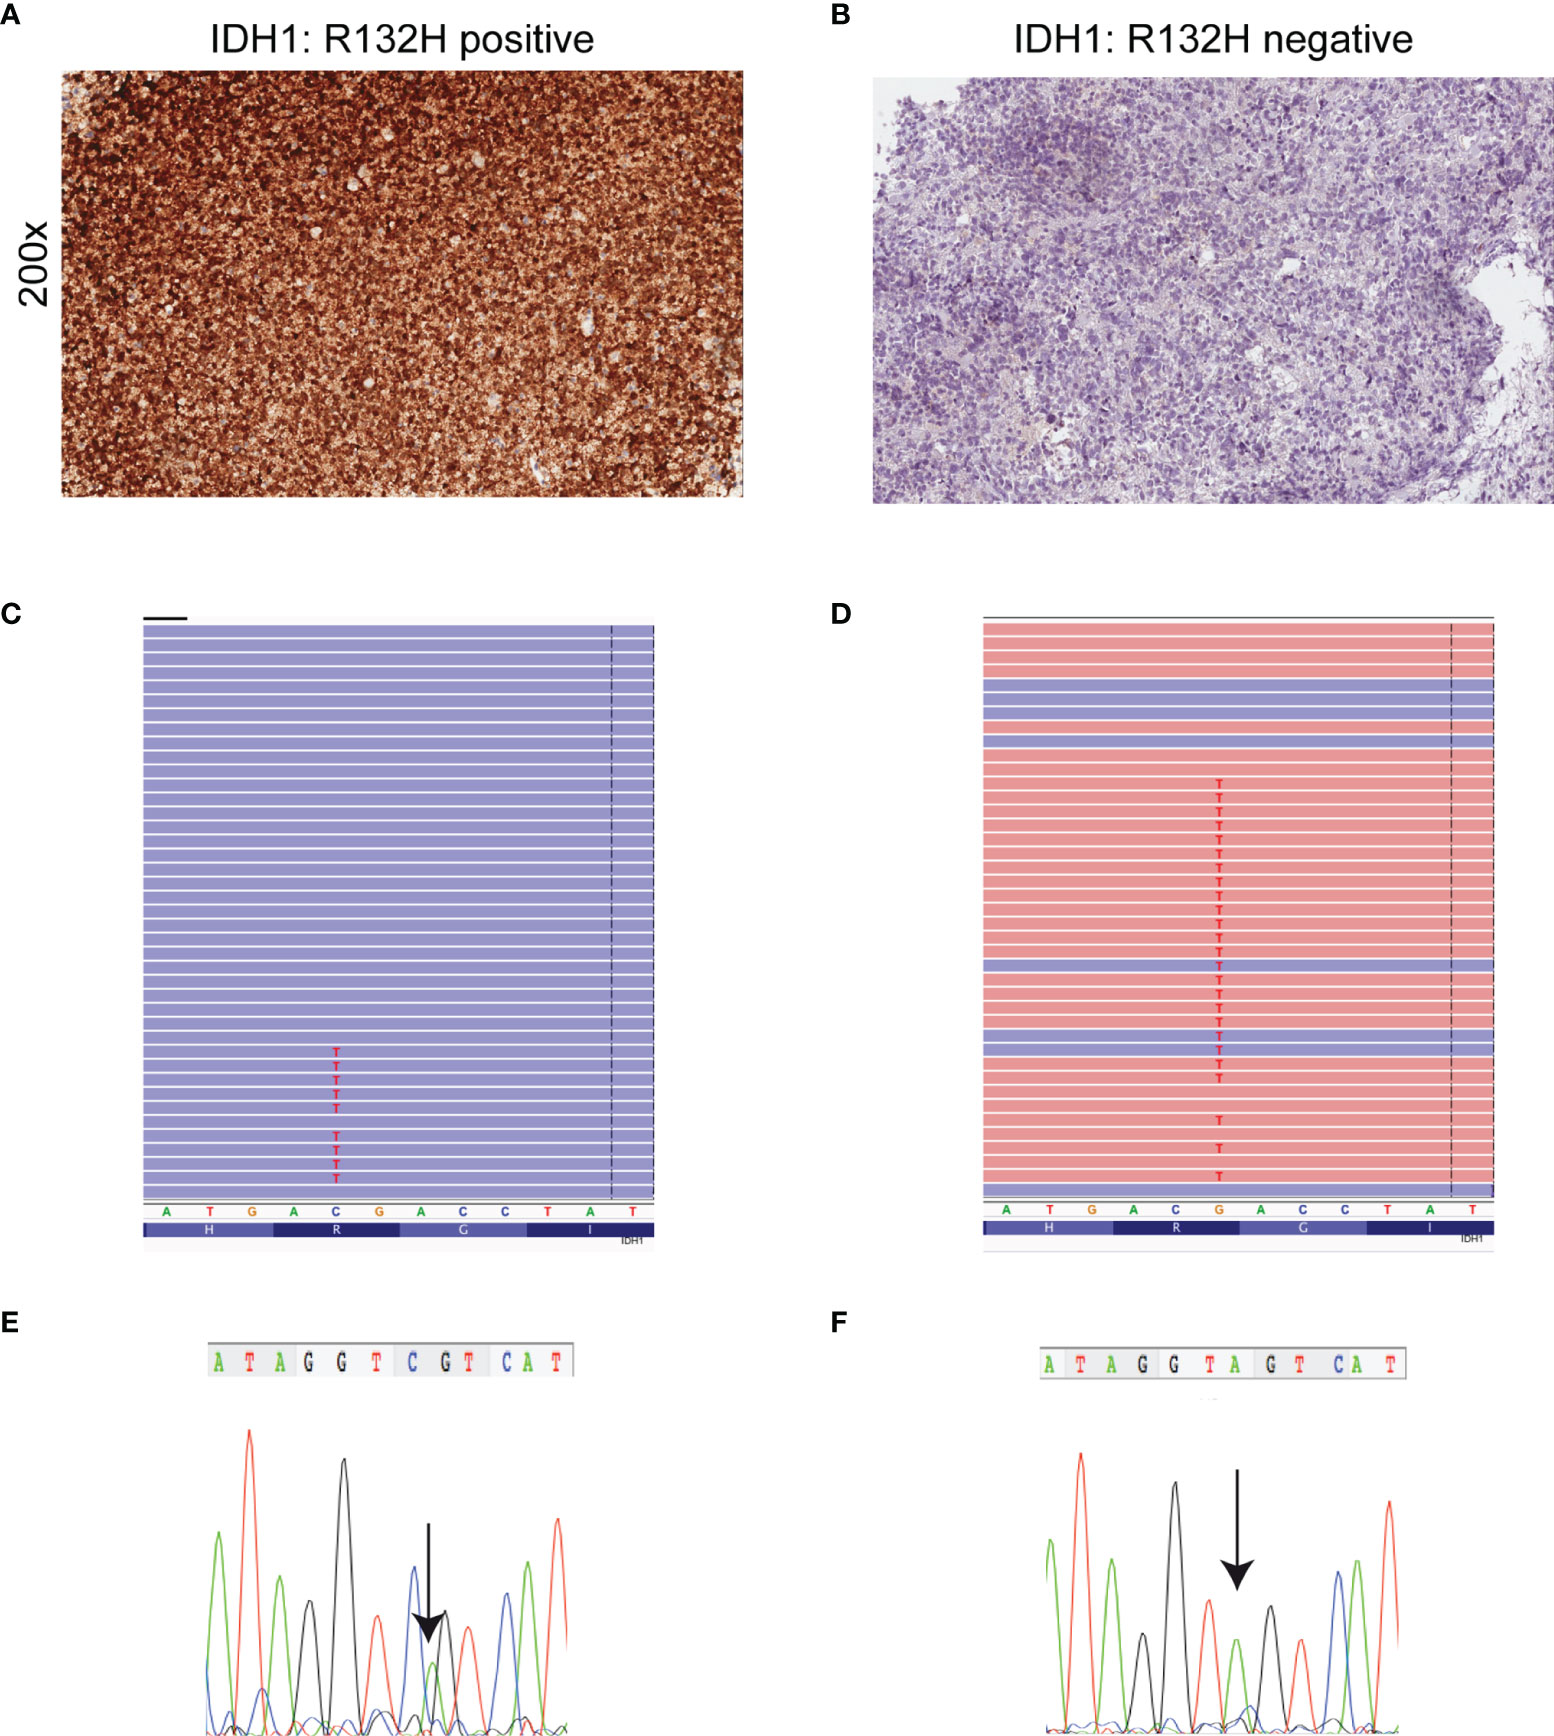
Figure 2 Detection of mutant IDH1 by immunohistochemistry, NGS and Sanger sequencing. (A) Astrocytoma cells are diffusely and strongly stained with anti-IDH1 (R132H) antibody (immunoperoxidase; original magnification 200x). (B) Corresponding IDH1 c.395G>A (p. R132H) mutation detected by NGS. Results were viewed in the Integrative Genomics Viewer (IGV). (C) The chromatogram showing representative sequencing results of IDH1 c.395G>A (p. R132H). (D) Absence of IDH1 (R132H) immunoreactivity in a IDH1- (R132S)-mutant astrocytoma. (E) IDH1 c.394C>A (p. R132S) mutation detected by NGS. Results were viewed in the IGV. (F) The chromatogram showing the representative sequencing results of IDH1 c.394C>A. Note that IDH1 is a negative-sense gene with respect to the genomic reference sequence. Thus, any nucleotide change is displayed as reverse complement. The arrow symbols on chromatogram indicate the place of mutation.
The lack of nuclear staining by IHC usually corresponds to ATRX loss of function alterations, mostly missense or truncating mutations (32). IHC- and NGS-based testing for ATRX loss was concordant in 59 out of 60 glioma cases. Three cases harboring an ATRX truncating mutation detected by NGS (case 37 - p.Lys698Ter, case 49 - p.Lys329IlefsTer3 and case 54 - p.Ala1988ValfsTer27) showed negative staining by IHC, indicating loss of ATRX nuclear expression (Figure 3). However, a discrepancy was observed in the analysis of case 33 as IHC indicated loss of nuclear ATRX while NGS failed to detect pathogenic ATRX mutations.
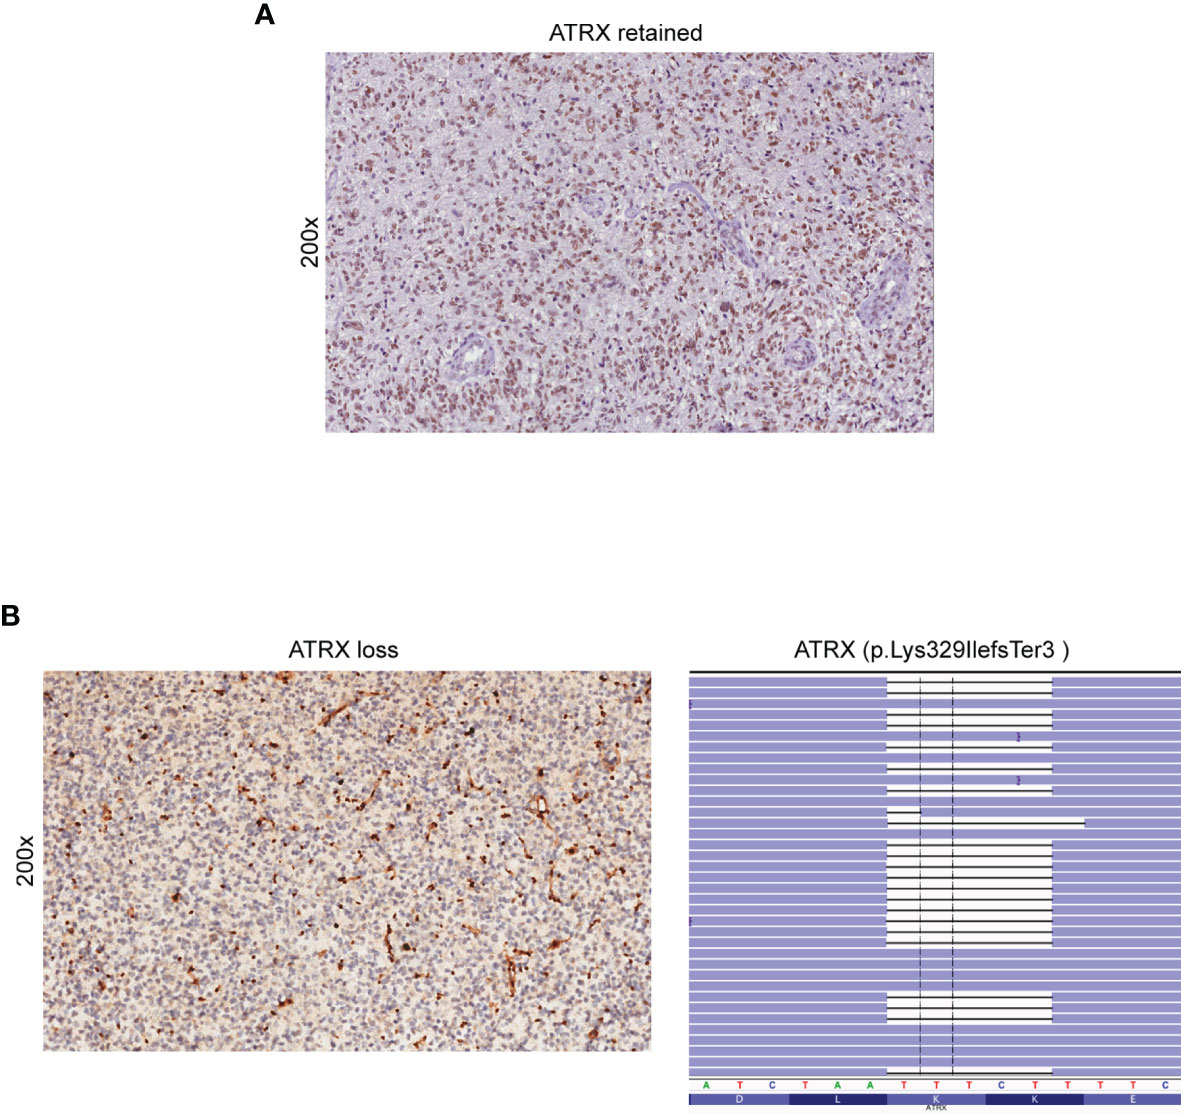
Figure 3 Detection of ATRX loss by immunohistochemistry and NGS. (A) Retained nuclear expression of ATRX in neoplastic glioma cells (immunoperoxidase; original magnification 200x). (B) Loss of nuclear expression of ATRX in a sample of astrocytoma (case 49) (left panel). Note the retained immunoreactivity in endothelial cells and non-neoplastic entrapped glial cells (immunoperoxidase; original magnification 200x). NGS demonstrated the presence of the ATRX p. Lys329IlefsTer3 truncated mutation (case 49) (right panel). Results were viewed in the IGV.
To detect the 1p/19q co-deletion in our glioma samples, we employed SNP-based loss of heterozygosis (LOH) analysis by NGS, as previously reported (21, 33). During the design of the Glio-DNA panel, we included 45 highly polymorphic SNPs located on the short arm of chromosome 1 (1p) and on the long arm of chromosome 19 (19q) and evaluated the allelic imbalance in our patient cohort. In all five oligodendroglioma cases (cases 19, 27, 32, 38 and 41), NGS analysis provided the same 1p/19q results obtained by FISH (Figure 4 and Table 1). Furthermore, these cases harbored an activating IDH1 mutation supporting the histopathological diagnosis of oligodendroglioma. Surprisingly, NGS also allowed the identification of a rare case of GBM (case 2) displaying the 1p/19q co-deletion (Supplementary Table 4). Lastly, SNP-based LOH by NGS identified 8 cases (13.3%) of GBM (cases 7, 12, 13, 22, 24, 29, 31 and 34) with an allelic imbalance involving only chromosome 19q while no case showing an allelic loss of chromosome 1p was detected.
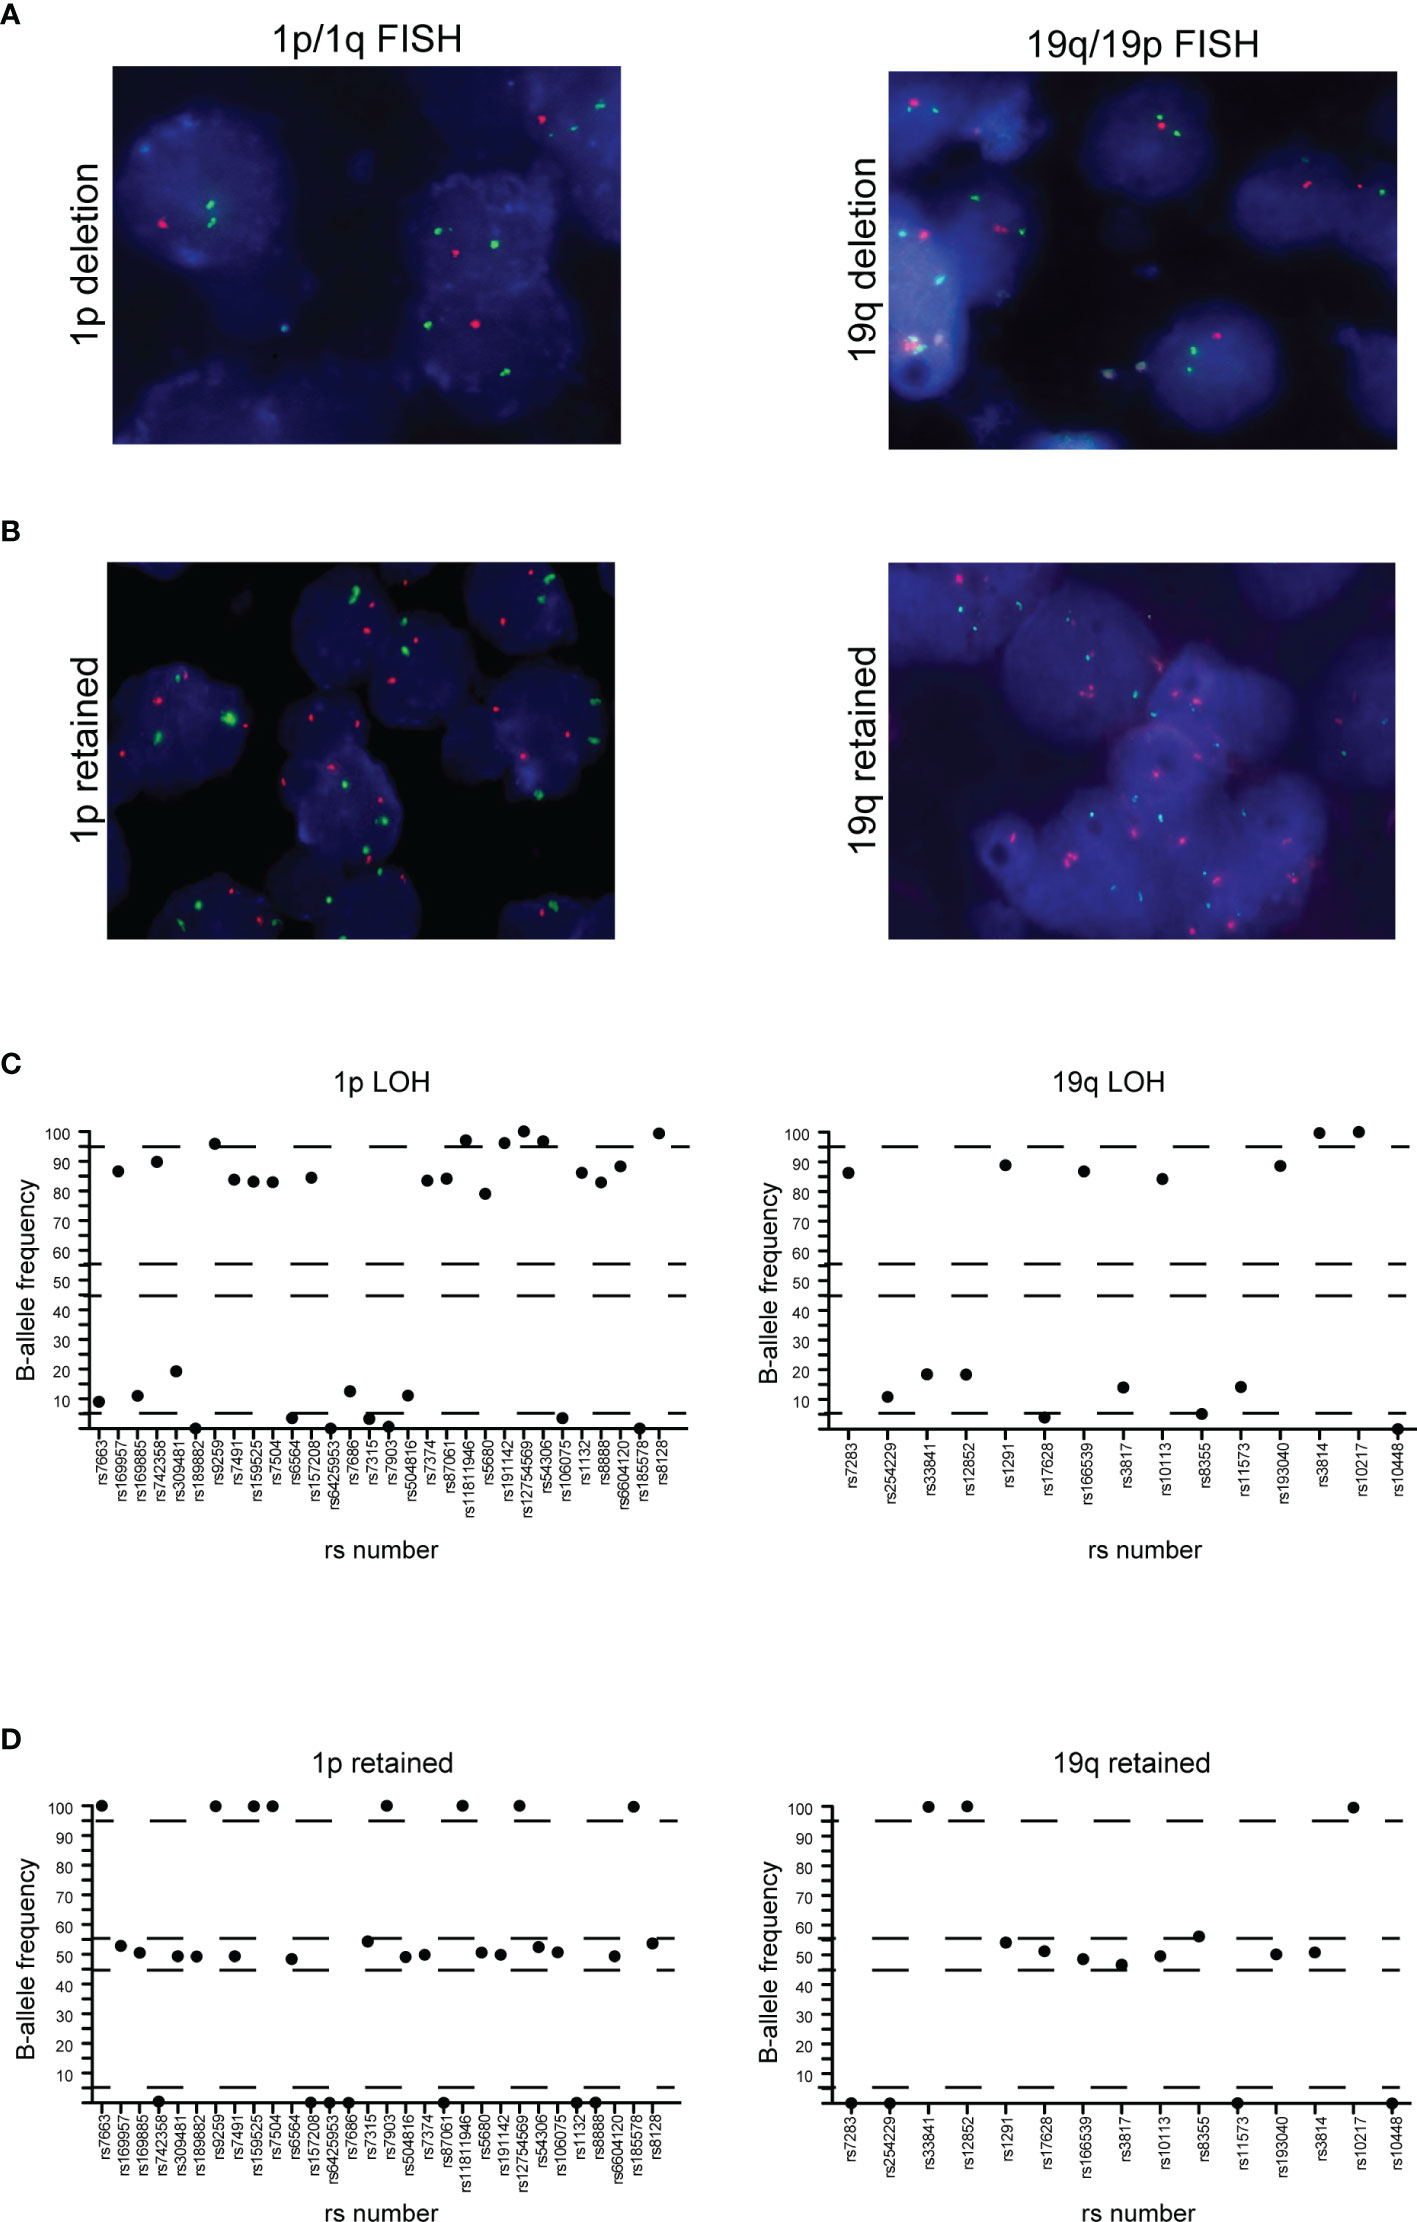
Figure 4 Correlation between FISH and NGS detection of 1p/19q co-deletion. (A) 1p (left panel) and 19q (right panel) co-deletion in a case of oligodendroglioma detected by FISH. (B) 1p (left panel) and 19q (right panel) negative control. In both cases, red dots represent 1p36.3 and 19q13.3 signals while green dots represent 1q25.2 and 19p13.2 signals. (C) Distribution of B-allele frequencies based on loss of heterozygosis (LOH) of single nucleotide polymorphisms (SNPs) in NGS of an oligodendroglioma sample with typical 1p (left panel) and 19q (right panel) co-deletion. (D) GBM without LOH and genomic alterations of chromosome 1p (left panel) and 19q (right panel). The x axis shows the investigated SNPs (rs number was reported) while the y axis shows the percentage variant (B-allele frequency). Dashed lines indicate the arbitrarily set homozygosis range of 0-5% and 95-100%. The range of heterozygosis is defined as being between 45% and 60% of the B-allele frequency. LOH was called when the B-allele frequency of a SNP was outside the established range for homo- and heterozygosis.
We analyzed CDKN2A/CDKN2B by NGS in 45 of 60 specimens included in our cohort. We found that 5 patients (11.6% of total tested samples) showed a biallelic loss of CDKN2A/CDKN2B (homozygous deletion) while 5 (11.6%) displayed hemizygous deletions of these two genes. The presence of CDKN2A/CDKN2B biallelic and monoallelic loss was tested employing FISH in 18 tumor samples with no discrepancies observed when compared to NGS (Supplementary Figure 1).
Since the TERT promoter region is difficult to amplify because of its high guanine-cytosine (GC) content (>80%), we designed primers to separately amplify the region of interest and subsequently added the obtained amplicon to the Glio-DNA panel. NGS analysis detected TERT promoter mutations in 33 out of 45 investigated gliomas (72.7%), 12 of which harbored the hot-spot C250T (c.1-146C>T) mutation and 21 carrying the C228T (c.1-124C>T) variant. The NGS results were concordant with those acquired by Sanger sequencing as confirmed by specificity and sensitivity values (Table 1).
The Glio-DNA panel was designed to identify SNV, but also to detect copy number alterations (CNAs) for all genes included in the panel. EGFR CNAs were evaluated in 39 of 60 glioma samples with a MAPD score <0.45. We found concordance in 38 of 39 cases (97% - 4 amplified and 34 negative cases) with informative NGS results (Table 1 and Figure 5A).
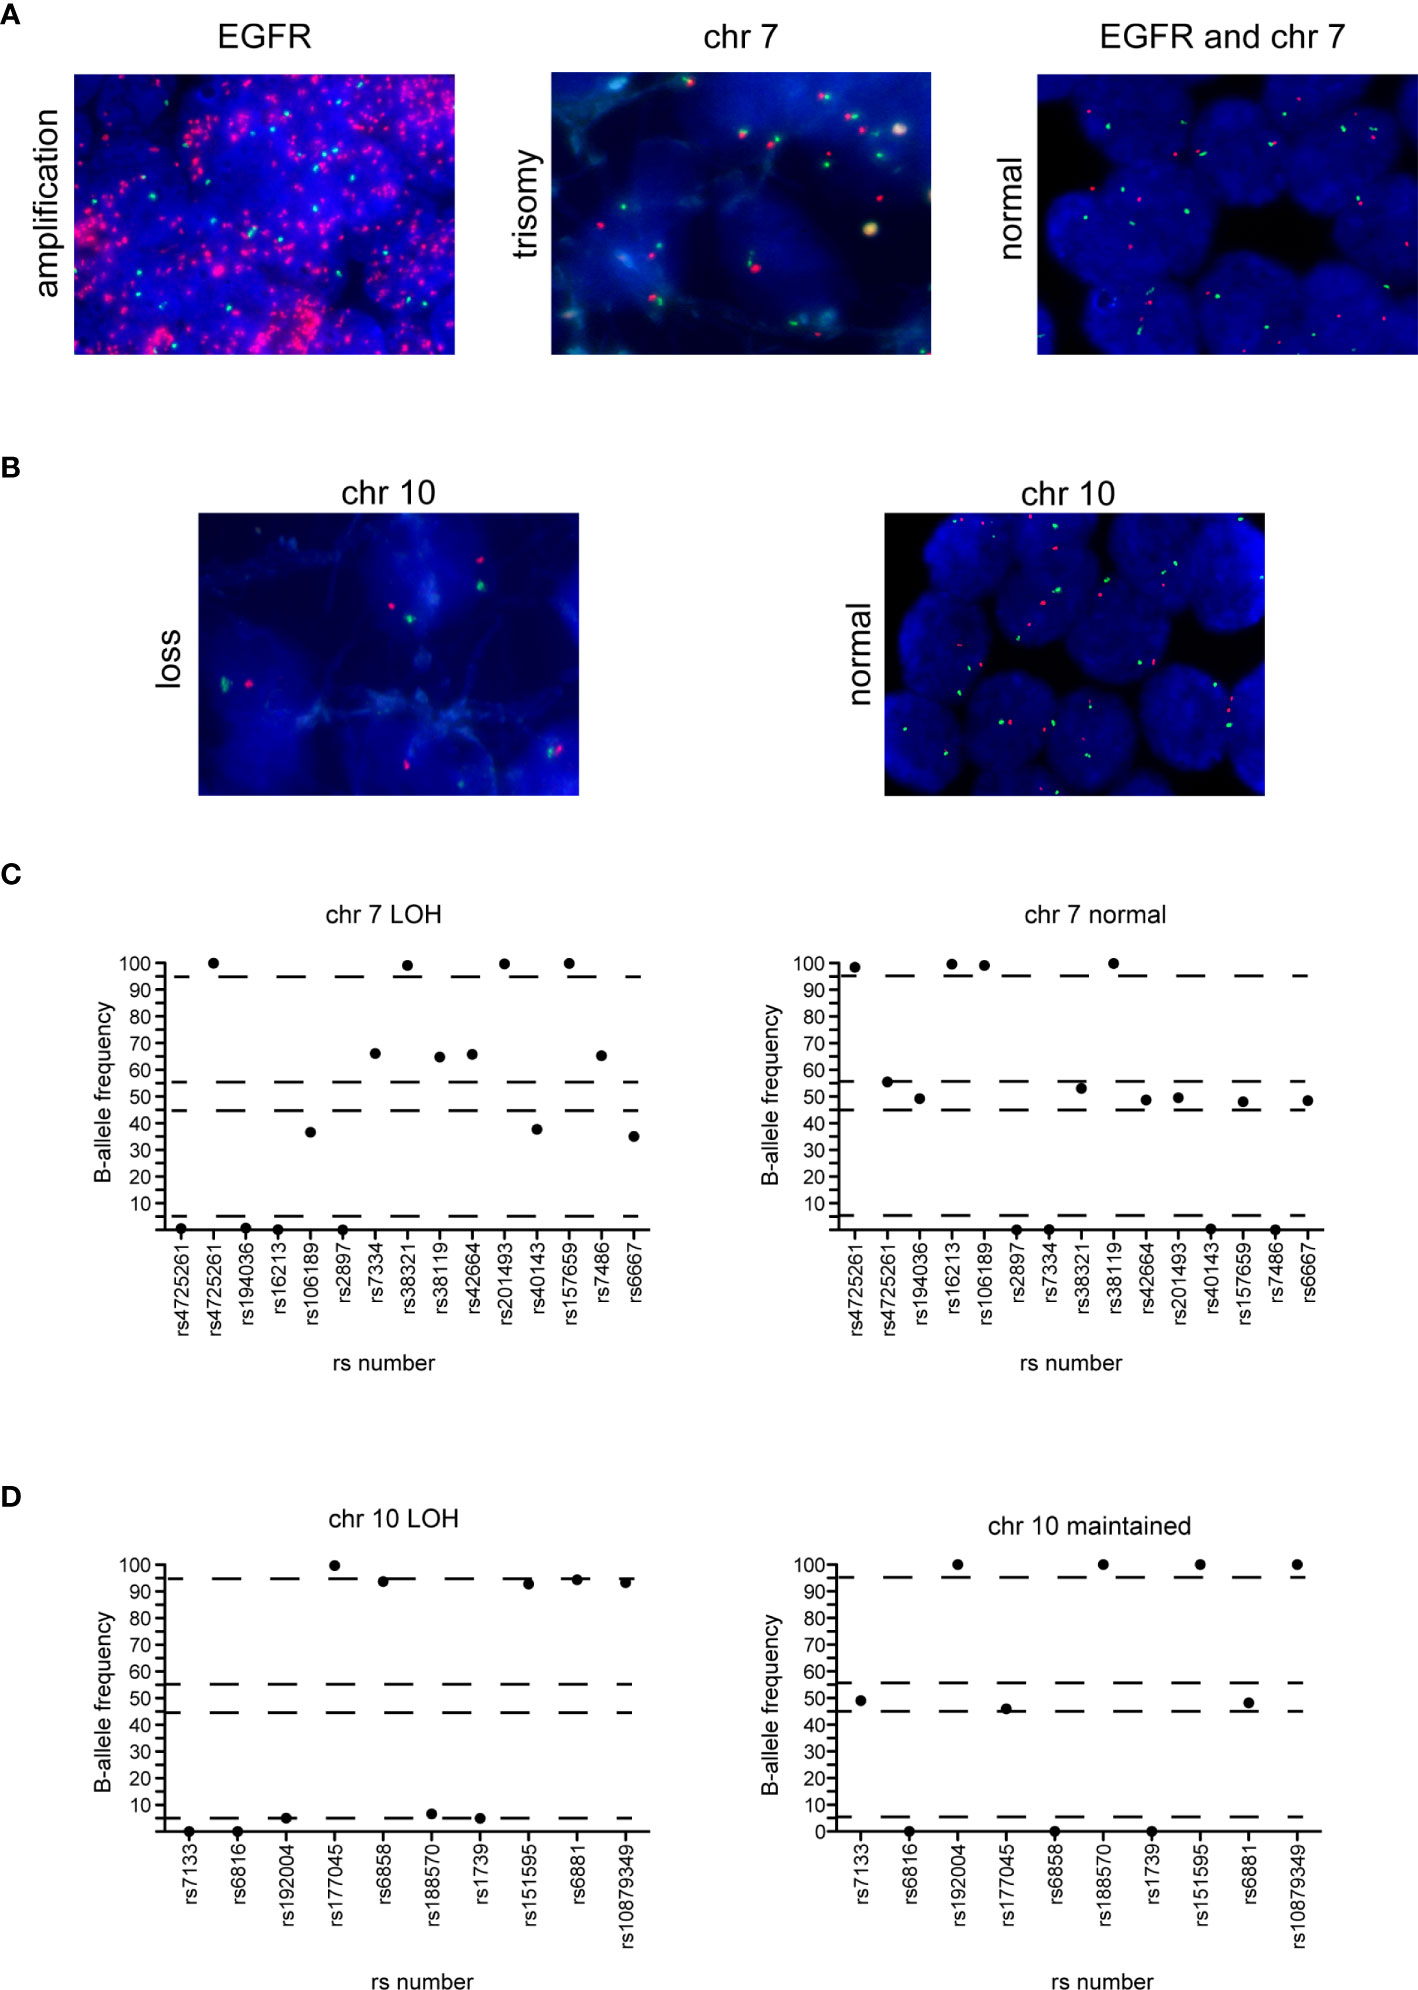
Figure 5 Correlation between FISH and NGS detection of EGFR amplification, chromosome 7 gain and chromosome 10 loss. (A) EGFR amplification (left panel) and trisomy of chromosome 7 (middle panel) in two cases of GBM and normal EGFR expression and chromosome 7 (right panel) in a case of astrocytoma detected by FISH. Red dots represent the EGFR gene while green dots represent the centromere of chromosome 7. (B) Chromosome 10 loss (left panel) and negative control (right panel) in two glioma samples. Red dots represent 10q23 signal while green dots represent the CEP 10 signal. (C) Distribution of B-allele frequencies based on LOH of SNPs of a GBM sample with typical chromosome 7 gain (left panel) and an astrocytoma sample without chromosome 7 gain (right panel). (D) Distribution of B-allele frequencies based on LOH of a GBM sample showing chromosome 10 loss (left panel) and a sample without LOH of chromosome 10 (right panel). The x axis shows the investigated SNPs (rs number was reported) and the y axis shows the percentage variant (B-allele frequency). Dashed lines indicate the arbitrarily set homozygosis range of 0 - 5% and 95 - 100%. The range of heterozygosis is defined as being between 45% and 60% of B-allele frequency. LOH was called as indicated in the legend of Figure 4.
To detect the large genomic aberrations involving chromosome 7 (harboring BRAF, CDK6, EGFR and MET) and 10 (that includes FGFR2, MGMT and PTEN), during the design of the Glio-DNA panel we included 25 highly polymorphic SNPs spanning chromosome 7 and 10 (34, 35). We found that FISH- and NGS-based testing for chromosome 7 gain was concordant in all analyzed cases with informative FISH results (n=33) (Table 1 and Figures 5A, C). In detail, we found that 16 out of 22 GBM cases (72.7%) showed an imbalance/gain of chromosome 7 as well as two astrocytomas (cases 30 and 49) and one ganglioglioma (case 48). Moreover, no discrepancies were observed between FISH and NGS among the 33 gliomas analyzed for chromosome 10 loss (Figures 5B, D). We also detected a high concordance between the co-presence of chromosome 7 gain and 10 loss (90.9%, 30 out 33 samples).
In our cohort, NGS sequencing detected the V600E (c.1799T>A) substitution in a case of ganglioglioma grade 1 (case 39). Since the detected VAF was very low (2.5%) this would explain why IHC analysis failed to identify this mutation.
A single case of diffuse midline glioma (case 37) was included in our cohort. Diffuse midline gliomas are located in the midline brain structures and are characterized by the presence of a lysine-to-methionine mutation at amino acid 27 of histone H3.3 encoded by the H3-3A gene (36). In this case we found a perfect concordance between IHC- and NGS-based testing as both identified H3-3A p.K27M (Supplementary Figure 2A).
We detected TP53 missense mutations resulting in TP53 protein overexpression in 15 cases, and a non-sense TP53 mutation resulting in lack of TP53 immunostaining in one sample (case 42). Of note, in two cases (31 and 57), TP53 immunostaining suggested the presence of a mutant TP53, while NGS analysis identified wild-type TP53. On the contrary, in three specimens (cases 42, 48 and 54) NGS analysis detected the presence of pathogenic TP53 mutations (p.Trp146Ter, p.Arg273His and p.Arg267Trp, respectively) while IHC did not show TP53 immunostaining. Although in five cases there was a discordance between NGS and IHC, the sensitivity and specificity for each assay was always >80% (Table 1 and Supplementary Figures 2B, C).
Although MGMT promoter methylation has limited diagnostic value, it is of great importance to guide treatment decisions on the use of chemotherapy with alkylating agents for patients with IDH1-wild-type gliomas and GBMs (37). Different assays can be employed to investigate the methylation status of the MGMT promoter, such as pyrosequencing, methylation-specific PCR, methylation arrays or Sanger sequencing (38). We tested the possibility to employ NGS to measure methylation levels in four cytosine-phosphate-guanine (CpG) islands located in exon 1 of the MGMT gene (chr10: 131,265,519 to 131,265,537; GRCh37-hg19). Libraries from a single amplicon pool were obtained and sequenced for 57 out of 60 glioma samples. We identified 9 samples (15.8%) scored as unmethylated, 14 samples (24.6%) expressing moderate methylation levels and 35 samples (61.4%) with high methylation (Supplementary Table 4). When we performed a comparative analysis between NGS and Sanger sequencing using 19 glioma specimens, we found no discrepancies between the two methods.
The Glio-DNA panel was designed to gather maximum information from a single molecular investigation. To this end, our custom panel includes several druggable genetic alterations linked to tumorigenesis and disease progression. Among clinically actionable genes, we focused on receptor tyrosine kinases (RTKs) (EGFR, KIT, MET and PDGFRA), RTK downstream signaling pathways (BRAF, PIK3CA, PIK3R1, RAS) and genes involved in cell cycle regulation (CDK4, CDK6, MDM4 and RB1).
We identified EGFR mutations (SNVs or CNAs) in 10 of 60 (16.7%) analyzed samples, KIT amplifications in 11/60 patients (18.3%), MET alterations in 5/60 (8.3%) individuals and PDGFRA mutations or amplifications in 15/60 cases (25%). Among RTKs downstream effectors, we found that, 3.3% (2/60) of cases showed BRAF mutations, 23.3% (14/60) displayed PIK3CA substitutions, 26.7% (16/60) alterations in PIK3R1 and 6.7% (4/60) RAS mutations. Finally, alterations in cell cycle regulation genes were infrequent: 3/60 (5%) patients harbored mutations in CDK4, 1/60 (1.7%) in CDK6, 2/60 (3.3%) in MDM4 and 5/60 (8.3%) in RB1 (Supplementary Table 4 and Figure 6). As expected, GBM samples displayed frequent alterations in the PI3K/AKT/mTOR pathway (21/44 - 47.5%) and in EGFR (7/44 - 15.9%) and KIT (9/44 - 20.4%). Furthermore, KIT and PDGFRA were co-amplified in 9/9 (100%) of GBM patients showing alterations in these two genes. Patients affected by high grade astrocytoma displayed alterations involving PIK3CA (40%), EGFR (40%) and RAS (20%) as previously reported (39). As expected, no other genes, besides IDH1, ATRX and TP53 were mutated in the single case of low-grade astrocytoma (case 54). Oligodendrogliomas showed alterations in PIK3CA (3/5) and PIK3R1 (2/5). As for individuals affected by ganglioglioma, we observed that 25% of them presented alterations involving BRAF and PIK3CA, while 50% displayed amplification of CDK4, KIT and PDGFRA. Finally, the single case of diffuse midline glioma (case 37) showed a concomitant truncated form and CNA loss of RB1 and a CNA gain of KIT and PDGFRA.
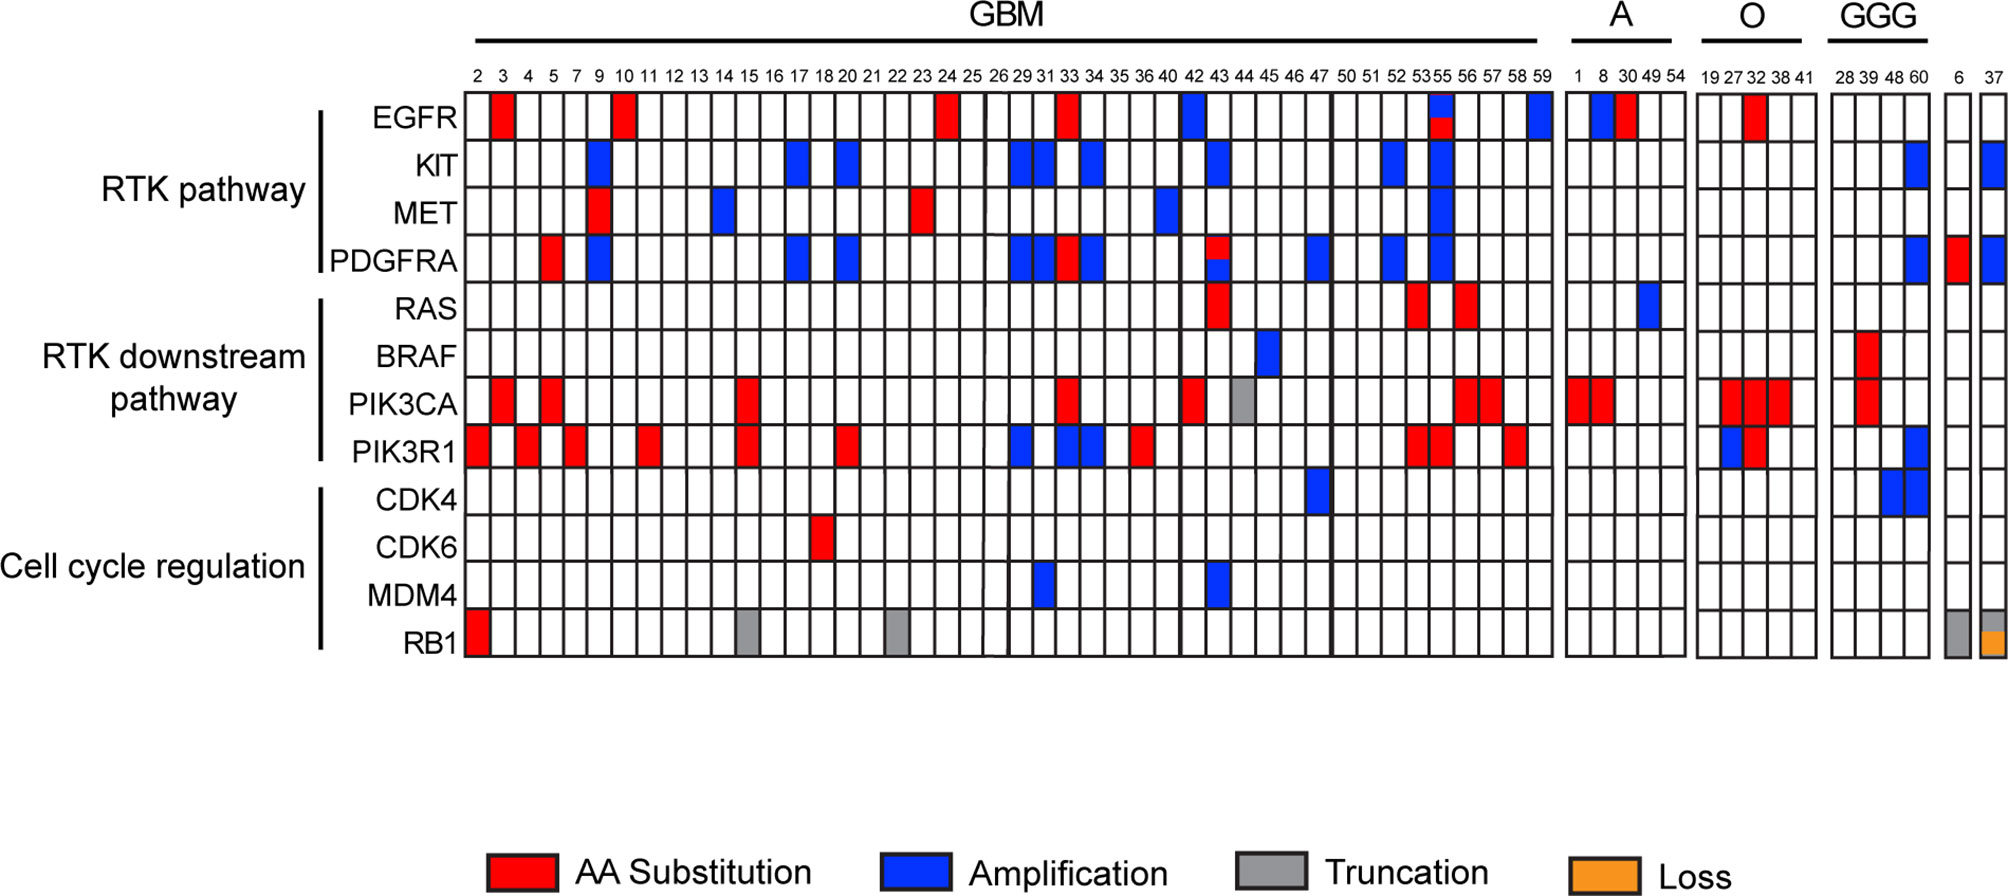
Figure 6 Landscape of recurrent actionable alterations in malignant gliomas. Summary of investigated actionable mutated genes detected by the Glio-DNA panel. Samples are subdivided into groups dependent on diagnostic profile. Single amino acid substitutions are shown in red, truncations in grey, copy number amplifications or deletions in blue and orange, respectively. Sample 6 is a case of gliosarcoma while sample 37 is a case of diffuse midline glioma. GBM, glioblastoma; A, astrocytoma; O, oligodendroglioma; GGG, ganglioglioma; RTK, receptor tyrosine kinase.
The latest edition of the WHO classification for CNS neoplasms reinforced the importance of an integrated histomolecular classification of malignant gliomas (5, 30) that should include histological tumor typing and grading paired with different molecular biomarkers, such as gene mutations, CNAs or gene fusions. Different technologies, such as polymerase chain reaction, IHC, FISH, Sanger sequencing or mass spectrometric genotyping, are currently in use for the identification of a limited number of molecular markers but none of these methods are able to scale up in order to address the increasing number and variety of alterations occurring in hundreds of cancer-related genes, as well as the novel genetic aberrations continuously emerging (17, 40). The advent of NGS enables the concomitant investigation of multiple molecular markers with high specificity and sensitivity.
Different NGS-based approaches for glioma investigation have been previously described emphasizing a diagnostic benefit with the additional value of the identification of actionable genetic alterations (41–44). For the present study, we designed a customized NGS-based panel detecting several diagnostic, prognostic and predictive molecular biomarkers in a series of 60 patients with diffuse gliomas (Supplementary Figure 3). The adoption of a reference standard is very important in order to establish the performance of an NGS analysis, especially if performed employing customized panels (45). Hence, the Glio-DNA custom panel was initially validated on a cell-line DNA standard with engineered genetic variants expressed with a known AF. We also employed a reference FFPE cell-line sample to simulate patient tumor tissue. Our data demonstrate a good reproducibility and sensitivity of the Glio-DNA panel with a high correlation between reference AFs and observed AFs.
We next compared NGS and IHC specificity and sensitivity in detecting several mutations and found that concordance varied depending on the genetic substitution investigated. For example, NGS showed a high specificity (98.11%) and sensitivity (100%) in identifying IDH1 mutations. On the contrary, NGS was less sensitive than IHC in recognizing ATRX alterations. This observation has been previously described (46, 47) and is likely explained by the presence of mutations located in the intronic or promoter regions of the gene that are not covered by the designed amplicons. We also found a low concordance between NGS and IHC in detecting TP53 mutations, with 80% sensitivity and a 90% specificity for both techniques. The discrepancies between the two tests might also be explained by TP53 sequence alterations located in intronic regions not covered by the primers used for sequencing. However, a more likely explanation relies in the misinterpretation of low or negative TP53 immunostaining in IHC. Indeed, TP53 detection by IHC results in a high percentage of false-negatives as a negative immunostaining is improperly interpreted as equivalent to the expression of a wild-type protein (48, 49), ignoring the fact that several nonsense mutations do not result in TP53 overexpression and will therefore remain undetected. In this scenario, alternative techniques such as NGS will easily resolve the issue.
FISH is currently the golden standard for the evaluation of chromosomal abnormalities. However, this technique will only identify an individual chromosomal alteration per each reaction (50). Unlike FISH, a properly designed NGS panel will generate information on multiple chromosomal alterations in a single determination. Indeed, with our analysis we obtained LOH information on 1p, 19q and chromosome 7 and 10, demonstrating that NGS was as sensitive and specific as FISH. Furthermore, NGS sequencing allowed the identification of a rare GBM displaying a 1p/19q co-deletion. A high concordance was also found for the detection of imbalance/gain of chromosome 7 and loss of chromosome 10, as well as for the detection of CDKN2A/B homozygous and hemizygous deletions.
Recognition of potential actionable targets is a critical need for patients with cancer (51, 52). To date, the standard treatment of GBM is based on surgical resection followed by the Stupp protocol (53), but recurrence generally appears within 6-9 months of diagnosis (54). More than 250 different clinical trials for the evaluation of molecularly targeted treatments were carried out in the last 20 years but only a few studies showed encouraging results. Hence, in current clinical practice treatment choice mostly relies on patient age and performance status (55–57). An advantage of the Glio-DNA panel is its potential utility in detecting clinically relevant genomic alterations in different targetable genes. In our study, we focused on altered RTKs genes and their main downstream signaling pathway as well as on genes involved in cell cycle regulation. Overall, 46 patients (76.7% of the total population) had alterations on the 12 investigated genes but only 22 displayed actionable mutations (pathogenic or likely pathogenic) with an AF ranging from 15 to 67% or CNAs that could be potentially exploited for a targeted treatment. Hence, looking at the identified alterations, sequencing data indicate an actionability rate of 37% (22/60) in our cohort. These results are in line with previous evidence in different cohorts of glioma patients, which report a rate of actionability ranging from 18 to 55% (58, 59). Several ongoing clinical trials investigating targeted treatments directed against actionable genetic alterations in newly diagnosed or recurrent GBM are reported in Table 2. Furthermore, targeting gene fusions involving EGFR, FGFR, MET or NTRK may soon represent a promising therapeutic option for several types of cancer including malignant glioma (60). Hence, we are designing an RNA-based panel to investigate gene fusions as clinical biomarkers, in order to offer patients a personalized treatment (61).
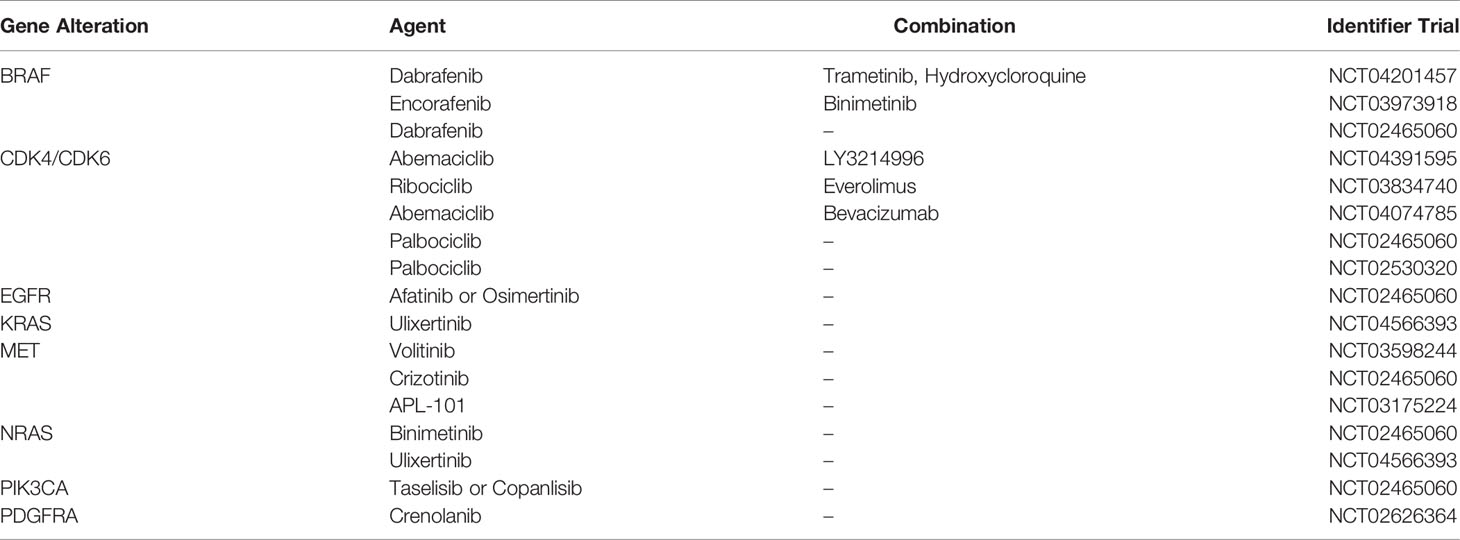
Table 2 Active clinical trials for the targeted treatment of malignant gliomas.
In conclusion, our data demonstrates that NGS represents an accurate, sensitive and valid alternative diagnostic tool that could replace multiple tests for the simultaneous identification of a broad range of genomic anomalies that have become a critical requirement for the proper classification of malignant gliomas. Furthermore, the identification of alterations in druggable genes may improve our ability to select appropriate targeted treatments for glioma patients.
The datasets presented in this study can be found in online repositories. The name of the repository and accession number can be found below: https://www.ncbi.nlm.nih.gov/sra/PRJNA801939.
The study was conducted according to the guidelines of the Declaration of Helsinki, and approved by the Catania 1 Ethics Committee, Santa Sofia 78 street, Catania, Italy (protocol code: 166/2015/PO; 17/12/2015). The studies involving human participants were reviewed and approved by Azienda Ospedaliero Universitaria Policlinico “G. Rodolico - San Marco. The patients/participants provided their written informed consent to participate in this study.
Conceptualization and design of the study, ET and MM. Formal analysis, ET, MM, GB, CR, SM, FrG, and MA. Investigation and data curation, ET, GB, CR, RA, FC, and GMVB. Writing - original draft preparation, ET, MM, GB, GMo, SM, and FB. Writing - review and editing, ET, GB, CR, FB, LM, FC, RA, and PV. Supervision, RC, GMa, FeG, and PV. All authors contributed to manuscript revision, read and approved the submitted version.
This study was partially funded by the Research Plan of the University of Catania PIACERI - linea di intervento 2 - entitled (MultiDisciplinar RESEarch and Targeted Therapy for malignant GLIOmas (MD_RESETT_GLIO) and Piano Sanitario Nazionale 2015, Linea Progettuale 6 - Azione 6.3.
The authors declare that the research was conducted in the absence of any commercial or financial relationships that could be construed as a potential conflict of interest.
All claims expressed in this article are solely those of the authors and do not necessarily represent those of their affiliated organizations, or those of the publisher, the editors and the reviewers. Any product that may be evaluated in this article, or claim that may be made by its manufacturer, is not guaranteed or endorsed by the publisher.
The Supplementary Material for this article can be found online at: https://www.frontiersin.org/articles/10.3389/fonc.2022.861078/full#supplementary-material
Supplementary Figure 1 | CDKN2A FISH in GBM samples. Representative images of GBM cases showing heterozygous (left panel), homozygous (middle panel) deletion of CDKN2A or normal CDKN2A (right panel) as assessed by FISH. Red dots represent LSI CDKN2A (p16) signal while green dots represent the CEP 9 signal.
Supplementary Figure 2 | Detection of mutant H3-3A and TP53 by immunohistochemistry and NGS. (A) Strong and diffuse nuclear immunoreactivity for H3.3K27M (immunoperoxidase; original magnification 200x) (left panel) and corresponding H3-3A c.83A>T (p. K27M) mutation detected by NGS (right panel) in the case of a diffuse midline glioma. Results were viewed in the IGV. (B) Strong and diffuse nuclear expression of p53 in a TP53-mutant glioma (immunoperoxidase; original magnification 200x) (left panel) and corresponding TP53 c.659A>G (p. Y220C) mutation detected by NGS (right panel) in a case of GBM. Results were viewed in the IGV. (C) Focal nuclear immunoreactivity for p53 in a TP53 wild-type glioma (immunoperoxidase; original magnification 200x). Note that TP53 is a negative-sense gene relative to the genomic reference sequence. Hence, a nucleotide change is displayed as a reverse complement.
Supplementary Figure 3 | Genomic alteration identified in analyzed diffuse gliomas Summary of genomic alterations detected by the Glio-DNA panel and investigated. Samples are subdivided into groups dependent on diagnostic profile. Single amino acid substitutions are shown in red, truncations in grey, copy number amplifications or deletions in blue and orange, respectively. Sample 6 is a case of gliosarcoma while sample 37 is a case of diffuse midline glioma. The letter “X” indicates not available data. GBM: glioblastoma; A: astrocytoma; O: oligodendroglioma; GGG: ganglioglioma.
1. Ostrom QT, Cioffi G, Gittleman H, Patil N, Waite K, Kruchko C, et al. CBTRUS Statistical Report: Primary Brain and Other Central Nervous System Tumors Diagnosed in the United States in 2012-2016. Neuro Oncol (2019) 21(Suppl 5):v1–v100. doi: 10.1093/neuonc/noz150
2. Inda MM, Bonavia R, Seoane J. Glioblastoma Multiforme: A Look Inside its Heterogeneous Nature. Cancers (Basel) (2014) 6(1):226–39. doi: 10.3390/cancers6010226
3. Ferlay J, Colombet M, Soerjomataram I, Mathers C, Parkin DM, Pineros M, et al. Estimating the Global Cancer Incidence and Mortality in 2018: GLOBOCAN Sources and Methods. Int J Cancer (2019) 144(8):1941–53. doi: 10.1002/ijc.31937
4. Louis DN, Perry A, Reifenberger G, von Deimling A, Figarella-Branger D, Cavenee WK, et al. The 2016 World Health Organization Classification of Tumors of the Central Nervous System: A Summary. Acta Neuropathol (2016) 131(6):803–20. doi: 10.1007/s00401-016-1545-1
5. Louis DN, Perry A, Wesseling P, Brat DJ, Cree IA, Figarella-Branger D, et al. The 2021 WHO Classification of Tumors of the Central Nervous System: A Summary. Neuro Oncol (2021) 23(8):1231–51. doi: 10.1093/neuonc/noab106
6. Komori T. Grading of Adult Diffuse Gliomas According to the 2021 WHO Classification of Tumors of the Central Nervous System. Lab Invest (2022) 102(2):126–33. doi: 10.1038/s41374-021-00667-6
7. Weller M, van den Bent M, Preusser M, Le Rhun E, Tonn JC, Minniti G, et al. EANO Guidelines on the Diagnosis and Treatment of Diffuse Gliomas of Adulthood. Nat Rev Clin Oncol (2021) 18(3):170–86. doi: 10.1038/s41571-020-00447-z
8. Lee YJ, Seo HW, Baek JH, Lim SH, Hwang SG, Kim EH. Gene Expression Profiling of Glioblastoma Cell Lines Depending on TP53 Status After Tumor-Treating Fields (TTFields) Treatment. Sci Rep (2020) 10(1):12272. doi: 10.1038/s41598-020-68473-6
9. Lee SY. Temozolomide Resistance in Glioblastoma Multiforme. Genes Dis (2016) 3(3):198–210. doi: 10.1016/j.gendis.2016.04.007
10. Brennan CW, Verhaak RG, McKenna A, Campos B, Noushmehr H, Salama SR, et al. The Somatic Genomic Landscape of Glioblastoma. Cell (2013) 155(2):462–77. doi: 10.1016/j.cell.2013.09.034
11. Cantanhede IG, de Oliveira JRM. PDGF Family Expression in Glioblastoma Multiforme: Data Compilation From Ivy Glioblastoma Atlas Project Database. Sci Rep (2017) 7(1):15271. doi: 10.1038/s41598-017-15045-w
12. Han F, Hu R, Yang H, Liu J, Sui J, Xiang X, et al. PTEN Gene Mutations Correlate to Poor Prognosis in Glioma Patients: A Meta-Analysis. Onco Targets Ther (2016) 9:3485–92. doi: 10.2147/OTT.S99942
13. Tilak M, Holborn J, New LA, Lalonde J, Jones N. Receptor Tyrosine Kinase Signaling and Targeting in Glioblastoma Multiforme. Int J Mol Sci (2021) 22(4):1831. doi: 10.3390/ijms22041831
14. Tirro E, Massimino M, Romano C, Martorana F, Pennisi MS, Stella S, et al. Prognostic and Therapeutic Roles of the Insulin Growth Factor System in Glioblastoma. Front Oncol (2020) 10:612385. doi: 10.3389/fonc.2020.612385
15. Mosele F, Remon J, Mateo J, Westphalen CB, Barlesi F, Lolkema MP, et al. Recommendations for the Use of Next-Generation Sequencing (NGS) for Patients With Metastatic Cancers: A Report From the ESMO Precision Medicine Working Group. Ann Oncol (2020) 31(11):1491–505. doi: 10.1016/j.annonc.2020.07.014
16. Nagahashi M, Shimada Y, Ichikawa H, Kameyama H, Takabe K, Okuda S, et al. Next Generation Sequencing-Based Gene Panel Tests for the Management of Solid Tumors. Cancer Sci (2019) 110(1):6–15. doi: 10.1111/cas.13837
17. Slatko BE, Gardner AF, Ausubel FM. Overview of Next-Generation Sequencing Technologies. Curr Protoc Mol Biol (2018) 122(1):e59. doi: 10.1002/cpmb.59
18. Broggi G, Tirro E, Alzoubi H, Arcella A, Gianno F, Antonelli M, et al. Cerebellar Liponeurocytoma: Clinical, Histopathological and Molecular Features of a Series of Three Cases, Including One Recurrent Tumor. Neuropathology (2022) 18. doi: 10.1111/neup.12799
19. Zhong Y, Xu F, Wu J, Schubert J, Li MM. Application of Next Generation Sequencing in Laboratory Medicine. Ann Lab Med (2021) 41(1):25–43. doi: 10.3343/alm.2021.41.1.25
20. Abel HJ, Duncavage EJ. Detection of Structural DNA Variation From Next Generation Sequencing Data: A Review of Informatic Approaches. Cancer Genet (2013) 206(12):432–40. doi: 10.1016/j.cancergen.2013.11.002
21. Dubbink HJ, Atmodimedjo PN, van Marion R, Krol NMG, Riegman PHJ, Kros JM, et al. Diagnostic Detection of Allelic Losses and Imbalances by Next-Generation Sequencing: 1p/19q Co-Deletion Analysis of Gliomas. J Mol Diagn (2016) 18(5):775–86. doi: 10.1016/j.jmoldx.2016.06.002
22. Forbes SA, Beare D, Gunasekaran P, Leung K, Bindal N, Boutselakis H, et al. COSMIC: Exploring the World's Knowledge of Somatic Mutations in Human Cancer. Nucleic Acids Res (2015) 43(Database issue):D805–11. doi: 10.1093/nar/gku1075
23. Broggi G, Lo Giudice A, Di Mauro M, Asmundo MG, Pricoco E, Piombino E, et al. SRSF-1 and Microvessel Density Immunohistochemical Analysis by Semi-Automated Tissue Microarray in Prostate Cancer Patients With Diabetes (DIAMOND Study). Prostate (2021) 81(12):882–92. doi: 10.1002/pros.24185
24. Broggi G, Salvatorelli L, Barbagallo D, Certo F, Altieri R, Tirro E, et al. Diagnostic Utility of the Immunohistochemical Expression of Serine and Arginine Rich Splicing Factor 1 (SRSF1) in the Differential Diagnosis of Adult Gliomas. Cancers (Basel) (2021) 13(9):2086. doi: 10.3390/cancers13092086
25. Woehrer A, Sander P, Haberler C, Kern S, Maier H, Preusser M, et al. FISH-Based Detection of 1p 19q Codeletion in Oligodendroglial Tumors: Procedures and Protocols for Neuropathological Practice - a Publication Under the Auspices of the Research Committee of the European Confederation of Neuropathological Societies (Euro-CNS). Clin Neuropathol (2011) 30(2):47–55. doi: 10.5414/npp30047
26. Kouwenhoven MC, Gorlia T, Kros JM, Ibdaih A, Brandes AA, Bromberg JE, et al. Molecular Analysis of Anaplastic Oligodendroglial Tumors in a Prospective Randomized Study: A Report From EORTC Study 26951. Neuro Oncol (2009) 11(6):737–46. doi: 10.1215/15228517-2009-011
27. Fuller CE, Schmidt RE, Roth KA, Burger PC, Scheithauer BW, Banerjee R, et al. Clinical Utility of Fluorescence in Situ Hybridization (FISH) in Morphologically Ambiguous Gliomas With Hybrid Oligodendroglial/Astrocytic Features. J Neuropathol Exp Neurol (2003) 62(11):1118–28. doi: 10.1093/jnen/62.11.1118
28. Marker DF, Pearce TM. Homozygous Deletion of CDKN2A by Fluorescence in Situ Hybridization is Prognostic in Grade 4, But Not Grade 2 or 3, IDH-Mutant Astrocytomas. Acta Neuropathol Commun (2020) 8(1):169. doi: 10.1186/s40478-020-01044-y
29. Brat DJ, Aldape K, Colman H, Figrarella-Branger D, Fuller GN, Giannini C, et al. cIMPACT-NOW Update 5: Recommended Grading Criteria and Terminologies for IDH-Mutant Astrocytomas. Acta Neuropathol (2020) 139(3):603–8. doi: 10.1007/s00401-020-02127-9
30. Louis DN, Wesseling P, Aldape K, Brat DJ, Capper D, Cree IA, et al. cIMPACT-NOW Update 6: New Entity and Diagnostic Principle Recommendations of the cIMPACT-Utrecht Meeting on Future CNS Tumor Classification and Grading. Brain Pathol (2020) 30(4):844–56. doi: 10.1111/bpa.12832
31. Tesileanu CMS, Vallentgoed WR, Sanson M, Taal W, Clement PM, Wick W, et al. Non-IDH1-R132H IDH1/2 Mutations are Associated With Increased DNA Methylation and Improved Survival in Astrocytomas, Compared to IDH1-R132H Mutations. Acta Neuropathol (2021) 141(6):945–57. doi: 10.1007/s00401-021-02291-6
32. Ikemura M, Shibahara J, Mukasa A, Takayanagi S, Aihara K, Saito N, et al. Utility of ATRX Immunohistochemistry in Diagnosis of Adult Diffuse Gliomas. Histopathology (2016) 69(2):260–7. doi: 10.1111/his.12927
33. Dubbink HJ, Atmodimedjo PN, Kros JM, French PJ, Sanson M, Idbaih A, et al. Molecular Classification of Anaplastic Oligodendroglioma Using Next-Generation Sequencing: A Report of the Prospective Randomized EORTC Brain Tumor Group 26951 Phase III Trial. Neuro Oncol (2016) 18(3):388–400. doi: 10.1093/neuonc/nov182
34. Koeller KK, Rushing EJ. From the Archives of the AFIP: Oligodendroglioma and its Variants: Radiologic-Pathologic Correlation. Radiographics (2005) 25(6):1669–88. doi: 10.1148/rg.256055137
35. Wijnenga MMJ, Dubbink HJ, French PJ, Synhaeve NE, Dinjens WNM, Atmodimedjo PN, et al. Molecular and Clinical Heterogeneity of Adult Diffuse Low-Grade IDH Wild-Type Gliomas: Assessment of TERT Promoter Mutation and Chromosome 7 and 10 Copy Number Status Allows Superior Prognostic Stratification. Acta Neuropathol (2017) 134(6):957–9. doi: 10.1007/s00401-017-1781-z
36. Wu G, Broniscer A, McEachron TA, Lu C, Paugh BS, Becksfort J, et al. Somatic Histone H3 Alterations in Pediatric Diffuse Intrinsic Pontine Gliomas and non-Brainstem Glioblastomas. Nat Genet (2012) 44(3):251–3. doi: 10.1038/ng.1102
37. Mathur R, Zhang Y, Grimmer MR, Hong C, Zhang M, Bollam S, et al. MGMT Promoter Methylation Level in Newly Diagnosed Low-Grade Glioma is a Predictor of Hypermutation at Recurrence. Neuro Oncol (2020) 22(11):1580–90. doi: 10.1093/neuonc/noaa059
38. Siller S, Lauseker M, Karschnia P, Niyazi M, Eigenbrod S, Giese A, et al. The Number of Methylated CpG Sites Within the MGMT Promoter Region Linearly Correlates With Outcome in Glioblastoma Receiving Alkylating Agents. Acta Neuropathol Commun (2021) 9(1):35. doi: 10.1186/s40478-021-01134-5
39. Killela PJ, Pirozzi CJ, Reitman ZJ, Jones S, Rasheed BA, Lipp E, et al. The Genetic Landscape of Anaplastic Astrocytoma. Oncotarget (2014) 5(6):1452–7. doi: 10.18632/oncotarget.1505
40. Stella M, Falzone L, Caponnetto A, Gattuso G, Barbagallo C, Battaglia R, et al. Serum Extracellular Vesicle-Derived Circhipk3 and Circsmarca5 Are Two Novel Diagnostic Biomarkers for Glioblastoma Multiforme. Pharm (Basel) (2021) 14(7):618. doi: 10.3390/ph14070618
41. Na K, Kim HS, Shim HS, Chang JH, Kang SG, Kim SH. Targeted Next-Generation Sequencing Panel (TruSight Tumor 170) in Diffuse Glioma: A Single Institutional Experience of 135 Cases. J Neurooncol (2019) 142(3):445–54. doi: 10.1007/s11060-019-03114-1
42. D'Haene N, Melendez B, Blanchard O, De Neve N, Lebrun L, Van Campenhout C, et al. Design and Validation of a Gene-Targeted, Next-Generation Sequencing Panel for Routine Diagnosis in Gliomas. Cancers (Basel) (2019) 11(6):773. doi: 10.3390/cancers11060773
43. Nikiforova MN, Wald AI, Melan MA, Roy S, Zhong S, Hamilton RL, et al. Targeted Next-Generation Sequencing Panel (GlioSeq) Provides Comprehensive Genetic Profiling of Central Nervous System Tumors. Neuro Oncol (2016) 18(3):379–87. doi: 10.1093/neuonc/nov289
44. Zacher A, Kaulich K, Stepanow S, Wolter M, Kohrer K, Felsberg J, et al. Molecular Diagnostics of Gliomas Using Next Generation Sequencing of a Glioma-Tailored Gene Panel. Brain Pathol (2017) 27(2):146–59. doi: 10.1111/bpa.12367
45. Hardwick SA, Deveson IW, Mercer TR. Reference Standards for Next-Generation Sequencing. Nat Rev Genet (2017) 18(8):473–84. doi: 10.1038/nrg.2017.44
46. Daoud EV, Chkheidze R, Yell PC, Hatanpaa KJ, Raisanen JM, Cai C. The Efficacy of Immunohistochemistry in the Diagnosis of Molecular Genetic Alterations in Central Nervous System Gliomas: Next-Generation Sequencing of 212 Mutations in 112 Patients. Clin Neuropathol (2022) 41(1):35–40. doi: 10.5414/NP301381
47. Carter JH, McNulty SN, Cimino PJ, Cottrell CE, Heusel JW, Vigh-Conrad KA, et al. Targeted Next-Generation Sequencing in Molecular Subtyping of Lower-Grade Diffuse Gliomas: Application of the World Health Organization's 2016 Revised Criteria for Central Nervous System Tumors. J Mol Diagn (2017) 19(2):328–37. doi: 10.1016/j.jmoldx.2016.10.010
48. Roshandel AK, Busch CM, Mullekom JV, Cuoco JA, Rogers CM, Apfel LS, et al. The Predictive Capability of Immunohistochemistry and DNA Sequencing for Determining TP53 Functional Mutation Status: A Comparative Study of 41 Glioblastoma Patients. Oncotarget (2019) 10(58):6204–18. doi: 10.18632/oncotarget.27252
49. Takami H, Yoshida A, Fukushima S, Arita H, Matsushita Y, Nakamura T, et al. Revisiting TP53 Mutations and Immunohistochemistry–A Comparative Study in 157 Diffuse Gliomas. Brain Pathol (2015) 25(3):256–65. doi: 10.1111/bpa.12173
50. Nath J, Johnson KL. A Review of Fluorescence in Situ Hybridization (FISH): Current Status and Future Prospects. Biotech Histochem (2000) 75(2):54–78. doi: 10.3109/10520290009064150
51. Tirro E, Massimino M, Romano C, Pennisi MS, Stella S, Vitale SR, et al. Chk1 Inhibition Restores Inotuzumab Ozogamicin Citotoxicity in CD22-Positive Cells Expressing Mutant P53. Front Oncol (2019) 9:57. doi: 10.3389/fonc.2019.00057
52. Tirro E, Massimino M, Stella S, Zammit V, Consoli ML, Pennisi MS, et al. Efficacy of Nilotinib in a CML Patient Expressing the Three-Way Complex Variant Translocation T (2,9,22). Anticancer Res (2019) 39(7):3893–9. doi: 10.21873/anticanres.13540
53. Stupp R, Mason WP, van den Bent MJ, Weller M, Fisher B, Taphoorn MJ, et al. Radiotherapy Plus Concomitant and Adjuvant Temozolomide for Glioblastoma. N Engl J Med (2005) 352(10):987–96. doi: 10.1056/NEJMoa043330
54. Botros D, Dux H, Price C, Khalafallah AM, Mukherjee D. Assessing the Efficacy of Repeat Resections in Recurrent Glioblastoma: A Systematic Review. Neurosurg Rev (2021) 44(3):1259–71. doi: 10.1007/s10143-020-01331-1
55. Cruz Da Silva E, Mercier MC, Etienne-Selloum N, Dontenwill M, Choulier L. A Systematic Review of Glioblastoma-Targeted Therapies in Phases II, III, IV Clinical Trials. Cancers (Basel) (2021) 13(8):1795. doi: 10.3390/cancers13081795
56. Di Nunno V, Franceschi E, Tosoni A, Gatto L, Lodi R, Bartolini S, et al. Glioblastoma: Emerging Treatments and Novel Trial Designs. Cancers (Basel) (2021) 13(15):3750. doi: 10.3390/cancers13153750
57. Certo F, Altieri R, Maione M, Schonauer C, Sortino G, Fiumano G, et al. FLAIRectomy in Supramarginal Resection of Glioblastoma Correlates With Clinical Outcome and Survival Analysis: A Prospective, Single Institution, Case Series. Oper Neurosurg (Hagerstown) (2021) 20(2):151–63. doi: 10.1093/ons/opaa293
58. Shen C, Meric-Bernstam F, Su X, Mendelsohn J, Giordano S. Prevalence of Actionable Mutations and Copy Number Alterations and the Price of a Genomic Testing Panel. Oncotarget (2016) 7(44):71686–95. doi: 10.18632/oncotarget.11994
59. Ellis HP, McInerney CE, Schrimpf D, Sahm F, Stupnikov A, Wadsley M, et al. Clinically Actionable Insights Into Initial and Matched Recurrent Glioblastomas to Inform Novel Treatment Approaches. J Oncol (2019) 2019:4878547. doi: 10.1155/2019/4878547
60. Xu T, Wang H, Huang X, Li W, Huang Q, Yan Y, et al. Gene Fusion in Malignant Glioma: An Emerging Target for Next-Generation Personalized Treatment. Transl Oncol (2018) 11(3):609–18. doi: 10.1016/j.tranon.2018.02.020
Keywords: glioma, next generation sequencing, biomarkers, molecular biology, diagnosis, targeted therapy, immunohistochemistry, fluorescence in situ hybridization
Citation: Tirrò E, Massimino M, Broggi G, Romano C, Minasi S, Gianno F, Antonelli M, Motta G, Certo F, Altieri R, Manzella L, Caltabiano R, Barbagallo GMV, Buttarelli FR, Magro G, Giangaspero F and Vigneri P (2022) A Custom DNA-Based NGS Panel for the Molecular Characterization of Patients With Diffuse Gliomas: Diagnostic and Therapeutic Applications. Front. Oncol. 12:861078. doi: 10.3389/fonc.2022.861078
Received: 24 January 2022; Accepted: 21 February 2022;
Published: 17 March 2022.
Edited by:
Christine Marosi, Medical University of Vienna, AustriaReviewed by:
Vincenzo Di Nunno, AUSL Bologna, ItalyCopyright © 2022 Tirrò, Massimino, Broggi, Romano, Minasi, Gianno, Antonelli, Motta, Certo, Altieri, Manzella, Caltabiano, Barbagallo, Buttarelli, Magro, Giangaspero and Vigneri. This is an open-access article distributed under the terms of the Creative Commons Attribution License (CC BY). The use, distribution or reproduction in other forums is permitted, provided the original author(s) and the copyright owner(s) are credited and that the original publication in this journal is cited, in accordance with accepted academic practice. No use, distribution or reproduction is permitted which does not comply with these terms.
*Correspondence: Elena Tirrò, ZWxlX3RpckB5YWhvby5pdA==
†These authors have contributed equally to this work
Disclaimer: All claims expressed in this article are solely those of the authors and do not necessarily represent those of their affiliated organizations, or those of the publisher, the editors and the reviewers. Any product that may be evaluated in this article or claim that may be made by its manufacturer is not guaranteed or endorsed by the publisher.
Research integrity at Frontiers
Learn more about the work of our research integrity team to safeguard the quality of each article we publish.