 Fang Chen
 Xin Gong2†
 Feng Yu
 Jian Wu
94% of researchers rate our articles as excellent or good
Learn more about the work of our research integrity team to safeguard the quality of each article we publish.
Find out more
ORIGINAL RESEARCH article
Front. Oncol. , 10 May 2022
Sec. Molecular and Cellular Oncology
Volume 12 - 2022 | https://doi.org/10.3389/fonc.2022.857994
Background: Numerous studies have shown that the aging microenvironment played a huge impact on tumor progression. However, the clinical prognostic value of aging-related risk signatures and their effects on the tumor immune microenvironment (TIME) in head and neck squamous cell carcinoma (HNSCC) remains largely unclear. This study aimed to identify novel prognostic signatures based on aging-related genes (AGs) and reveal the landscape of the TIME in HNSCC.
Methods: Differentially expressed AGs were identified using the gene set enrichment analysis (GSEA). The prognostic risk model of AGs was established by univariate and multivariate Cox regression and least absolute shrinkage and selection operator (LASSO) regression analyses. The independent prognostic value of the risk model and the correlations of the prognostic signature with immune score, tumor immune cell infiltration, and immune checkpoints were systematically analyzed.
Results: A prognostic risk model of four AGs (BAK1, DKK1, CDKN2A, and MIF) was constructed and validated in the training and testing datasets. Kaplan–Meier curves and time-dependent receiver operating characteristic (ROC) curve analysis confirmed that the four-AG risk signature possessed an accurate predictive value for the prognosis of patients with HNSCC. Correlation analysis revealed that the risk score was negatively associated with immune score and immune cell infiltration level while positively correlated with immune checkpoint blockade (ICB) response score. Patients of the high-risk subtype contained higher infiltration levels of resting natural killer (NK) cells, M0 macrophages, M2 macrophages, and resting mast cells while having lower infiltration levels of memory B cells, CD8+ T cells, follicular helper T cells, regulatory T cells (Tregs), and activated mast cells than did those of the low-risk subtype. The expressions of CTLA4, PDCD1, and TIGIT were downregulated while the PDCD1LG2 expression was upregulated in the high-risk subtype compared to those in the low-risk subtype. Furthermore, the four selected AGs in the risk model were demonstrated to possess important functions in immune cell infiltration and ICB response of HNSCC.
Conclusions: The aging-related risk signature is a reliable prognostic model for predicting the survival of HNSCC patients and provides potential targets for improving outcomes of immunotherapy.
Head and neck squamous cell carcinoma (HNSCC) is a frequent malignant tumor derived from the mucosal epithelium in the oral cavity, pharynx, and larynx, which presents an incidence rate of approximately 600,000 new cases and 350,000 deaths annually worldwide and an increasing prevalence among older adults (1, 2). In order to establish etiological risk factors related to lethal malignancy of HNSCC, in-depth studies have been conducted to analyze the genetic, epigenetic, and environmental factors that may trigger the occurrence of tumor (3). However, no effective screening strategy for HNSCC has been found so far, and careful physical examination is still the main method for early detection. In addition, most patients with advanced HNSCC present no clinical history of precancerous lesions (3). Therefore, there is an urgent need to identify novel biomarkers that are able to predict the progression of HNSCC precancerous lesions, treatment response, and survival.
Substantial efforts are being made to identify biomarkers for prejudging the prognosis of HNSCC patients. For example, the CXC chemokines have been proven to provide functional prognosis and suitable therapeutic value for HNSCC (4). A research cohort of 383 HNSCC patients revealed that elevated expression of NR2F6 is related to poorer recurrence-free survival, which could be used as a new prognostic indicator for early detection of local recurrences in patients with HNSCC (5). Recently, increasing autophagy- and ferroptosis-related risk signatures have been constructed to prognosticate survival for patients with HNSCC by a set of bioinformatics analyses (6–8). However, accurate and reliable prognostic indicators or models are still insufficient to improve the clinical outcomes of HNSCC patients.
The tumor microenvironment (TME) refers to a complex ecosystem involving persistent complex interactions between cancer cells, immune cells, stromal cells, and extracellular matrix components, which can play a significant role in tumor initiation and metastasis (9, 10). Substantial evidence has shown that a deep understanding of the heterogeneity of the TME within each type of cancer is essential to identify predictive biomarkers of patient outcomes that can routinely be used in the clinic (11, 12). Numerous reviews of published datasets have shown that the aging microenvironment can dramatically affect normal cells of the TME, which may have a huge impact on tumor progression (13–15). As one of the hallmarks of aging, inflammaging can result in degeneration of tissue and destruction of acute inflammation, which is closely correlated with the occurrence and progression of cancer (16, 17). Cellular senescence plays an important role in promoting the aging process and has been recognized as a primary factor that links inflammaging to a variety of age-related malignant tumors (17, 18). Age-related accumulation of senescence-associated secretory phenotype (SASP) cells can promote cancer progression by remaking the primary and metastatic microenvironment over time to a state where malignant cells are more likely to grow. Previous results have shown that cellular senescence is regulated by aging-related genes (AGs), which present important functions in tumor malignancy (19, 20). Given the tremendous changes in the extracellular matrix, secreted factors, and immune system as age increases, there may be potential clinical implications for immunotherapy and targeted therapy in patients with HNSCC. However, there is limited knowledge about the comprehensive correlations of the AGs with the tumor immune microenvironment (TIME) and the prognosis of HNSCC patients.
In this study, a risk model of the four AGs was constructed and was recognized as an independent prognostic index for HNSCC patients. The correlations of the risk model with immune score, immune cell infiltration, and potential immune checkpoints were systematically assessed based on the aging-related signatures. Furthermore, the effect of the four selected AGs on the TIME was explored to reveal their potential functions in tumor progression. Our findings contributed to clarify the regulatory mechanisms of the AGs related to the TIME and implied that these AGs might be functional prognostic biomarkers for predicting clinical outcomes of HNSCC patients and provide new targets for improving the immunotherapy response.
The fragments per kilobyte of exon model per million mapped reads (FPKM) RNA-sequencing data TCGA-HNSC (The Cancer Genome Atlas -Head and Neck Squamous Cell Carcinoma) and corresponding clinical follow-up information of HNSCC samples were obtained from TCGA data portal (https://portal.gdc.cancer.gov/). Aging-related human ontology gene sets were downloaded from the Molecular Signatures Database (MSigDB) (http://www.gsea-msigdb.org/gsea/msigdb/index.jsp) via searching by aging. These raw datasets of TCGA-HNSC were normalized by the multi-array average method, and the ENSEMBL gene ID was transformed to the GeneSymbol using the “biomaRt” package. The expressions of the same GeneSymbol were combined and unidentified gene IDs were excluded, whereas the expressions of 39,743 genes were analyzed.
The enrichment of aging-related gene sets was identified via the gene set enrichment analysis (GSEA, version 4.1.0) using TCGA-HNSC as expression datasets and aging-related human ontology gene sets as database. Nominal (NOM) P-values <0.05, |Normalized enrichment score (NES)| >1, and false discovery rate (FDR) q < 0.25 were used as filtering criteria. Then, the core AGs were obtained by screening the significantly upregulated AG sets in tumors from the GSEA via leading edge analysis. Finally, differentially expressed AGs between HNSCC and non-tumor samples were obtained using “Limma” package by R software (version 4.1.1) according to the cutoff criterion of |log2(fold change)| > 1 and p < 0.05.
These differentially expressed AGs were analyzed using univariate Cox regression to identify prognostic candidates (p < 0.05). Then, false-positive prognostic-associated AGs were eliminated by the least absolute shrinkage and selection operator (LASSO) Cox regression analyses. To improve the effectiveness and accuracy of prognostic prediction of these AGs, prognosis-related AGs were further analyzed by multivariate Cox regression to exclude those genes that cannot be used as independent indicators for prognostic monitoring.
A risk model was established using the LASSO Cox regression analysis of prognosis-related AGs based on the training cohort (the whole dataset, n = 502). The risk score for each patient in both the training cohort and the testing cohort (randomly selected, n = 250) was estimated based on the formula, and patients were classified into high-/low-risk subtypes stratified by the median risk score. Kaplan–Meier analyses and log-rank test were conducted to compare survival differences between patients in the high-risk and low-risk subtypes. The time-dependent receiver operating characteristic (ROC) curves and corresponding areas under the curve (AUC) values were utilized to assess the prognostic value of AG-related risk model based on training and testing cohorts. Univariate and multivariate Cox regression analyses were conducted to further confirm the prognostic capacity of the AG-related signature. A nomogram and calibration plots were then built to further provide a prognosis of HNSCC that integrated clinicopathological factors. The relationships between the risk score with the overall survival (OS) and clinical characteristics of HNSCC patients were explored by stratification survival analyses.
The immune scores of HNSCC samples were calculated with R package ESTIMATE (21). The infiltration levels of 22 types of immune cells of HNSCC samples were calculated via CIBERSORT (http://cibersort.stanford.edu/) (22). Then, the effect of the selected AGs in the risk model on infiltration levels of six types of immune cells was further analyzed via the TIMER database (https://cistrome.shinyapps.io/timer/) (23). To predict the immune status and potential immune checkpoint blockade (ICB) response, the correlations of the prognostic model with immune checkpoint expression and ICB response were investigated based on TCGA datasets. Potential ICB response was predicted with tumor immune dysfunction and exclusion (TIDE) algorithm (24).
The statistical analyses were carried out using R software (version 4.0.2) and GraphPad Prism 8 (San Diego, CA, USA) (25). Kaplan–Meier analyses were performed to compare OS between pairs of subtypes. The differences in the risk score between different clinical characteristic subtypes and differences in the immune cell infiltration level and immune checkpoints between the high and low subtypes stratified by the median risk score and median expression levels of BAK1, DKK1, CDKN2A, and MIF were evaluated by Wilcoxon test.
The RNA-sequencing data and clinical follow-up data of 502 HNSCC and 44 non-tumor samples were obtained from TCGA portal, and 11 aging-related human ontology gene sets were obtained from MSigDB. GSEA showed that 7 gene sets including “GOBP_CELL_AGING", “GOBP_REGULATION_OF_CELL_AGING", “GOBP_CELLULAR_ SENESCENCE", “GOBP_NEGATIVE_REGULATION_OF_CELL_AGING", “GOBP_POSITIVE_ REGULATION_OF_CELL_AGING", “GOBP_AGING”, and "GOBP_REPLICATIVE_SENESCENCE" are significantly enriched in HNSCC samples (Figure S1). A total of 134 core enrichment genes were identified as AGs via leading edge analysis of the above 7 gene sets (Table S1). Then, 41 significantly upregulated AGs were extracted according to the expression of all core enrichment genes in tumor and non-tumor samples (Figures 1A, B). The differences in expression patterns of these 41 differentially expressed AGs were further presented in box plots (Figure 1C).
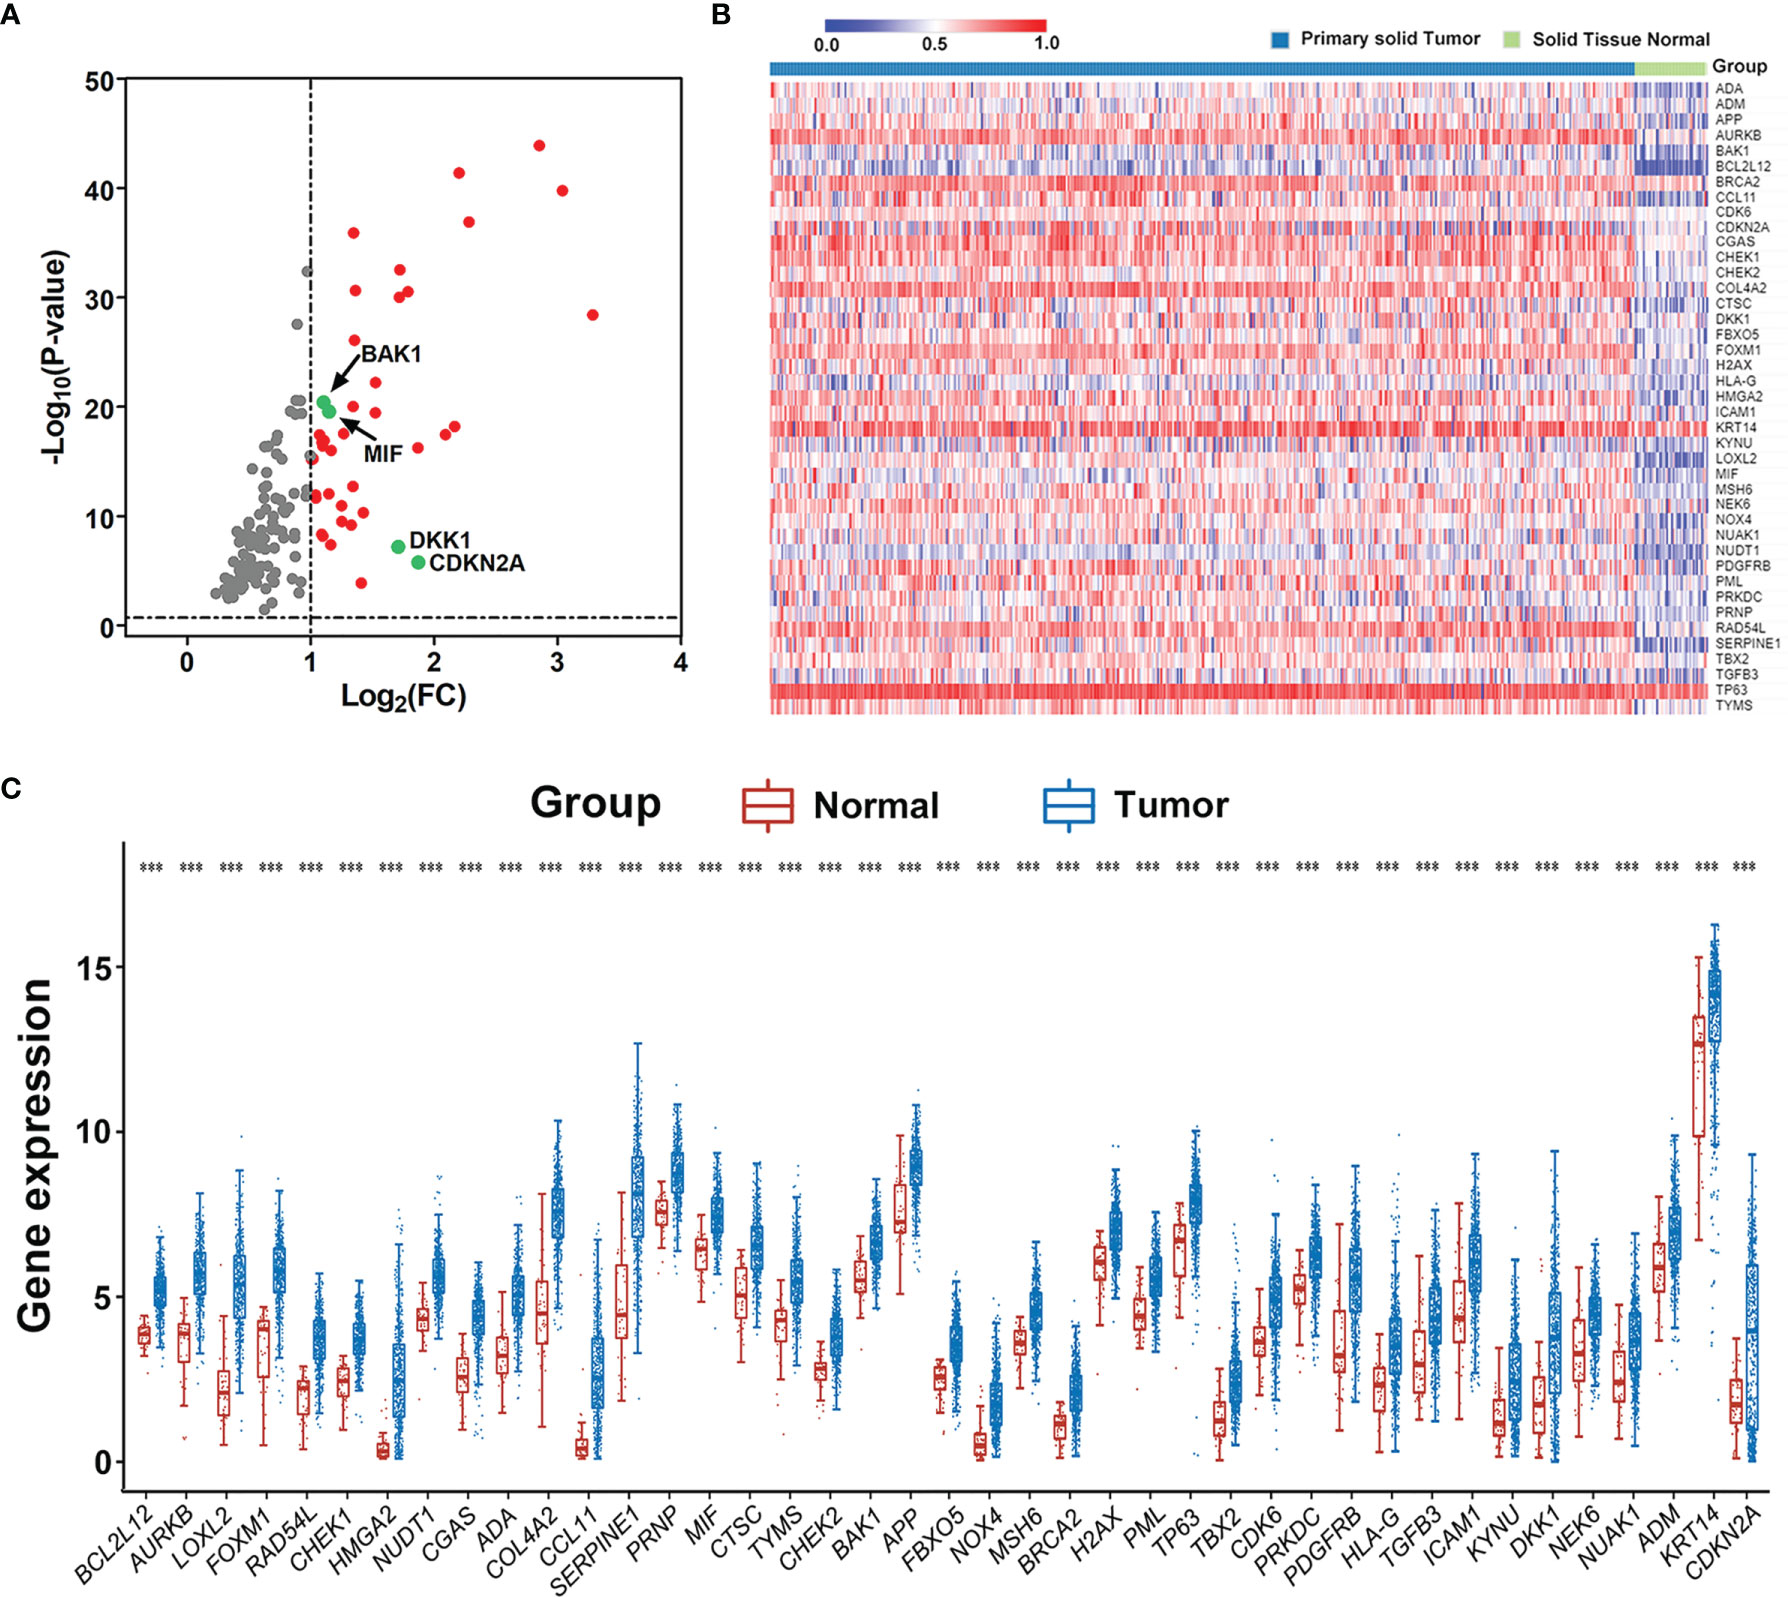
Figure 1 Extraction of differentially expressed aging-related genes (AGs) based on TCGA datasets. (A) Volcano plot for the 134 AGs in HNSCC retrieved from GSEA based on TCGA datasets. FC represents fold change. Red indicates upregulation, gray indicates no difference, and the studied four genes are marked in green. (B) Heat map of the 41 differentially expressed AGs in HNSCC. (C) Expression distribution of differentially expressed AGs in HNSCC and normal tissue samples. The red dot represents normal tissue sample, and the blue dot represents tumor sample. ***p < 0.001.
To investigate the prognostic value of differentially expressed AGs in HNSCC patients, univariate Cox proportional hazards regression analyses were conducted to estimate the prognostic relationship between AGs and OS in patients with HNSCC according to their mRNA expression level in the whole TCGA dataset (n = 502).
The prognostic value of differentially expressed AGs in HNSCC patients was explored using univariate Cox proportional hazards regression analyses based on the whole TCGA dataset (n = 502). Results showed that 12 differentially expressed AGs (DKK1, SERPINE1, ADA, HMGA2, APP, CDKN2A, MIF, NEK6, ADM, BAK1, CDK6, and PRNP) were remarkably related to the OS of HNSCC patients (p < 0.05, Figure 2A). Subsequently, false-positive prognosis-associated AGs were eliminated by LASSO Cox regression analyses, and 7 AGs including BAK1, DKK1, CDKN2A, ADA, APP, MIF, and ADM were obtained (Figure S2). Then, the impact of these 7 prognosis-associated AGs on OS and clinical outcomes of HNSCC patients was evaluated via multivariate Cox regression analyses (p < 0.05, Figure 2B). Finally, 4 AGs including BAK1, DKK1, MIF, and CDKN2A were identified with independent prognostic values for OS prediction and further applied to establish a prognostic risk model.
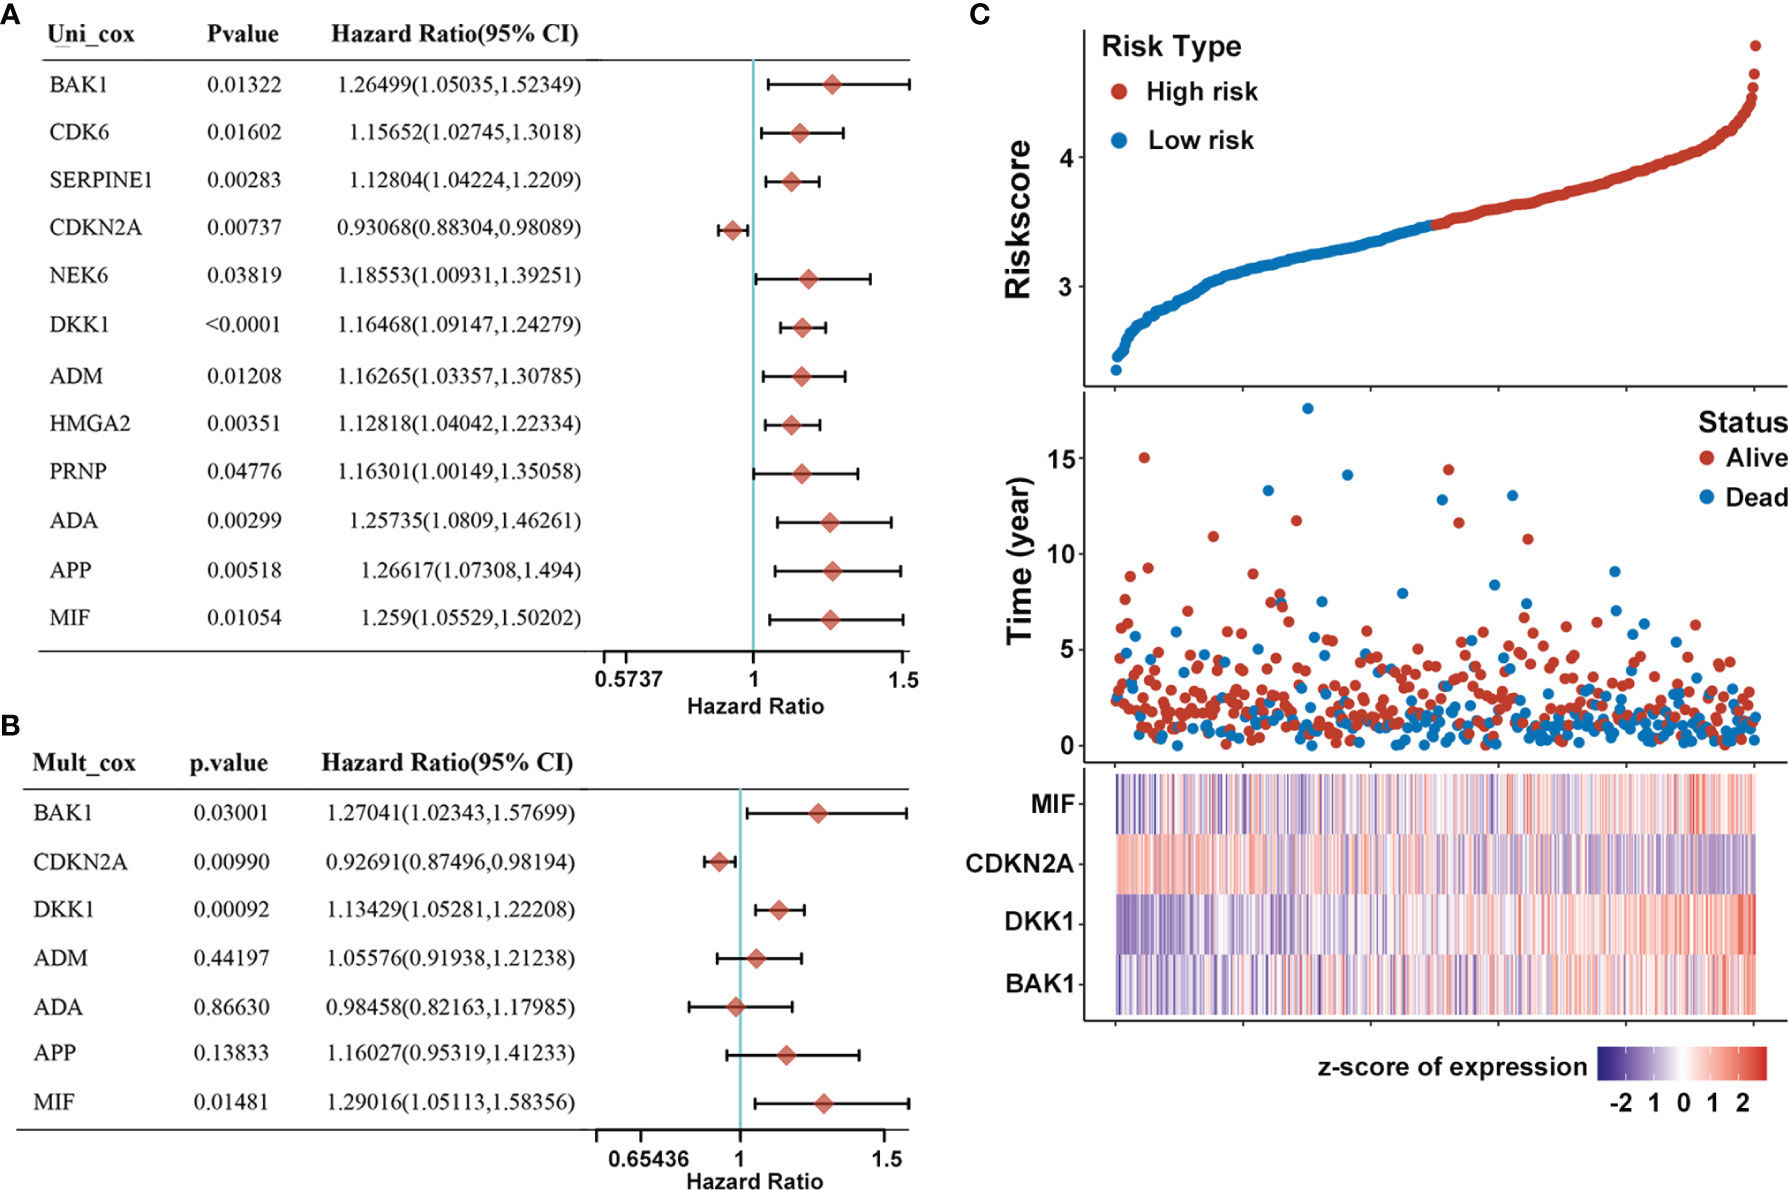
Figure 2 Construction of prognostic risk model of AGs for HNSCC patients. (A) Forest plot of 12 AGs that related to overall survival via univariate Cox regression analyses. (B) Multivariate Cox regression analyses of 7 prognosis-associated AGs. (C) Risk plot distribution, survival status of patients, and heat map of expression of included genes in the whole TCGA-HNSC dataset.
A prognostic risk model derived from the four selected AGs was constructed by LASSO Cox regression analyses, of which BAK1, DKK1, and MIF were identified as high-risk genes while CDKN2A was identified as a low-risk gene. The risk score formula was as follows: Risk score = (0.2126) * BAK1 + (0.137) * DKK1 + (-0.0716) * CDKN2A + (0.2474) * MIF. Afterward, patients were divided into high-risk and low-risk subtypes by the median risk score. The risk plot distribution and survival status of HNSCC patients showed that the OS rates of patients in the high-risk subtype were markedly lower than those in the low-risk subtype (Figure 2C). In addition, the heat map of the included genes showed that the expressions of BAK1, DKK1, and MIF were significantly higher in the high-risk subtype while the expression of CDKN2A was significantly higher in the low-risk subtype (Figure 2C).
The prognostic value of the AG signature was validated in the training cohort (the whole dataset, n = 502) and the testing cohort (randomly selected, n = 250). Kaplan–Meier survival analyses showed that the high-risk group patients had a shorter OS than those of the low-risk group both in the training and testing cohorts (p < 0.001; Figures 3A, B). The 2-, 3-, and 5-year AUC values of ROC curves for the AG signature in the training cohort were 0.663, 0.676, and 0.652, respectively (Figure 3C). And the corresponding 2-, 3-, and 5-year AUC values of ROC curves in the testing cohort were 0.660, 0.684, and 0.709, respectively (Figure 3D). These data together revealed the accuracy of the risk model of the four selected AGs for HNSCC prognosis.
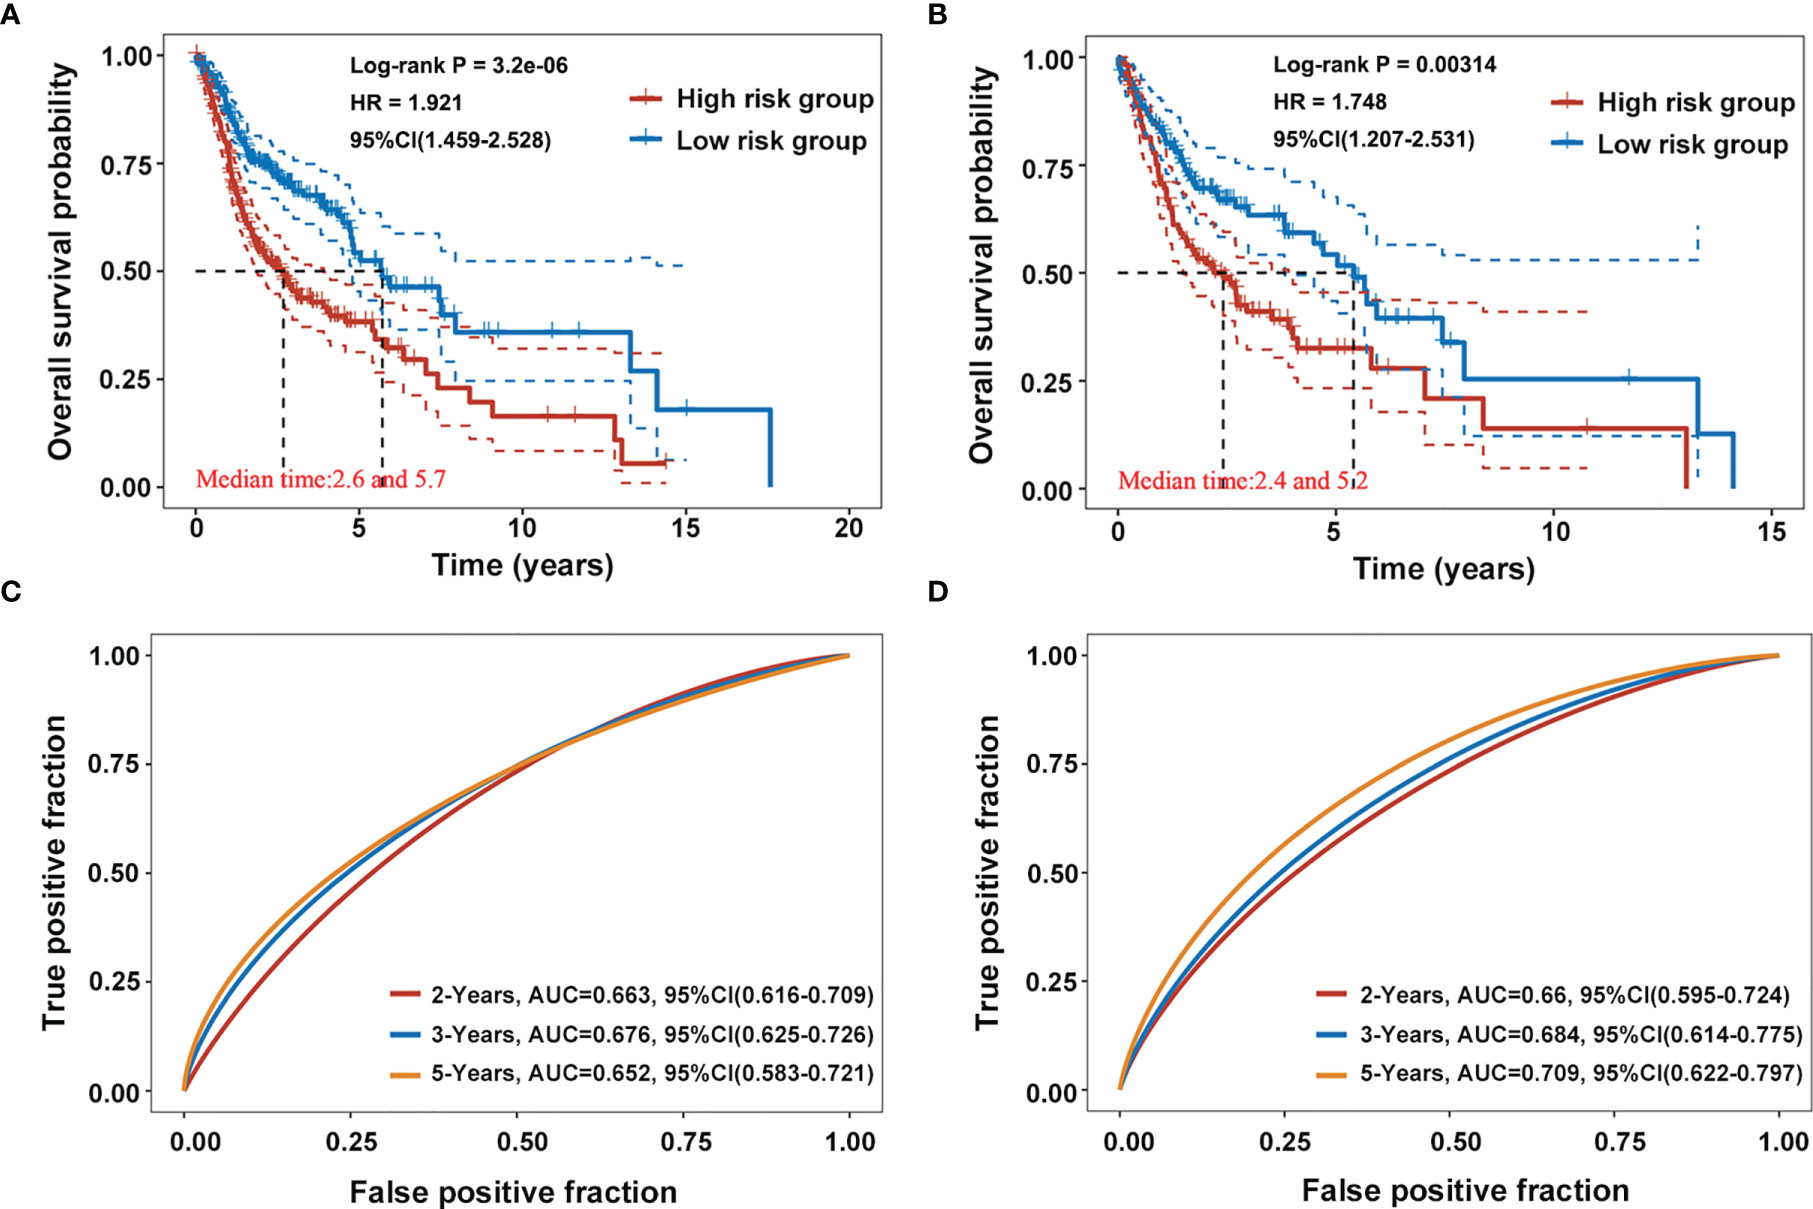
Figure 3 Validation of the prognostic capacity of the selected four-AG signature. (A, B) Kaplan–Meier survival curves for the risk model based on the training cohort (the whole dataset, n = 502) and the testing cohort (randomly selected, n = 250). (C, D) Receiver operating characteristic (ROC) curves for the risk model in the training and testing cohorts.
To examine the associations of the risk model with clinicopathological characteristics of HNSCC patients, the differences in risk scores between subgroups sorted by age, tumor grade, pathological TNM stage, pathological T stage, pathological N stage, gender, and therapy were compared via Wilcoxon test. It was found that risk scores were significantly correlated with the tumor grade (p < 0.01) and pathological T stage (p < 0.05), whereas they showed no relationship with age, pathological TNM stage, pathological N stage, gender, and therapy (Figure 4A). Furthermore, univariate Cox regression analyses showed that the age, pathological N stage, and pathological TNM stage were significantly associated with OS in patients with HNSCC (p < 0.05, Figure 4B). Multivariate Cox regression analyses revealed that age, pathological N stage, pathological TNM stage, and radiation therapy were obviously related to OS in HNSCC patients (p < 0.05, Figure 4B). In order to provide a prognosis of HNSCC that integrated age, pathological N stage, pathological TNM stage, and radiation therapy, a nomogram with the C-index for survival prediction of 0.764 (p < 0.001) was built (Figure 4C). Calibration curves for the 2-, 3-, and 5-year OS nomogram model showed a good consistency between nomogram predictions and actual observations (Figure 4D).
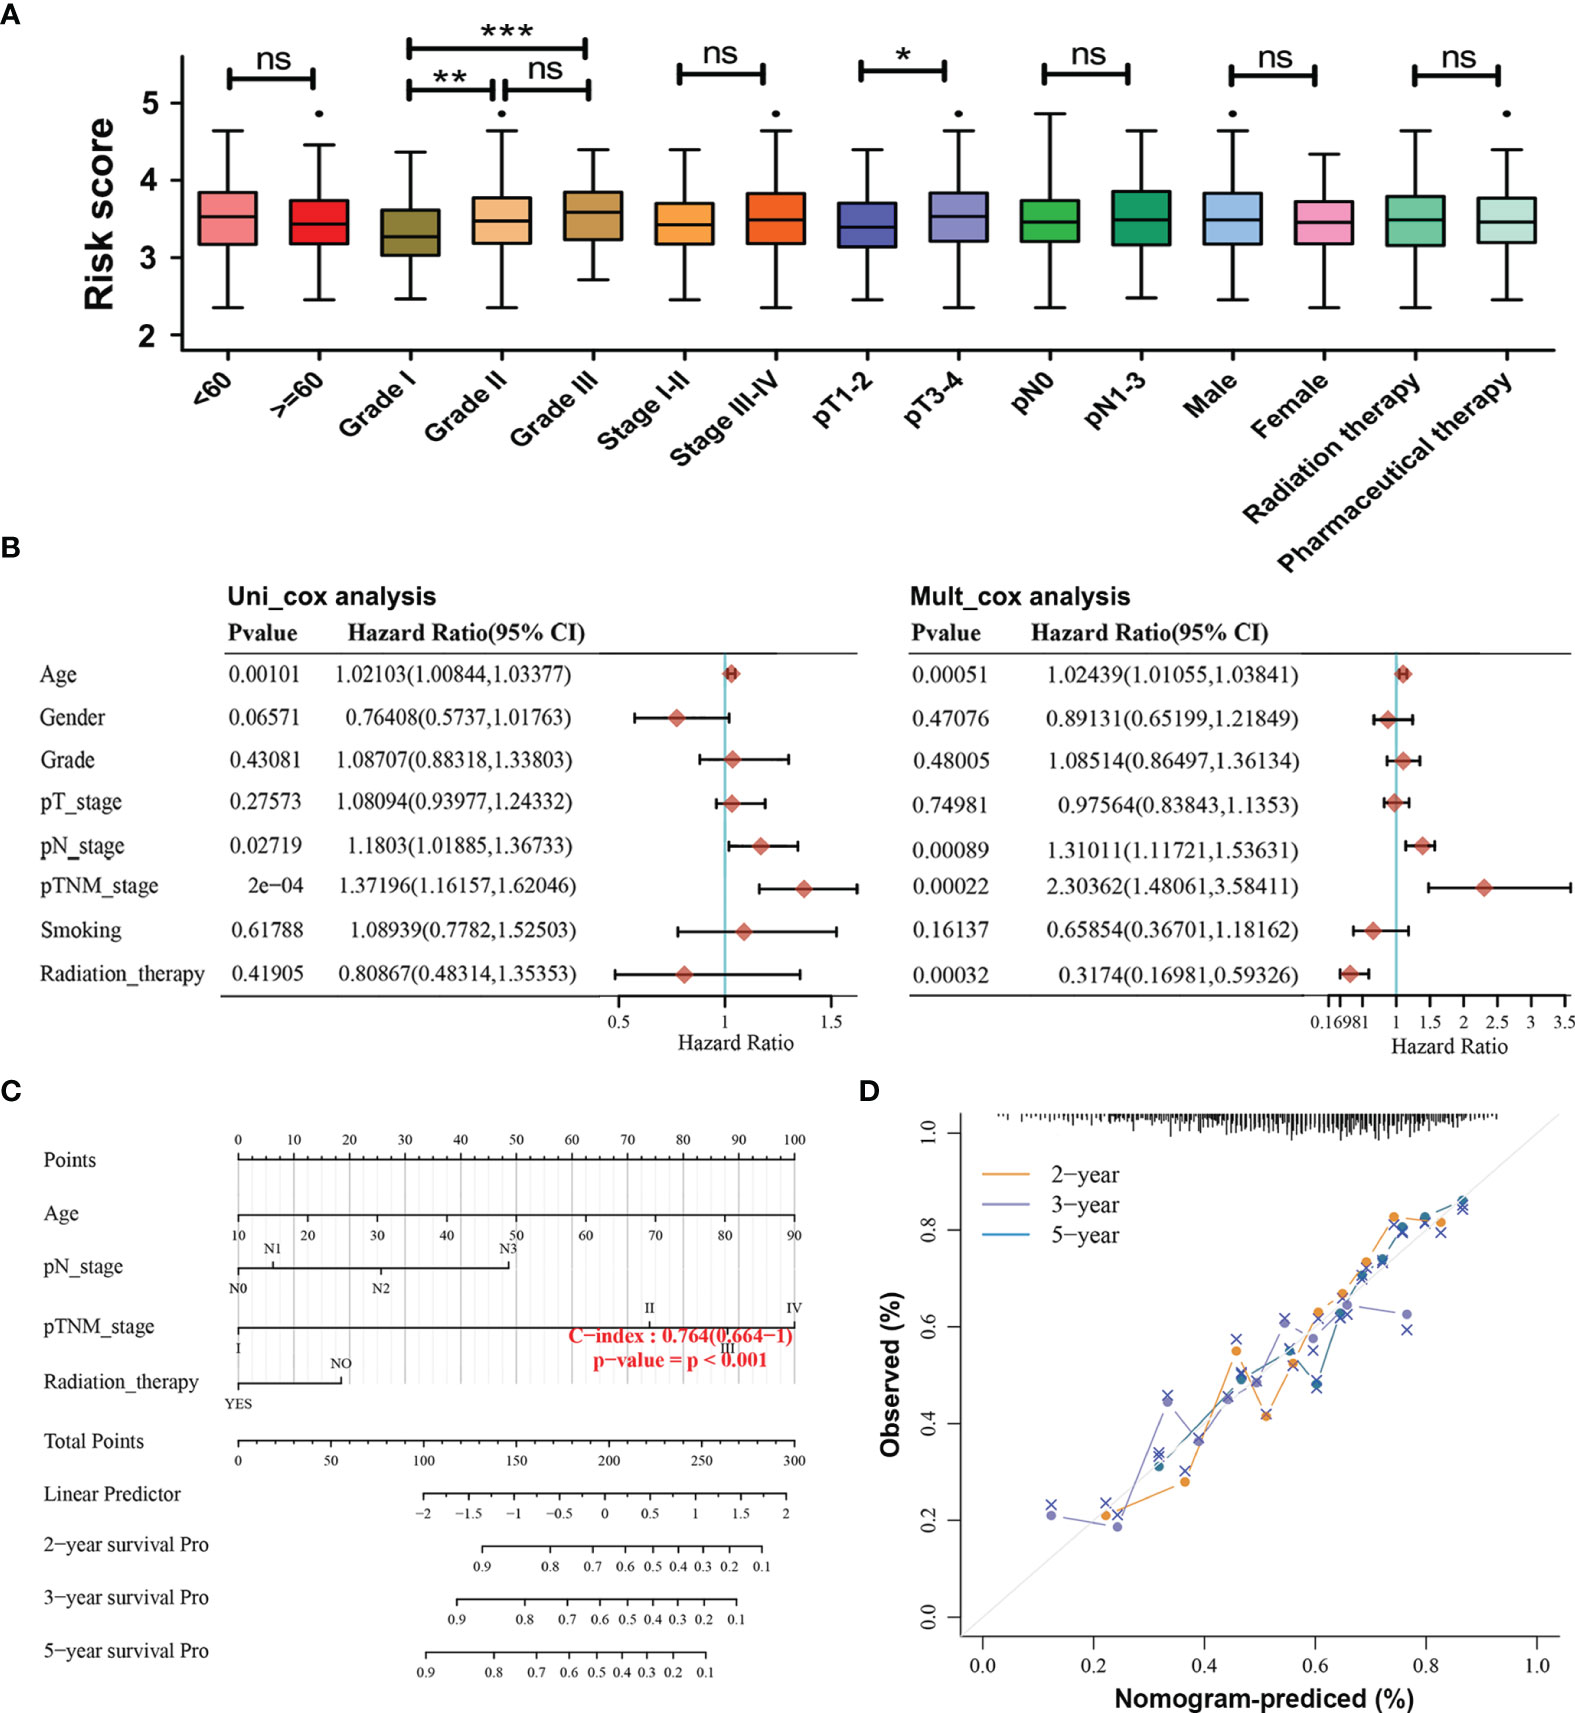
Figure 4 Associations of the risk model with the overall survival and clinicopathological characteristics of HNSCC patients. (A) Relationships between the risk score and clinicopathological characteristics of HNSCC patients. (ns) Non-significant, *p < 0.05, **p < 0.01, and ***p < 0.001. (B) Univariate and multivariate Cox analyses of clinical characteristics based on the training cohort. (C) The nomogram based on age, pathological N stage, pathological TNM stage, and radiation therapy for providing prognosis of HNSCC patients. (D) Calibration plots for the overall survival nomogram model. A dashed diagonal indicates the ideal nomogram, and the orange line, purple line, and blue line represent the predicted 2-year, 3-year, and 5-year overall survival of HNSCC patients.
Moreover, stratification survival analyses were performed to assess the predictive ability of the four-AG risk model for prognosis in multiple HNSCC subtypes sorted by age (<60 years and ≥60 years), gender (Men and Women), tumor grade (Grade I, Grade II, and Grade III), pathological TNM stage (Stages I–II and Stages III–IV), pathological T stage (T1–2 and T3–4), pathological N stage (N0 and N1–2), and therapy (Radiation therapy and Pharmaceutical therapy) (Figure 5). Comparison of survival curves conducted by log-rank (Mantel–Cox) test revealed that patients of the high-risk group presented a remarkably poorer OS than that of the low-risk group in all HNSCC subtypes (all p < 0.05; Figures 5A–I, K–O) except pathological T1–2 HNSCC subtype (p > 0.05, Figure 5J). These results suggested that the identified four-AG risk model has a reliable predictive value for the prognosis of HNSCC.
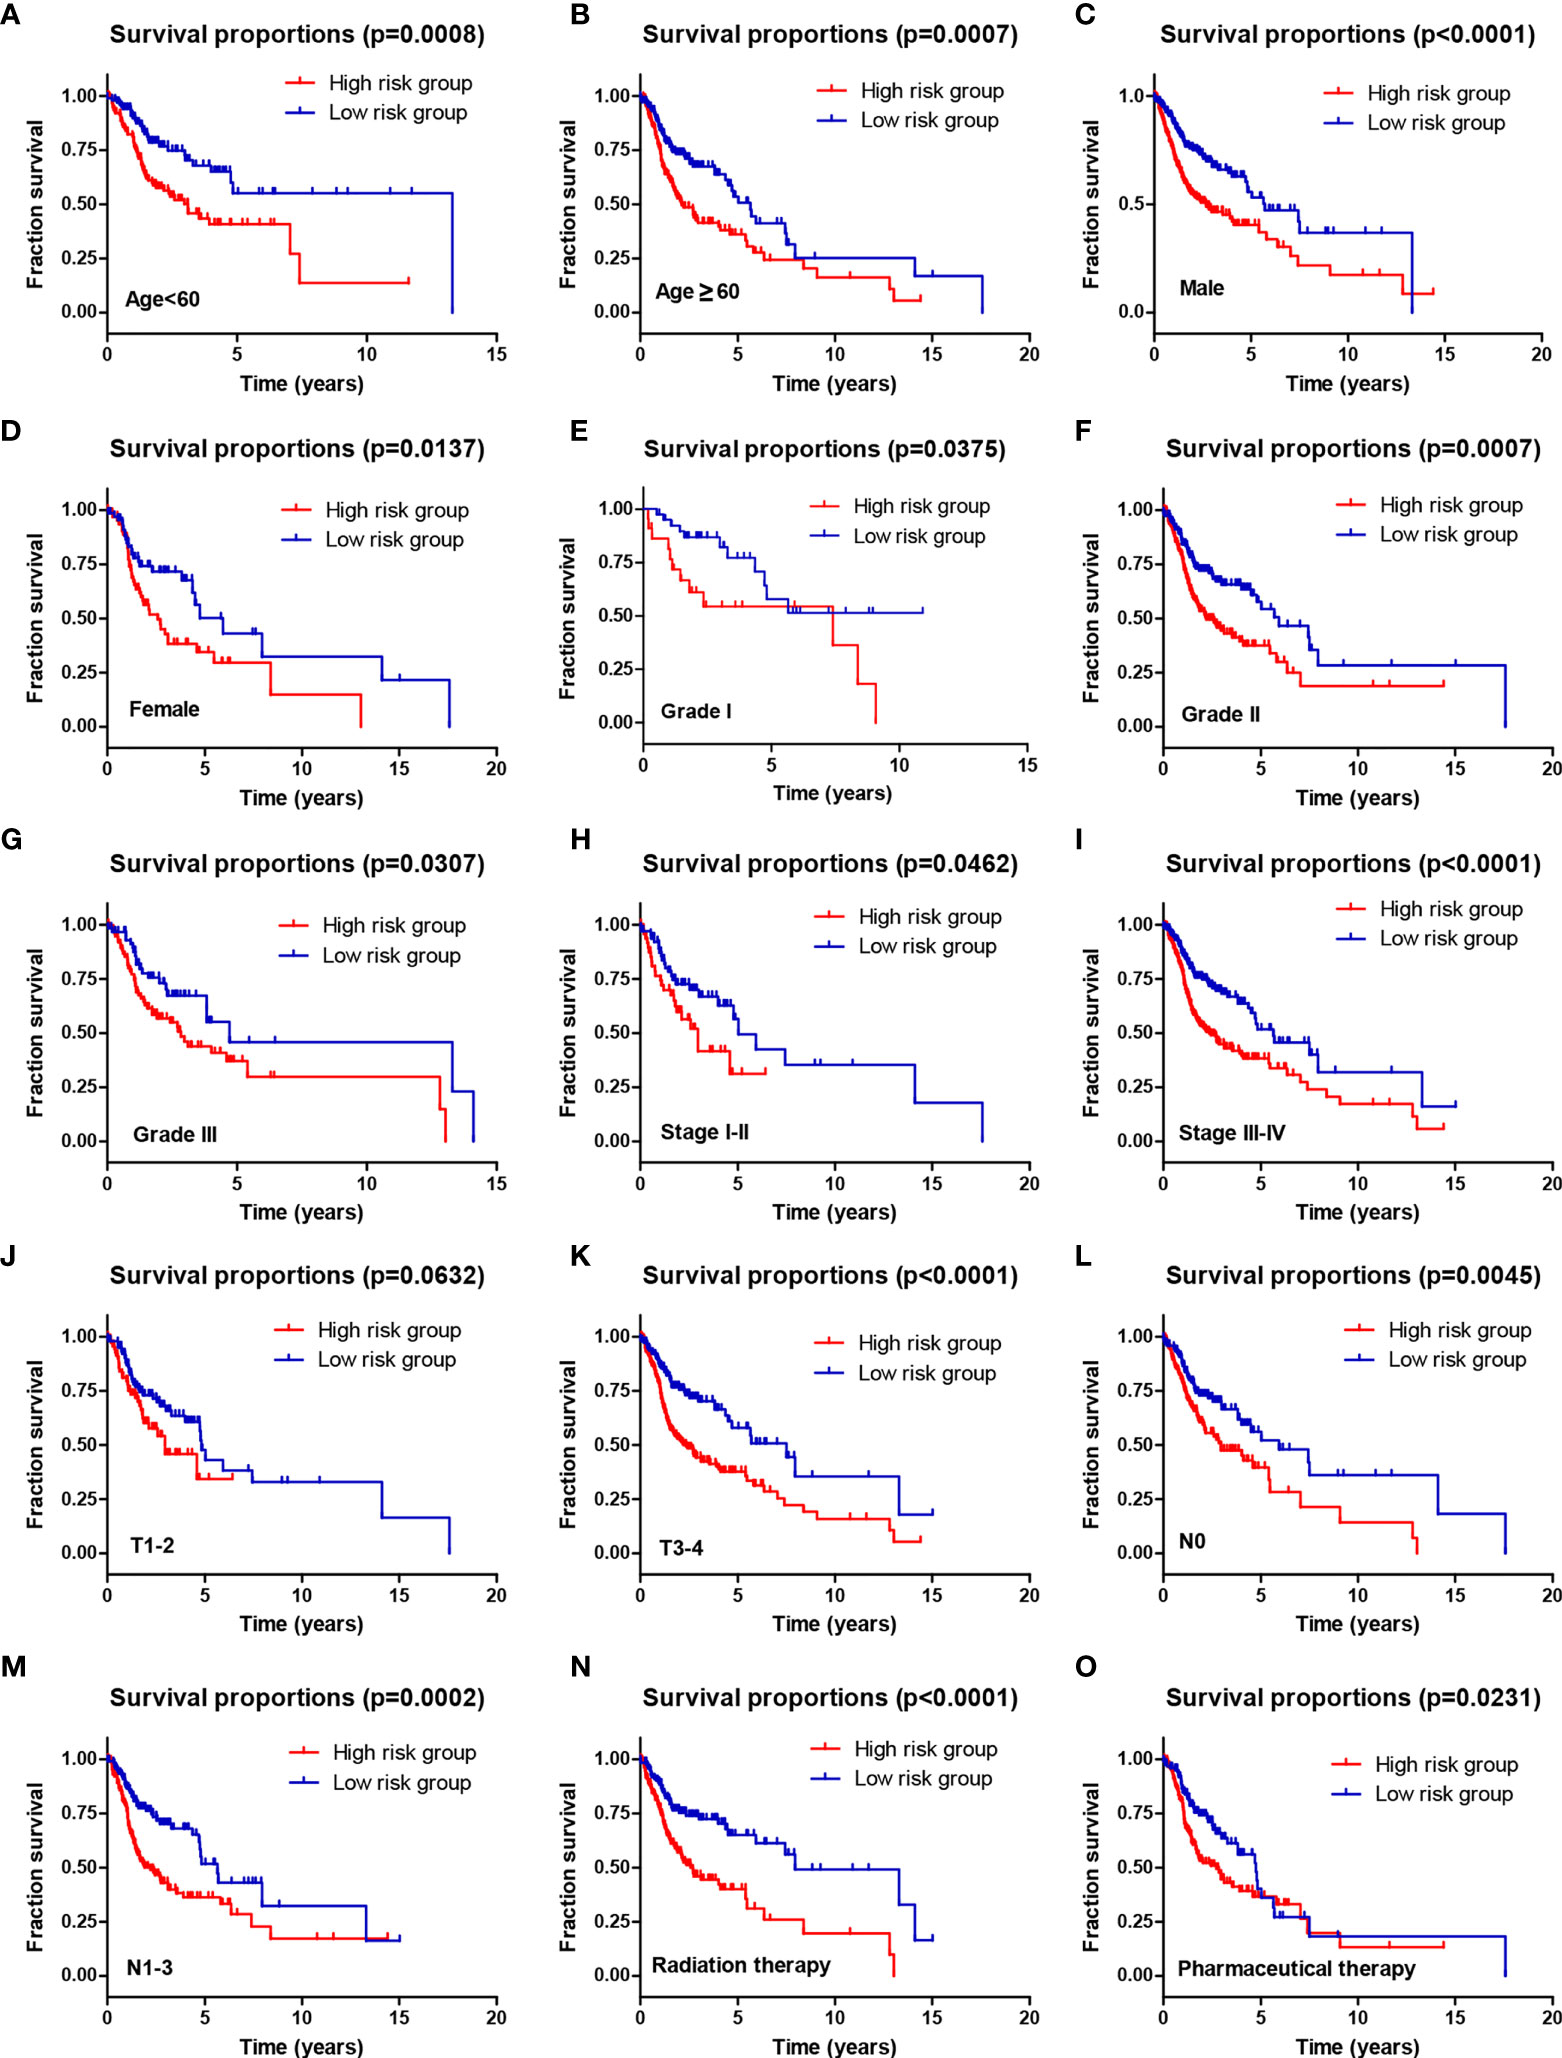
Figure 5 The prognostic ability of the four-AG signature for overall survival in multiple HNSCC subtypes. Kaplan–Meier curves for OS prediction in HNSCC subtypes of (A) Age <60 years, (B) Age ≥60 years, (C) Men, (D) Women, (E) Grade I, (F) Grade II, (G) Grade III, (H) Stages I–II, (I) Stages III–IV, (J) T1–2, (K) T3–4, (L) N0, (M) N1–3, (N) Radiation therapy, (O) Pharmaceutical therapy.
The association between the immune score and risk score was first investigated. The immune score in the high-risk group was notably lower than that in the low-risk group (p < 0.001) (Figure 6A). Subsequently, the differences in infiltration levels of 22 types of immune cells between high-risk and low-risk groups were evaluated using CIBERSORT formula (Figure 6B). Patients with HNSCC in the high-risk group contained lower infiltration levels of memory B cells (p < 0.05), CD8+ T cells (p < 0.001), follicular helper T cells (p < 0.001), regulatory T cells (Tregs) (p < 0.001), and activated mast cells (p < 0.001) while having higher infiltration levels of resting NK cells (p < 0.01), M0 macrophages (p < 0.01), M2 macrophages (p < 0.05), and resting mast cells (p < 0.001) than did those in the low-risk group. Then, the associations of the above nine types of immune cells with the selected AGs in the risk model were explored. HNSCC patients in the subtype of high BAK1 expression included lower infiltration levels of memory B cells (p < 0.001), follicular helper T cells (p < 0.001), Tregs (p < 0.001), and activated mast cells (p < 0.05) while having higher infiltration levels of resting NK cells (p < 0.05) and M2 macrophages (p < 0.05) (Figure 6C). HNSCC patients in the subtype of high DKK1 expression presented lower infiltration levels of memory B cells (p < 0.05), CD8+ T cells (p < 0.001), follicular helper T cells (p < 0.001), Tregs (p < 0.001), and activated mast cells (p < 0.05) while having higher infiltration levels of resting NK cells (p < 0.01), M0 macrophages (p < 0.05), and resting mast cells (p < 0.01) (Figure 6D). The results of CDKN2A, as a protective factor, showed that HNSCC patients with a high CDKN2A expression contained higher infiltration levels of CD8+ T cells (p < 0.05) and Tregs (p < 0.05) while having lower infiltration levels of M2 macrophages (p < 0.05) (Figure 6E). The results of MIF showed that only resting mast cells (p < 0.001) was positively associated with the expression of MIF (Figure 6F).
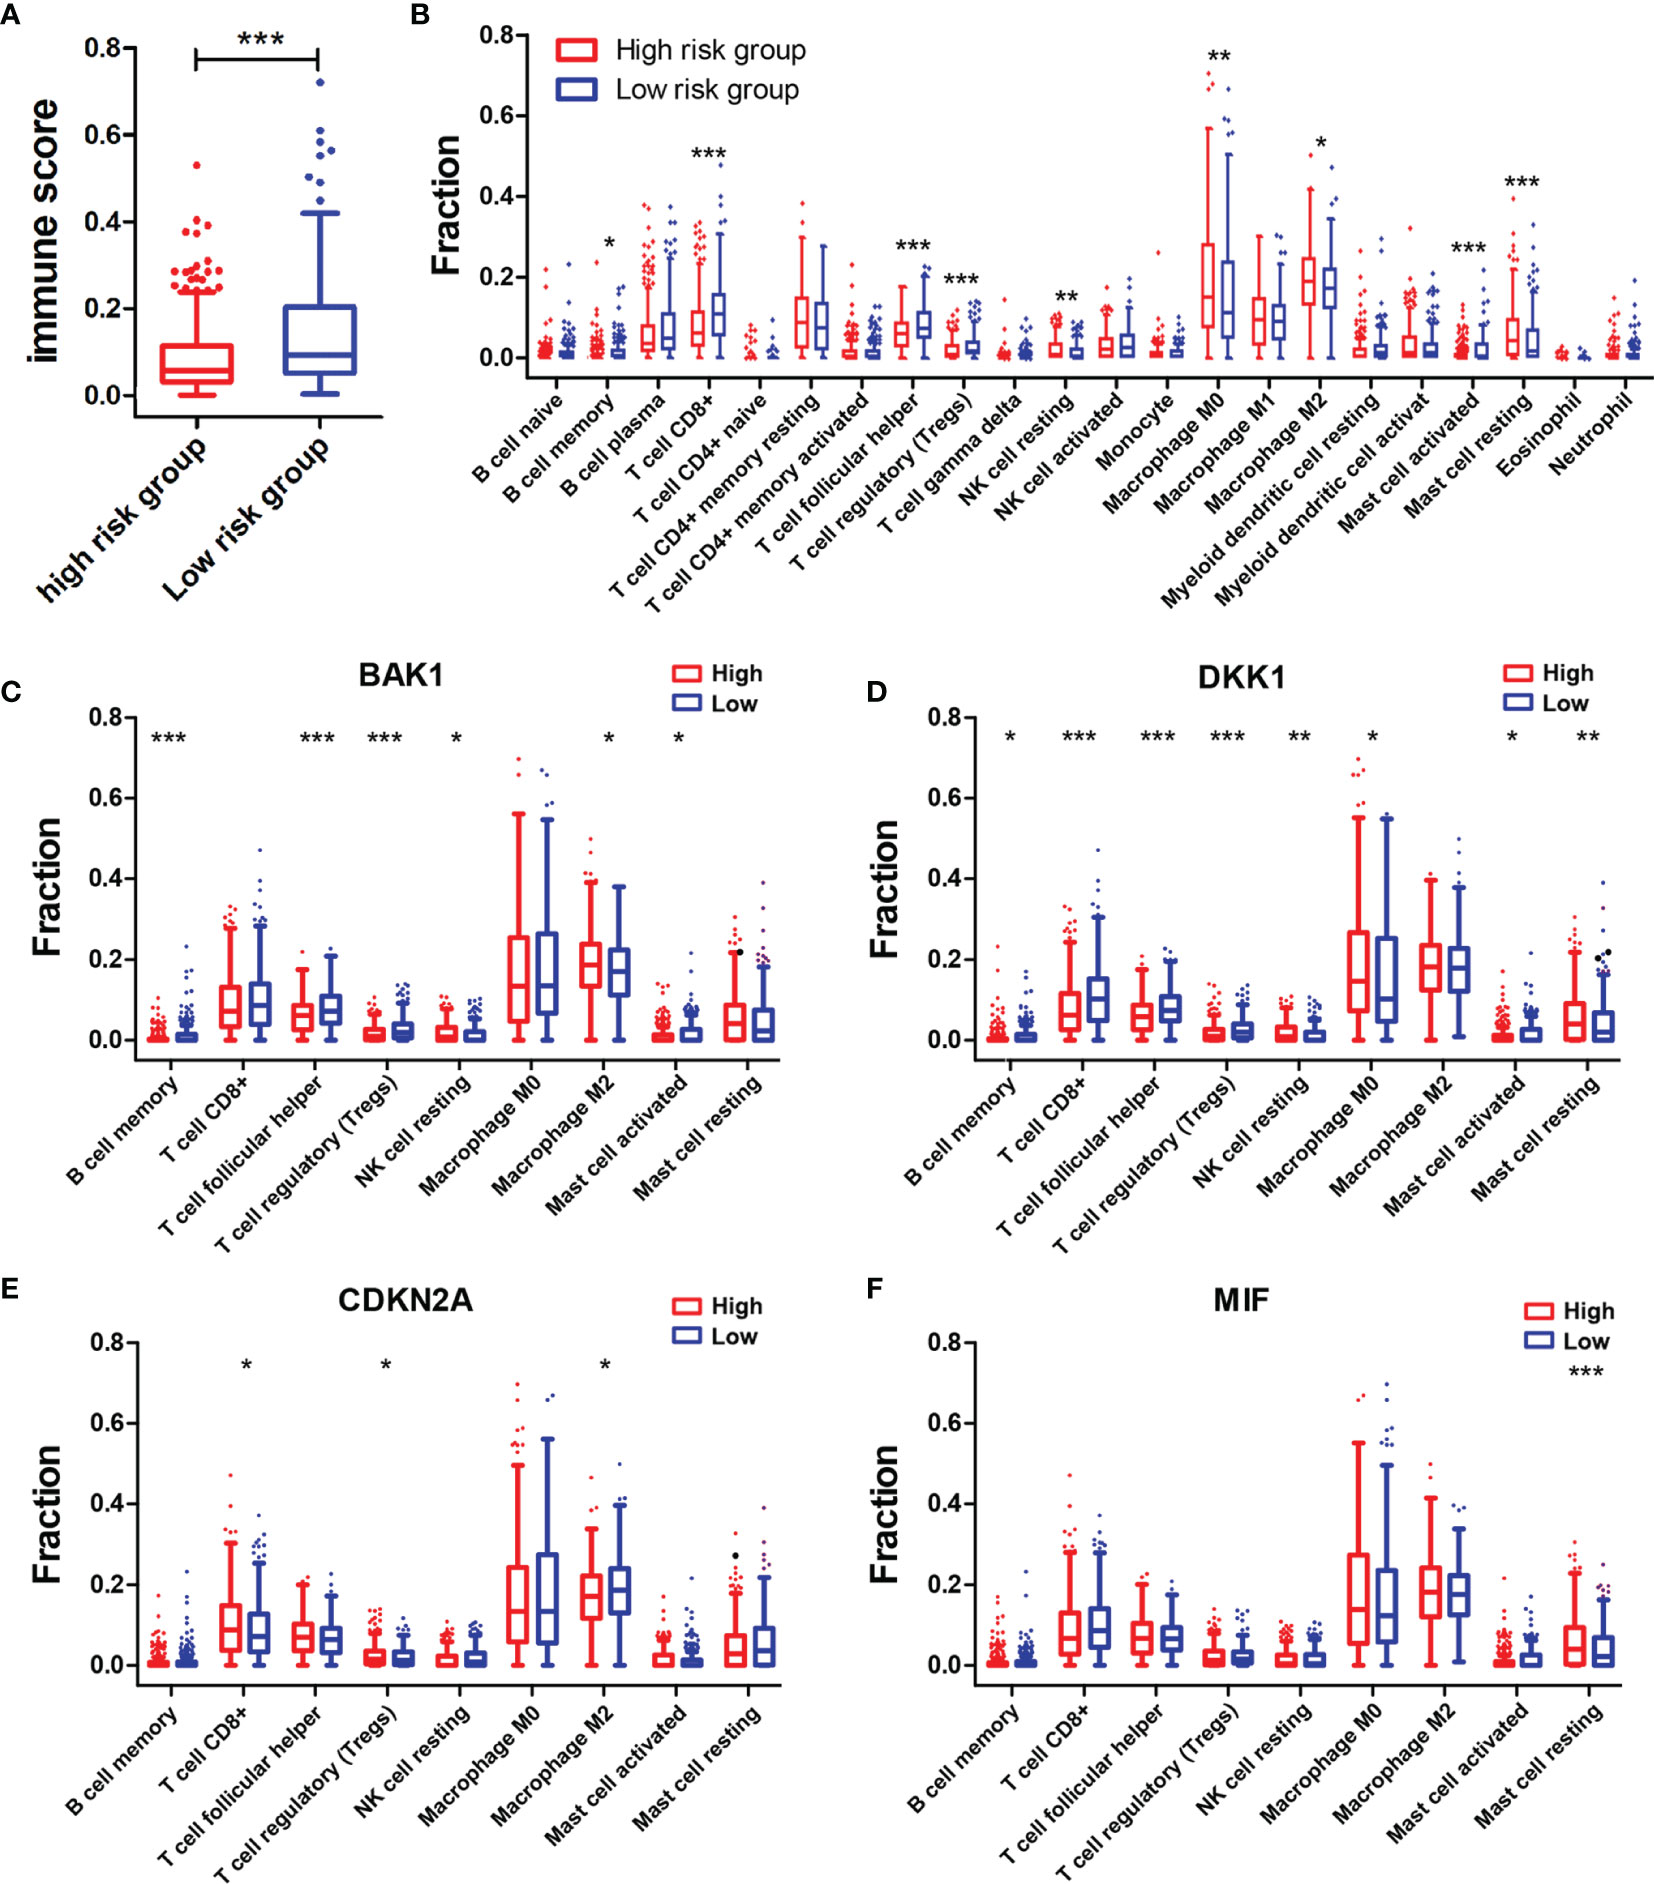
Figure 6 Associations of immune cell infiltration level with the risk score and the four selected AGs. (A) Comparison of immune scores in the high-risk and low-risk groups. (B) Comparison of compositional fractions of 22 types of immune cells between the high-risk and low-risk groups evaluated using the CIBERSORT formula. (C–F) Comparison of infiltration levels of nine types of immune cells according to BAK1 (C), DKK1 (D), CDKN2A (E), and MIF (F) expression levels. *p < 0.05, **p < 0.01, and ***p < 0.001.
In addition, correlation analysis of the risk score and infiltration levels of six types of immune cells was conducted based on the TIMER database to estimate the effect of the four-AG risk model on the TIME for HNSCC patients (Figure 7). Results showed that the risk score was negatively related to the infiltration of B cells (p < 0.001, Figure 7A), CD4+ T cells (p < 0.001, Figure 7B), and CD8+ T cells (p < 0.05, Figure 7C), whereas no significantly negative correlation was found between the risk score and infiltration of neutrophils (p > 0.05, Figure 7D), macrophages (p > 0.05, Figure 7E), and myeloid dendritic cells (p > 0.05, Figure 7F).
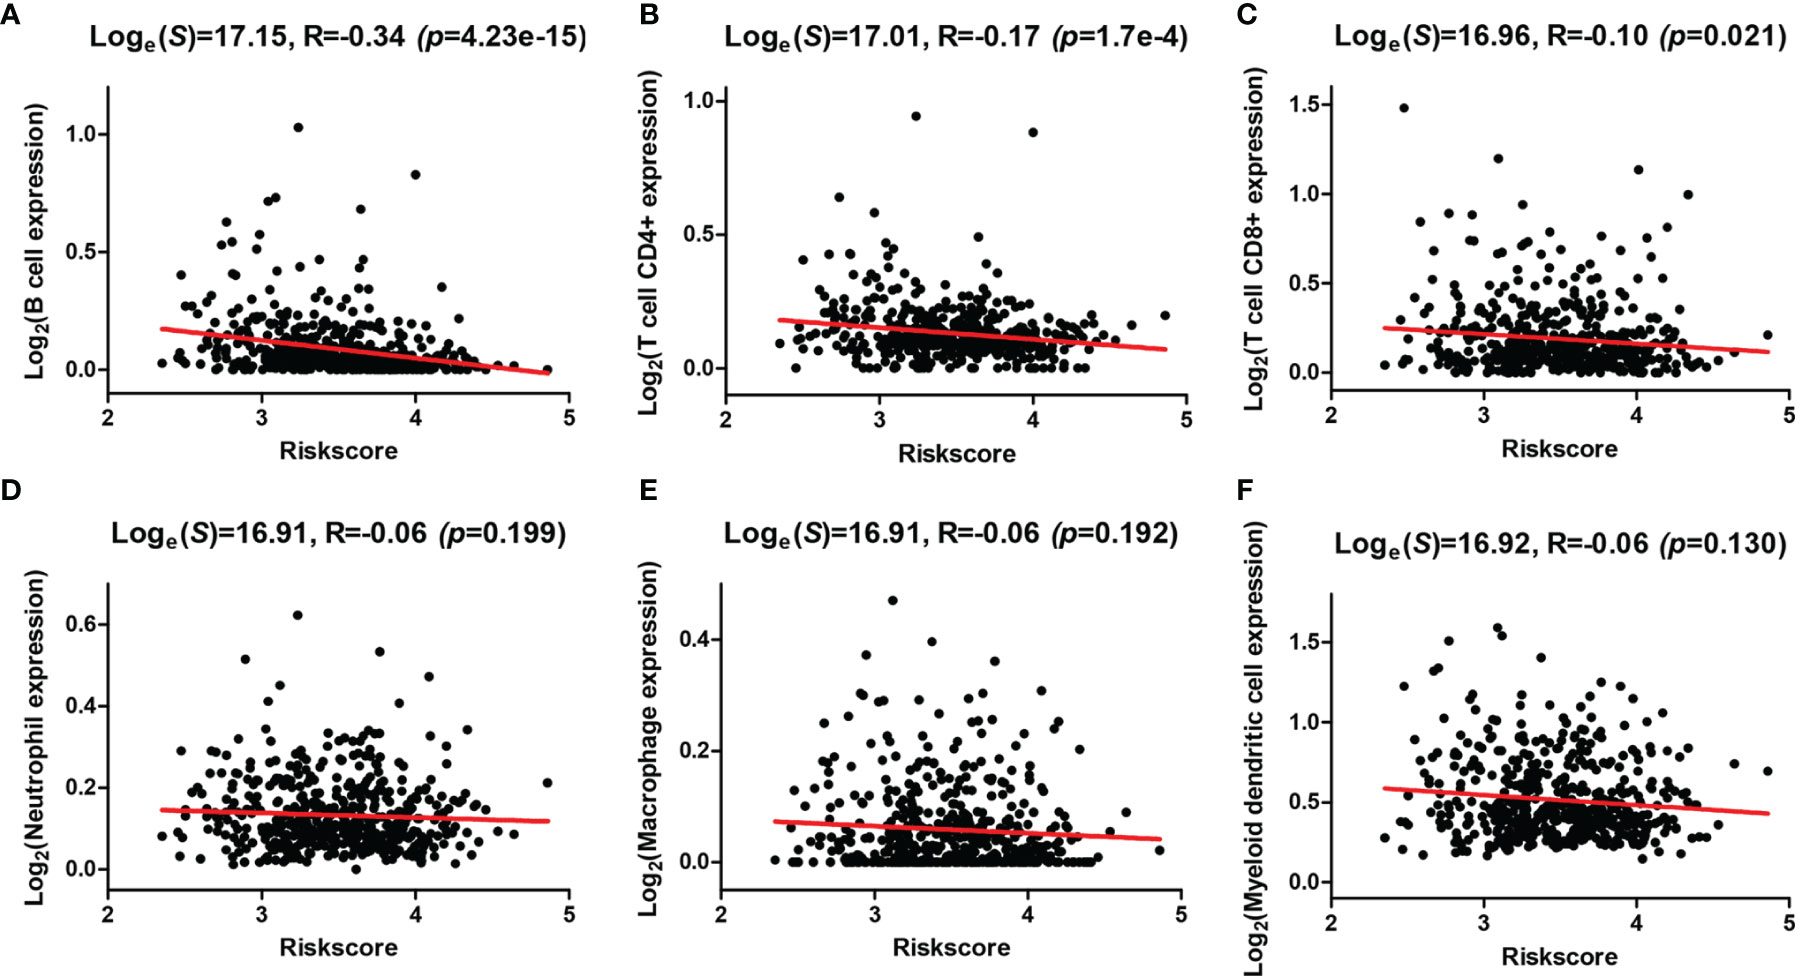
Figure 7 Correlations between the risk model and infiltration abundances of six types of immune cells. (A–F) Correlations between the risk score and six types of tumor-infiltrating immune cells including B cell (A), T-cell CD4+ (B), T cell CD8+ (C), neutrophil (D), macrophage (E), and myeloid dendritic cell (F).
To explore the mechanisms underlying AGs on the TIME in HNSCC, the relationships between the six types of immune cells and the four selected AGs were further investigated (Figure 8). HNSCC patients in the subtype of high BAK1 expression included significantly higher infiltration levels of CD8+ T cells (p < 0.05) and neutrophils (p < 0.001) while having a lower infiltration level of B cells (p < 0.001) than did those in the subtype of low BAK1 expression (Figure 8A). Only B cells were negatively related to the expression level of DKK1 (p <0.001, Figure 8B). But for CDKN2A, as a protective factor, only B cells were positively related to the expression level of CDKN2A (p < 0.05, Figure 8C). HNSCC patients of the high-MIF expression subtype showed a lower infiltration level of B cells, CD4+ T cells, CD8+ T cells, neutrophils, macrophages, and myeloid dendritic cells than did those of low-MIF expression subtype (all p < 0.05, Figure 8D). The four selected AGs in the risk model (BAK1, DKK1, CDKN2A, and MIF) were demonstrated to possess important functions in regulating the TIME of HNSCC.
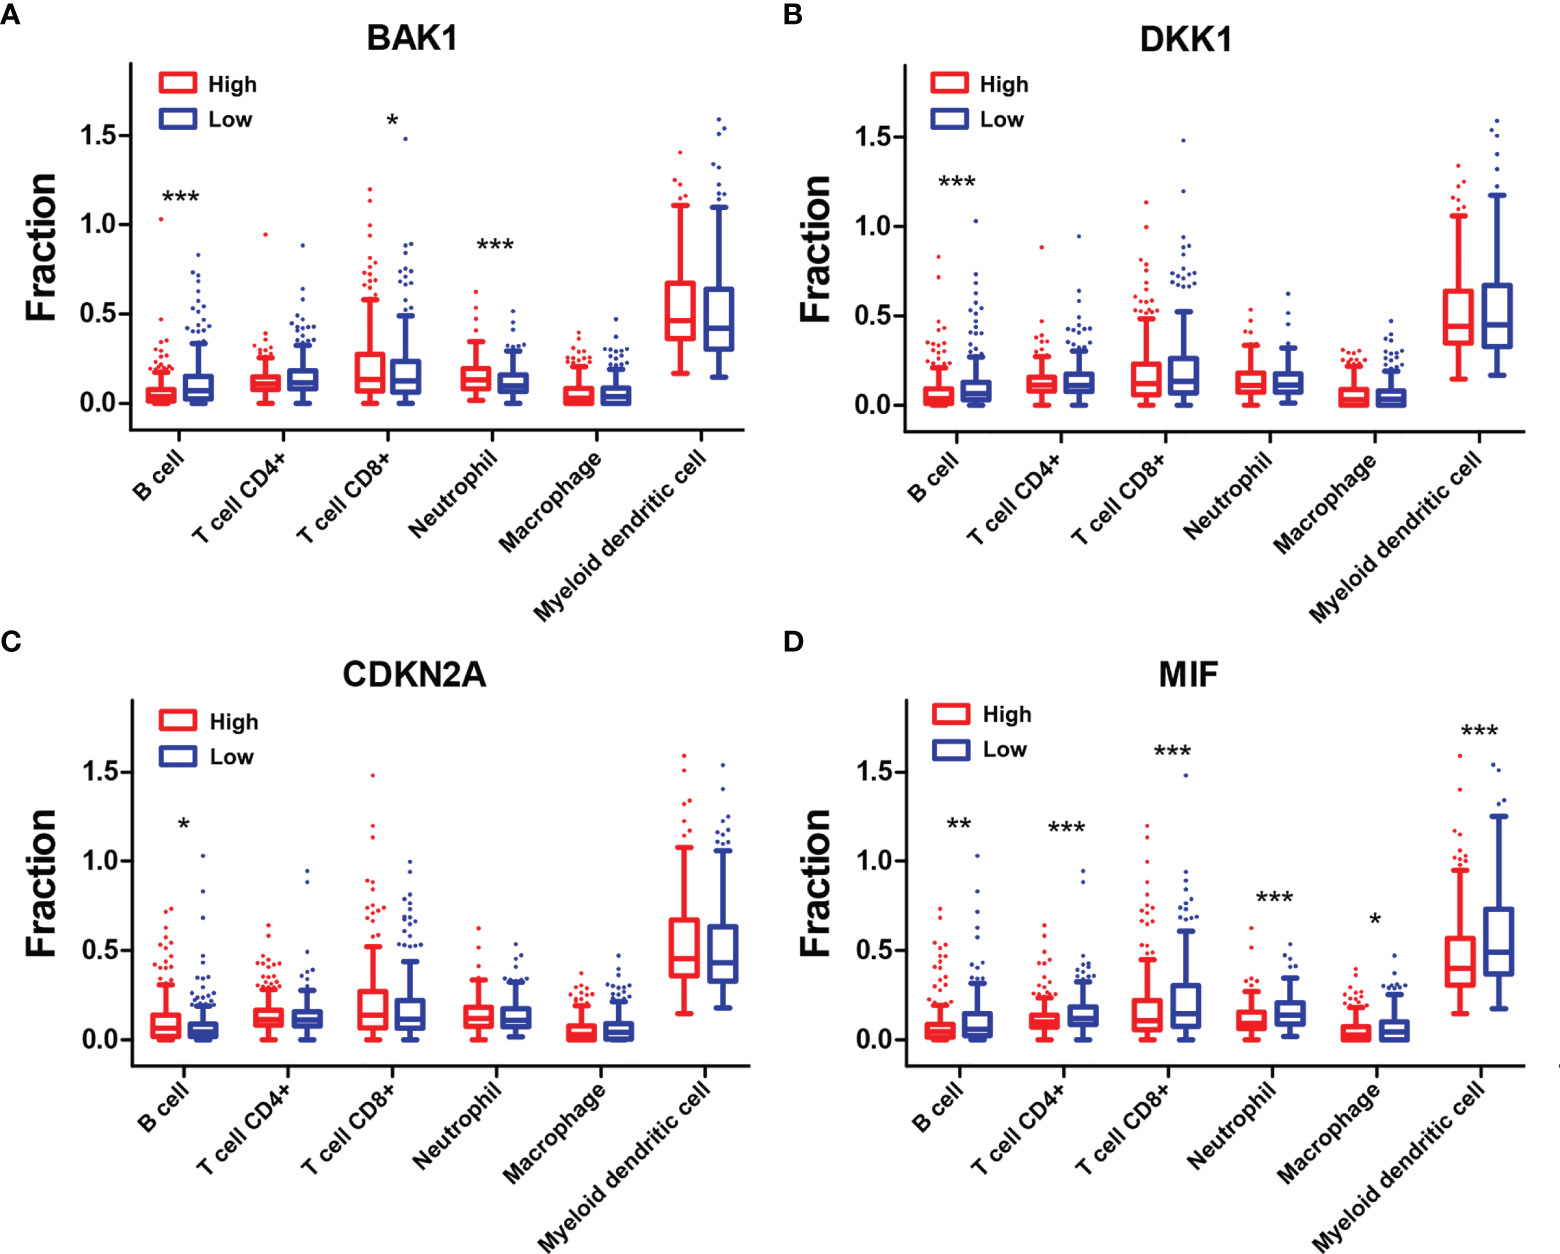
Figure 8 Association of six types of immune cells with the four selected AGs. (A–D) Comparison of six types of immune cells according to BAK1 (A), DKK1 (B), CDKN2A (C), and MIF (D) expression levels. *p < 0.05, **p < 0.01, and ***p < 0.001.
The expression levels of eight immune checkpoint genes including CD274, CTLA4, HAVCR2, LAG3, PDCD1, PDCD1LG2, TIGIT, and SIGLEC15 were calculated to explore the correlations of immune checkpoints with the risk score and the four selected AGs. The expressions of CTLA4, PDCD1, and TIGIT were found to be downregulated while PDCD1LG2 expression was found to be upregulated in the high-risk subtype (Figure 9A). BAK1 showed crucially positive correlations with the expression of CD274, LAG3, and PDCD1LG2 while having a negative correlation with SIGLEC15 expression (Figure 9B). DKK1 showed a positive relationship with the expression of PDCD1LG2 while having a negative relationship with the expression of TIGIT (p < 0.05, Figure 9C). CDKN2A revealed a positive correlation with PDCD1 expression (p < 0.05, Figure 9D). MIF revealed significantly negative correlations with the expressions of CD274, CTLA4, HAVCR2, PDCD1, PDCD1LG2, and TIGIT (p < 0.05, Figure 9E). Furthermore, the differences of ICB response scores in the high and low subtypes stratified by risk score and the four selected AGs were evaluated. Results revealed that the ICB response scores were crucially higher in the high-risk subtype, high-DKK1 expression subtype, and high-MIF expression subtype than those in the low subtypes (p < 0.001, Figure 9F).
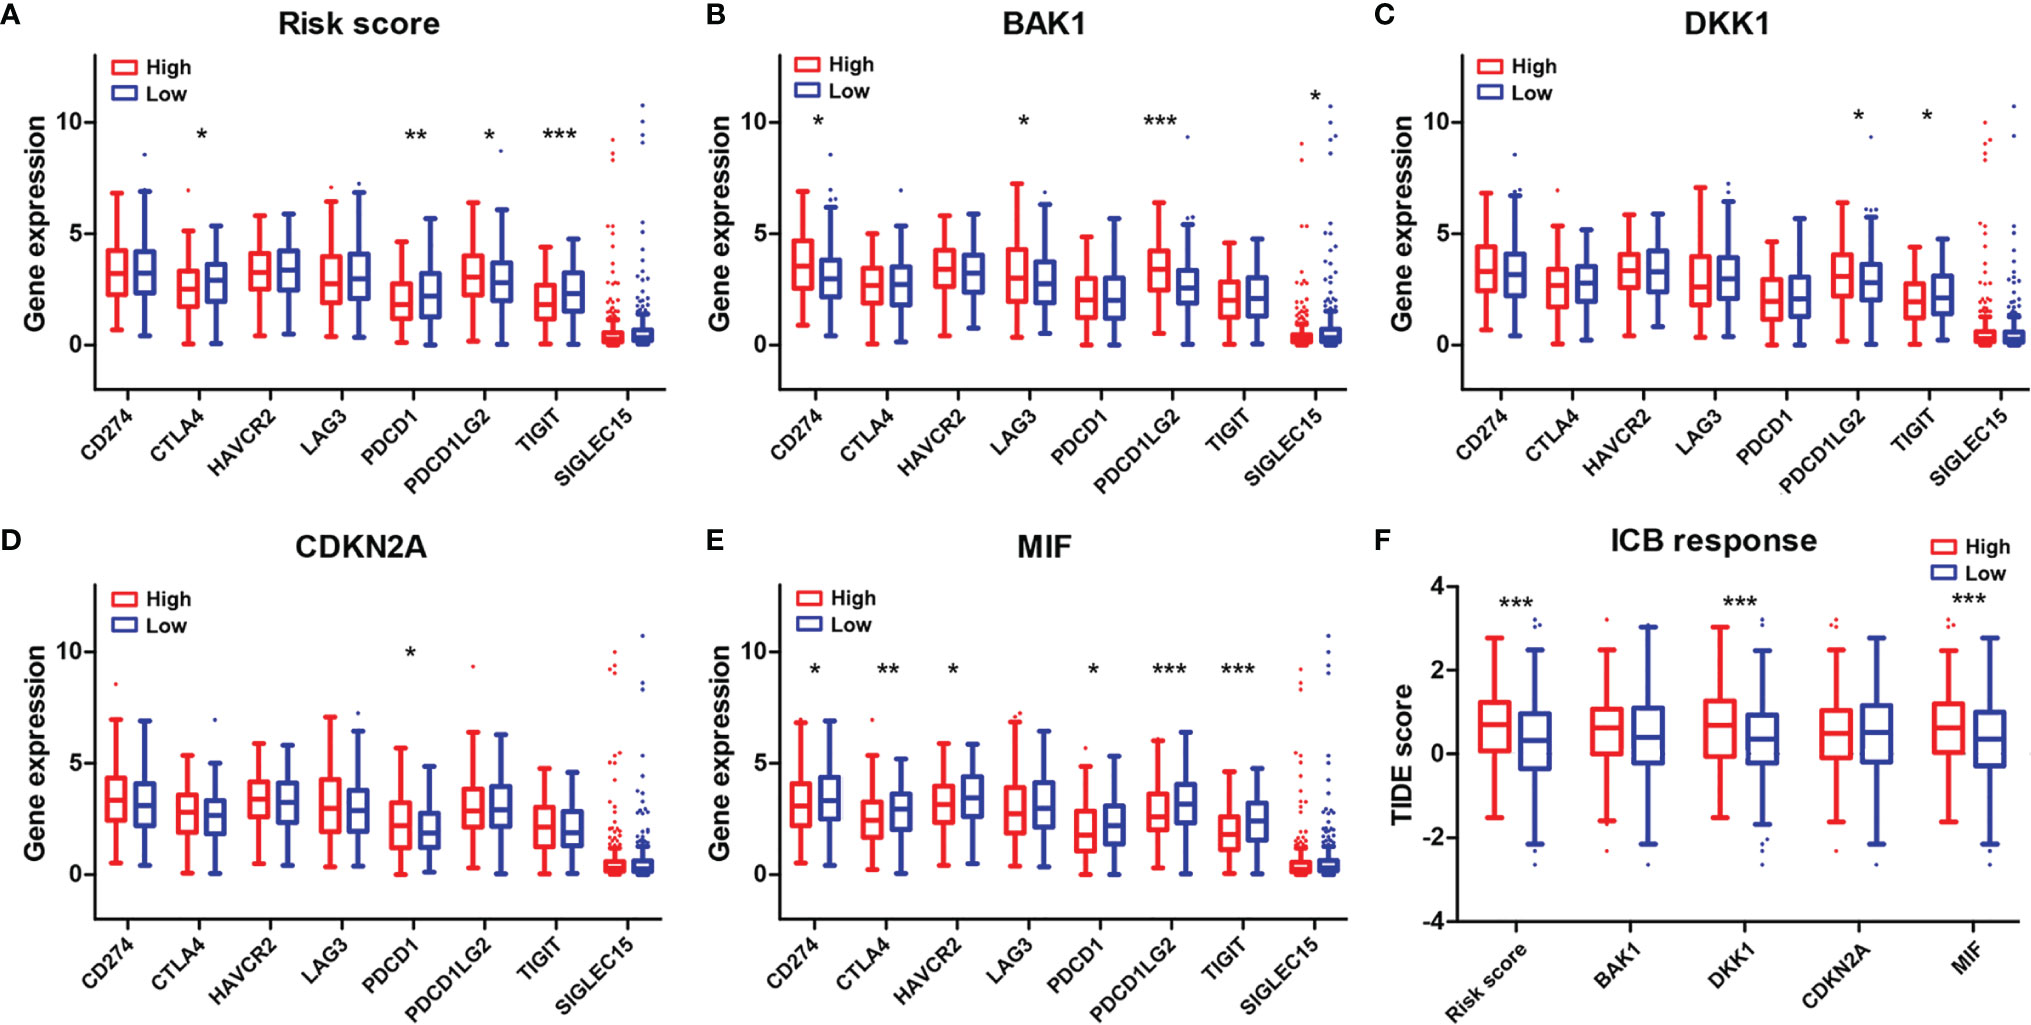
Figure 9 Association of the four-AG signature with immune checkpoints and ICB response scores. (A–E) Comparison of eight immune checkpoint genes in the high and low subtypes stratified by risk score (A) and expression levels of BAK1 (B), DKK1 (C), CDKN2A (D), and MIF (E). (F) Comparison of ICB response scores according to risk score (A) and expression levels of BAK1, DKK1, CDKN2A, and MIF. *p < 0.05, **p < 0.01, and ***p < 0.001.
The quality of life and life expectancy for HNSCC patients have been significantly improved by advances in robotic surgery, radiation and chemotherapy, immunotherapy, and molecular characterization of human cancers (3). However, the high mortality rate and outcomes of patients with advanced-stage HNSCC have remained mostly unchanged due to the lack of effective and reliable predictive biomarkers for monitoring HNSCC development (1, 3). Thus, the identification of novel disease-related prognostic biomarkers with adequate performance and clinical convenience in HNSCC is necessary to develop novel therapeutic approaches for improving treatment outcomes.
Studies have highlighted that many of the hallmarks of aging are the same as those of cancer, such as epigenetic changes, altered intracellular communication, changes in proteostasis, mitochondrial dysfunction, and cellular senescence (26). Some of these shared common characteristics, including increased accumulation of genomic damage, telomere attrition, epigenetic alteration, impaired proteostasis, and nutritional perception disorders, may be attributed to tumor progression (27–29). It has been demonstrated that age-dependent changes in inflammation and immune cell infiltration levels played important roles in tumor progression and malignancy (30). Therefore, systematically exploring the functions of AGs in the TIME is necessary to identify the function of the aging microenvironment in HNSCC progression. However, few studies to date have explored the associations of AGs with the TIME and the OS of patients with HNSCC.
In this study, we identified 41 differentially expressed AGs by GSEA based on the training (TCGA) dataset and further constructed a four-AG risk signature using the LASSO Cox regression analysis. It was confirmed that the risk model of the four selected AGs could be recognized as a satisfactory independent prognostic indicator for predicting the clinical outcomes of HNSCC patients. BAK1, DKK1, and MIF acted as risk factors while CDKN2A acted as a protective factor in the risk model. BAK1 played important roles in the mitochondrial apoptosis process, which could alter the permeability of the mitochondrial outer membrane to induce cell apoptosis (31). DKK1 is an antagonist of Wnt signaling, which regulates various cellular and biological processes that play important roles in cell senescence, cell apoptosis, differentiation, and metastasis in various tissues and numerous cancers (32, 33). Previous studies had shown that elevated expression of DKK1 was an independent adverse prognostic indicator of survival in HNSCC (34, 35). MIF has been determined as a pro-inflammatory cytokine that plays multiple roles in inflammation and angiogenesis and was associated with carcinogenesis (36). It had been reported that overexpression of MIF promoted tumor metastasis and was notably associated with poor prognosis of pancreatic ductal adenocarcinoma (37). Kindt etal. (38) demonstrated that the elevated expression of MIF resulted in tumor progression and poorer prognosis of HNSCC. For CDKN2A, it had been shown that methylation of CDKN2A was highly associated with HNSCC carcinogenesis and bad OS, which could be a diagnostic and prognostic indicator for HNSCC (39). In addition, it has been demonstrated that the copy number loss of CDKN2A could be an effective prognostic biomarker to independently predict poor survival in human papilloma virus (HPV)-negative HNSCC (40).
The clinic correlation analysis confirmed that the risk score was highly associated with tumor grade and pathological T stage. Notably, stratification survival analysis revealed that the four-AG risk signature possessed an accurate predictive value for prognosis in multiple HNSCC subtypes sorted by age, gender, tumor grade, pathological TNM stage, pathological T stage, pathological N stage, and therapy. Calibration curves for the 2-, 3-, and 5-year OS nomogram model showed good consistency between nomogram predictions and actual observations. Notably, the 2-, 3-, and 5-year AUC values of ROC curves for the four-AG signature in both the training and testing cohorts were higher than 0.65, which is better than those of previous prognostic signatures of the seven AGs for HNSCC (41). In addition, the total point of clinic efficacy in our nomogram is much higher than those of previously developed and validated models (8, 41). These results suggested that the identified four-AG risk model has a reliable predictive value for prognosis of HNSCC.
The TME in HNSCC harbors a complex interplay between tumor cells and stromal cells, including endothelial cells, cancer-associated fibroblasts (CAFs), and immune cells, which can promote HNSCC development (3). Numerous studies have reported that HNSCCs are highly infiltrated by immune cells, and different immunophenotypes combining several molecular features have been identified as classifiers for HNSCC, which might be useful in predicting response to different therapies, especially checkpoint inhibition (42, 43). Tumor-infiltrating lymphocytes [including T cells, B cells, and natural killer (NK) cells] and myeloid lineage cells (including macrophages, neutrophils, dendritic cells, and myeloid-derived suppressor cells) are the main immune components of the HNSCC TME (3). Previous studies showed that high levels of tumor-infiltrating lymphocytes were usually correlated with better prognosis of HNSCC depending on the balance of cells with antitumor activity vs. those with immunosuppressive activities (44, 45). Effector T cells and NK cells mainly regulated the antitumor immunity in the TME, whereas Tregs, myeloid dendritic cells, and M2 macrophages largely regulated the immune suppression and tumor cell growth. It had been proven that high infiltration levels of Tregs, myeloid dendritic cells, neutrophils, or M2 macrophages were related to advanced-stage HNSCC or bad OS, whereas high infiltration levels of CD8+ effector T cells and NK cells in the TME were related to better outcomes (46). In this study, patients of the high-risk group contained higher infiltration levels of resting NK cells, M0 macrophages, M2 macrophages, and resting mast cells while having lower infiltration levels of memory B cells, CD8+ T cells, follicular helper T cells, Tregs, and activated mast cells than did those of the low-risk group. In addition, negative correlations between the risk score and infiltration levels of the B cells, CD4+ T cells, CD8+ T cells, neutrophils, macrophages, and myeloid dendritic cells were observed based on TIMER database. All these data suggested that the integral index of the immunoscore obtained on the basis of the expression of the four AGs included in our prognostic signature and expression levels of these AGs are significantly correlated with immunosuppressive activity for HNSCC patients. To explore the mechanisms of AGs on the TIME, the correlations between the four selected AGs and immune cell infiltration levels were investigated. It was found that patients of subtypes of high BAK1 and DKK1 expressions contained lower infiltration levels of memory B cells, CD8+ T cells, follicular helper T cells, Tregs, and activated mast cells, suggesting a low immunosuppressive activity for HNSCC patients of the high-expression groups. Based on the TIMER database, HNSCC patients in the subtype of high BAK1 expression included significantly higher infiltration levels of CD8+ T cells and neutrophils while having a lower infiltration level of B cells. HNSCC patients of the high-MIF expression subtype showed a lower infiltration level of B cells, CD4+ T cells, CD8+ T cells, neutrophils, macrophages, and myeloid dendritic cells than did those of the low-MIF expression subtype. Results showed that the selected AGs in our risk model (BAK1, DKK1, and MIF) were negatively related to the infiltration levels of tumor-infiltrating lymphocytes (including T cells, B cells, and macrophages), suggesting a low immunosuppressive activity for HNSCC patients of the high-risk groups.
Furthermore, we illustrated the relationships of immune checkpoints with the risk score and the four selected AGs to predict the response to different therapies, particularly checkpoint inhibition. The immune checkpoint molecule is an inhibitory regulatory molecule in the immune system, which is essential for maintaining self-tolerance, preventing autoimmune response, and minimizing tissue damage by controlling the time and intensity of the immune response (47). Immune checkpoint molecules expressed on immune cells will inhibit the function of immune cells and prevent the body from producing effective antitumor immune responses, which can result in tumor immune escape (48). Thus, the decreased expression of immune checkpoints may prevent tumor immune escape to improve the outcomes of immunotherapy. Our results showed that the expressions of CTLA4, PDCD1, and TIGIT were found to be downregulated in the high-risk subtype; BAK1 showed crucially positive correlations with the expressions of CD274, LAG3, and PDCD1LG2 while having a negative correlation with SIGLEC15 expression; DKK1 showed a positive relationship with the expression of PDCD1LG2 while having a negative relationship with the expression of TIGIT; CDKN2A revealed a positive correlation with PDCD1 expression; and MIF revealed significantly negative correlations with the expressions of CD274, CTLA4, HAVCR2, PDCD1, PDCD1LG2, and TIGIT. Hence, the four selected AGs in our risk model (BAK1, DKK1, CDKN2A, and MIF) performed important functions on immune checkpoint expressions, which might be regarded as potential targets to improve the outcomes of immunotherapy by downregulating the expressions of immune checkpoints.
Moreover, the relationships of the ICB response score (TIDE score) with the risk score and the four selected AGs were evaluated. TIDE uses a set of gene expression markers to evaluate two different tumor immune escape mechanisms, including the dysfunction of tumor-infiltrating cytotoxic T lymphocytes (CTLs) and the rejection of CTLs by immunosuppressive factors (24). The high ICB response score indicates the poor efficacy of the immune checkpoint-blocking therapy (ICB) and the short survival period after receiving ICB treatment. Our results revealed that the ICB response scores were crucially higher in the high-risk subtype, high-DKK1 expression subtype, and high-MIF expression subtype than those in the low subtypes, which suggest poor immunotherapy efficacy for patients with HNSCC in the high-risk groups.
Nevertheless, there are several limitations in this study. First, the risk signature of the four AGs was obtained and validated based on TCGA datasets. The prognostic value of the AG-related signature in HNSCC patients has not been externally validated due to the lack of our own adequate available data. External validation should be performed based on our own clinic data in the future. Second, the relationship between the risk signature and the immune cell infiltration level and the role of the AG-related signature in immunotherapy efficacy were revealed via comprehensive bioinformatics analysis. More in vitro and in vivo experiments are needed to confirm these conclusions. Laboratory experiments will be done in future research to validate the specific roles of the AG-related signature in immunotherapy efficacy for patients with HNSCC.
In conclusion, our study constructed a risk signature of four AGs that could be utilized as an independent prognostic indicator for HNSCC patients and showed important functions in immunosuppression of HNSCC. Meanwhile, the AG-related signature might provide potential targets to improve the outcomes of immunotherapy.
The datasets presented in this study can be found in online repositories. The names of the repository/repositories and accession number(s) can be found in the article/Supplementary Material.
FC and JL contributed to conception and design of the study. FC, XG, and MX organized the database and performed the statistical analysis. FC wrote the first draft of the article. FY, JW, and CY wrote sections of the article. All authors contributed to article revision and read and approved the submitted version.
This work was supported by grants from the Science and Technology Planning Project of Guangzhou (202102010041) and Health Science and Technology Project of Guangzhou (20211A010014).
The authors declare that the research was conducted in the absence of any commercial or financial relationships that could be construed as a potential conflict of interest.
All claims expressed in this article are solely those of the authors and do not necessarily represent those of their affiliated organizations, or those of the publisher, the editors and the reviewers. Any product that may be evaluated in this article, or claim that may be made by its manufacturer, is not guaranteed or endorsed by the publisher.
The Supplementary Material for this article can be found online at: https://www.frontiersin.org/articles/10.3389/fonc.2022.857994/full#supplementary-material
1. Bray F, Ferlay J, Soerjomataram I, Siegel RL, Torre LA, Jemal A. Global Cancer Statistics 2018: GLOBOCAN Estimates of Incidence and Mortality Worldwide for 36 Cancers in 185 Countries. CA: A Cancer J Clin (2018) 68(6):394–424. doi: 10.3322/caac.21492
2. Windon MJ, D’Souza G, Rettig EM, Westra WH, van Zante A, Wang SJ, et al. Increasing Prevalence of Human Papillomavirus-Positive Oropharyngeal Cancers Among Older Adults. Cancer (2018) 124(14):2993–9. doi: 10.1002/cncr.31385
3. Johnson DE, Burtness B, Leemans CR, Lui VWY, Bauman JE, Grandis JR. Head and Neck Squamous Cell Carcinoma. Nat Rev Dis Primers (2020) 6(1):92. doi: 10.1038/s41572-020-00224-3
4. Li Y, Wu T, Gong S, Zhou H, Yu L, Liang M, et al. Analysis of the Prognosis and Therapeutic Value of the CXC Chemokine Family in Head and Neck Squamous Cell Carcinoma. Front Oncol (2021) 10:570736. doi: 10.3389/fonc.2020.570736
5. Klapper L, Ribbat-Idel J, Kuppler P, Paulsen FO, Bruchhage KL, Rades D, et al. NR2F6 as a Prognostic Biomarker in HNSCC. Int J Mol Sci (2020) 21(15):5527. doi: 10.3390/ijms21155527
6. Fang J, Yang Z, Xie J, Li Z, Hu C, Yang M, et al. Identification and Validation of Autophagy-Related Prognostic Signature for Head and Neck Squamous Cell Carcinoma. Trans Oncol (2021) 14(7):101094. doi: 10.1016/j.tranon.2021.101094
7. Guo Q, Zhang X, Shen T, Wang X. Identification of Autophagy- and Ferroptosis-Related lncRNAs Functioned Through Immune-Related Pathways in Head and Neck Squamous Carcinoma. Life-Basel (2021) 11(8):835. doi: 10.3390/life11080835
8. Li Q, Wang J, Meng X, Chen W, Feng J, Mao J. Identification of Autophagy-Related Gene and lncRNA Signatures in the Prognosis of HNSCC. Oral Dis (2021) 00:1–16. doi: 10.1111/odi.13889
9. Pulluri B, Kumar A, Shaheen M, Jeter J, Sundararajan S. Tumor Microenvironment Changes Leading to Resistance of Immune Checkpoint Inhibitors in Metastatic Melanoma and Strategies to Overcome Resistance. Pharmacol Res (2017) 123:95–102. doi: 10.1016/j.phrs.2017.07.006
10. Bendtsen SK, Perez-Penco M, Hubbe ML, Martinenaite E, Holmstrom MO, Weis-Banke SE, et al. Peptide Vaccination Activating Galectin-3-Specific T Cells Offers a Novel Means to Target Galectin-3-Expressing Cells in the Tumor Microenvironment. Oncoimmunology (2022) 11(1):2026020. doi: 10.1080/2162402x.2022.2026020
11. Pearce OMT, Delaine-Smith RM, Maniati E, Nichols S, Wang J, Bohm S, et al. Deconstruction of a Metastatic Tumor Microenvironment Reveals a Common Matrix Response in Human Cancers. Cancer Discov (2018) 8(3):304–19. doi: 10.1158/2159-8290.cd-17-0284
12. Sadeghi Rad H, Monkman J, Warkiani ME, Ladwa R, O’Byrne K, Rezaei N, et al. Understanding the Tumor Microenvironment for Effective Immunotherapy. Med Res Rev (2021) 41(3):1474–98. doi: 10.1002/med.21765
13. Elias R, Karantanos T, Sira E, Hartshorn KL. Immunotherapy Comes of Age: Immune Aging & Checkpoint Inhibitors. J Geriatric Oncol (2017) 8(3):229–35. doi: 10.1016/j.jgo.2017.02.001
14. Elias R, Hartshorn K, Rahma O, Lin N, Snyder-Cappione JE. Aging, Immune Senescence, and Immunotherapy: A Comprehensive Review. Semin Oncol (2018) 45(4):187–200. doi: 10.1053/j.seminoncol.2018.08.006
15. Fane M, Weeraratna AT. How the Ageing Microenvironment Influences Tumour Progression. Nat Rev Cancer (2020) 20(2):89–106. doi: 10.1038/s41568-019-0222-9
16. Lopez-Otin C, Blasco MA, Partridge L, Serrano M, Kroemer G. The Hallmarks of Aging. Cell (2013) 153(6):1194–217. doi: 10.1016/j.cell.2013.05.039
17. Leonardi GC, Accardi G, Monastero R, Nicoletti F, Libra M. Ageing: From Inflammation to Cancer. Immun Ageing (2018) 15:1. doi: 10.1186/s12979-017-0112-5
18. Olivieri F, Prattichizzo F, Grillari J, Balistreri CR. Cellular Senescence and Inflammaging in Age-Related Diseases. Mediators Inflamm (2018) 2018:9076485. doi: 10.1155/2018/9076485
19. Ovadya Y, Landsberger T, Leins H, Vadai E, Gal H, Biran A, et al. Impaired Immune Surveillance Accelerates Accumulation of Senescent Cells and Aging. Nat Commun (2018) 9:5435. doi: 10.1038/s41467-018-07825-3
20. Lee S, Schmitt CA. The Dynamic Nature of Senescence in Cancer. Nat Cell Biol (2019) 21(1):94–101. doi: 10.1038/s41556-018-0249-2
21. Yoshihara K, Shahmoradgoli M, Martinez E, Vegesna R, Kim H, Torres-Garcia W, et al. Inferring Tumour Purity and Stromal and Immune Cell Admixture From Expression Data. Nat Commun (2013) 4:2612. doi: 10.1038/ncomms3612
22. Newman AM, Liu CL, Green MR, Gentles AJ, Feng W, Xu Y, et al. Robust Enumeration of Cell Subsets From Tissue Expression Profiles. Nat Methods (2015) 12(5):453–+. doi: 10.1038/nmeth.3337
23. Li T, Fu J, Zeng Z, Cohen D, Li J, Chen Q, et al. TIMER2.0 for Analysis of Tumor-Infiltrating Immune Cells. Nucleic Acids Res (2020) 48(W1):W509–14. doi: 10.1093/nar/gkaa407
24. Jiang P, Gu S, Pan D, Fu J, Sahu A, Hu X, et al. Signatures of T Cell Dysfunction and Exclusion Predict Cancer Immunotherapy Response. Nat Med (2018) 24(10):1550–+. doi: 10.1038/s41591-018-0136-1
25. Berkman SJ, Roscoe EM, Bourret JC. Comparing Self-Directed Methods for Training Staff to Create Graphs Using Graphpad Prism. J Appl Behav Anal (2019) 52(1):188–204. doi: 10.1002/jaba.522
26. Aunan JR, Cho WC, Soreide K. The Biology of Aging and Cancer: A Brief Overview of Shared and Divergent Molecular Hallmarks. Aging Dis (2017) 8(5):628–42. doi: 10.14336/ad.2017.0103
27. Campisi J. “Aging, Cellular Senescence, and Cancer,”. In: Annual Review of Physiology, Vol 75, Julius D., Editor. ANNUAL REVIEWS, CA, (2013) 75:685–705.
28. Zinger A, Cho WC, Ben-Yehuda A. Cancer and Aging - the Inflammatory Connection. Aging Dis (2017) 8(5):611–27. doi: 10.14336/ad.2016.1230
29. Yasuda T, Baba H, Ishimoto T. Cellular Senescence in the Tumor Microenvironment and Context-Specific Cancer Treatment Strategies. FEBS J (2021). doi: 10.1111/febs.16231
30. Kuilman T, Michaloglou C, Vredeveld LCW, Douma S, van Doom R, Desmet CJ, et al. Oncogene-Induced Senescence Relayed by an Interleukin-Dependent Inflammatory Network. Cell (2008) 133(6):1019–31. doi: 10.1016/j.cell.2008.03.039
31. Yang X, Tang S, Li D, Yu X, Wang F, Xiao X. DIDS Inhibits Overexpression BAK1-Induced Mitochondrial Apoptosis Through GSK3/-Catenin Signaling Pathway. J Cell Physiol (2018) 233(6):5070–7. doi: 10.1002/jcp.26396
32. Choi H-J, Park H, Lee H-W, Kwon Y-G. The Wnt Pathway and the Roles for its Antagonists, DKKS, in Angiogenesis. IUBMB Life (2012) 64(9):724–31. doi: 10.1002/iub.1062
33. Anastas JN, Moon RT. WNT Signalling Pathways as Therapeutic Targets in Cancer. Nat Rev Cancer (2013) 13(1):11–26. doi: 10.1038/nrc3419
34. Shi Y, Gong H-L, Zhou L, Tian J, Wang Y. Dickkopf-1 Is a Novel Prognostic Biomarker for Laryngeal Squamous Cell Carcinoma. Acta Oto-Laryngol (2014) 134(7):753–9. doi: 10.3109/00016489.2014.894251
35. Gao H, Li L, Xiao M, Guo Y, Shen Y, Cheng L, et al. Elevated DKK1 Expression Is an Independent Unfavorable Prognostic Indicator of Survival in Head and Neck Squamous Cell Carcinoma. Cancer Manage Res (2018) 10:5083–9. doi: 10.2147/cmar.s177043
36. Lippitz BE. Cytokine Patterns in Patients With Cancer: A Systematic Review. Lancet Oncol (2013) 14(6):e218–28. doi: 10.1016/s1470-2045(12)70582-x
37. Wang D, Wang R, Huang A, Fang Z, Wang K, He M, et al. Upregulation of Macrophage Migration Inhibitory Factor Promotes Tumor Metastasis and Correlates With Poor Prognosis of Pancreatic Ductal Adenocarcinoma. Oncol Rep (2018) 40(5):2628–36. doi: 10.3892/or.2018.6703
38. Kindt N, Preillon J, Kaltner H, Gabius H-J, Chevalier D, Rodriguez A, et al. Macrophage Migration Inhibitory Factor in Head and Neck Squamous Cell Carcinoma: Clinical and Experimental Studies. J Cancer Res Clin Oncol (2013) 139(5):727–37. doi: 10.1007/s00432-013-1375-7
39. Zhou CC, Shen ZS, Ye D, Li Q, Deng HX, Liu HG, et al. The Association and Clinical Significance of CDKN2A Promoter Methylation in Head and Neck Squamous Cell Carcinoma: A Meta-Analysis. Cell Physiol Biochem (2018) 50(3):868–82. doi: 10.1159/000494473
40. Chen WS, Bindra RS, Mo A, Hayman T, Husain Z, Contessa JN, et al. CDKN2A Copy Number Loss Is an Independent Prognostic Factor in HPV-Negative Head and Neck Squamous Cell Carcinoma. Front Oncol (2018) 8:95(95). doi: 10.3389/fonc.2018.00095
41. Yang J, Jiang Q, Liu L, Peng H, Wang Y, Li S, et al. Identification of Prognostic Aging-Related Genes Associated With Immunosuppression and Inflammation in Head and Neck Squamous Cell Carcinoma. Aging-Us (2020) 12(24):25778–804. doi: 10.18632/aging.104199
42. Brooks JM, Menezes AN, Ibrahim M, Archer L, Lal N, Bagnall CJ, et al. Development and Validation of a Combined Hypoxia and Immune Prognostic Classifier for Head and Neck Cancer. Clin Cancer Res (2019) 25(17):5315–28. doi: 10.1158/1078-0432.ccr-18-3314
43. Feng B, Shen Y, Hostench XP, Bieg M, Plath M, Ishaque N, et al. Integrative Analysis of Multi-Omics Data Identified EGFR and PTGS2 as Key Nodes in a Gene Regulatory Network Related to Immune Phenotypes in Head and Neck Cancer. Clin Cancer Res (2020) 26(14):3616–28. doi: 10.1158/1078-0432.CCR-19-3997
44. Nghia N, Bellile E, Thomas D, McHugh J, Rozek L, Virani S, et al. Tumor Infiltrating Lymphocytes and Survival in Patients With Head and Neck Squamous Cell Carcinoma. Head Neck-J Sci Specialties Head Neck (2016) 38(7):1074–84. doi: 10.1002/hed.24406
45. Fang J, Li X, Ma D, Liu X, Chen Y, Wang Y, et al. Prognostic Significance of Tumor Infiltrating Immune Cells in Oral Squamous Cell Carcinoma. BMC Cancer (2017) 17:375. doi: 10.1186/s12885-017-3317-2
46. Peltanova B, Raudenska M, Masarik M. Effect of Tumor Microenvironment on Pathogenesis of the Head and Neck Squamous Cell Carcinoma: A Systematic Review. Mol Cancer (2019) 18:63. doi: 10.1186/s12943-019-0983-5
47. Kohler N, Ruess DA, Kesselring R, Zeiser R. The Role of Immune Checkpoint Molecules for Relapse After Allogeneic Hematopoietic Cell Transplantation. Front Immunol (2021) 12:634435. doi: 10.3389/fimmu.2021.634435
Keywords: aging-related genes, prognosis, tumor immune microenvironment, immune checkpoint, head and neck squamous cell carcinoma (HNSCC)
Citation: Chen F, Gong X, Xia M, Yu F, Wu J, Yu C and Li J (2022) The Aging-Related Prognostic Signature Reveals the Landscape of the Tumor Immune Microenvironment in Head and Neck Squamous Cell Carcinoma. Front. Oncol. 12:857994. doi: 10.3389/fonc.2022.857994
Received: 19 January 2022; Accepted: 30 March 2022;
Published: 10 May 2022.
Edited by:
Hamid Morjani, Université de Reims Champagne-Ardenne, FranceReviewed by:
Arutha Kulasinghe, The University of Queensland, AustraliaCopyright © 2022 Chen, Gong, Xia, Yu, Wu, Yu and Li. This is an open-access article distributed under the terms of the Creative Commons Attribution License (CC BY). The use, distribution or reproduction in other forums is permitted, provided the original author(s) and the copyright owner(s) are credited and that the original publication in this journal is cited, in accordance with accepted academic practice. No use, distribution or reproduction is permitted which does not comply with these terms.
*Correspondence: Junzheng Li, anpsaTIwMDJAMTYzLmNvbQ==
†These authors have contributed equally to this work
Disclaimer: All claims expressed in this article are solely those of the authors and do not necessarily represent those of their affiliated organizations, or those of the publisher, the editors and the reviewers. Any product that may be evaluated in this article or claim that may be made by its manufacturer is not guaranteed or endorsed by the publisher.
Research integrity at Frontiers
Learn more about the work of our research integrity team to safeguard the quality of each article we publish.