 So Young Kang
 You Jeong Heo
 Ghee Young Kwon
 Kyoung-Mee Kim
94% of researchers rate our articles as excellent or good
Learn more about the work of our research integrity team to safeguard the quality of each article we publish.
Find out more
ORIGINAL RESEARCH article
Front. Oncol., 27 April 2022
Sec. Cancer Molecular Targets and Therapeutics
Volume 12 - 2022 | https://doi.org/10.3389/fonc.2022.856444
This article is part of the Research TopicEngineered Targeted Cancer ImmunotherapiesView all 21 articles
Programmed death-ligand 1 (PD-L1) immunohistochemistry (IHC) is widely used to predict the clinical responses to immune checkpoint inhibitors (ICIs). However, PD-L1 IHC suffers from the complexity of multiple testing platforms and different cutoff values caused by the current one drug-one diagnostic test co-development approach for ICIs. We aimed to test whether PD-L1 (CD274) mRNA expression levels measured using quantitative reverse transcription-polymerase chain reaction (qRT-PCR) can represent PD-L1 IHC and predict responses to ICI. The FDA-approved PD-L1 IHC results with 22C3 pharmDx (gastric cancer) and SP142 (urothelial carcinoma) were compared with CD274 mRNA expression levels via qRT-PCR using the same formalin-fixed, paraffin-embedded tissue blocks from 59 gastric cancer and 41 urothelial carcinoma samples. CD274 mRNA expression was identified using three independent sets of primers and TaqMan® probes targeting exon 1–2, exon 3–4, and exon 5–6. CD274 mRNA levels in spanning exon 1–2, exon 3–4, and exon 5–6 junctions of CD274 correlated well with PD-L1 expression (r2=0.81, 0.65, and 0.59, respectively). The area under the curve of exon 1–2 was the highest (0.783), followed by exon 3–4 (0.701), and exon 5–6 (0.671) of the CD274 gene against the PD-L1 combined positive score cutoff of 10. When CD274 mRNA expression was matched for response to immunotherapy, the overall response rate was higher in patients with high CD274 mRNA levels with a cutoff of 0.0722 (gastric cancer) and 0.0480 (urothelial carcinoma) than in those with low CD274 mRNA expression (P < 0.001 and P = 0.018, respectively). These results show that CD274 mRNA levels predicted ICI responses in patients with gastric or urothelial carcinomas and could be used as alternatives for PD-L1 IHC.
In 2017, the Food and Drug Administration (FDA) granted accelerated approval to pembrolizumab for patients with recurrent locally advanced or metastatic, gastric or gastroesophageal junction adenocarcinoma whose tumors express programmed death-ligand 1 (PD-L1) as determined by an FDA-approved test based on the clinical results of KEYNOTE 059 (NCT02335411) (1). In advanced gastric or gastroesophageal junction adenocarcinoma, PD-L1 expression is assessed using the FDA-approved PD-L1 IHC 22C3 pharmDx assay and a combined positive score (CPS) (2). In 2016, FDA gave accelerated approval to atezolizumab injection (Tecentriq) for the treatment of patients with locally advanced or metastatic urothelial carcinoma who have disease progression during or following platinum-containing chemotherapy or have disease progression within 12 months of neoadjuvant or adjuvant treatment with platinum-containing chemotherapy. FDA approved Ventana PD-L1 (SP142) assay to measure PD-L1 expression in urothelial carcinoma. With FDA approvals, PD-L1 immunohistochemistry (IHC) is popular for predicting therapeutic responses to immune checkpoint blockade (ICB) (3). While this method measures PD-L1 protein levels, antibody clones, staining platforms, and interpretations differ. For instance, whereas that in metastatic non-small cell lung cancer (NSCLC) samples relies on tumor proportion scores (TPS) instead of CPS (4). The Ventana SP142 assay is used to analyze urothelial carcinoma (UC) and to count immune cells (IC) within the tumor microenvironment (5). This variability in scoring methods has contributed to confounding results across clinical trials and in clinical practice, leading to uncertainty regarding the universal value of PD-L1 protein levels as a biomarker across tumor types (6, 7). Furthermore, the use of formalin-fixed, paraffin-embedded (FFPE) archival tumor tissues prepared, fixed, and stored in non-standardized ways might not generate predictable and intended results for adequate PD-L1 antigen retrieval. This could potentially increase the heterogeneity of IHC intensity, extent, and topography of staining (3). All these factors complicate the reliability of PD-L1 levels assessed by IHC to predict clinical responses to ICB (8).
Assays of FFPE tissues based on RNA are currently employed clinically to classify or predict recurrence risk in patients affected by various types of tumors (9, 10). Gene expression assays based on RNA include microarray, real-time quantitative reverse transcription polymerase chain reaction (qRT-PCR), and RNA sequencing (11–13). The qRT-PCR assays are popular for quantifying genes due to a large dynamic range, high sensitivity, high specificity, little to no post-amplification processing, and increased sample throughput (14, 15). The use of specific primers targeting stably expressed genes provides high specificity and sensitivity, allowing for the simultaneous measurement of several targets, including genes, for sample quality control purposes. Gene expression profiling by qRT-PCR has minimal input requirements and could be far more cost-effective than IHC. Furthermore, close concordance between qRT-PCR and IHC has validated qRT-PCR analyses, even for challenging FFPE tumor samples (16). Therefore, gene-specific reverse transcription might considerably increase the success rate of molecular classifier validation in FFPE sample cohorts.
The present study aimed to develop a more rapid qRT-PCR assay to measure CD274 mRNA expression that closely correlates with PD-L1 IHC and save archival tumor tissues for other IHC assays in the same patient. Therefore, we designed three qRT-PCR primers and compared their results with those of PD-L1 IHC, then clinically validated the results in patients with GC and UC treated with ICIs.
We collected retrospective data from 100 patients with advanced GC (n = 59) or UC (n = 41) that were treated with palliative chemotherapy (n = 100) and anti-programmed death 1 (PD-1)/PD-ligand (L)-1 immunotherapy (n = 49) at Samsung Medical Center between December 2016 and January 2020. The median age was 61.0 (33–81) years and 30 (61.2%) patients were male. All the patients present with GC were stage IIB–IV disease at diagnosis and have experienced local recurrence or metastasis at treatment for ICI. For UC patients, they were all locally advanced stage II–IIIb disease stages (Supplementary Table S1). Responses of the 49 patients treated with immunotherapy were assessed every 6–12 weeks according to the Immune Response Evaluation Criteria in Solid Tumors (iRECIST) (17). Data from patients with at least 6 weeks of follow up were included. The primary clinical endpoint was the objective response rate (ORR), defined as a complete (CR) or partial (PR) response. Patients with progressive (PD) or stable (SD) disease were classified as non-responders. Clinicopathological data were retrospectively extracted from electronic medical records. This study proceeded in accordance with the Institutional Review Board guidelines (IRB No. 2018-09-041-001) for data analysis and investigational treatment, and written informed consent from the patients was also obtained to analyze their innominate data.
Total RNA was isolated from FFPE tumor tissues using the ReliaPrep™ FFPE Total RNA Miniprep System (Promega Corp., Madison, WI, USA), and a amplified using a high-capacity cDNA reverse transcription kit (Thermo Fisher Scientific Inc., Waltham, MA, USA) as described by the manufacturer. Target genes were analyzed using a gene expression assay with forward and reverse primers and an Applied Biosystems FAM-labeled MGB TaqManTM probe (Thermo Fisher Scientific Inc.) as we previously described (18). We found that the PD-L1 IHC results correlated with those of NanoString nCounter assays (19), we used CD274 TaqMan probes spanning exon 1–2 (assay ID; Hs01125296_m1), 3–4 (assay ID; Hs00204257_m1), and 5–6 (assay ID; Hs01125301_m1) boundaries for qRT-PCR (Supplementary Figure S1). These sequences were amplified by PCR in triplicate under the following conditions using QuantStudio 6 (Thermo Fisher Scientific Inc.): 2 min at 50°C and 10 min at 94°C, followed by 40 cycles of 95°C for 15 s and 60°C for 60 s. Threshold cycle (Ct) values for each sequence were calculated for each and averaged, and normalized to the mean of the reference gene GUSB2 (assay ID: Hs99999908_m1), which was stably expressed (18). The mRNA expression of each gene was measured using the 2^-ΔCt (ΔCt = ΔCttarget gene−ΔCtGUSB2) method.
Gastric FFPE tissue blocks were cut into 4-μm sections and stained using an Autostainer Link 48 system and Dako PD-L1 IHC 22C3 pharmDx kits (both from Agilent Technologies Inc., Santa Clara, CA, USA) (2). A rabbit anti-human PD-L1 monoclonal antibody (clone SP142; Ventana Medical Systems, Tucson, AZ, USA) was used as described for UC samples (20). The CPS of PD-L1 expression was calculated as the number of PD-L1-stained GC tumors and ICs divided by the total number of viable tumor cells, multiplied by 100. The concordance rate between qRT-PCR and IHC was evaluated using CPS cut-offs of 1 and 10 for GC. Infiltrative ICs covering ≥ 5 of a UC tumor area were defined as PD-L1-positive. For positive control, we used positive cell lines provided by PD-L1 IHC 22C3 pharmDx and tonsil tissues. For negative control, we used MCF-7 cell lines provided by PD-L1 IHC 22C3 pharmDx. Benign human tonsil is tissue control as it contains both positive and negative staining epithelial and immune cells and can serve as both a positive and negative tissue control for VENTANA PD-L1 (SP142) Assay staining (21).
We used CPS ≥1 and ≥ 10 for GC, and IC ≥5 for UC to compare IHC with qRT-PCR. To calculate the sensitivity, specificity, positive (PPV) and negative (NPV) predictive values, and accuracy, a positive IHC result was considered as CPS ≥1 or ≥ 10 for GC, and IC ≥ 5 for urothelial carcinoma. Predicted responses based on tumor type, IHC results, and qRT-PCR results were evaluated using logistic regression.
The ORR (CR/PR) and disease control rate (DCR; CR/PR/SD) were compared with the CD274 mRNA qRT-PCR results using two-tailed unpaired Student t-tests. The diagnostic values of panels were assessed by calculating the area under the receiver operating characteristics (ROC) curve (AUC). Kaplan–Meier estimates of progression-free (PFS) and disease-specific survival (DSS) were compared using log-rank tests. All graphs were generated using GraphPad Prism v. 9.0 (GraphPad Software Inc., San Diego, CA, USA). Statistical significance was set at P < 0.05. All data were statistically analyzed using SPSS software version 27.0 (IBM Corp., Armonk, NY, USA).
The 22C3 pharmDx assay identified PD-L1 positivity with CPS ≥ 1 and ≥ 10 in 32 (54.2%) and 13 (22 %) of 59 GC samples, respectively. The mean PD-L1 CPS in GC was 9.24 (0–95). The Ventana SP142 assay identified PD-L1 positivity with IC ≥ 5 in 12 (29.3%) of 41 UCs. The mean PD-L1 IC in urothelial carcinomas was 10.46 (0–95) (Figure 1).
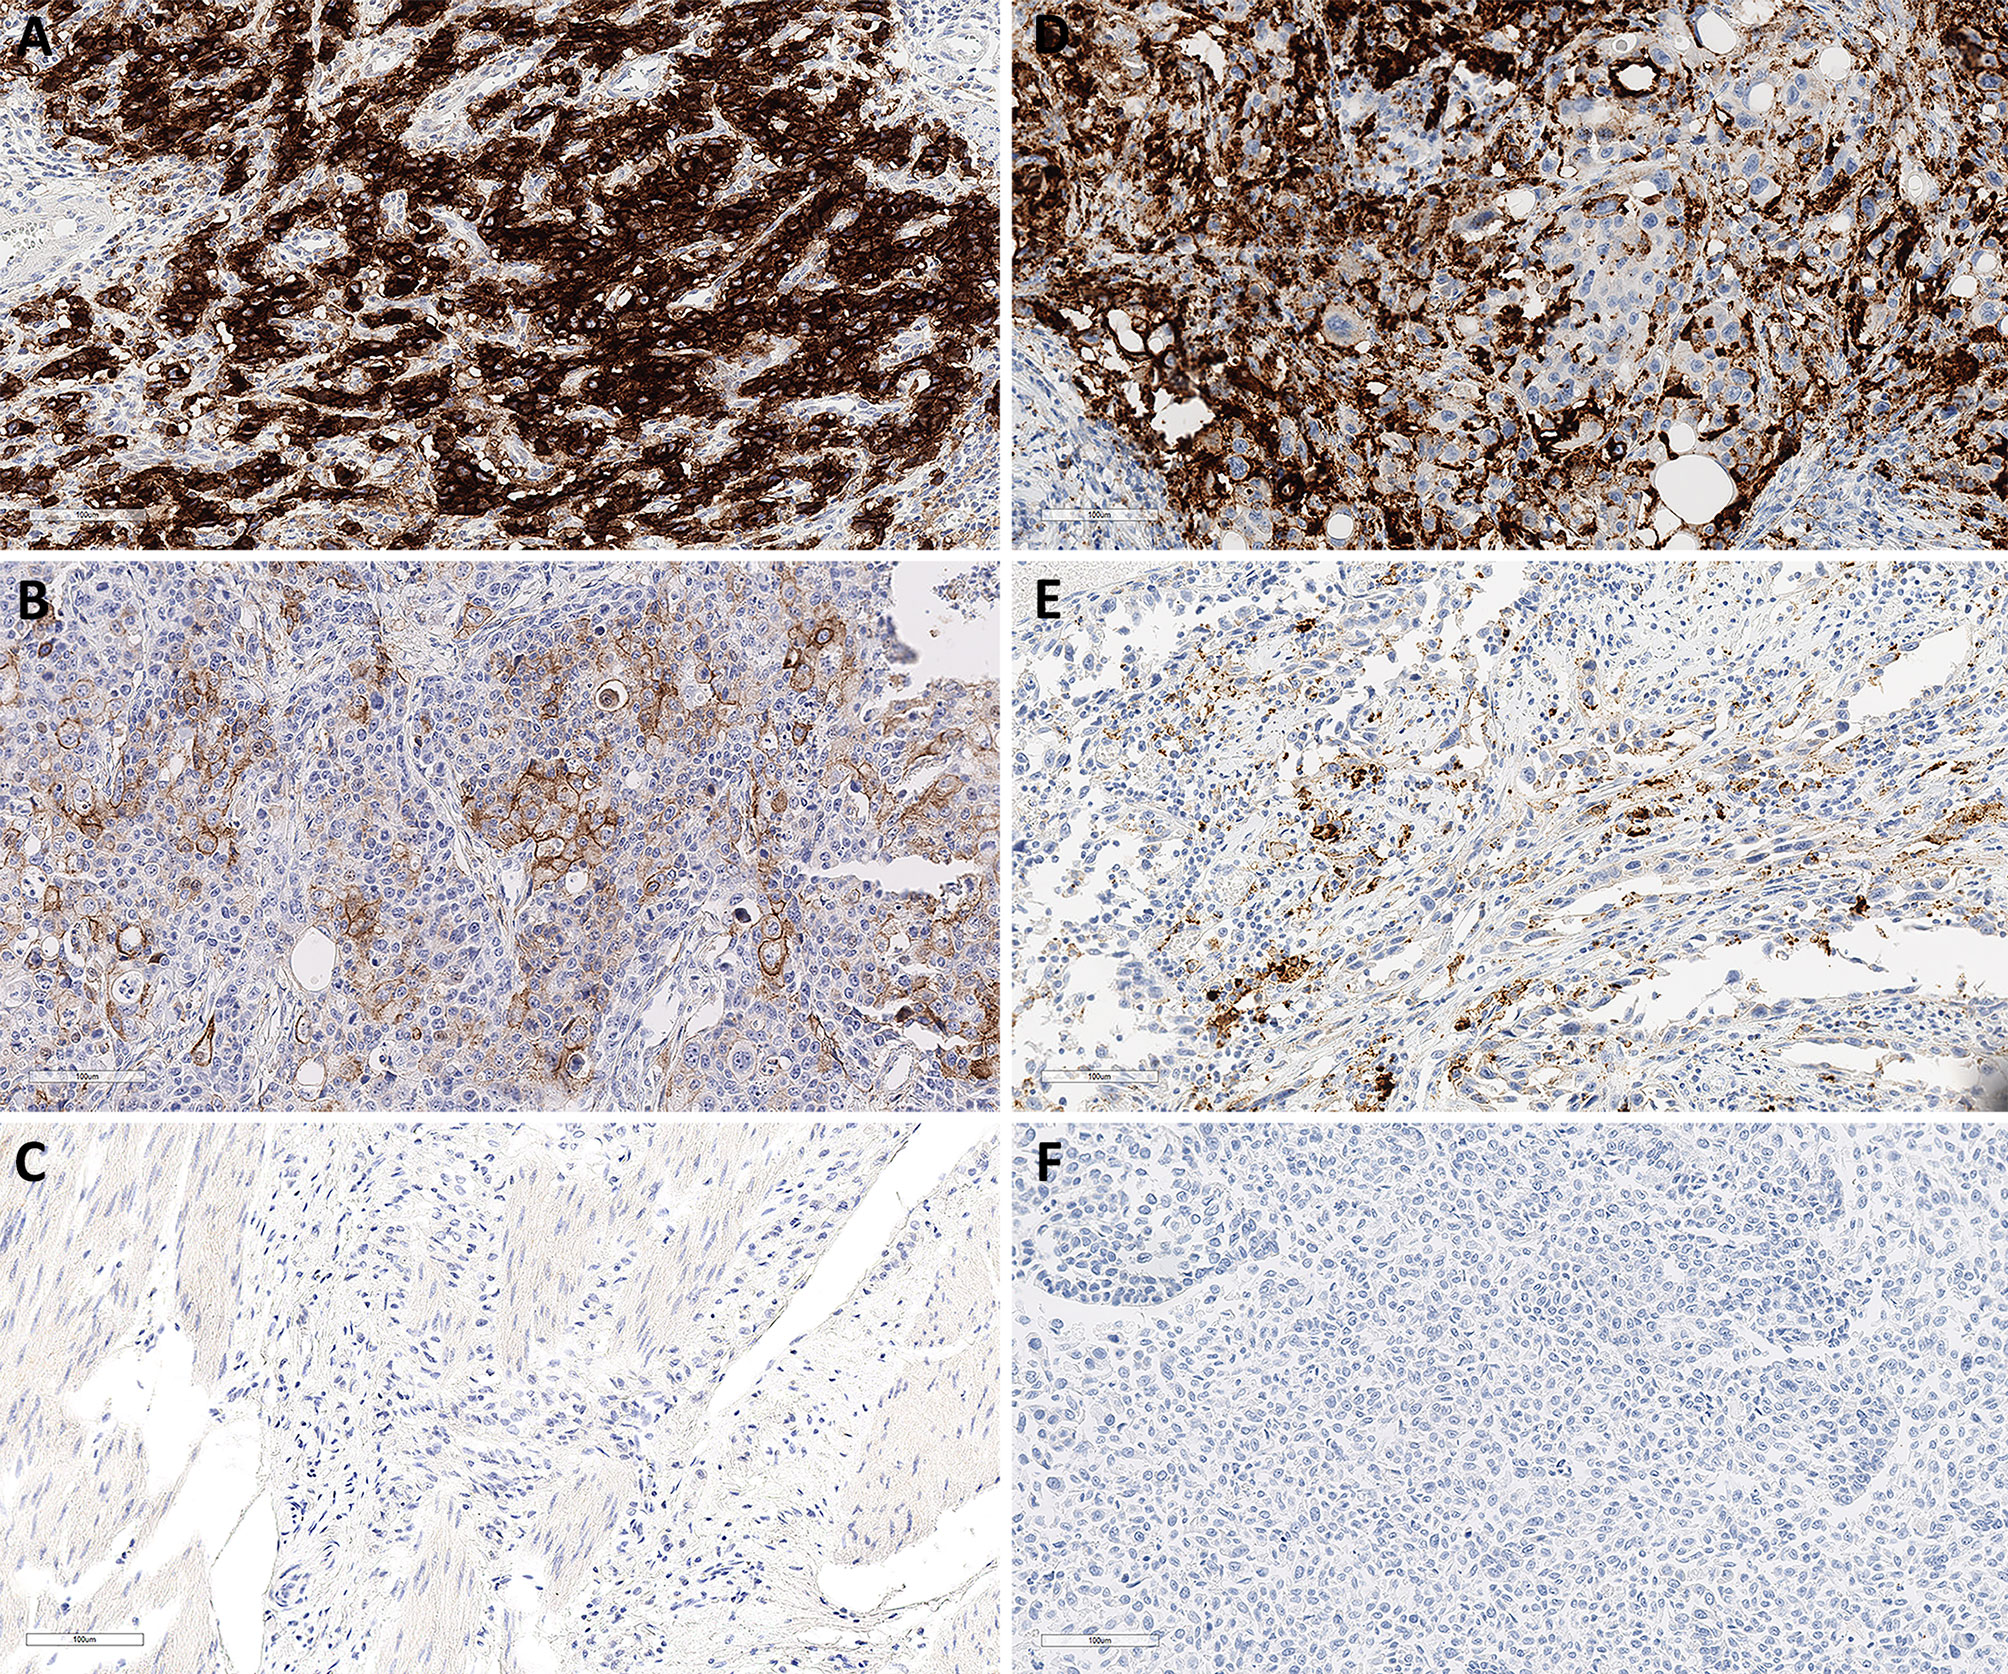
Figure 1 Representative PD-L1 immunohistochemical staining in GC and SP142 in UC. Combined positive scores of 95 (A), 25 (B) and 0 (C) in GCs with 22C3 pharmDx. Immune cell scores of 40 (D), 20 (E) and 0 (F) in UCs with Ventana PD-L1 (SP142) assay. Magnification in all images, 20×. GC, gastric cancer; UC, urothelial carcinoma.
The mean RQ (range) of relative CD274 mRNA expression spanning exons 1–2, 3–4, and 5–6 were 0.1004 (0–2.4897), 0.2371 (0–7.5214), and 0.0928 (0–3.7064), respectively. These values closely correlated (Spearman correlations: r2 = 0.92 for exons 1–2 and 3–4; r2 = 0.89 for exons 1–2 and 5–6, and r2 = 0.99 for exons 3–4 and 5–6; Figure 2A). The PD-L1 scores in 100 evaluated samples closely correlated with CD274 mRNA expression spanning exons 1–2 (r2 = 0.81), 3–4 (r2=0.65), and 5–6 (r2 = 0.59; Figure 2A). In GC, The PD-L1 CPS score with 22C3 pharmDx significantly correlated with the exon 1–2 (r2 = 0.81), 3–4 (r2 = 0.67), and 5–6 (r2 = 0.62) junctions of CD274 (Figure 2B). The Ventana SP142 PD-L1 IC score was significantly associated in UC with exon 1–2 (r2 = 0.93), exon 3–4 (r2 = 0.82), and exon 5–6 (r2 = 0.76) junctions of CD274 (Figure 2C).
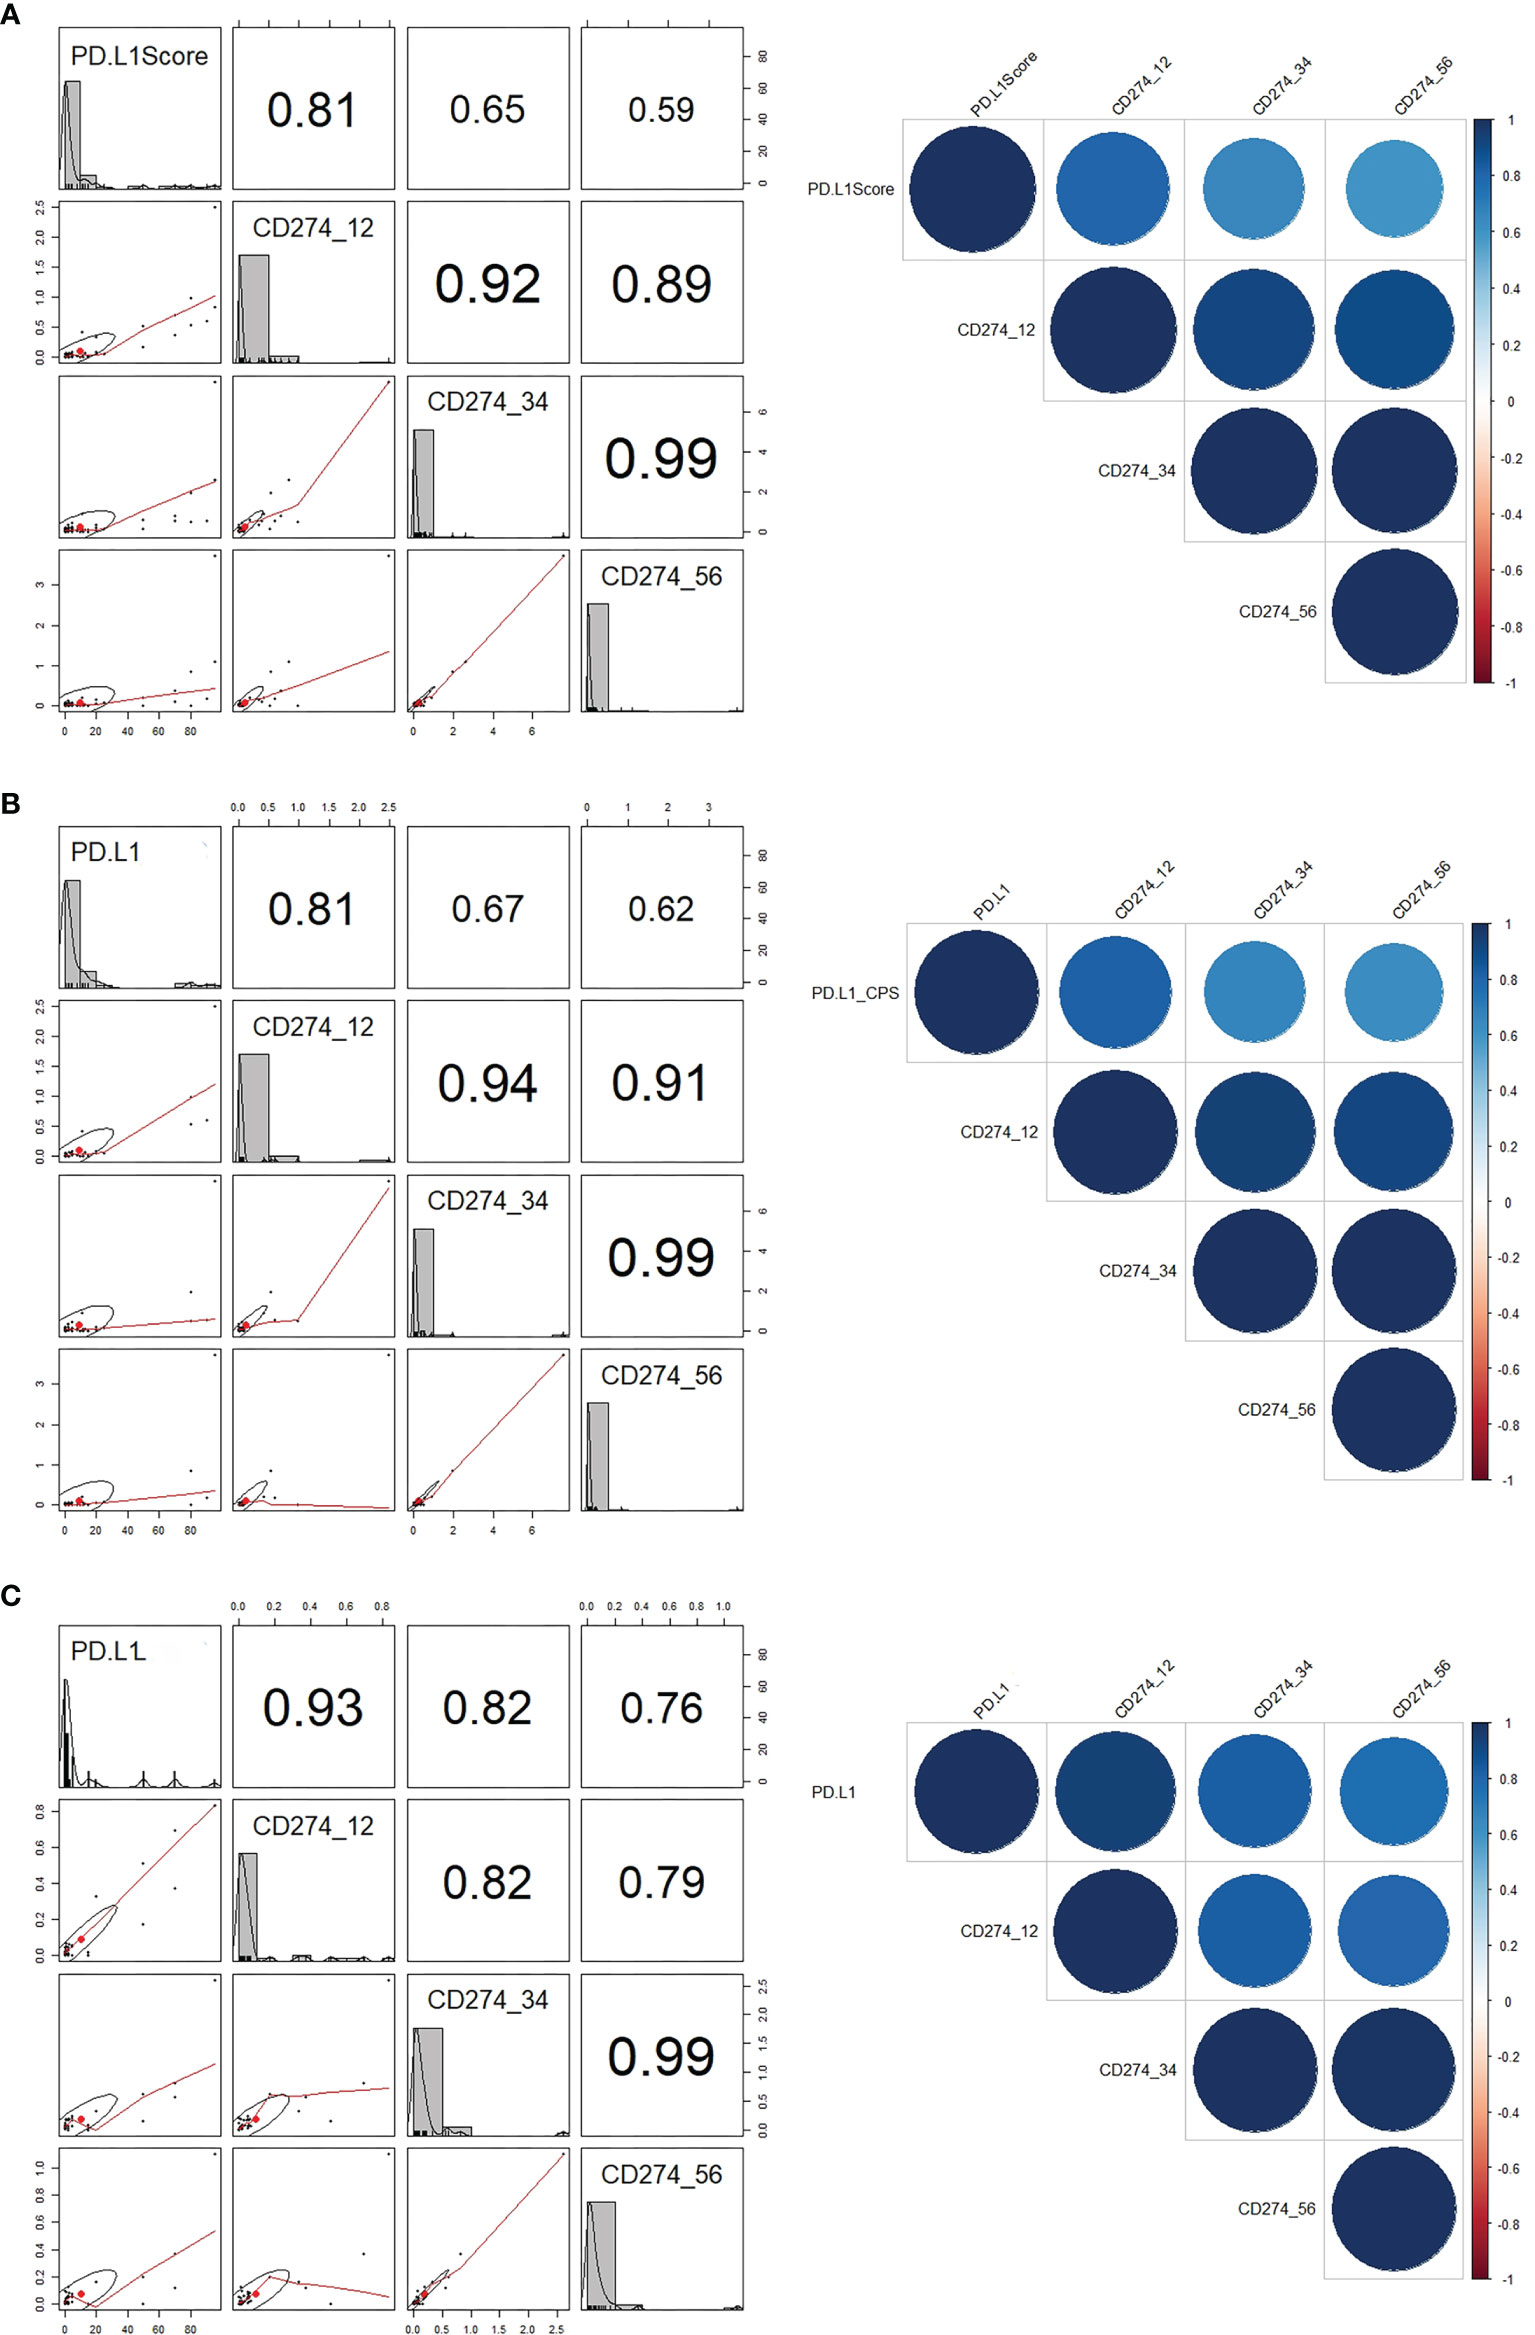
Figure 2 Correlations between PD-L1 scores and CD274 mRNA expression. (A) Correlations between (A) PD-L1 scores and CD274 exons 1–2, 3–4, and 5–6 in all GC and UC. (B) PD-L1 combined positive score and CD274 mRNA expression in GC. (C) PD-L1 immune scores and CD274 mRNA expression in UC. GC, gastric cancer; PD-L1, programmed death-ligand 1; UC, urothelial carcinoma.
The RQ cutoffs of CD274 mRNA expression in exon 1–2, 3–4, and 5–6 junctions were evaluated as the AUC based on PD-L1 CPS cut-offs of 1 and 10 for GC and PD-L1 IC cut-offs of 5 for UC (Supplementary Table S2 and Supplementary Figure S2). At a CPS cutoff of 10, the highest AUC in GC was 0.783, obtained from CD274 mRNA expression at the exon 1–2 junction with a cut-off of 0.0722 (P < 0.0001). The highest AUC of UC based on PD-L1 IC cut-offs of IC 5 was 0.781, obtained from CD274 mRNA expression in the exon 1–2 junction with a cut-off of 0.0480 (P < 0.0001).
Between May 2018 and October 2020, 49 patients were treated with anti PD-1/PD-L1 agents, and treatment responses to treatment with pembrolizumab (n = 16), nivolumab (n = 16), atezolizumab (n = 13), and durvalumab (n = 4) were evaluated during > 6 weeks of followup (Supplementary Table S1). The median number PD-1/PD-L1 cycles was 8.9 (range, 1–37) as of May 20, 2021, and the patients were followed up for a median of 11.3 months. Table 1 summarizes the clinicopathological characteristics of the patients treated with anti-PD-1/PD-L1.
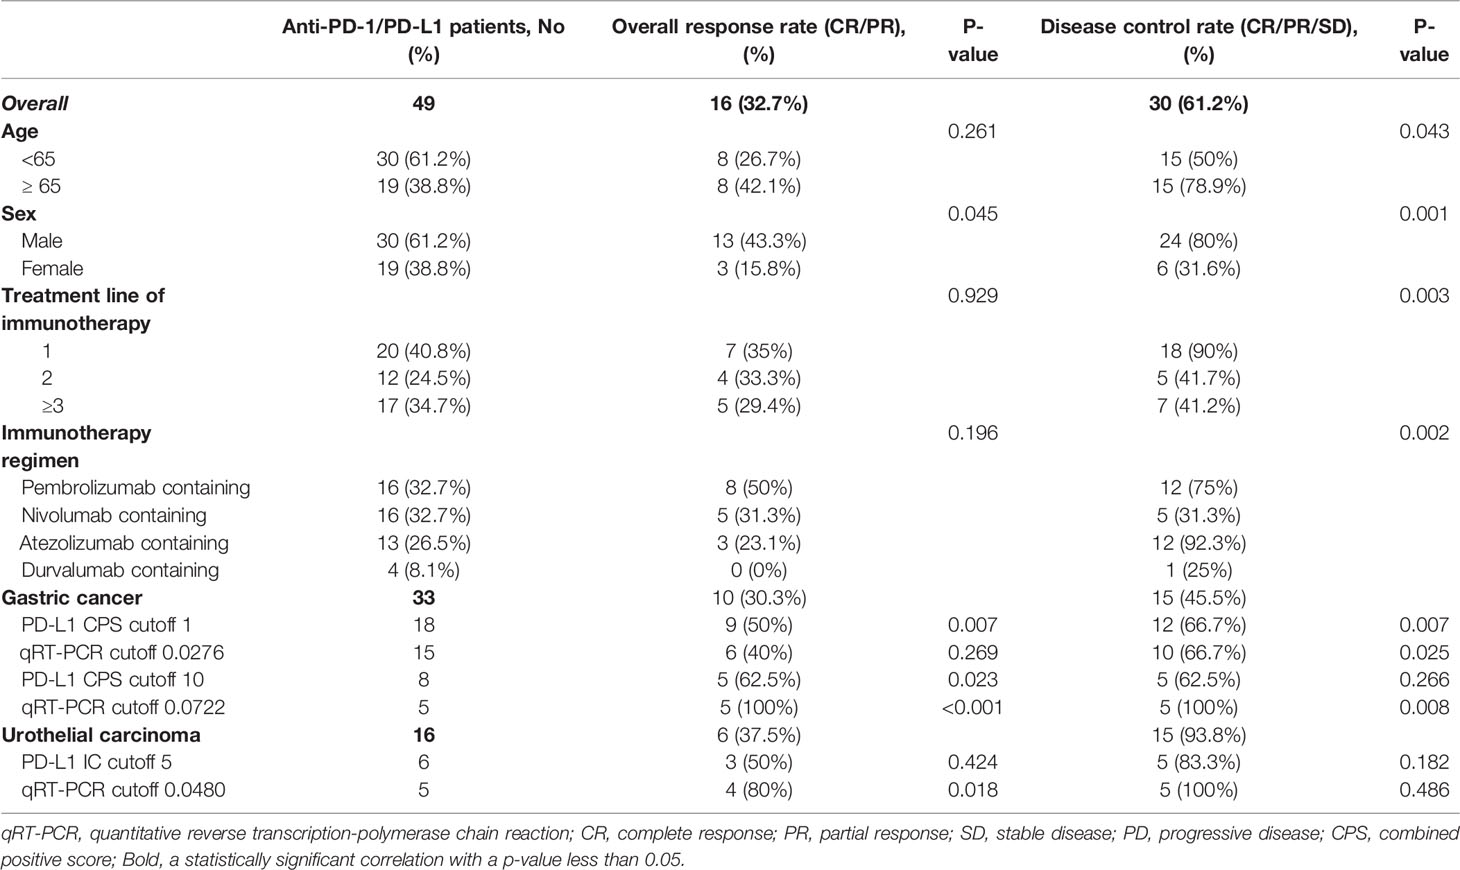
Table 1 Clinicopathological characteristics of patients treated with anti-programmed death 1 (PD-1)/programmed death-ligand 1 (PD-L1) therapy.
Anti-PD-1/PD-L1 responders (CR/PR, n = 16) and non-responders (PD/SD, n = 33) were identified using the iRECIST category of ORR. The expression of PD-L1 (P = 0.010) and high CD274 mRNA expression (P < 0.001) were significantly associated with the response to immunotherapy. The ROC curve for the predictive performance of PD-L1 IHC and mRNA expression of CD274 at exon 1–2 was discriminatory. The AUC and 95% confidence intervals (CIs) were 0.76 (0.61–0.91) for PD-L1 and 0.75 (0.59–0.91) for mRNA expression of CD274 exon 1–2. These findings were similar using the iRECIST category of DCR (CR/PR/SD, n = 30 and PD, n = 19). Furthermore, PD-L1 expression (P = 0.015) and high CD274 mRNA expression (P = 0.038) predicted responses to immunotherapy with AUCs of 0.70 (0.55–0.86) and 0.68 (0.53–0.83), respectively. In GC, the expression of PD-L1 (P = 0.002) and high CD274 mRNA expression (P=0.041) were significantly associated with the response to immunotherapy. In UC, the expression of PD-L1 (P = 0.147) and high CD274 mRNA expression (P=0.008) did not reach statistical significance in predicting response to immunotherapy (Figure 3A). The ROC curve for the predictive performance of PD-L1 IHC and mRNA expression of CD274 at exon 1–2 was discriminatory. In GC, the AUC and 95% confidence intervals (CIs) were 0.80 (0.63–0.97) for PD-L1 and 0.69 (0.47–0.92) for mRNA expression of CD274 exon 1–2. In UC, the AUC and 95% Cis were 0.68 (0.36–0.99) for PD-L1 and 0.87 (0.67–1.00) for mRNA expression of CD274 exon 1–2 (Figure 3B). These findings were similar using the iRECIST category of DCR (CR/PR/SD, n = 15 and PD, n = 18) in GC. PD-L1 expression (P = 0.008) and high CD274 mRNA expression (P = 0.017) predicted responses to immunotherapy with AUCs of 0.73 (0.56–0.90) and 0.71 (0.53–0.90), respectively, in GC. In UC, anti-PD-1/PD-L1 responders (n = 15) and non-responders (n = 1) were identified using the iRECIST category of DCR. PD-L1 expression (P = 0.375) and high CD274 mRNA expression (P = 0.250) predicted responses to immunotherapy with AUCs of 0.67 (0.43–0.91) and 0.90 (0.71–1.00), respectively (Figures 3C, D).
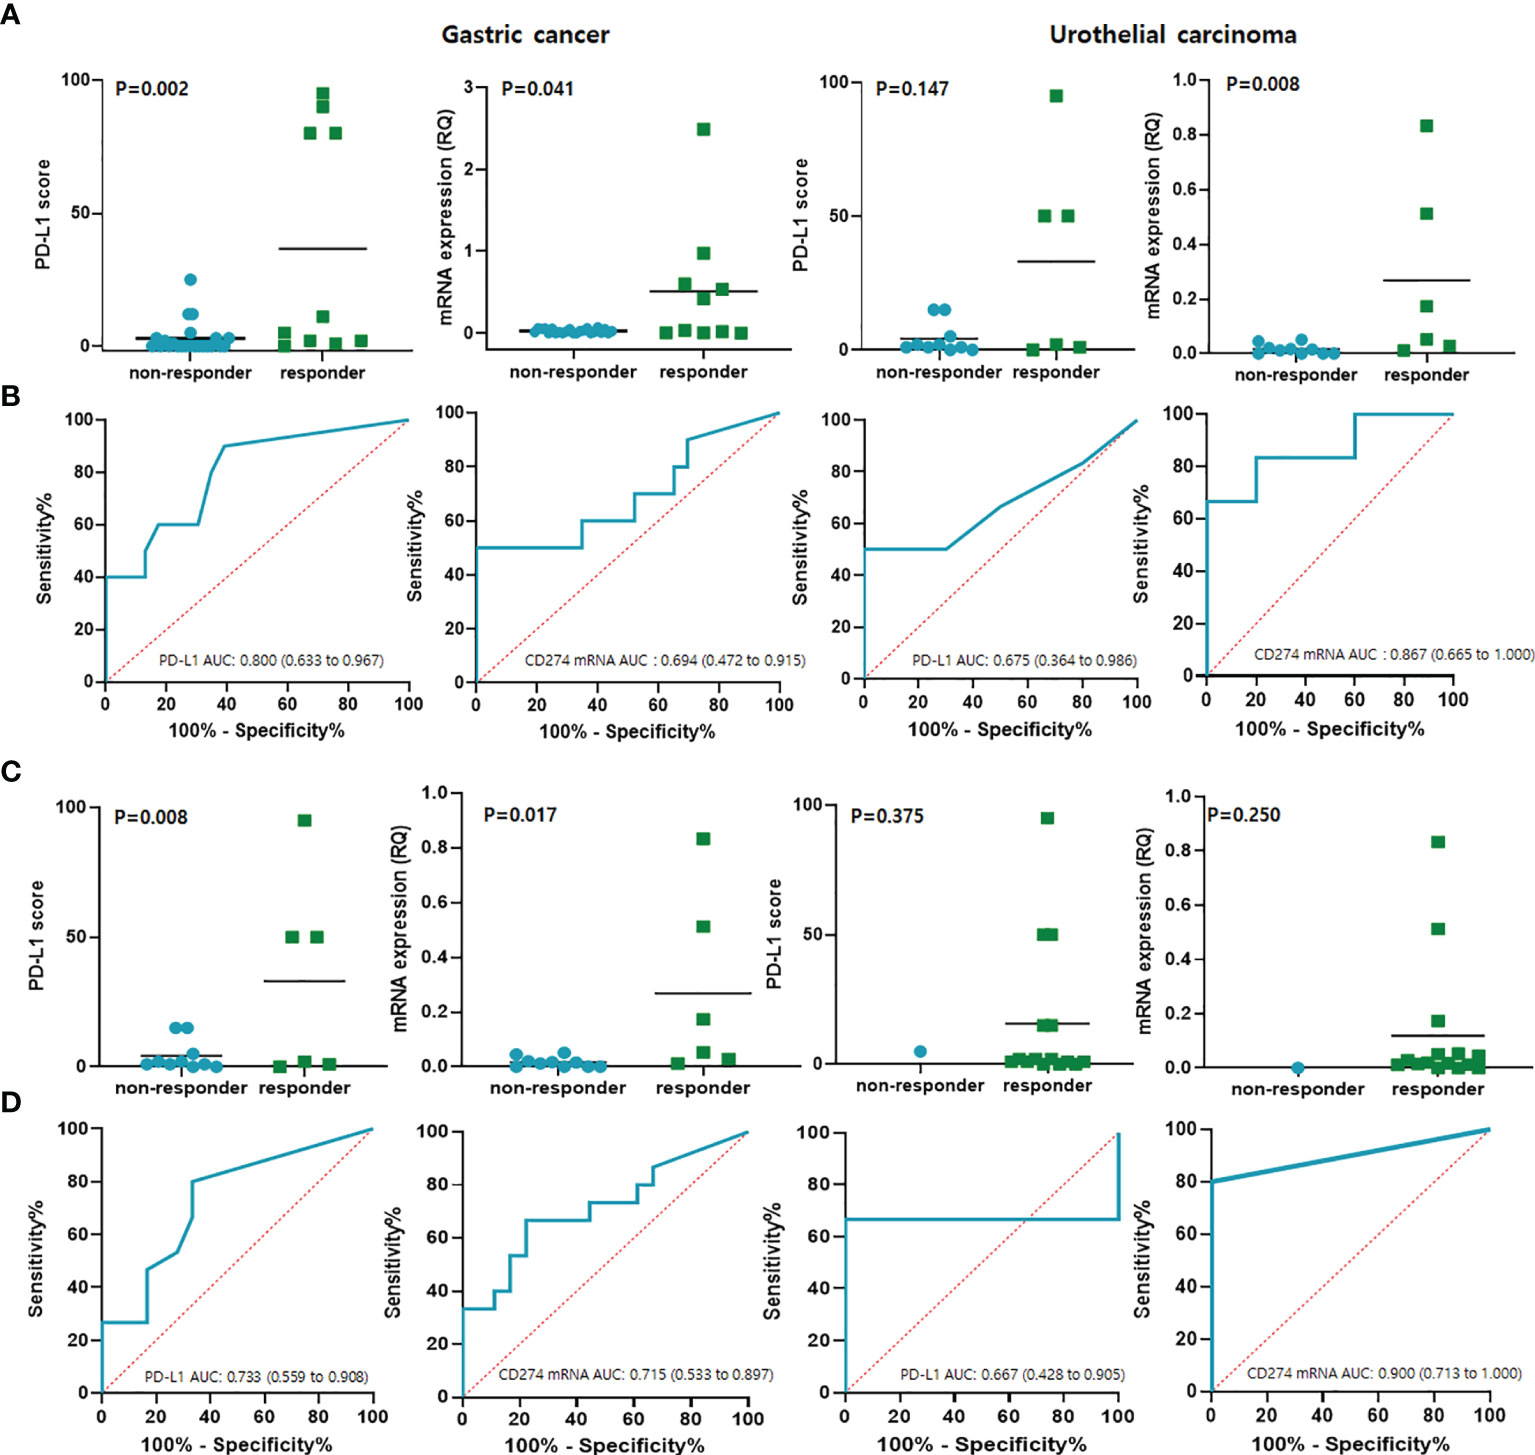
Figure 3 Results of qRT-PCR predicted responses to anti- PD-1 checkpoint blockade in GC and UC. (A) PD-L1 and CD274 mRNA expression per iRECIST ORR categories of responders (CR/PR) and non-responders (PD/SD). (B) Predictive performance of PD-L1 and CD274 mRNA expression determined from ROC curves in terms of ORR categories. (C) PD-L1 and CD274 mRNA expression levels per iRECIST DCR category of responders (CR/PR/SD) and non-responders with SD. (D) Predictive performance of PD-L1 and CD274 mRNA expression determined from ROC curves in terms of DCR category. CR, complete response; GC, gastric cancer; iRECIST, immune Response Evaluation Criteria in Solid Tumors; ORR, objective response rate; PD, progressive disease; PD-L1, programmed cell death ligand 1; PR, partial response; ROC, receiver operating characteristics; qRT-PCR, quantitative reverse transcription-polymerase chain reaction; SD, stable disease; UC, urothelial carcinoma.
The PFS was closely associated with PD-L1 expression (P = 0.018) and high CD274mRNA expression spanning the exon 1–2 junction (P = 0.010) in GC (Figure 4A). The association was also similar between DSS and PD-L1 expression (P = 0.047). However, DSS was not significantly associated with mRNA expression (P = 0.134); Figure 4B). The expression of PD-L1 was significantly associated with PFS (P = 0.016) and DSS (P = 0.009) in UC, whereas the CD274mRNA expression at exon 1–2 junction did not significantly correlate with PFS and DSS (Supplementary Figure S3).
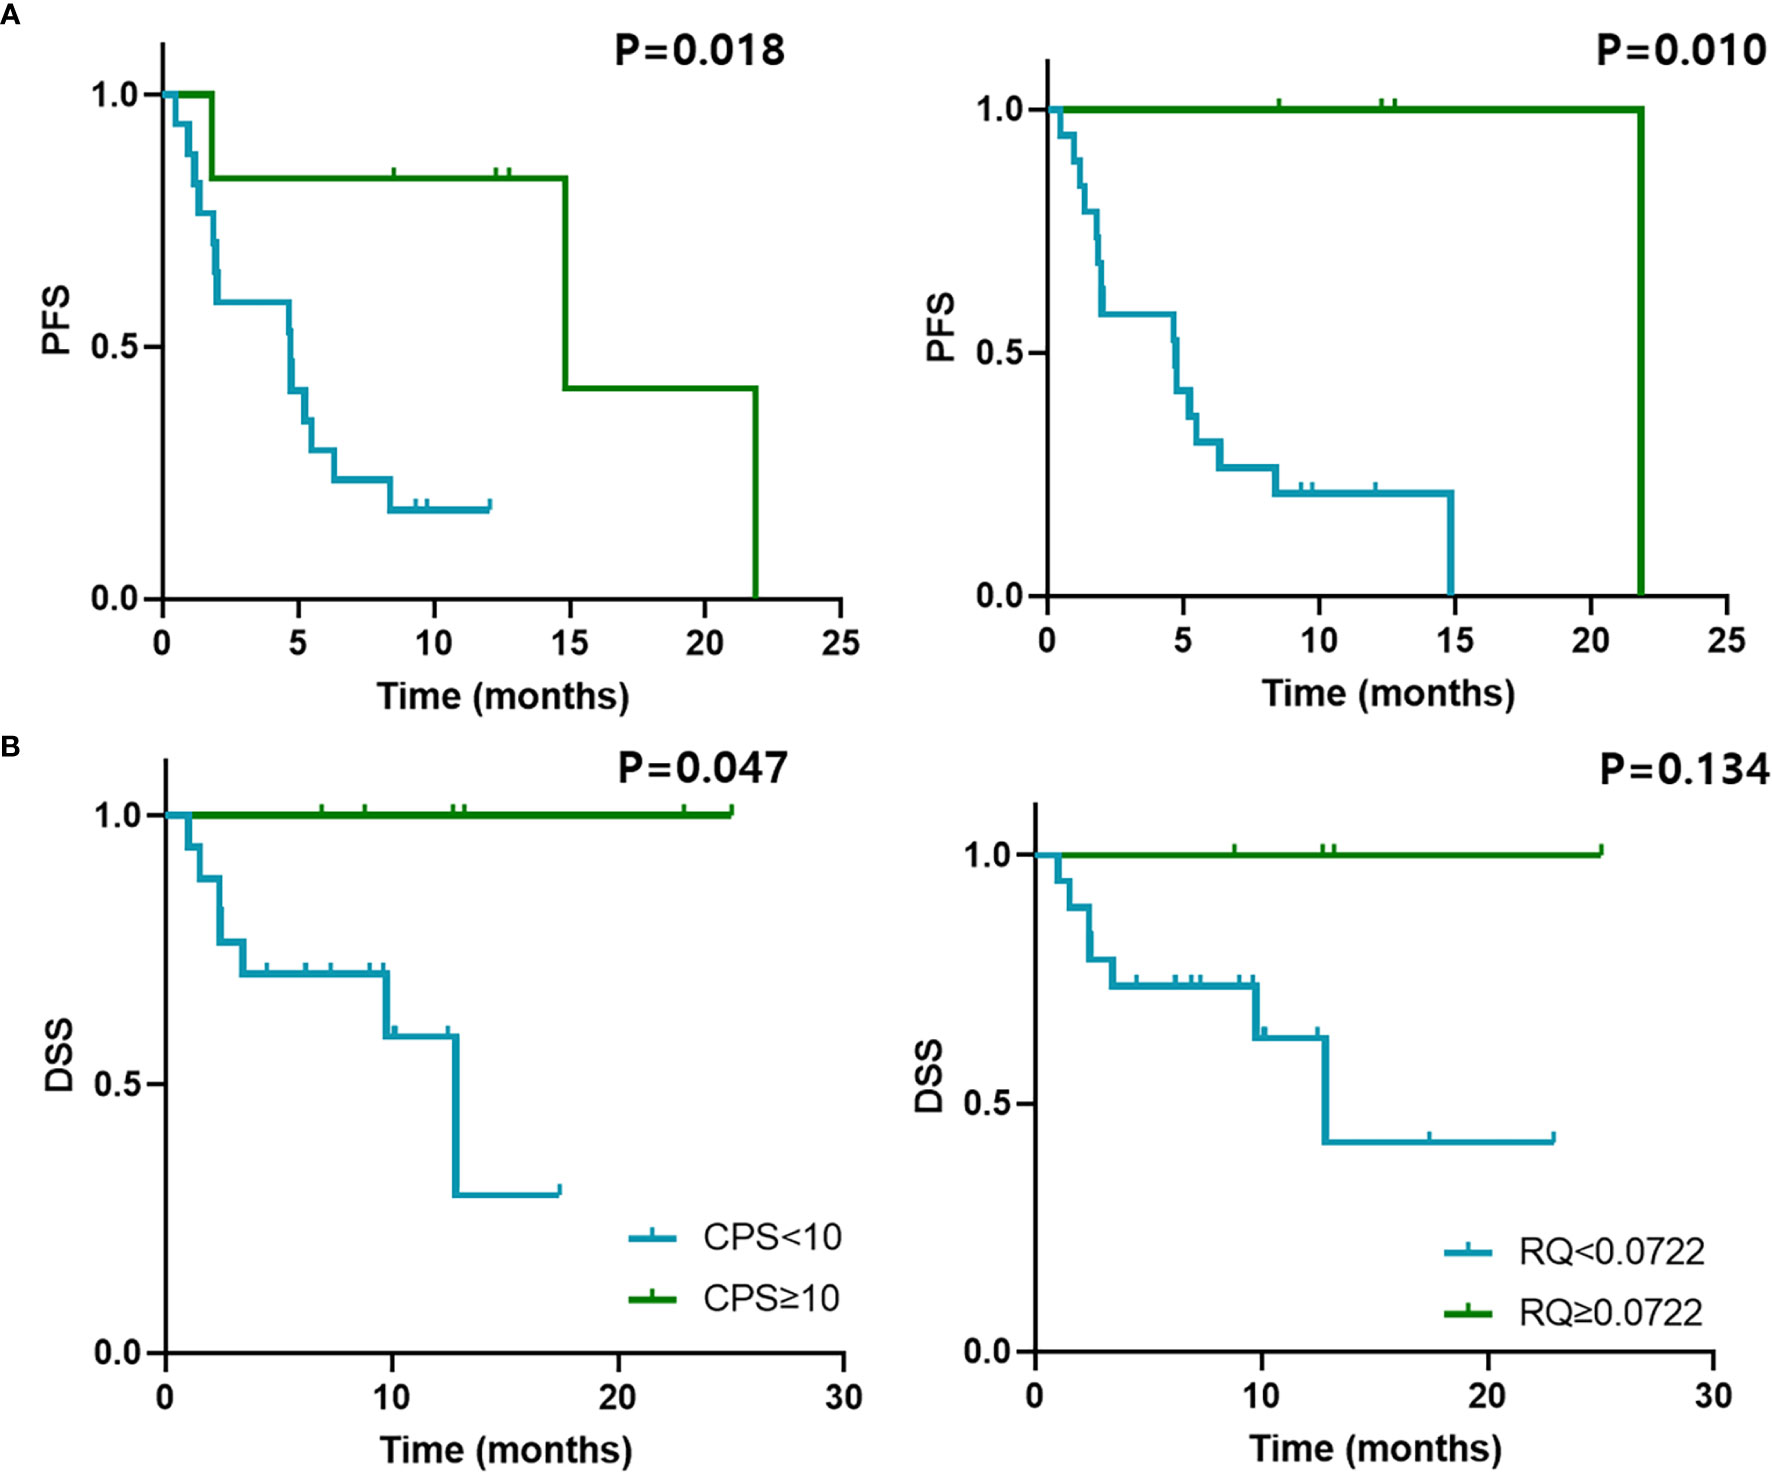
Figure 4 Survival outcomes and qRT-PCR results of GC treated with anti-PD-1/PD-L1. Kaplan–Meier curves of (A) PFS and (B) DSS of patients with GC treated with anti-PD-1/PD-L1 according to PD-L1 CPS cut-off 10 and CD274 mRNA expression determined by qRT-PCR with cut-off 0.0722. PFS, progression-free survival; DSS, disease-specific survival.
The clinical value of PD-L1 assessment with IHC and qRT-PCR was compared using the standard parameters of sensitivity, specificity, PPV, NPV, and accuracy (Table 2). We used two cut-offs for GC samples (CPS ≥ 1% and 10%; RQ ≥ 0.0276 and ≥ 0.0772) to ensure the optimal performance to predict responses for immunotherapy. The CPS ≥ 1% for PD-L1 was the most sensitive (90%), and qRT-PCR with a RQ cutoff of 0.0722 was the most specific (100%) in GC. The sensitivity was highest in GC samples with CPS ≥ 1 (90%) although the PPV was very low (50%). The sensitivity (66.7%) and specificity (90%) of detecting UC were higher with qRT-PCR and the AUC values higher than those in PD-L1 IHC.
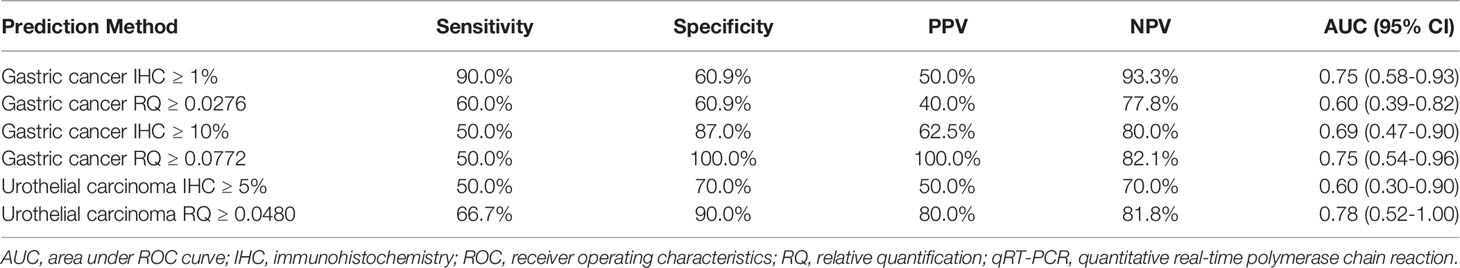
Table 2 Comparison of clinical applicability between IHC PD-L1 and qRT-PCR results.
The expression of PD-L1 is one of the most studied biomarkers to predict the responses to ICI and one of the most controversial biomarkers to be introduced into clinical practice (3). Despite evidence showing that technological and histological variability limit clinical its utility (2, 22), four IHC-based tests have been approved for guiding treatment decisions regarding patients with multiple tumor types. The wide range of FDA-approved assays with differential sensitivity and scoring systems (23) and the lack of harmonization among them (24) have led to confusion in pathology laboratories (25). In GC, pembrolizumab exhibited favorable efficacy in PD-L1-positive patients (KEYNOTE-059) (26). Owing to the results, pembrolizumab was approved for PD-L1-positive GC patients in second- or later-line treatment by the FDA. However, the predictive value of PD-L1 expression in GC was challenged by other clinical trials (27–29). In UC, five PD-1/PD-L1 inhibitors are approved for treatment of locally advanced or metastatic UC. Due to restrictions by the FDA, first-line treatment with Atezolizumab and Pembrolizumab in platinum-ineligible patients requires PD-L1 IHC. In the second-line setting, all drugs are approved without PD-L1 IHC testing (30). PD-L1 IHC tests used in clinical trials of UC immunotherapy include the 28-8 pharmDx (Nivolumab), the 22C3 pharmDx (Pembrolizumab), Ventana SP142 (Atezolizumab), and the Ventana PD-L1 SP263 assays (Durvalumab). Here, we measured PD-L1 mRNA expression using qRT-PCR and compared the results with FDA-approved PD-L1 IHC assays for GC and UCs. We found that CD274 mRNA expression spanning exon 1–2 closely correlated with PD-L1 IHC and predicted responses to ICIs.
Although PD-L1 IHC measured by IHC is a predictive biomarker of responses to ICIs (22), whether an alternative methodology could validate PD-L1 utility as a predictive biomarker has remained unclear (3). Much effort has been directed towards evaluating whether RNA-based PD-L1 assays could replace PD-L1 IHC as a biomarker to predict responses to ICI (Table 3) (3, 31–33, 35–38). Unlike IHC, qRT-PCR or RNA sequencing quantifies the number of mRNA transcripts expressed in an entire tumor without subjective scoring methods or cell type discrimination (3). Recently, various omics-based approaches have been undertaken to identify both tumor intrinsic and extrinsic factors which can serve as predictive biomarkers to ICB (39). Wu et al. reported that high-throughput gene expression data would further help prioritize important biomarkers and potential therapeutic targets for combination treatments with anti-PD-1 therapy for a given cancer type (39). Chen et al. also found that gene expression profiles between responder and non-responder are not significantly different for pre-treatment samples, but much more significantly for on-treatment samples (40). Our results also confirmed that CD274 mRNA expression measured by qRT-PCR closely correlated with PD-L1 IHC measured using FDA-approved assays. Kowanetz et al. also showed that CD274 mRNA expression had predictive value for responses to atezolizumab in UC (41). Although our patient cohort was small, we found that high CD274 mRNA expression determined by qRT-PCR predicted the responses of all 49 patients to immunotherapy with an AUC of 0.75, which was similar to that of PD-L1 IHC (0.76). Objective qRT-PCR assays are operator independent, and can resolve major disadvantages associated with PD-L1 IHC such as assay variance between vendors, subjective assessment by pathologists, and operator-dependent variations in results (42). Therefore, evaluating CD274 mRNA expression by qRT-PCR has potential as a diagnostic test with easy standardization and a rapid turnaround time.
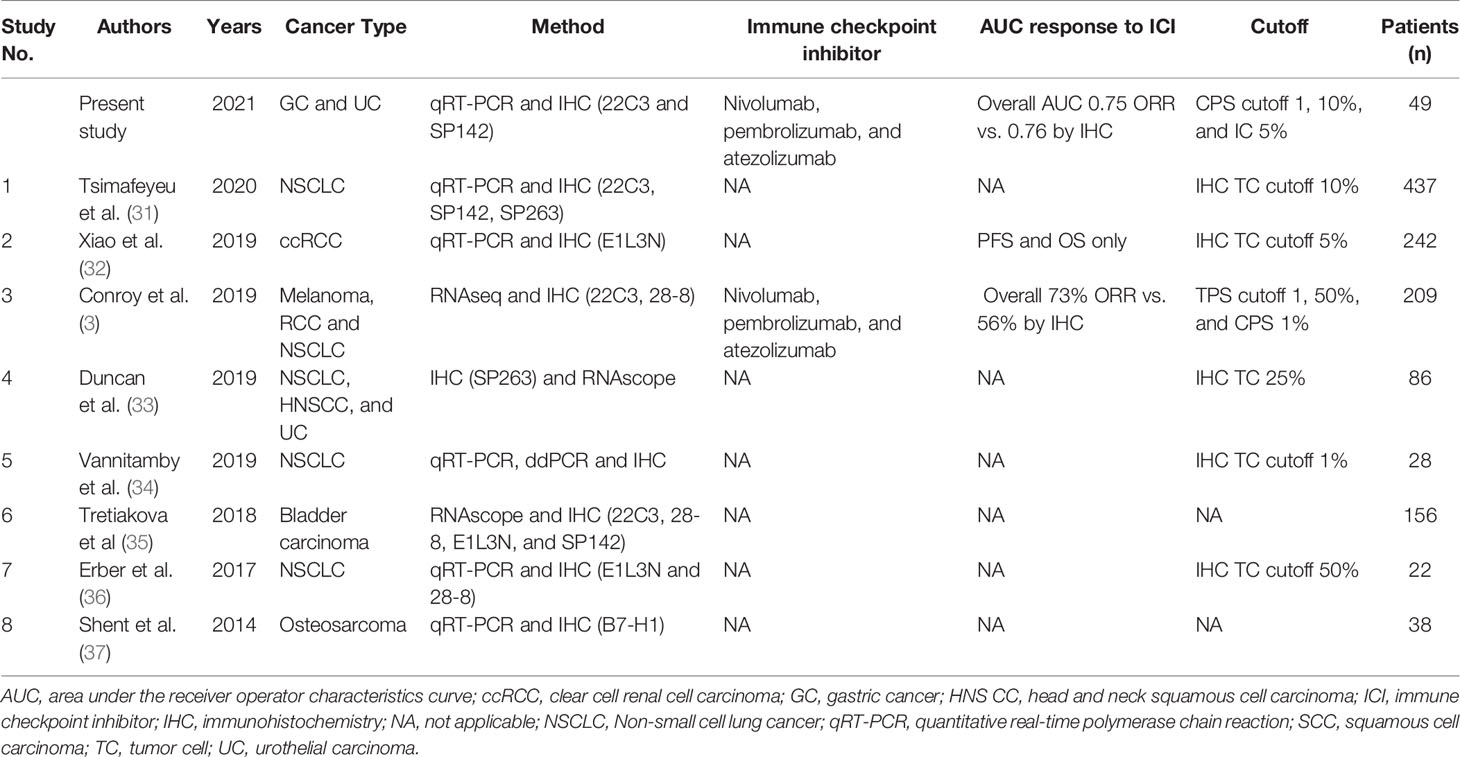
Table 3 Comparison of published CD274 mRNA expression and PD-L1 IHC data.
One limitation of this study is that it is a single-institutional retrospective investigation of a relatively small sample of patients treated with immunotherapy. We plan to validate our results in a prospective study. Another limitation is that we analyzed patients with GC and UC treated with various individual and combined immunotherapeutic agents in the same cohort. Although gastric and urothelial carcinomas are quite different in their nature, however, in predicting responses for immunotherapy using PD-L1 IHC, CPS is used in interpretation and both cancers were approved relatively early for immunotherapy. Therefore, we decided to study both gastric and urothelial carcinomas. Future studies could address this issue by evaluating patients with GC and UC who receive uniform treatment.
In conclusion, CD274 mRNA expression measured by qRT-PCR closely correlated with PD-L1 IHC measured using FDA-approved assays and predicted the responses of patients with GC or UC to ICBs.
The datasets presented in this study can be found in online repositories. The names of the repository/repositories and accession number(s) can be found in the article/Supplementary Material.
The studies involving human participants were reviewed and approved by the Institutional Review Board guidelines of the Samsung Medical Center (IRB 2018-09-041-001). The patients/participants provided their written informed consent to participate in this study.
SK and K-MK designed and supervised the study. SK, YH, GK and K-MK collected tissue samples and clinical data and performed histopathological examination. SK, YH, and K-MK analyzed the data. SK, YH, GK and K-MK conducted the experiments. SK and K-MK wrote the draft. SK, YH, GK and K-MK revised the manuscript. All authors reviewed and approved the final version of the manuscript.
This work was supported by the Basic Science Research Program through the National Research Foundation of Korea (NRF), funded by the Ministry of Science and ICT (NRF-2017R1A2B4012436), and a grant from the Korea Health Technology R&D Project through the Korea Health Industry Development Institute (KHIDI), funded by the Ministry of Health & Welfare, Republic of Korea (grant numbers: HR20C0025 and HI21C1137).
The authors declare that the research was conducted in the absence of any commercial or financial relationships that could be construed as a potential conflict of interest.
All claims expressed in this article are solely those of the authors and do not necessarily represent those of their affiliated organizations, or those of the publisher, the editors and the reviewers. Any product that may be evaluated in this article, or claim that may be made by its manufacturer, is not guaranteed or endorsed by the publisher.
The Supplementary Material for this article can be found online at: https://www.frontiersin.org/articles/10.3389/fonc.2022.856444/full#supplementary-material
1. Fuchs CS, Doi T, Jang RW-J, Muro K, Satoh T, Machado M, et al. KEYNOTE-059 Cohort 1: Efficacy and Safety of Pembrolizumab (Pembro) Monotherapy in Patients With Previously Treated Advanced Gastric Cancer. J Clin Oncol (2017) 35(15_suppl):4003. doi: 10.1200/JCO.2017.35.15_suppl.4003
2. Ahn S, Kim KM. PD-L1 Expression in Gastric Cancer: Interchangeability of 22C3 and 28-8 pharmDx Assays for Responses to Immunotherapy. Mod Pathol (2021) 34(9):1719–27. doi: 10.1038/s41379-021-00823-9
3. Conroy JM, Pabla S, Nesline MK, Glenn ST, Papanicolau-Sengos A, Burgher B, et al. Next Generation Sequencing of PD-L1 for Predicting Response to Immune Checkpoint Inhibitors. J ImmunoTher Cancer (2019) 7(1):18. doi: 10.1186/s40425-018-0489-5
4. Büttner R, Gosney JR, Skov BG, Adam J, Motoi N, Bloom KJ, et al. Programmed Death-Ligand 1 Immunohistochemistry Testing: A Review of Analytical Assays and Clinical Implementation in Non–Small-Cell Lung Cancer. J Clin Oncol (2017) 35(34):3867–76. doi: 10.1200/JCO.2017.74.7642
5. Prince EA, Sanzari JK, Pandya D, Huron D, Edwards R. Analytical Concordance of PD-L1 Assays Utilizing Antibodies From FDA-Approved Diagnostics in Advanced Cancers: A Systematic Literature Review. JCO Precis Oncol (2021) 5(5):953–73. doi: 10.1200/po.20.00412
6. Hansen AR, Siu LL. PD-L1 Testing in Cancer: Challenges in Companion Diagnostic Development. JAMA Oncol (2016) 2(1):15–6. doi: 10.1001/jamaoncol.2015.4685
7. Bhaijee F, Anders RA. PD-L1 Expression as a Predictive Biomarker: Is Absence of Proof the Same as Proof of Absence? JAMA Oncol (2016) 2(1):54–5. doi: 10.1001/jamaoncol.2015.3782
8. Mathew M, Safyan RA, Shu CA. PD-L1 as a Biomarker in NSCLC: Challenges and Future Directions. Ann Trans Med (2017) 5(18):6. doi: 10.21037/atm.2017.08.04
9. Goossens N, Nakagawa S, Sun X, Hoshida Y. Cancer Biomarker Discovery and Validation. Trans Cancer Res (2015) 4(3):256–69. doi: 10.3978/j.issn.2218-676X.2015.06.04
10. Narrandes S, Xu W. Gene Expression Detection Assay for Cancer Clinical Use. J Cancer (2018) 9(13):2249–65. doi: 10.7150/jca.24744
11. Penland SK, Keku TO, Torrice C, He X, Krishnamurthy J, Hoadley KA, et al. RNA Expression Analysis of Formalin-Fixed Paraffin-Embedded Tumors. Lab Invest (2007) 87(4):383–91. doi: 10.1038/labinvest.3700529
12. Blomquist TM, Crawford EL, Lovett JL, Yeo J, Stanoszek LM, Levin A, et al. Targeted RNA-Sequencing With Competitive Multiplex-PCR Amplicon Libraries. PloS One (2013) 8(11):e79120. doi: 10.1371/journal.pone.0079120
13. Li P, Conley A, Zhang H, Kim HL. Whole-Transcriptome Profiling of Formalin-Fixed, Paraffin-Embedded Renal Cell Carcinoma by RNA-Seq. BMC Genomics (2014) 15(1):1087. doi: 10.1186/1471-2164-15-1087
14. Wong ML, Medrano JF. Real-Time PCR for mRNA Quantitation. BioTechniques (2005) 39(1):75–85. doi: 10.2144/05391rv01
15. da Silva RN, Amorim AC, Brandão RM, de Andrade HM, Yokoo M, Ribeiro ML, et al. Real-Time PCR in Clinical Practice: A Powerful Tool for Evaluating Leishmania Chagasi Loads in Naturally Infected Dogs. Ann Trop Med Parasitol (2010) 104(2):137–43. doi: 10.1179/136485910x12647085215453
16. Zeka F, Vanderheyden K, De Smet E, Cuvelier CA, Mestdagh P, Vandesompele J. Straightforward and Sensitive RT-qPCR Based Gene Expression Analysis of FFPE Samples. Sci Rep (2016) 6(1):21418. doi: 10.1038/srep21418
17. Seymour L, Bogaerts J, Perrone A, Ford R, Schwartz LH, Mandrekar S, et al. iRECIST: Guidelines for Response Criteria for Use in Trials Testing Immunotherapeutics. Lancet Oncol (2017) 18(3):e143–52. doi: 10.1016/s1470-2045(17)30074-8
18. Heo YJ, Kang SY, Kim ST, Kang WK, Lee J, Kim KM. Combined Biomarker for Prediction of Response to an Immune Checkpoint Inhibitor in Metastatic Gastric Cancer. Precis Future Med (2019) 3(4):165–75. doi: 10.23838/pfm.2019.00079
19. Park C, Cho J, Lee J, Kang SY, An JY, Choi MG, et al. Host Immune Response Index in Gastric Cancer Identified by Comprehensive Analyses of Tumor Immunity. Oncoimmunology (2017) 6(11):1356150. doi: 10.1080/2162402X.2017.1356150
20. Sim J, Heo YJ, Bae H, Shin HC, Kim B, Cho J, et al. MET Is Overexpressed in Microsatellite Instability-High Gastric Carcinoma. Pathol Res Pract (2019) 215(3):433–8. doi: 10.1016/j.prp.2018.11.010
21. Ventana. Ventana PD-L1 (SP142) Assay: Interpretation Guide for Non-Small Cell Lung Cancer ≥ 50% TC or ≥ 10% IC Stepwise Scoring Algorithm. Arizona:Ventana Medical Systems, Inc. and Roche Diagnostics International, Inc. (2020). Available at: https://www.accessdata.fda.gov/cdrh_docs/pdf16/p160002c.pdf.
22. Topalian SL, Taube JM, Anders RA, Pardoll DM. Mechanism-Driven Biomarkers to Guide Immune Checkpoint Blockade in Cancer Therapy. Nat Rev Cancer (2016) 16(5):275–87. doi: 10.1038/nrc.2016.36
23. Doroshow DB, Bhalla S, Beasley MB, Sholl LM, Kerr KM, Gnjatic S, et al. PD-L1 as a Biomarker of Response to Immune-Checkpoint Inhibitors. Nat Rev Clin Oncol (2021) 18(6):345–62. doi: 10.1038/s41571-021-00473-5
24. Kerr KM. The PD-L1 Immunohistochemistry Biomarker: Two Steps Forward, One Step Back? J Thorac Oncol (2018) 13(3):291–4. doi: 10.1016/j.jtho.2018.01.020
25. Martinez-Morilla S, Moutafi M, Rimm DL. Standardization of PD-L1 Immunohistochemistry. Modern Pathol (2021) 35(3):294–5. doi: 10.1038/s41379-021-00917-4
26. Fuchs CS, Doi T, Jang RW, Muro K, Satoh T, Machado M, et al. Safety and Efficacy of Pembrolizumab Monotherapy in Patients With Previously Treated Advanced Gastric and Gastroesophageal Junction Cancer: Phase 2 Clinical KEYNOTE-059 Trial. JAMA Oncol (2018) 4(5):e180013. doi: 10.1001/jamaoncol.2018.0013
27. Kang YK, Boku N, Satoh T, Ryu MH, Chao Y, Kato K, et al. Nivolumab in Patients With Advanced Gastric or Gastro-Oesophageal Junction Cancer Refractory to, or Intolerant of, at Least Two Previous Chemotherapy Regimens (ONO-4538-12, ATTRACTION-2): A Randomised, Double-Blind, Placebo-Controlled, Phase 3 Trial. Lancet (2017) 390(10111):2461–71. doi: 10.1016/S0140-6736(17)31827-5
28. Shitara K, Ozguroglu M, Bang YJ, Di Bartolomeo M, Mandala M, Ryu MH, et al. Pembrolizumab Versus Paclitaxel for Previously Treated, Advanced Gastric or Gastro-Oesophageal Junction Cancer (KEYNOTE-061): A Randomised, Open-Label, Controlled, Phase 3 Trial. Lancet (2018) 392(10142):123–33. doi: 10.1016/S0140-6736(18)31257-1
29. Shitara K, Van Cutsem E, Bang YJ, Fuchs C, Wyrwicz L, Lee KW, et al. Efficacy and Safety of Pembrolizumab or Pembrolizumab Plus Chemotherapy vs Chemotherapy Alone for Patients With First-Line, Advanced Gastric Cancer: The KEYNOTE-062 Phase 3 Randomized Clinical Trial. JAMA Oncol (2020) 6(10):1571–80. doi: 10.1001/jamaoncol.2020.3370
30. Eckstein M, Cimadamore A, Hartmann A, Lopez-Beltran A, Cheng L, Scarpelli M, et al. PD-L1 Assessment in Urothelial Carcinoma: A Practical Approach. Ann Transl Med (2019) 7(22):690. doi: 10.21037/atm.2019.10.24
31. Tsimafeyeu I, Imyanitov E, Zavalishina L, Raskin G, Povilaitite P, Savelov N, et al. Agreement Between PDL1 Immunohistochemistry Assays and Polymerase Chain Reaction in Non-Small Cell Lung Cancer: CLOVER Comparison Study. Sci Rep (2020) 10(1):3928. doi: 10.1038/s41598-020-60950-2
32. Xiao W-J, Xu F-J, Zhang X, Zhou S-X, Zhang H-L, Dai B, et al. The Prognostic Value of Programmed Death-Ligand 1 in a Chinese Cohort With Clear Cell Renal Cell Carcinoma. Front Oncol (2019) 9:879. doi: 10.3389/fonc.2019.00879
33. Duncan DJ, Scott M, Scorer P, Barker C. Assessment of PD-L1 mRNA and Protein Expression in Non-Small Cell Lung Cancer, Head and Neck Squamous Cell Carcinoma and Urothelial Carcinoma Tissue Specimens Using RNAScope and Immunohistochemistry. PloS One (2019) 14(4):e0215393. doi: 10.1371/journal.pone.0215393
34. Vannitamby A, Hendry S, Makadia T, Danks J, Slavin J, Irving L, et al. A Novel Approach to Detect Programed Death Ligand 1 (PD-L1) Status and Multiple Tumor Mutations Using a Single Non-Small-Cell Lung Cancer (NSCLC) Bronchoscopy Specimen. J Mol Diagn (2019) 21(2):186–97. doi: 10.1016/j.jmoldx.2018.10.001
35. Tretiakova M, Fulton R, Kocherginsky M, Long T, Ussakli C, Antic T, et al. Concordance Study of PD-L1 Expression in Primary and Metastatic Bladder Carcinomas: Comparison of Four Commonly Used Antibodies and RNA Expression. Mod Pathol (2018) 31(4):623–32. doi: 10.1038/modpathol.2017.188
36. Erber R, Stöhr R, Herlein S, Giedl C, Rieker RJ, Fuchs F, et al. Comparison of PD-L1 mRNA Expression Measured With the CheckPoint Typer® Assay With PD-L1 Protein Expression Assessed With Immunohistochemistry in Non-Small Cell Lung Cancer. Anticancer Res (2017) 37(12):6771–8. doi: 10.21873/anticanres.12137
37. Shen JK, Cote GM, Choy E, Yang P, Harmon D, Schwab J, et al. Programmed Cell Death Ligand 1 Expression in Osteosarcoma. Cancer Immunol Res (2014) 2(7):690–8. doi: 10.1158/2326-6066.Cir-13-0224
38. Vannitamby A, Hendry S, Irving L, Steinfort D, Bozinovski S. Novel Multiplex Droplet Digital PCR Assay for Scoring PD-L1 in non-Small Cell Lung Cancer Biopsy Specimens. Lung Cancer (2019) 134:233–7. doi: 10.1016/j.lungcan.2019.06.029
39. Wu C-C, Wang YA, Livingston JA, Zhang J, Futreal PA. Prediction of Biomarkers and Therapeutic Combinations for Anti-PD-1 Immunotherapy Using the Global Gene Network Association. Nat Commun (2022) 13(1):42. doi: 10.1038/s41467-021-27651-4
40. Chen PL, Roh W, Reuben A, Cooper ZA, Spencer CN, Prieto PA, et al. Analysis of Immune Signatures in Longitudinal Tumor Samples Yields Insight Into Biomarkers of Response and Mechanisms of Resistance to Immune Checkpoint Blockade. Cancer Discov (2016) 6(8):827–37. doi: 10.1158/2159-8290.Cd-15-1545
41. Kowanetz M, Zou W, Gettinger SN, Koeppen H, Kockx M, Schmid P, et al. Differential Regulation of PD-L1 Expression by Immune and Tumor Cells in NSCLC and the Response to Treatment With Atezolizumab (Anti–PD-L1). Proc Natl Acad Sci (2018) 115(43):E10119–26. doi: 10.1073/pnas.1802166115
Keywords: mRNA expression, immunotherapy, gastric, urothelial, CD274, carcinoma
Citation: Kang SY, Heo YJ, Kwon GY and Kim K-M (2022) Expression of CD274 mRNA Measured by qRT-PCR Correlates With PD-L1 Immunohistochemistry in Gastric and Urothelial Carcinoma. Front. Oncol. 12:856444. doi: 10.3389/fonc.2022.856444
Received: 17 January 2022; Accepted: 25 March 2022;
Published: 27 April 2022.
Edited by:
Massimo Fantini, Precision Biologics Inc., United StatesReviewed by:
Scot Niglio, National Cancer Institute (NIH), United StatesCopyright © 2022 Kang, Heo, Kwon and Kim. This is an open-access article distributed under the terms of the Creative Commons Attribution License (CC BY). The use, distribution or reproduction in other forums is permitted, provided the original author(s) and the copyright owner(s) are credited and that the original publication in this journal is cited, in accordance with accepted academic practice. No use, distribution or reproduction is permitted which does not comply with these terms.
*Correspondence: Kyoung-Mee Kim, a2tta3lzQHNra3UuZWR1
Disclaimer: All claims expressed in this article are solely those of the authors and do not necessarily represent those of their affiliated organizations, or those of the publisher, the editors and the reviewers. Any product that may be evaluated in this article or claim that may be made by its manufacturer is not guaranteed or endorsed by the publisher.
Research integrity at Frontiers
Learn more about the work of our research integrity team to safeguard the quality of each article we publish.