 Ronglin Wang†
 Yongdong Guo†Peixiang Ma†Yang SongJie MinTing ZhaoLei Hua
 Chao Zhang
 Cheng YangJingjie ShiLiaoliao Zhu
 Dongxue GanShanshan Li
 Junqiang Li*
 Haichuan Su*
- Department of Oncology, Tangdu Hospital, Air Force Medical University, Xi'an, China
Background: Pancreatic adenocarcinoma (PAAD) is one of the most malignant cancers and has a poor prognosis. As a critical RNA modification, 5-methylcytosine (m5C) has been reported to regulate tumor progression, including PAAD progression. However, a comprehensive analysis of m5C regulators in PAAD is lacking.
Methods: In the present study, PAAD datasets were obtained from the Gene Expression Omnibus (GEO), The Cancer Genome Atlas (TCGA), International Cancer Genome Consortium (ICGC), and ArrayExpress databases. The expression pattern of m5C regulators were analyzed and patients were divided into different m5C clusters according to consensus clustering based on m5C regulators. Additionally, m5C differentially expressed genes (DEGs) were determined using Limma package. Based on m5C DEGs, patients were divided into m5C gene clusters. Moreover, m5C gene signatures were derived from m5C DEGs and a quantitative indicator, the m5C score, was developed from the m5C gene signatures.
Results: Our study showed that m5C regulators were differentially expressed in patients with PAAD. The m5C clusters and gene clusters based on m5C regulators and m5C DEGs were related to immune cell infiltration, immune-related genes and patient survival status, indicating that m5C modification play a central role in regulating PAAD development partly by modulating immune microenvironment. Additionally, a quantitative indicator, the m5C score, was also developed and was related to a series of immune-related indicators. Moreover, the m5C score precisely predicted the immunotherapy response and prognosis of patients with PAAD.
Conclusion: In summary, we confirmed that m5C regulators regulate PAAD development by modulating the immune microenvironment. In addition, a quantitative indicator, the m5C score, was developed to predict immunotherapy response and prognosis and assisted in identifying PAAD patients suitable for tailored immunotherapy strategies.
Introduction
Pancreatic adenocarcinoma (PAAD) is one of the most malignant cancers worldwide. Because of the lack of an early diagnosis strategy, distant tumor metastasis often occurs, after which patients are not eligible for surgical resection. The five-year survival rate of patients with PAAD is approximately 5% (1). Chemotherapy and radiotherapy are the standard treatments for patients with PAAD and improve prognosis to some extent. Immunotherapy is a promising treatment to prolong the prognosis of PAAD and improve the quality of life of PAAD patients, although unfortunately, a large number of PAAD patients are resistant to immunotherapy (2). Uncovering the underlying mechanisms and validating novel response indicators can assist in the clinical application of immunotherapy.
Many factors have been reported to modulate immunotherapy sensitivity, and the tumor microenvironment (TME) is one of the most critical factors (3). The TME is composed of immune cells, surrounding fibroblasts, intercellular stroma, microvessels, and infiltrating biological molecules. Among these, infiltrating immune cells play a central role in modulating the immunotherapy response. It has been reported that an increased number of cytotoxic T cells and dendritic cells and a decreased number of Treg cells help limit tumor growth (4–6). Critical factors or pathways regulating immune cell infiltration are related to immunotherapy response and survival status. For example, m6A (N6-methyladenosine) modification was reported to modulate the TME, and in models, m6A regulators were perfect indicators for predicting immunotherapy response in previous and our studies (7–9). More indicators urgently need to be discovered and validated.
5-Methylcytosine (m5C) is a prevalent RNA modification. Similar to m6A modification, m5C modification has three types of regulators: methyltransferases (writers), demethylases (erasers), and binding proteins (readers). By recognizing specific motifs, regulators control the m5C modification level. m5C modification has been reported to modulate cancer development by regulating target RNA stability, translocation, and translation (10). In bladder cancer, the m5C modification writer NSUN2 was shown to promote cancer development by regulating HDGF expression in an m5C modification-dependent manner (11). In lung adenocarcinoma, the long noncoding RNA (lncRNA) LINC00312 targets YBX1 to promote cancer migration and vasculogenic mimicry (12).
m5C modification is also related to the TME. In CD4+ T cells, dysregulated m5C modification was examined, and target mRNAs were related to systemic lupus erythematosus (SLE) pathogenesis (13). In triple-negative breast cancer, m5C modification regulators were found to affect the TME and predict patient prognosis (13). In lung adenocarcinoma, 14 lncRNAs were found to be regulated by m5C modifications. Moreover, these lncRNAs were found to modulate the TME and predict the survival status of patients (14). Additionally, some bioinformatics analyses also indicated m5C modification regulates the TME and affects tumor progression (15–19). In PAAD, the decreased level of the m5C regulator NSUN6 represses tumor proliferation (20). However, to date, there has been no comprehensive analysis of m5C modifications in PAAD. The role of m5C regulators in the PAAD TME and PAAD development is largely unknown.
In the present study, we found that m5C regulators were differentially expressed between PAAD tissues and corresponding normal tissues. Stratification analyses based on m5C regulators and the m5C differentially expressed genes (DEGs) between m5C clusters revealed that m5C modification was related to the TME and associated with the survival status of PAAD patients. Additionally, the m5C score was determined based on the m5C DEGs for PAAD patients to characterize the PAAD TME. The m5C score precisely predicted the immunotherapy response and prognosis of patients with PAAD. The workflow of the present study is shown in Figure 1.
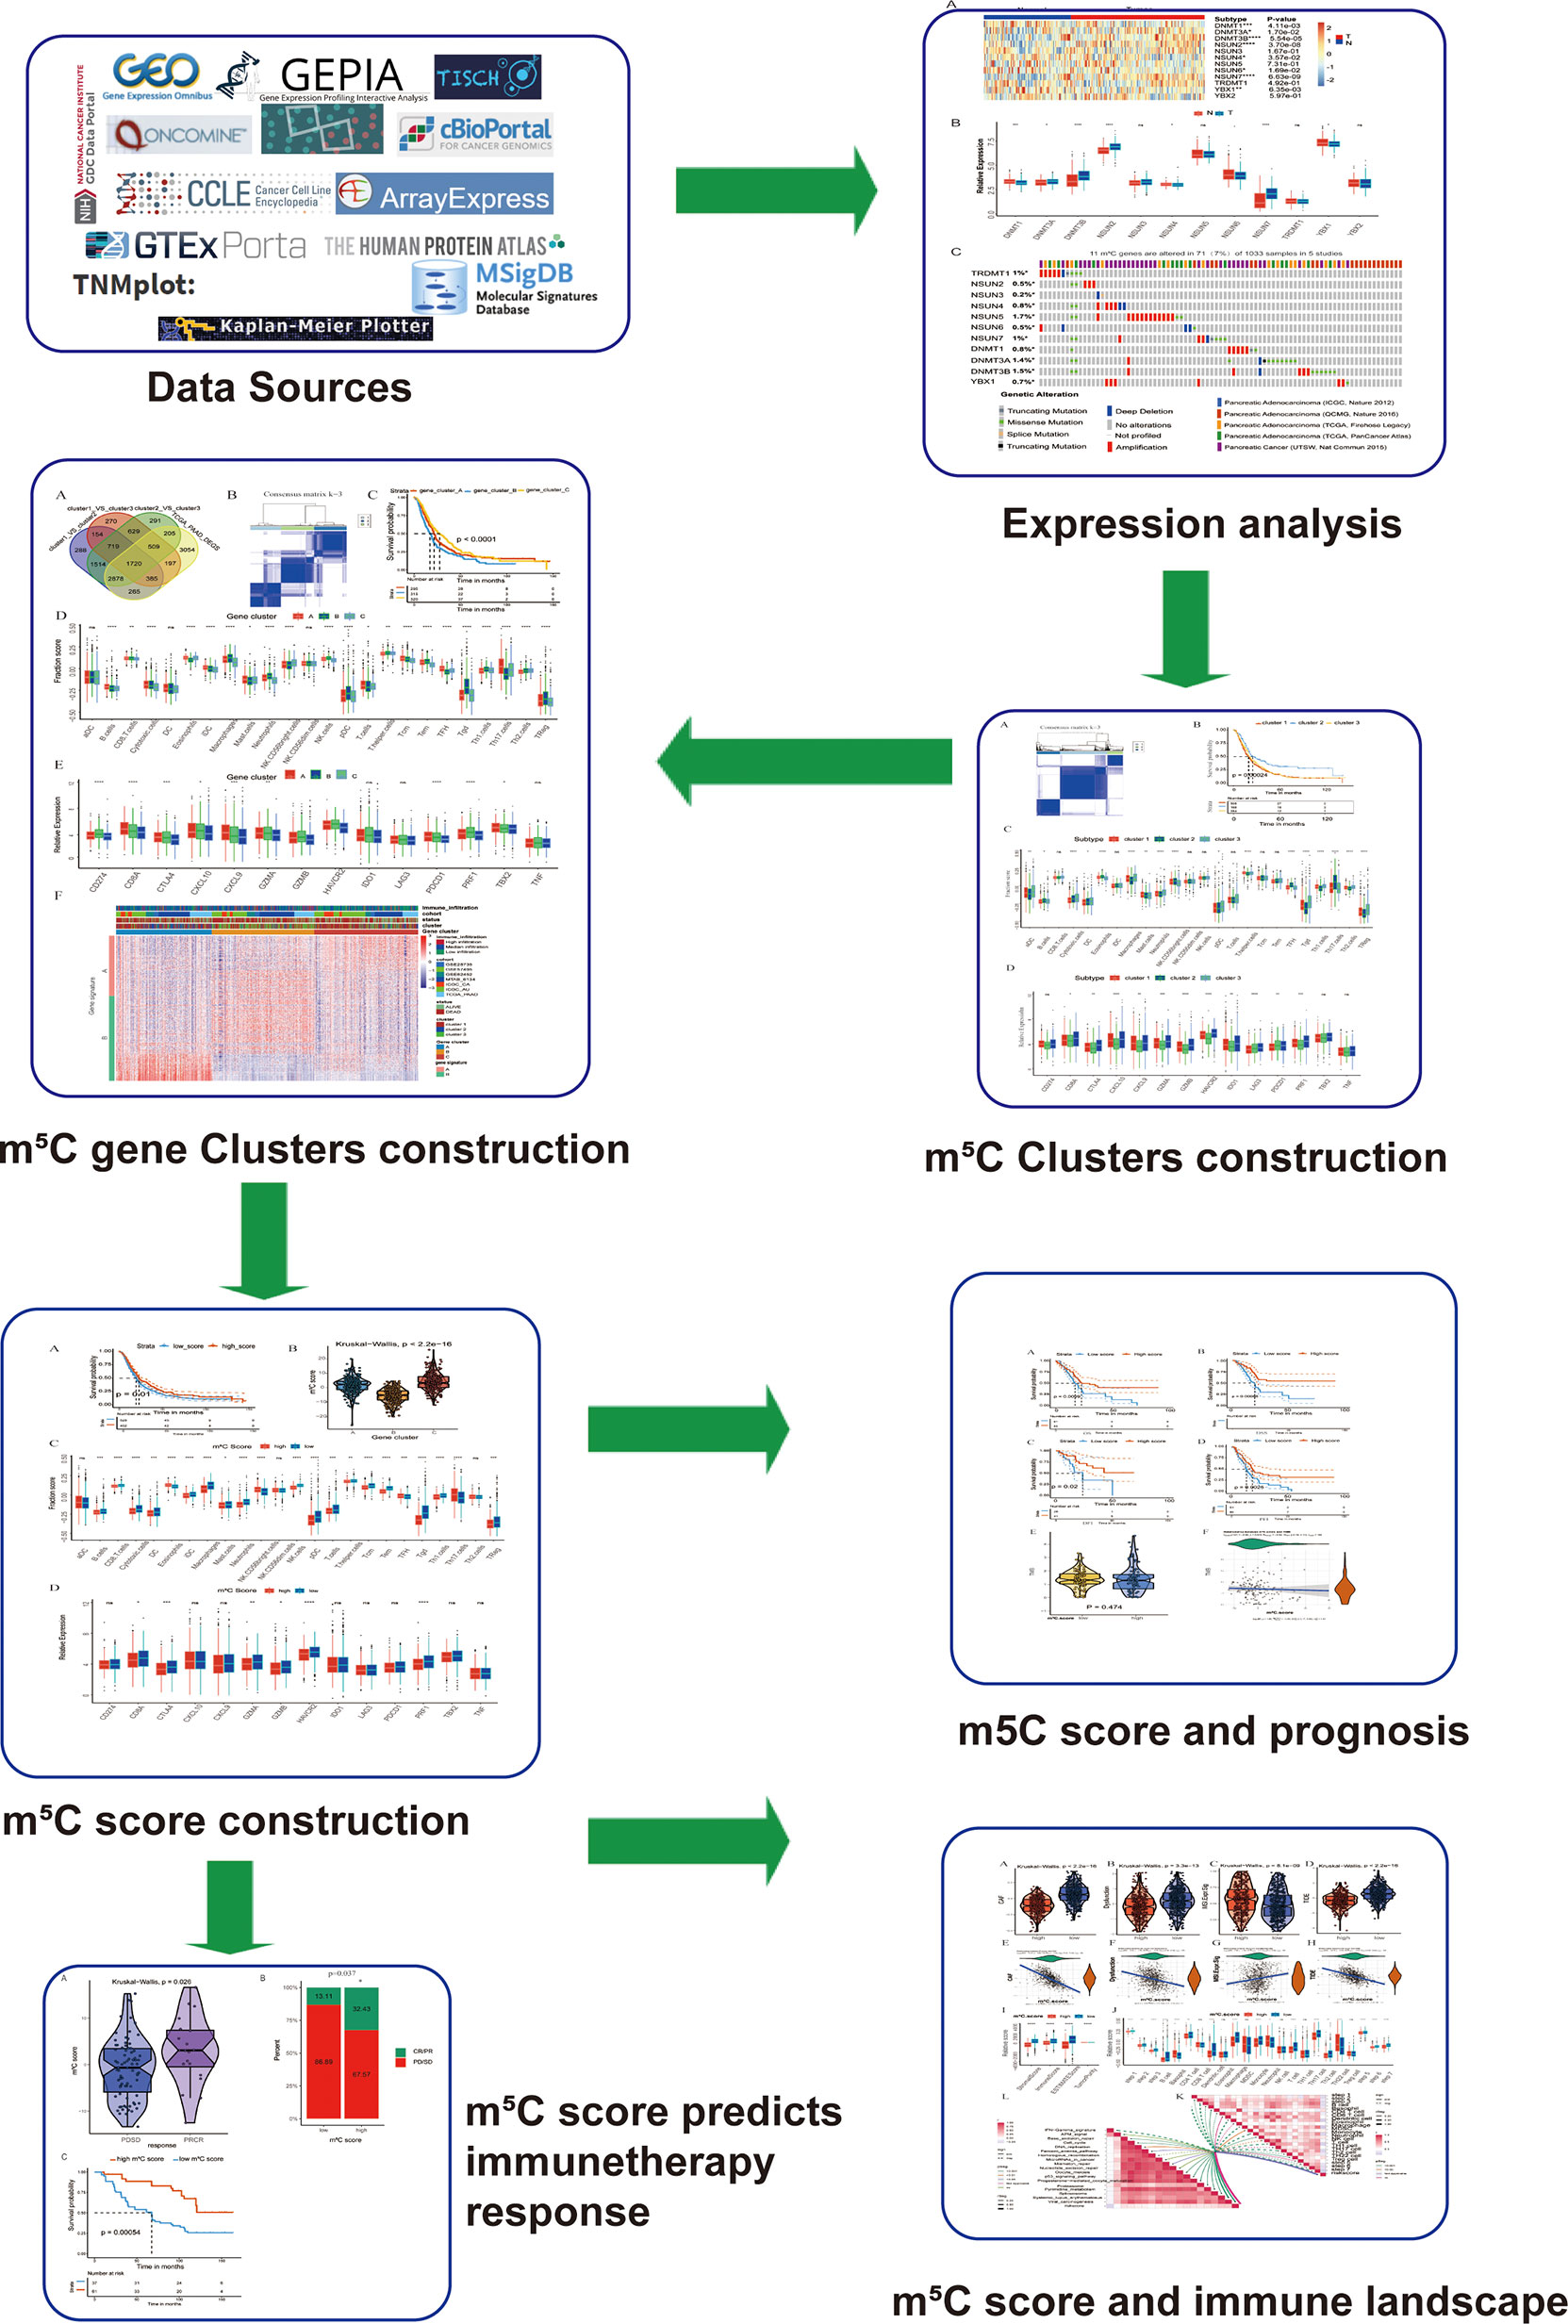
Figure 1 Workflow of the present study. To explore the function and underlying mechanism of m5C regulators in PAAD immunotherapy response and development, we downloaded and integrated multiple PAAD datasets. The expression pattern and genetic alteration of m5C regulators were analyzed firstly. Then patients were divided into m5C clusters and gene clusters using unsupervised clustering method. Bioinformatic analysis of m5C clusters and gene clusters indicated they were related with immune microenvironment of PAAD. Additionally, a quantitative indicator m5C score was constructed, which reflected immune microenvironment, predicted immunotherapy response and correlated with patients’ prognosis.
Materials and Methods
Collection and Preprocessing of PAAD Datasets
The integrated dataset containing seven independent PAAD datasets has been described in our previous studies (9). We collected the PAAD datasets from the Gene Expression Omnibus (GEO) (https://www.ncbi.nlm.nih.gov/geo/), The Cancer Genome Atlas (TCGA) (https://www.cancer.gov/about-nci/organization/ccg/research/structural-genomics/tcga), International Cancer Genome Consortium (ICGC) (https://dcc.icgc.org/), and ArrayExpress databases (https://www.ebi.ac.uk/arrayexpress). Patients without survival information were eliminated from the integrated datasets. Seven independent datasets, namely, the GSE28735, GSE57495, GSE62452, MTAB-6134, TCGA-PAAD, ICGC-AU and ICGC-CA datasets, were collected as the training cohort, and the datasets included 930 patients with PAAD. The details of these seven datasets were summarized in sheet 1, 3, 8 and 9 of Supplementary Table 1. XLX (In the supplementary data). For it’s difficult to find more PAAD datasets with clinical data, we validated our results in three datasets of the seven datasets. The ICGC-AU and ICGC-CA datasets, including 295 patients, and the TCGA-PAAD dataset were used as the validation cohort for further analysis. The ComBat method from the “SVA” package was used to correct the batch effects from nonbiological technical biases (21). In this process, some information was lost, and we could not detect the expression of YBX2 in the integrated dataset with 930 PAAD patients.
Examination of m5C Regulator Expression
Twelve m5C regulators were determined based on previous studies (14, 22). For GSE62165 dataset has no clinical data, it’s excluded from the integrated dataset. For GSE62165 has both PAAD and corresponding normal tissues, it was used to analyze the mRNA expression of these twelve regulators. Additionally, the protein expression of these regulators was acquired from the Human Protein Atlas (HPA) database (http://www.proteinatlas.org/). Genetic alteration was thought to modulate gene expression. To uncover the underlying mechanism of m5C regulators expression pattern, the cBioPortal database (http://www.cbioportal.org/) was used to examine m5C regulator genetic alterations, including amplification, deep deletion, and missense mutations.
Consensus Clustering Based on m5C Regulators
Based on m5C regulator expression levels, the patients with PAAD were divided into different clusters using the unsupervised clustering package “ConsensusClusterPlus” (23). To validate the classification stability, this process was repeated 1000 times. The principal component analysis was performed using the “PCA” package in R software.
Analysis of Immune Cell Infiltration by Single-Sample Gene Set Enrichment Analysis (ssGSEA)
The ssGSEA algorithm was used to analyze the infiltration level of 24 immune cell types that play critical roles in cancer immunity (24). The marker genes for each type of immune cell were determined according to previous studies (25–27). Based on the immune infiltration level, the patients in the dataset were divided into high-, moderate- and low-infiltration groups using unsupervised clustering.
Detection of ESTIMATE and the Tumor Immune Dysfunction and Exclusion (TIDE) Scores
The ESTIMATE algorithm was used to calculate the immunoscore and stromal score (28). By analyzing specific mRNA expression, we also determined tumor cellularity and tumor purity (28). The TIDE score was determined using the TIDE algorithm (29). A high TIDE score indicates that cancer cells are more likely to resist immunotherapy and promote immune evasion.
Extraction of m5C Relative Differentially Expressed Genes (m5C DEGs) and Calculation of m5C Score
Firstly, we extracted differently expressed genes (DEGs) between normal and tumor tissues in PAAD patients from GEPIA database (http://gepia2.cancer-pku.cn/#index) (30). Then, we obtained 2439 differentially expressed genes among three m5C clusters by using limma packages in R software and an adjusted p<0.05 was set as the cutoff value (31). Lastly, we took intersection from DEGs (from GEPIA) and 2439 DEGs (from m5C clusters) to increase the specificity of the target genes. Generally, we obtained 1720 merged differentially expressed m5C-related genes (m5C DEGs). We performed unsupervised clustering of these m5C DEGs in training cohort and divided the cohort into three clusters, named gene cluster A, B, and C. The gene signatures that were positively correlated with gene cluster were named as m5C gene signature A, and the rest m5C DEGs were termed as m5C gene signature B. We performed functional enrichment analysis of m5C gene signature A and B using over representation analysis. In order to reduce the noise or redundant genes, we used the Boruta algorithm to perform dimension reduction in the m5C gene signature A and B (32).
To construct the m5C score, principal component analysis (PCA) was utilized to construct m5C score from the m5C gene signature A and B. (1) the PC1A represent the first component of m5C gene signature A, and (2) the PC1B represent the first component of m5C gene signature B. m5C score = ∑PC1A-∑PC1B. 930 patients in training cohort were stratified into two subgroups as high- and low- m5C score by using surv_cutpoint function in the survminer package in R software.
Establishment of the Immunotherapy Cohort
GSE91061 was downloaded to explore the ability of the m5C score to predict immunotherapy response. The GSE91061 dataset contains patients with melanoma receiving PD-1 treatment (33).
Analysis of Functional Mechanisms
Gene set variation analysis (GSVA) was used to explore the underlying characteristic of the high and low m5C score groups of patients with PAAD (34). The hallmark gene set (h.all.v6.2.entrez.gmt) was obtained from the Molecular Signatures Database (MSigDB). The cancer immunity cycle and immunotherapy-related pathways were detected according to previous studies (35, 36). Additionally, we obtained cancer driver genes from the Integrative OncoGenomics database (IntOGen, https://www.intogen.org/) (37).
Examination of Chemotherapy Response
The "pRRophetic" package in R was used to analyze the chemotherapy response (IC50) based on the Genomics of Drug Sensitivity in Cancer (GDSC) database (38). IC50 indicates the effects of the tested drugs on suppressing cell growth. If p value < 0.05, it indicates the sensitivity of the drug is different between high m5C and low m5C groups
Western Blot
PAAD tissues and control tissues were obtained from patients who underwent surgical resection at Tangdu Hospital. Written informed consent was obtained from every patient, and all procedures performed in patients were approved by the Research Ethics Committee of Tangdu Hospital. The tissues were cut into small pieces using scissors and lysed with lysis buffer (C1053-100, Applygen, Beijing, China) supplemented with protease and phosphatase inhibitors (04906837001 and 04693159001, Roche, Basel, Switzerland). After incubation on ice for 0.5 h, the samples were centrifuged, and the supernatant was collected. The protein concentration was analyzed using a BCA kit (23225, Thermo, MA, US). The samples were analyzed using 10% SDS gel electrophoresis and transferred to polyvinylidene fluoride (PVDF) membranes. The blots were incubated with primary antibodies at 4°C overnight. As YBX2 was not detectable in the integrated dataset, we only examined 11 m5C modification regulators in PAAD and corresponding tissues. Anti-DNMT1 (A19679), anti-DNMT3A (A19659), anti-DNMT3B (A11079), anti-NSUN2 (A3443), anti-NSUN3 (A12892), anti-NSUN4 (A14983), anti-NSUN5 (A5992), anti-NSUN6 (A7205), anti-TRDMT1 (A10535), anti-YBX1 (A7704) and anti-GAPDH (A19056) antibodies were purchased from Abclonal (Wuhan, China). The anti-NSUN7 (17546-1-AP) antibody and secondary HRP antibodies (SA00001-1 and SA00001-2) were purchased from Proteintech (Wuhan, China). The blots were washed with TBST buffer three times and incubated with the corresponding secondary HRP antibodies for 2 h at room temperature. Finally, the blots were assessed using a GelDoc XR+ gel imager (Bio-Rad, USA).
Statistical Analysis
R-4.0.4 was used to perform the statistical analyses in this study. For quantitative data, Student’s t tests were used for normally distributed variables, and the Wilcoxon rank-sum test was used for nonnormally distributed variables. To compare more than two groups, Kruskal–Wallis tests and one-way ANOVA were used as nonparametric and parametric methods, respectively. The Kaplan–Meier method and the Cox proportional hazards model were used to analyze survival. The “survival” and “Survminer” packages were used to examine the association between the factors and prognosis. The surv-cutpoint function from the “survival” package was applied to divide the included PAAD samples into different subtypes. Correlation analysis in the present study was performed with Pearson or Spearman correlation coefficients and using the “corrplot” package in R software. All comparisons were two-sided with an alpha level of 0.05, and the Bonferroni method was used to control the false discovery rate (FDR) for multiple hypothesis testing.
Results
Landscape of Expression and Genetic Alterations of m5C Regulators in PAAD
m5C regulators play a critical role in maintaining target RNA stability, translation, or translocation (39). However, the landscape of expression and genetic alterations of m5C regulators has not been elucidated in PAAD. We analyzed the expression pattern of m5C regulators in GSE62165, which contains 131 PAAD tissues and adjacent normal tissues. The present results indicated that the levels of DNMT3B, NSUN6, NSUN7 and YBX2 mRNA were significantly decreased while the levels of DNMT1, DNMT3A, NSUN2, NSUN3, NSUN5 and YBX1 mRNA were significantly increased in PAAD patients (Figures 2A, B). We also analyzed the protein expression of m5C regulators using the Human Protein Atlas (HPA) database (Supplementary Figure 1). Our results showed that NSUN6 levels were decreased in PAAD, in line with previously established expression patterns (20). Genetic alterations are critical factors that influence disease progression (40). We examined the genetic alterations of these regulators in cBioPortal database. These results indicated that 51 of the 259 (19.69%) PAAD patients in 2 studies experienced genetic alterations of 12 m5C regulators (Figure 2C). The results confirmed that m5C regulators are differentially expressed in PAAD patients, which may play a critical role in PAAD progression.
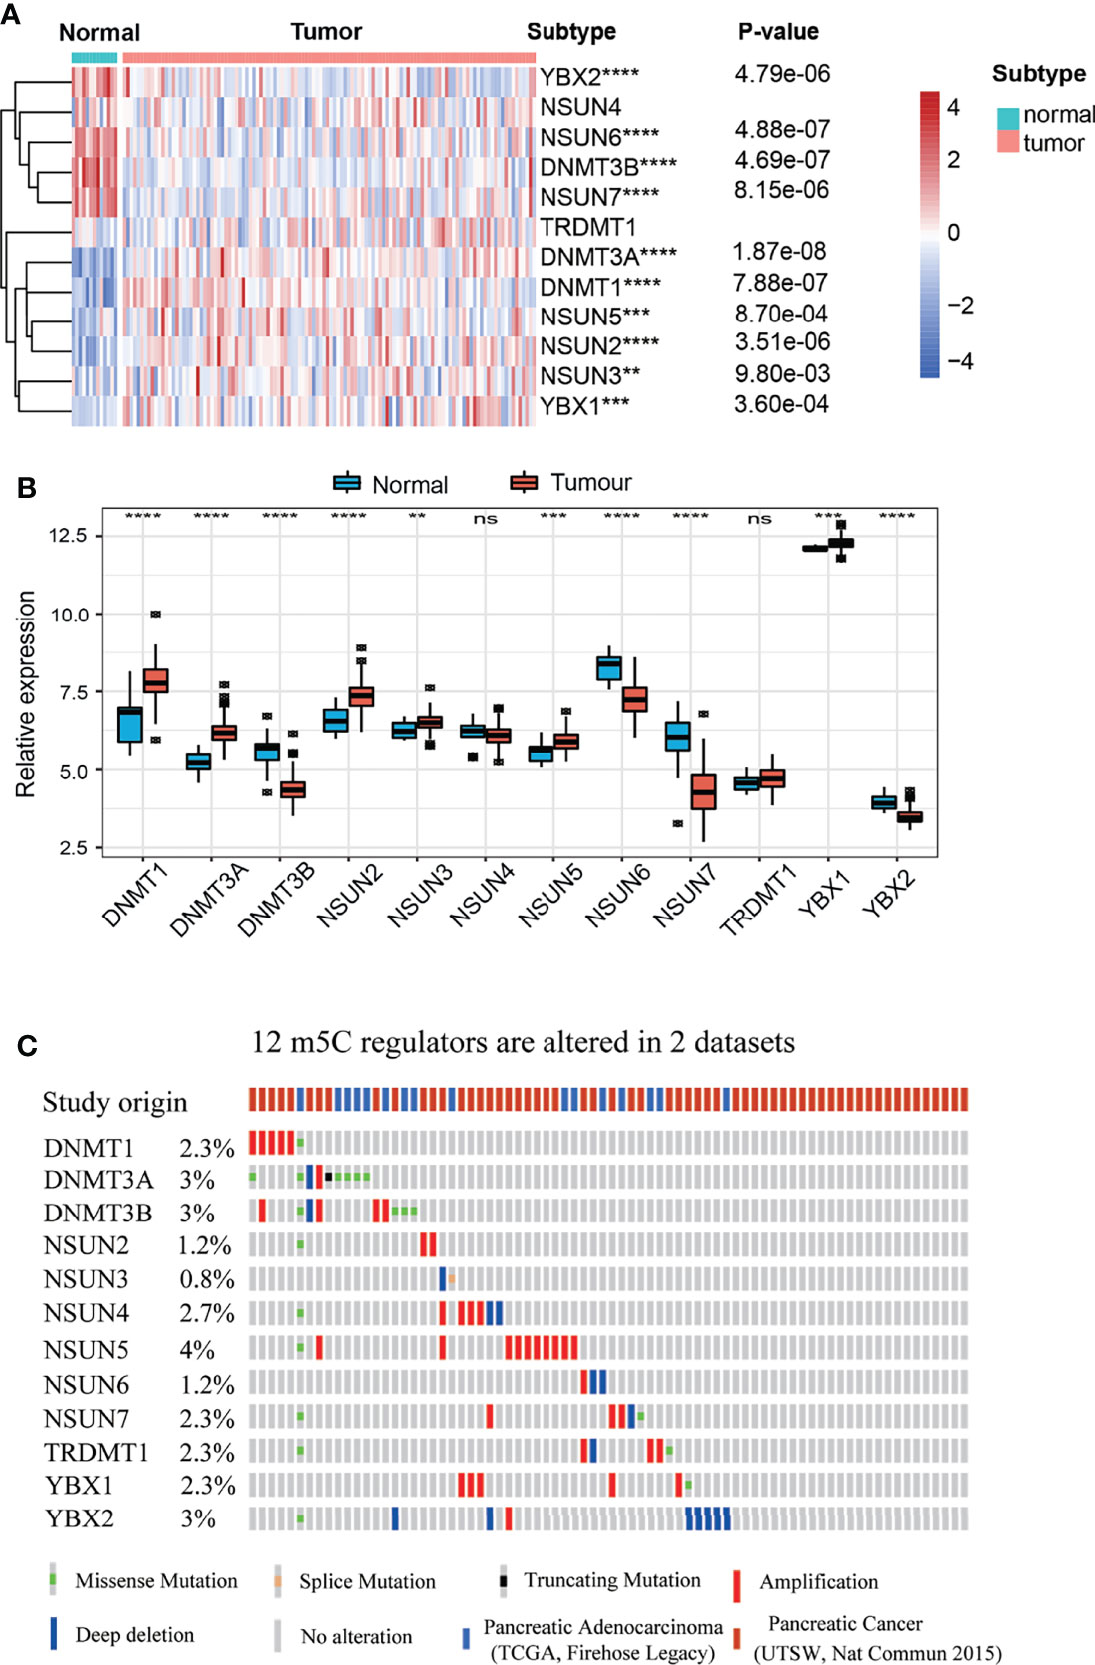
Figure 2 Landscape of expression and genetic alterations of m5C regulators in PAAD. (A, B) The mRNA expression levels of 12 m5C regulators between normal and PAAD samples in the GSE61625 dataset. (C) Fifty-one of the 259 PAAD patients in 2 studies had genetic alterations of 12 m5C regulators in the cBioPortal database. ** represents p value < 0.01, *** represents p value < 0.001, **** represents p value < 0.0001, ns means "not statistically significant".
Identification of Consensus Clusters and Analysis of Correlations Between the Clusters and the Immune Microenvironment
As shown in our previous studies, we conducted further analysis in the integrated dataset with 930 PAAD patients, which was composed of seven dependent PAAD dataset with clinical data (9). According to the similarity displayed by the m5C regulator expression levels, k = 3 was identified, with optimal clustering stability from k = 2 to 9 (Supplementary Figure 2). The integrated dataset was divided into three independent m5C clusters (Figure 3A). As shown in Figure 3B, m5C clusters were significantly related to PAAD patient survival status. m5C cluster 2 had the best overall survival (OS) when compared to clusters 1 and 3 (Figure 3B). This result confirms that m5C regulators are critical factors influencing the prognosis of PAAD. It has been reported m5C modification is involved in immune microenvironment regulation (22). Then we analyzed the correlation between m5C regulators and immune microenvironment of PAAD. The result indicated immune cell infiltration was differentially distributed between the m5C clusters. Specifically, m5C cluster 2 had the highest proportions of B cells, NK CD56 bright cells, Tfh cells, Th17 cells and the lowest proportion of Treg cells when compared to clusters 1 and 3 (Figure 3C). These cells have been reported to activate the immune response and kill cancer cells (41). Additionally, we analyzed the relationships between the m5C clusters and immune-related genes. In the present study, CD274, CTLA4, HAVCR2, IDO1, LAG3, and PDCD1 were included in the immune checkpoint-related signature, and CD8A, CXCL10, CXCL9, GZMA, GZMB, PRF1, TBX2, and TNF were included in the immune activity-related signature (42). The results showed that cluster 2 had the lowest levels of CTLA4 and IDO1, which play an inhibitory role in immune cell activation (Figure 3D). These results showed that m5C cluster 2 had the most potent immune response when compared with cluster 1 and 3, which partly account for the best prognosis of patients in the m5C cluster2. These results confirmed that m5C regulators are related to the PAAD immune microenvironment. The tumor immune microenvironment plays a role in the effect of m5C regulators on patient prognosis.
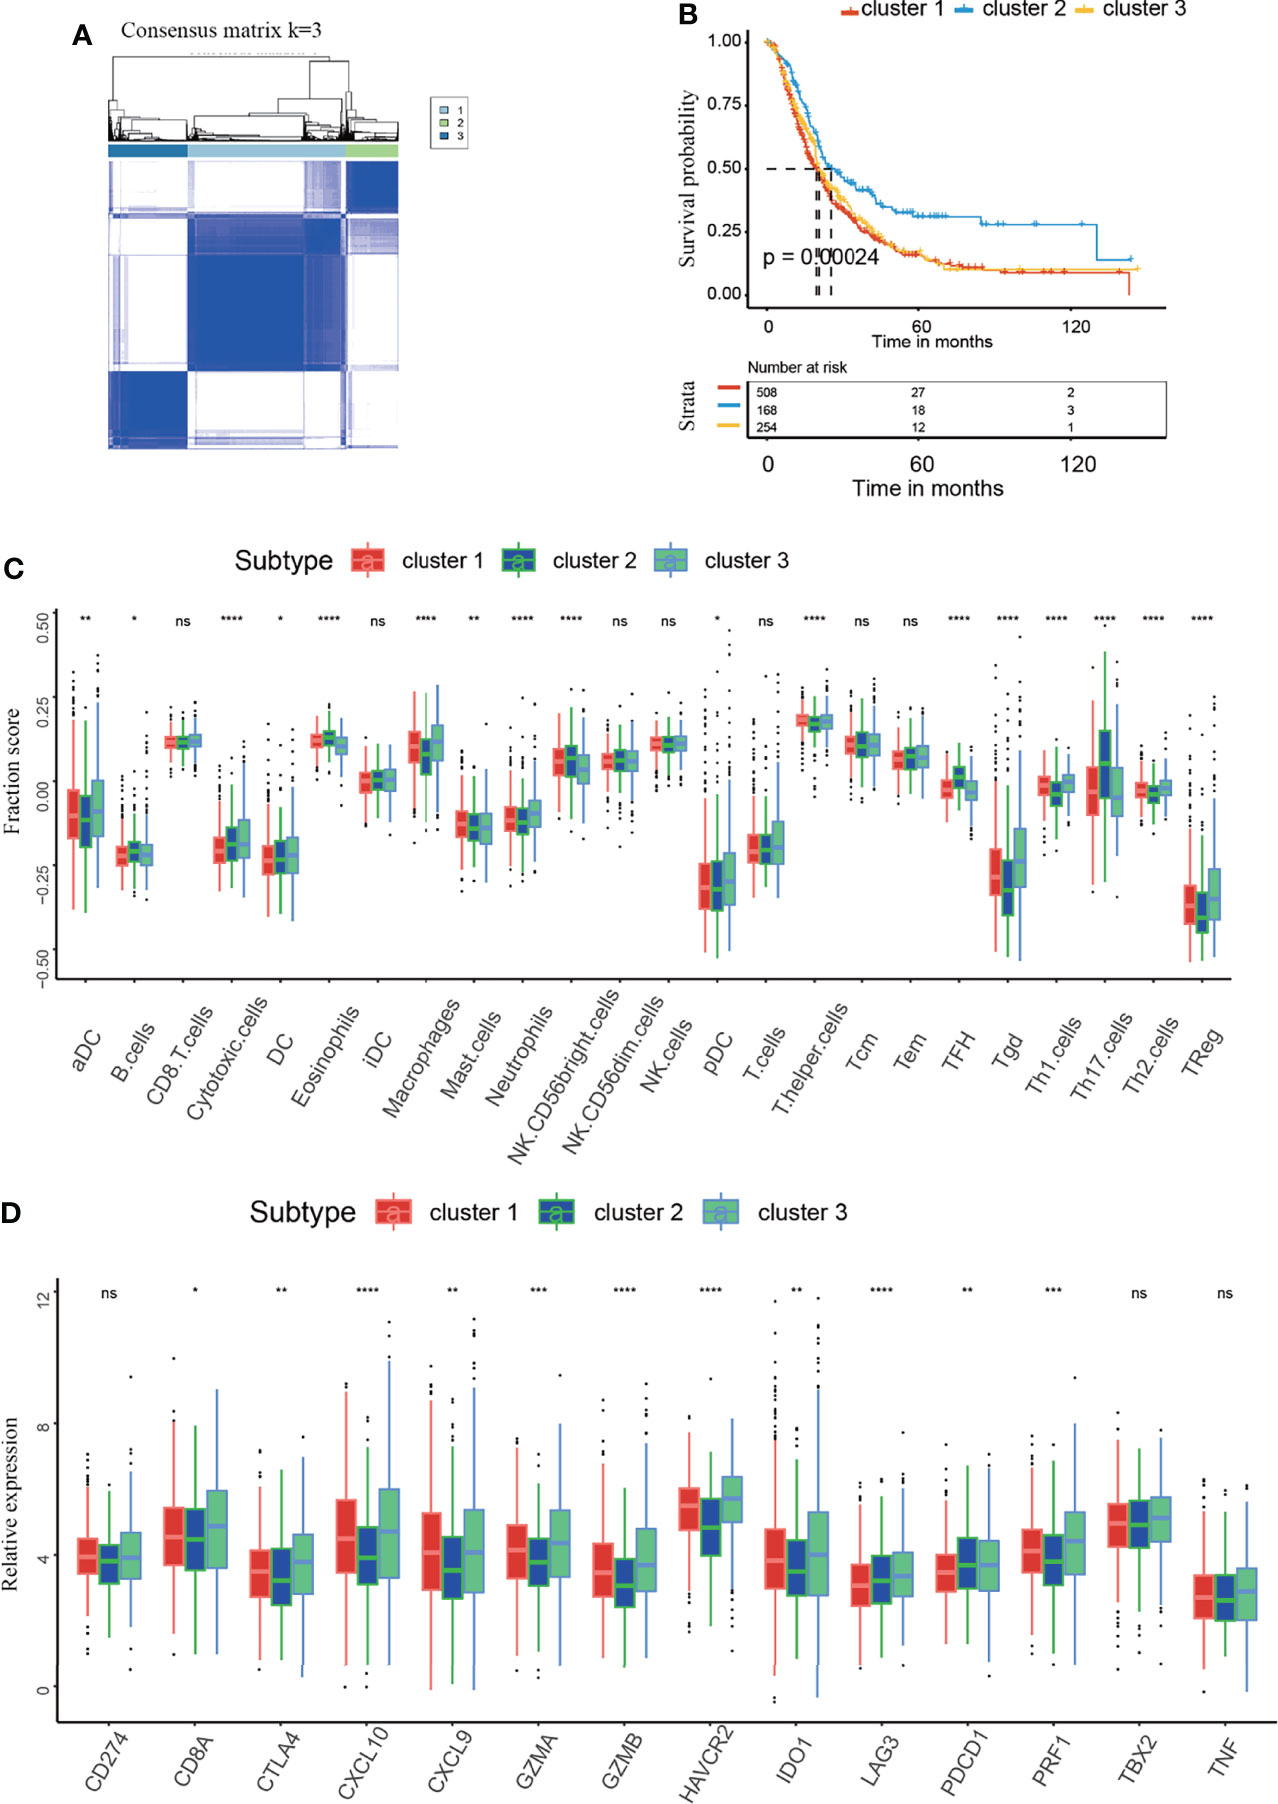
Figure 3 Identification of the consensus clusters and analysis of the correlation between clusters and the immune microenvironment. (A) Consensus clustering matrix for k=3. (B) Kaplan–Meier curves of overall survival (OS) in m5C clusters 1-3 of patients with PAAD. (C) Immune cell infiltration in m5C clusters 1-3. (D) Expression levels of immune activation-related genes and immune checkpoint-related genes in m5C clusters 1-3. * represents p value < 0.05, ** represents p value < 0.01, *** represents p value < 0.001, **** represents p value < 0.0001, ns means "not statistically significant".
Identification of m5C-Related Gene Clusters and Analysis of the Correlations Between the Gene Clusters and the Immune Microenvironment
To further probe into the biological behaviors accounting for the important role of m5C regulators in the PAAD TME and PAAD development, we tried to identified the m5C DEGs. As described in the method section, DEGs from GEPIA dataset was intersected with DEGs from three m5C clusters. Finally, we identified a total of 1720 m5C DEGs (Figure 4A). Based on the unsupervised clustering of these m5C DEGs, 930 PAAD patients were divided into three m5C-related gene clusters, namely, m5C gene clusters A, B, and C (Figure 4B and Supplementary Figure 3). The results showed that the m5C gene clusters were strongly correlated with survival status: m5C gene cluster C had the best OS when compared to clusters A and B (Figure 4C). We also analyzed the correlations with immune cell infiltration. m5C gene cluster C had the highest proportion of NK CD56bright cells and the lowest proportion of Treg cells (Figure 4D). Additionally, these two kinds of immune cells were overlapped with that in m5C cluster2. Functionally, NK CD56bright cells are mainly responsible for innate immune response and Treg cells are one of the most canonical immune-suppressive cells in the body (43, 44). Moreover, m5C gene cluster C had the lowest levels of CD274, CTLA4 and PDCD1 (Figure 4E). These results confirmed m5C gene cluster C had the most potent immune response when compared with cluster A and B. Collectively, these results further confirmed that m5C regulators are critical factors influencing the PAAD TME and PAAD development. The coherence between the prognostic and TME features in the three gene clusters indicated that this classification was reliable and reasonable.
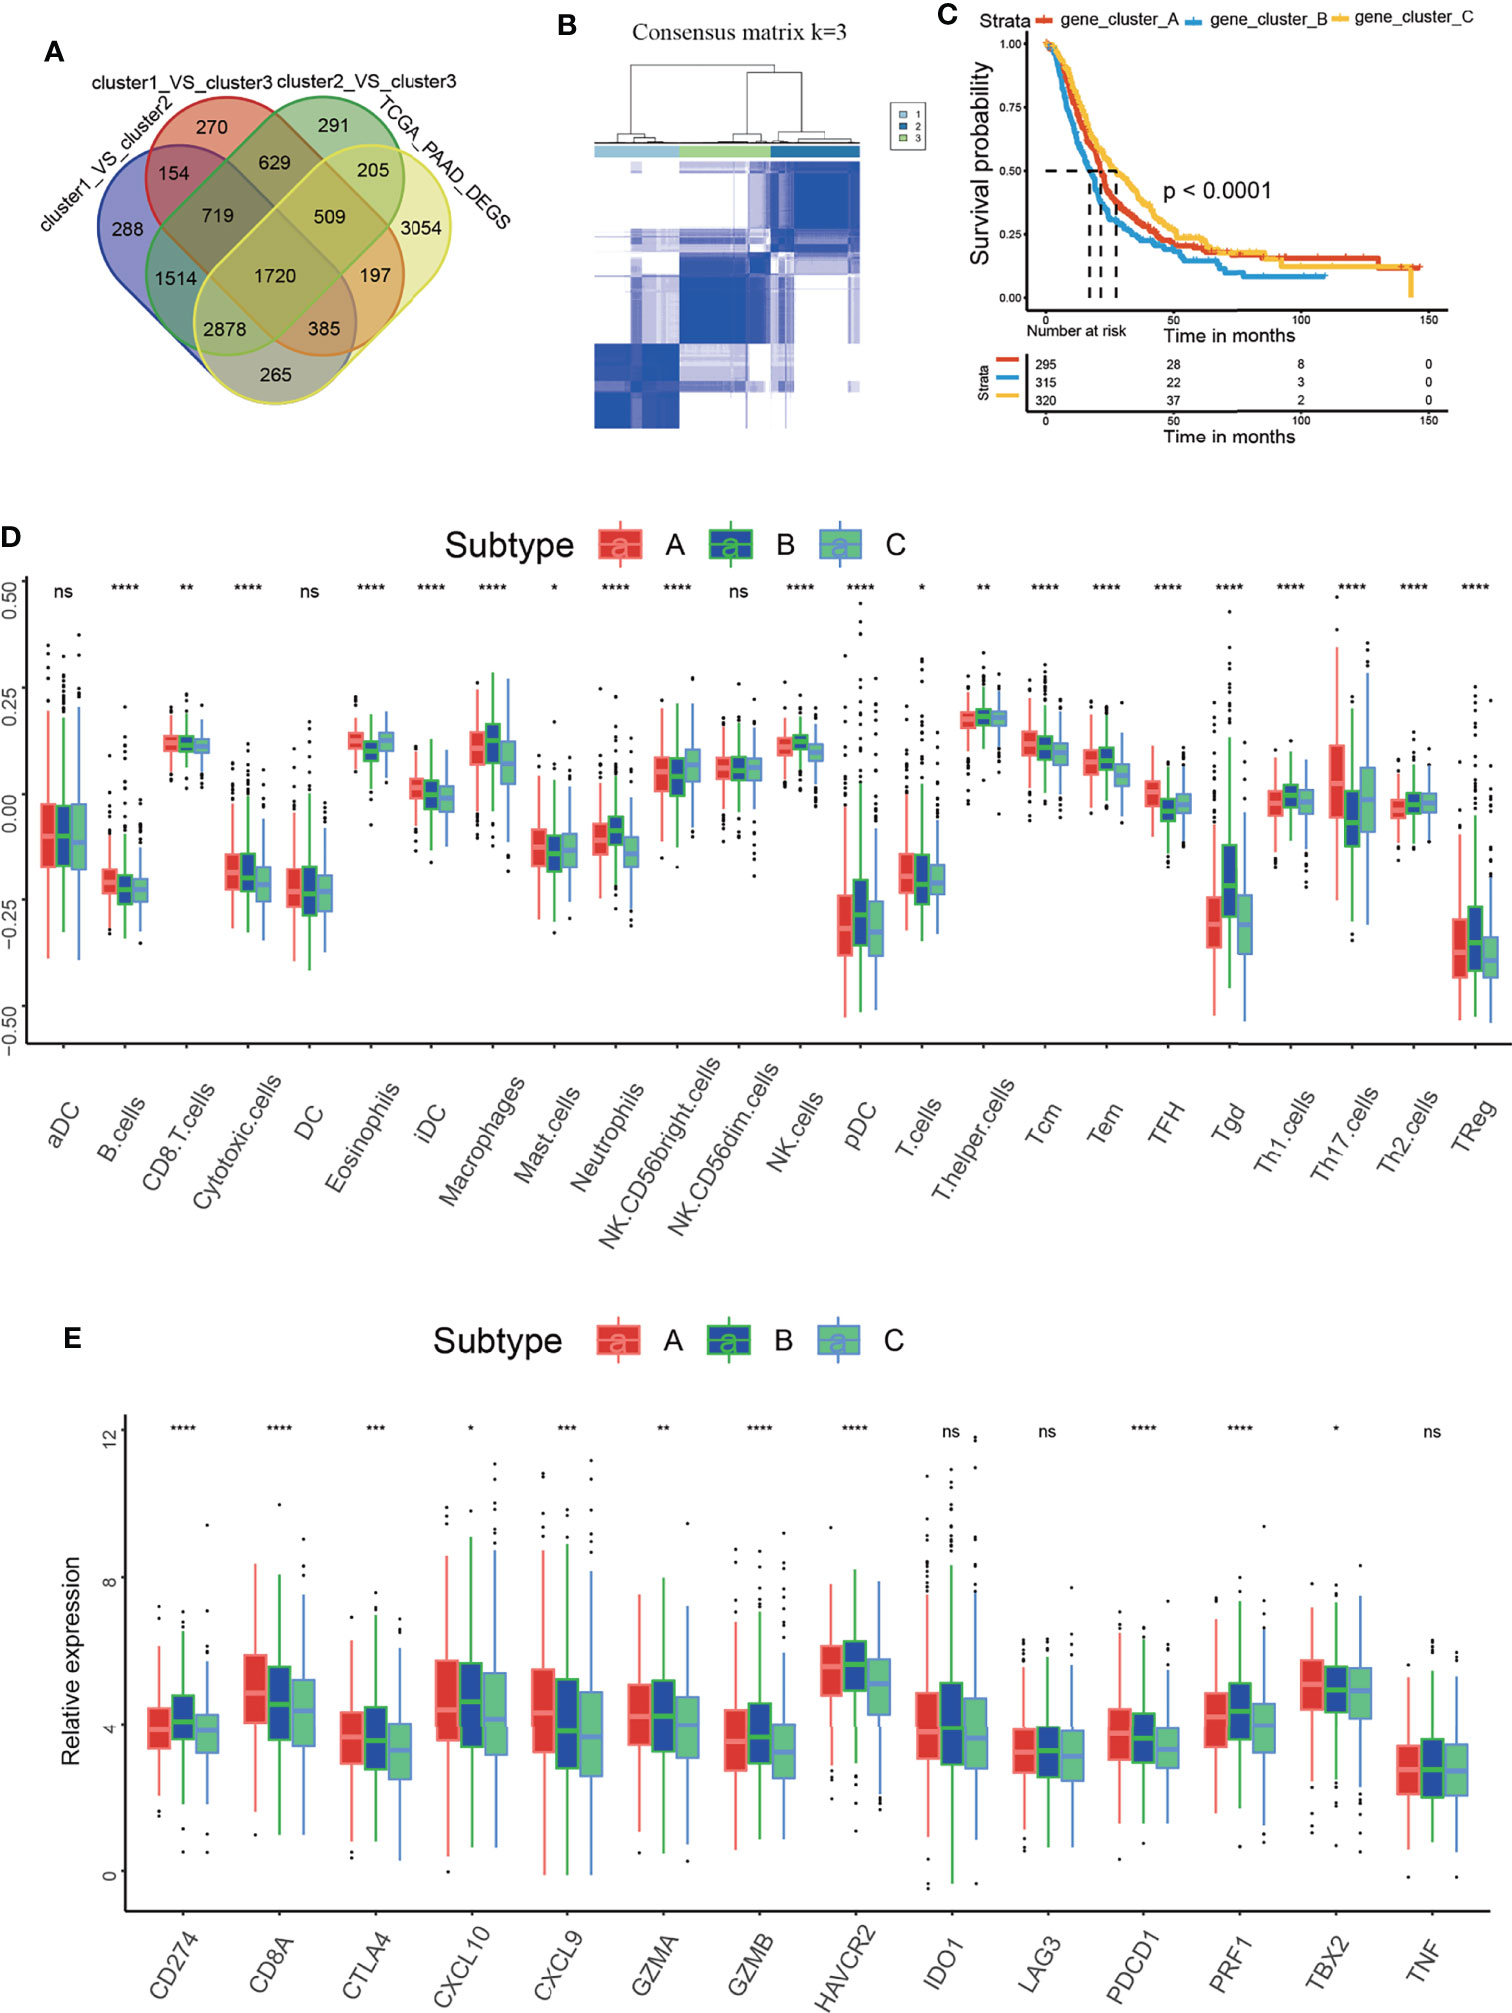
Figure 4 Identification of the m5C-related gene clusters and analysis of the correlation between the gene clusters and the immune microenvironment. (A) Venn diagram delineating the DEGs between the three m5C clusters and the DEGs between non-tumor and tumor samples from PAAD patients of GEPIA dataset. (B) Consensus clustering matrix for k=3. (C) Kaplan–Meier curves of overall survival (OS) for patients with PAAD in m5C gene clusters A, B and C. (D) Immune cell infiltration in m5C gene clusters A, B and C. (E) Expression of immune activation-related genes and immune checkpoint-related genes in m5C gene clusters A, B and C. * represents p value < 0.05, ** represents p value < 0.01, *** represents p value < 0.001, **** represents p value < 0.0001, ns means "not statistically significant".
Construction of the m5C Score and Its Relationship With the Immune Microenvironment
To acquire quantitative indicators of m5C regulators, a heatmap was generated to visualize the correlation among the m5C clusters, m5C gene clusters, patient status, and immune infiltration. As shown in the left axis of the heatmap, m5C gene signatures that were positively correlated with m5C gene cluster were named as m5C gene signature A, and the rest m5C DEGs were termed as m5C gene signature B (Figure 5A). This method has been verified in previous study (42). Then the dimension reduction was presented by the Boruta algorithm based on the m5C gene signatures A and B and principal component analysis (PCA) was utilized to extract the principal component from the m5C gene signature A and B. (1) the PC1A represent the first component of m5C gene signature A, and (2) the PC1B represent the first component of m5C gene signature B. m5C score = ∑PC1A-∑PC1B. 930 patients in training cohort were stratified into two subgroups as high- and low- m5C score by using surv_cutpoint function in the survminer package in R software. The results indicated that higher m5C score was related to longer OS than lower score (Figure 5B). Consistently, cluster C had the highest m5C score and the best OS rate (Figure 5C). These results suggested m5C score was a potential indicator to predict PAAD prognosis. It has been validated m5C modification was related to immune microenvironment of PAAD, we also analyzed the correlation between the m5C score, infiltrating immune cells, and immune-related genes. The high m5C score group had a higher proportion of NK CD56 bright cells and a lower proportion of Treg cells, which was consistent with the result of m5C cluster 2 and gene cluster C (Figure 5D). Moreover, the high m5C score group had lower levels of CD274, CTLA4, IDO1, LAG3, and PDCD1 expression despite the fact that the differences in some factors were not statistically significant (Figure 5E). Additionally, we determined the relationship between the m5C score and cancer-associated fibroblasts (CAFs), T cell dysfunction, microsatellite instability (MSI), and the TIDE score. It has been validated an increased number of CAFs promotes cancer development by hindering immune cell infiltration into cancer tissues, while MSI and the TIDE score are precise predictors of chemotherapy and immunotherapy response (45–47). High m5C score was found to be related to lower CAF levels, T cell dysfunction, and lower TIDE scores but were also related to higher MSI (Figures 6A–H). Moreover, the high m5C score group had a lower stromal score, immune score, and ESTIMATE score but higher tumor purity (Figure 6I). These results further confirmed m5C score was related with immune microenvironment of PAAD. High m5C score indicated a better immune response.
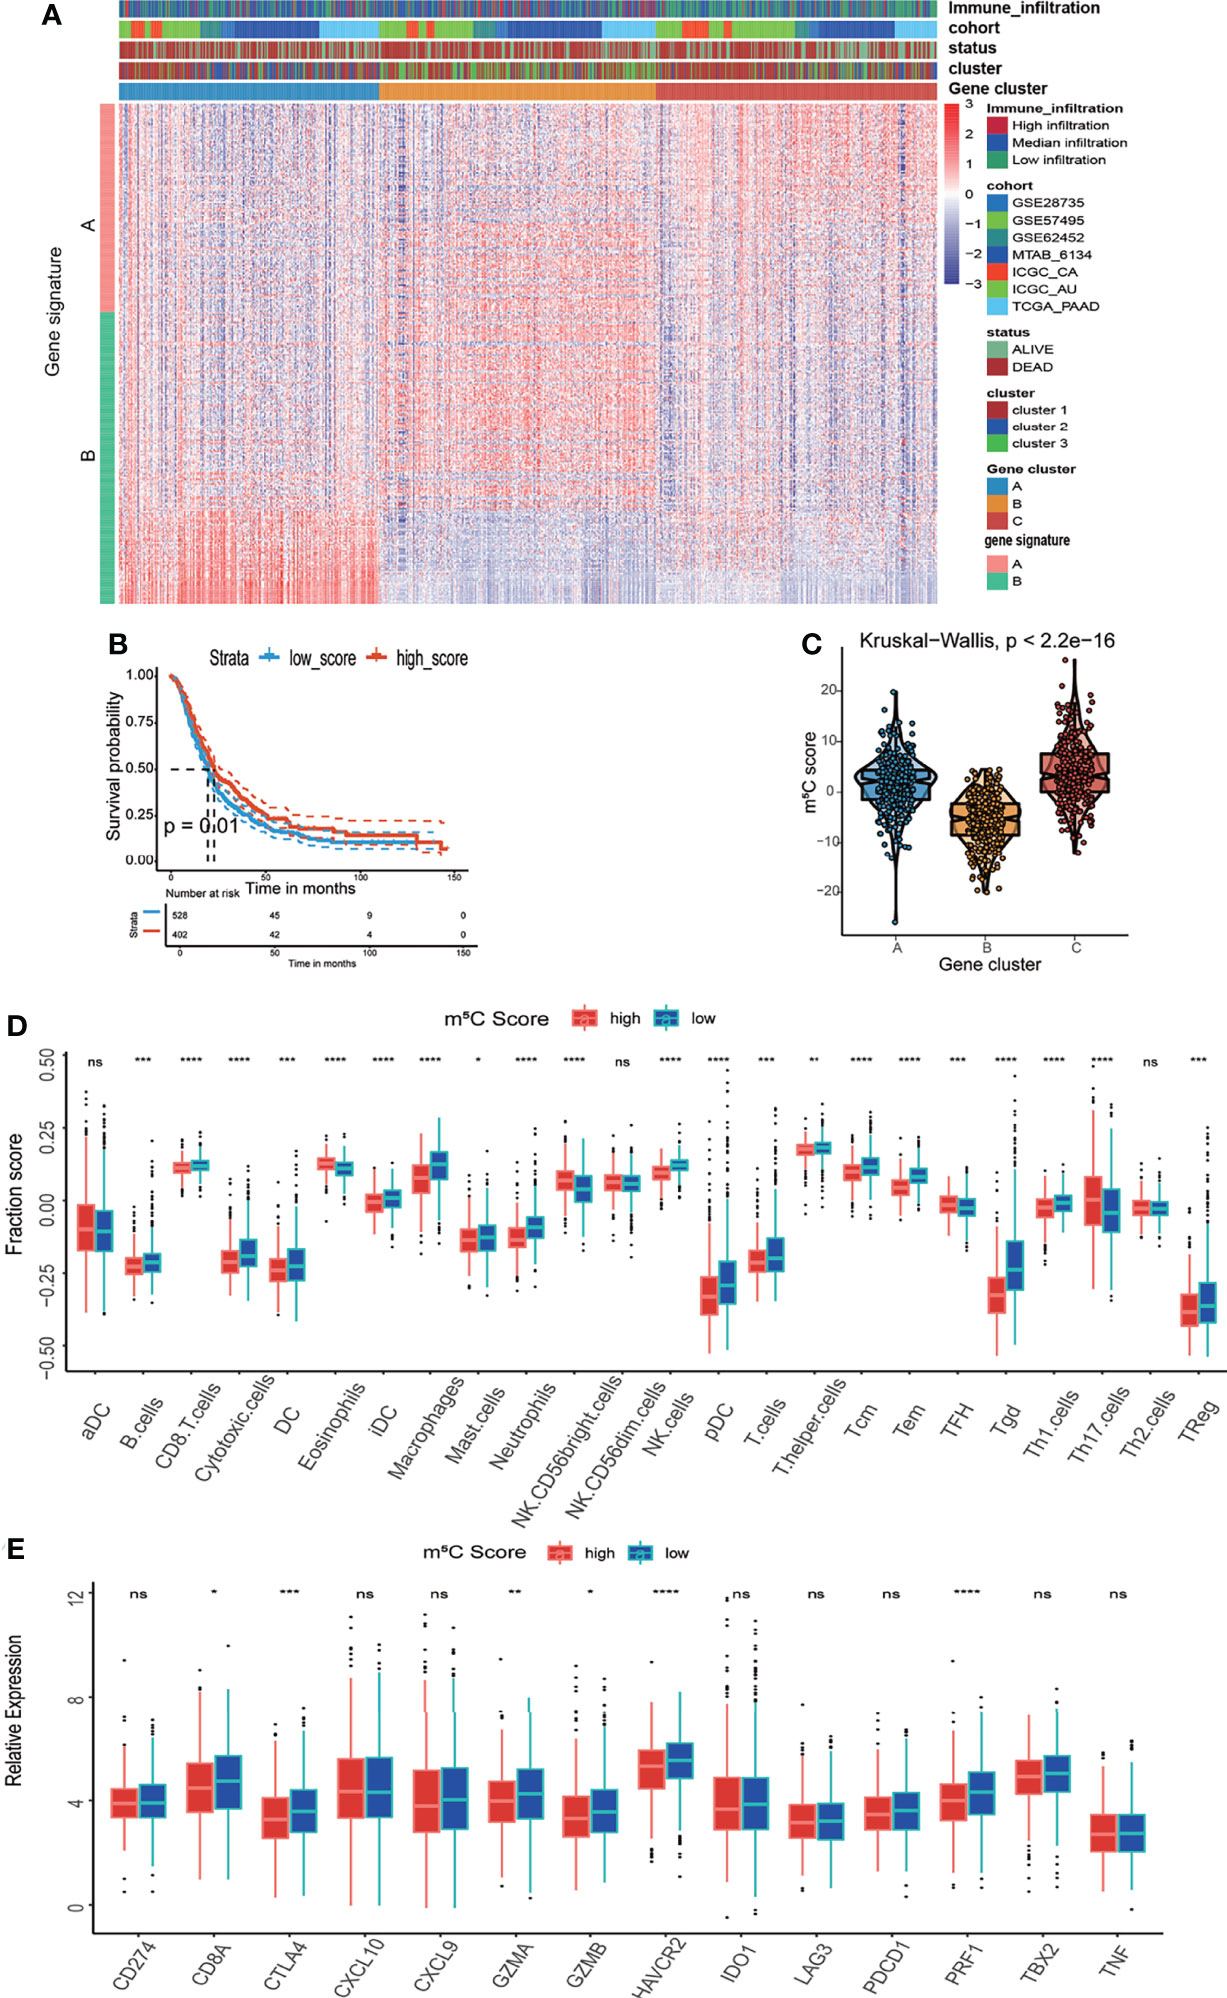
Figure 5 Development of the m5C score and assessment of its relationship with the immune microenvironment. (A) Unsupervised clustering of 1720 DEGs between the three m5C gene clusters and identification of m5C gene signature A and B. (B) Kaplan–Meier curves of overall survival (OS) for patients with PAAD in the high and low m5C score subtypes. (C) Correlation between the m5C score and the m5C gene clusters. (D) Immune cell infiltration in the high and low m5C score subtypes. (E) Expression levels of immune activation-related genes and immune checkpoint-related genes in the high and low m5C score subtypes. * represents p value < 0.05, ** represents p value < 0.01, *** represents p value < 0.001, **** represents p value < 0.0001, ns means "not statistically significant".
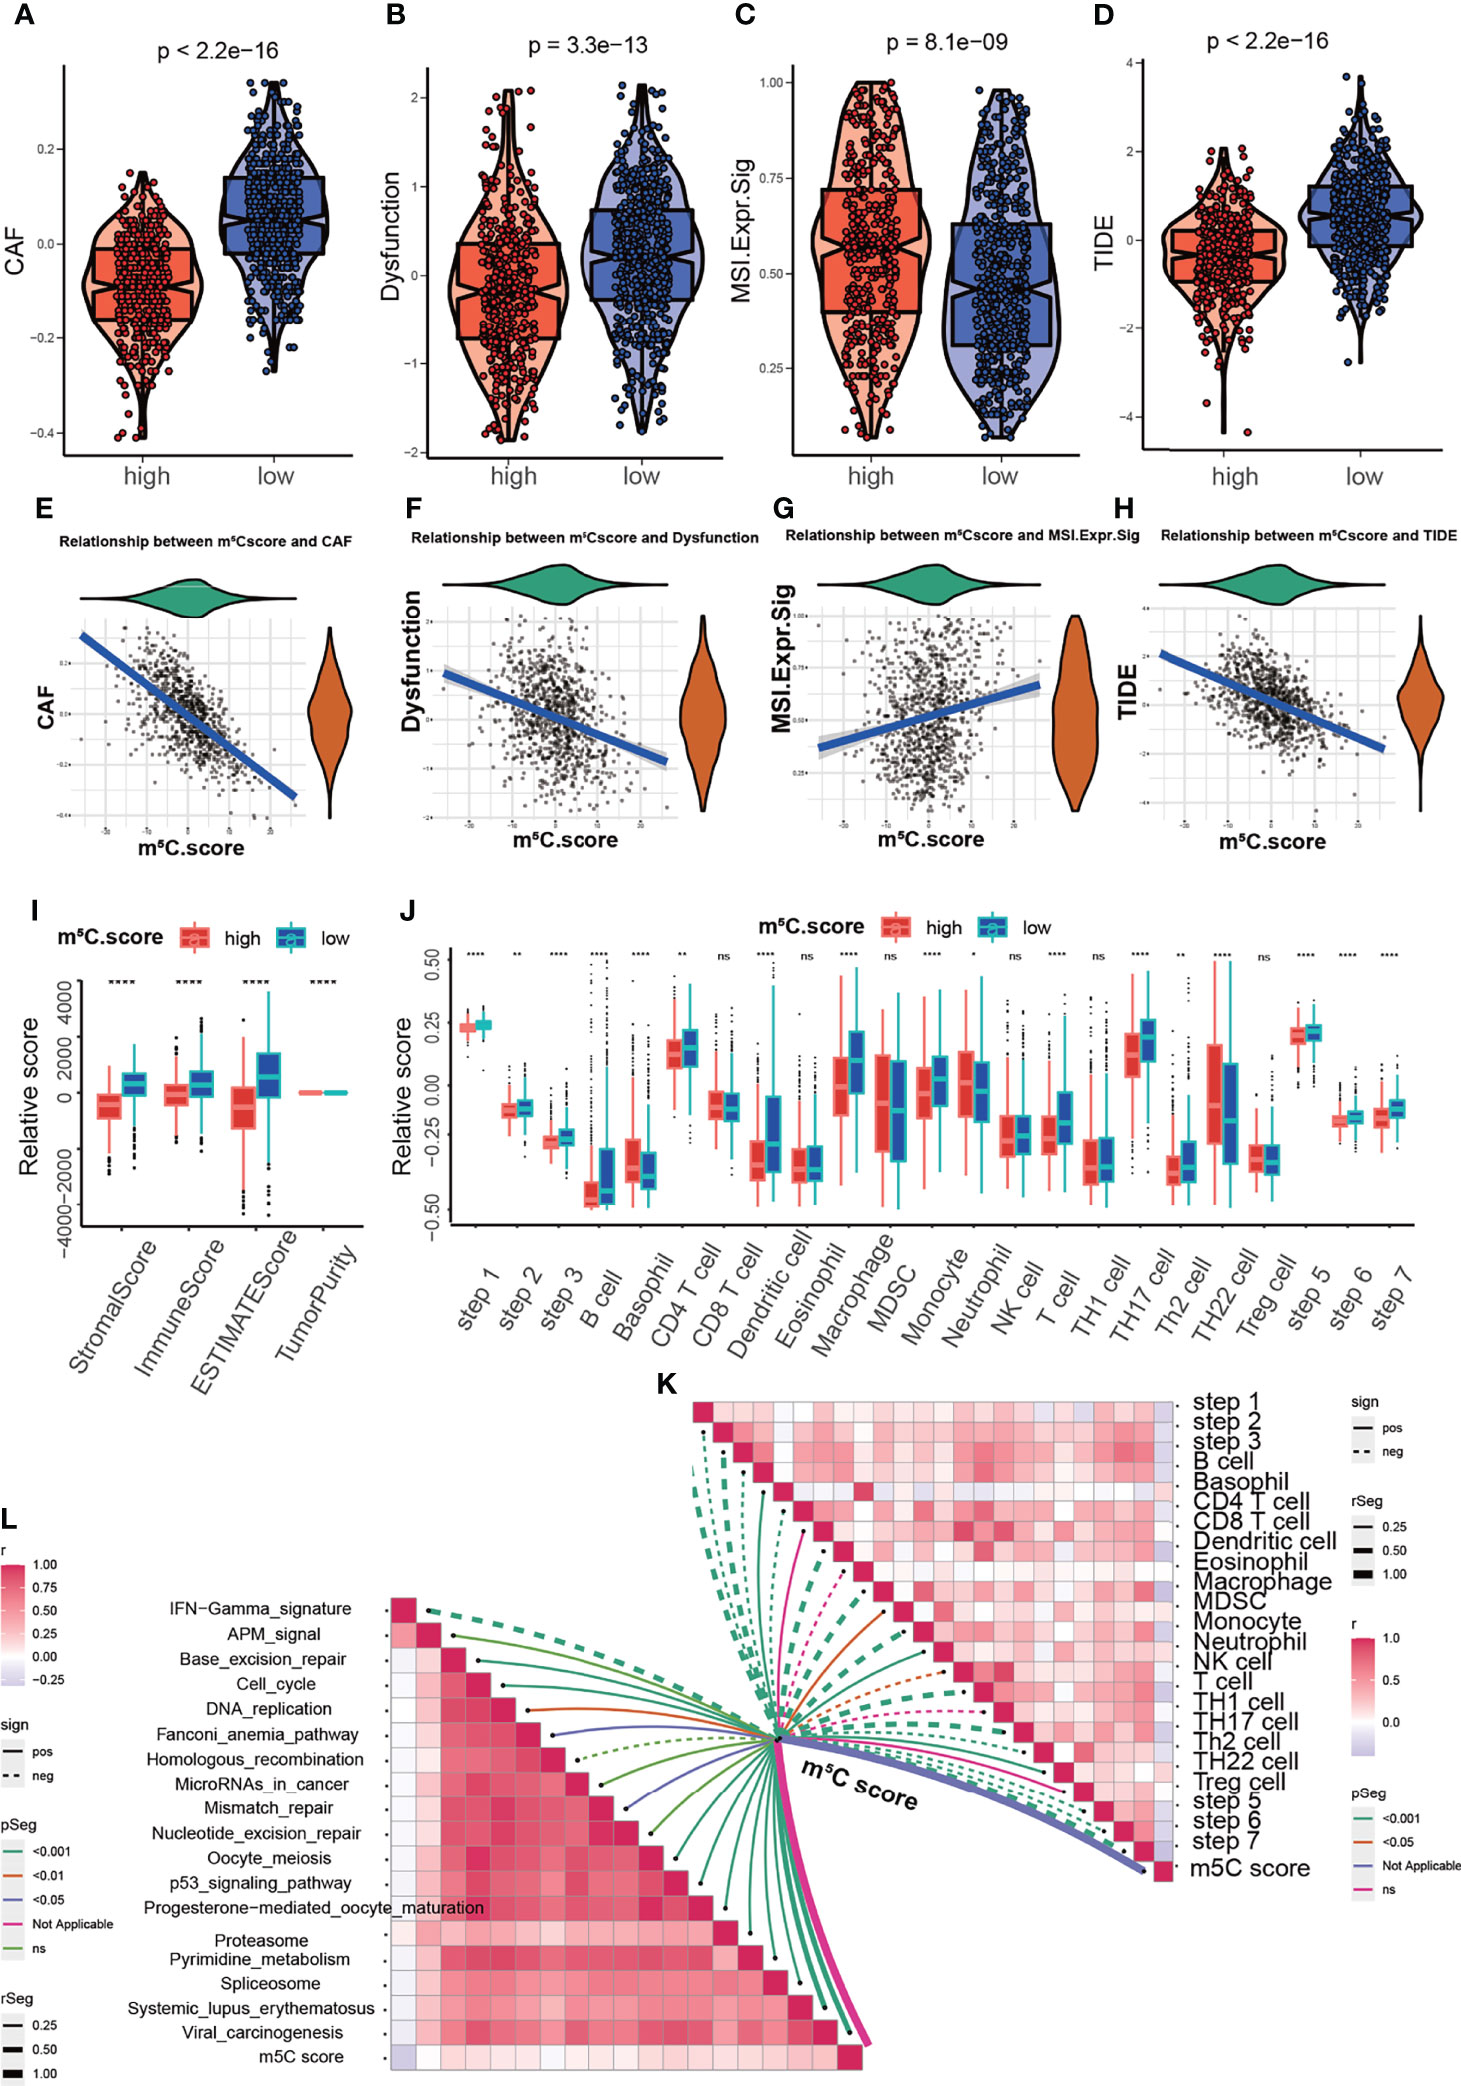
Figure 6 Analysis of the correlation between the m5C score and the immune microenvironment. (A, E) Correlation between the m5C score and cancer-associated fibroblasts (CAFs). CAF tStudent(928)=-24.87, p=4.69e-105, rpearson=-0.63, CI95%=[-0.67, -0.59], npairs=930. (B, F) Correlation between the m5C score and T cell dysfunction. Dysfunction tStudent(928)=-9.50, p=1.78e-20, rpearson=-0.30, CI95%=[-0.36, -0.24], npairs=930. (C, G) Correlation between the m5C score and microsatellite instability (MSI). MSI.Expr.Sig tStudent(928)=-5.36, p=1.03e-07, rpearson=0.17, CI95%=[0.11, 0.24], npairs=930. (D, H) Correlation between the m5C score and the TIDE score. TIDE tStudent(928)=-16.37, p=3.92e-53, rpearson=-0.47, CI95%=[-0.52, -0.42], npairs=930. (I) Correlation between the m5C score and the stromal score, immune score, ESTIMATE score and tumor purity. (J, K) Correlation between MBS and the steps of the cancer immunity cycle. (L) Correlation between MBS and the enrichment score of immunotherapy-related pathways. * represents p value < 0.05, ** represents p value < 0.01, **** represents p value < 0.0001, ns means "not statistically significant".
The cancer immunity cycle is useful for determining which steps are involved in the immune response (48). Next we aimed to explore the immune steps regulated by the m5C score via using the cancer immunity cycle tool. The results suggested that the high m5C score group had high proportions of basophils and neutrophils (Figure 6J). Moreover, we aim to explore the mechanism underlying m5C score. The correlation of m5C score and immunotherapy-related pathways was analyzed. The m5C score was related to base-excision repair, the cell cycle, DNA replication, the p53 signaling pathway and other pathways (Figures 6K, L). These results assisted to elucidate the mechanisms of m5C score in regulating immune response. To comprehensively validate the utility of the m5C score, a heatmap was constructed to delineate the correlation between the m5C score and the TME. The m5C score was related to the proportions of CD8+ T cells, NK cells and B cells, the expression of immune checkpoints and MHC-II, the EMT process, the cell cycle and mismatch repair (Supplementary Figure 4). m5C modification were closely related with immune microenvironment and participated in immune response modulation via multiple signaling pathways.
Performance of the m5C Score in Predicting Immunotherapy Response and Chemotherapy Response
The m5C score reflects regulation and modulation of the immune microenvironment. However, whether the m5C score could predict immunotherapy response had not been explored. We examined the utility of the m5C score in predicting immunotherapy response. The results showed that patients with high m5C score had better sensitivity and response to immunotherapy. A high m5C score was related to a higher PR (partial response)/CR (complete response) rate and better OS when compared with low m5C score (Figures 7A–C). It has been validated chemotherapy agents activated immune responses in patients with tumors, which assisted to improve immunotherapy response (49, 50). It propelled us to examine the chemotherapy agents which were responded differently in high and low m5C score group. The results indicated IC50 values of 5-Fluorouracil, Erlotinib, Mitomycin C, Trametinib, SB52334 and AS605240 were decreased in high m5C score group (Figures 7D–I). It has been proved some of these regents exerted an inhibitory role on PAAD development (51–53). Combination with these agents may greatly enhance the immunotherapy responsiveness. Our present results confirmed that the m5C score is a precise indicator for the prediction of immunotherapy benefit.
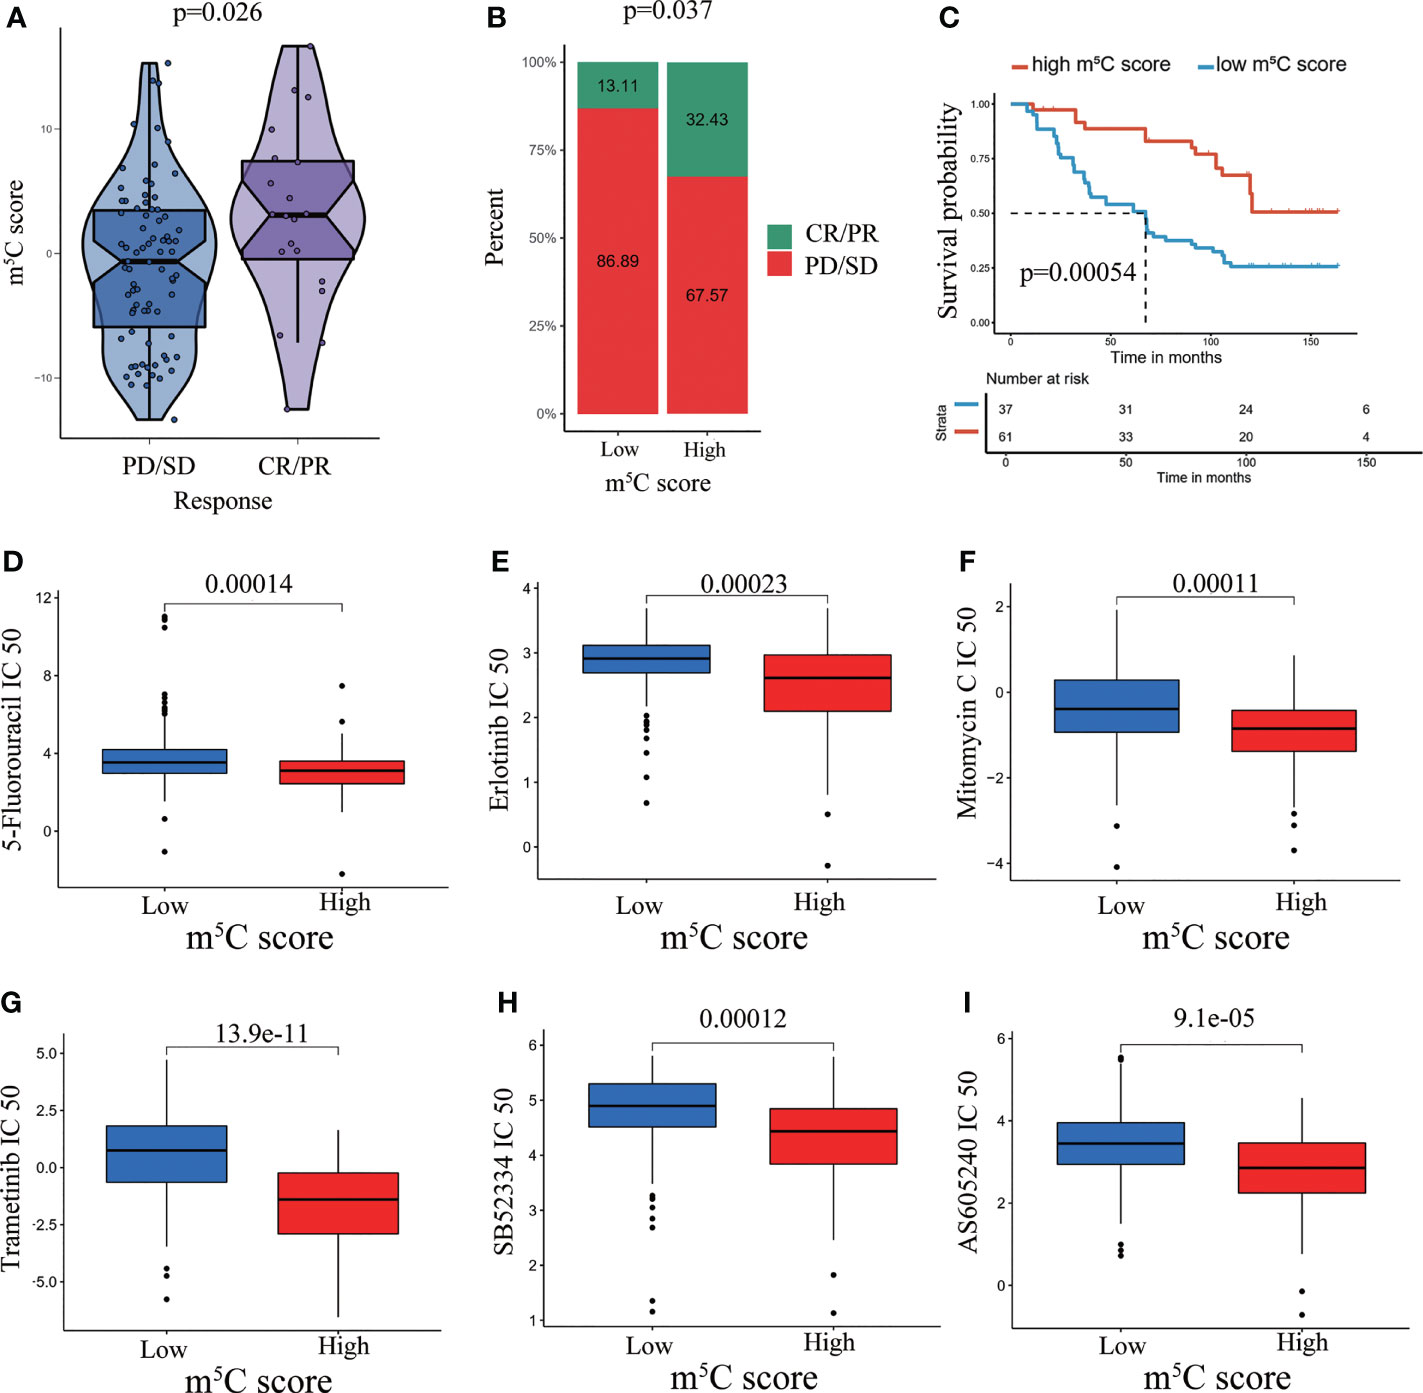
Figure 7 Performance of the m5C score in predicting immunotherapy response and chemotherapy response. (A) Violin plots depicting the differences in the m5C score between the CR/PR and SD/PD groups in the GSE91061 cohort. (B) Rate of clinical response (complete response [CR]/partial response [PR] and stable disease [SD]/progressive disease [PD]) to anti-PD-1 immunotherapy in the high and low m5C score subgroups in the GSE91061 dataset. (C) Kaplan–Meier curves for patients with high and low m5C score in the GSE91061 dataset. (D–I) Prediction of chemotherapy agent response in high and low m5C score groups.
Validation of the Utility of the m5C Score in Predicting PAAD Patient Prognosis
The m5C score was verified to predict PAAD patient prognosis in the training cohort. Next, we validated the utility of the m5C score using the TCGA PAAD dataset, the ICGC-AU and the ICGC-CA datasets. Consistently, high score was related to better OS, disease-specific survival (DSS), disease-free interval (DFI), and progression-free interval (PFI) in the TCGA PAAD dataset (Figures 8A–D). OS was also demonstrated to be related to the m5C score in the ICGC-AU and ICGC-CA datasets (Figure 8E). We further examined the relationship between the m5C score and tumor mutation burden (TMB). TMB has been reported to be related to cancer development and act as an indicator of the immunotherapy response and prognosis (54). In the present study, there was no significant relationship between these two factors, indicating that the m5C score was an independent immunotherapy response indicator (Figures 8F, G).
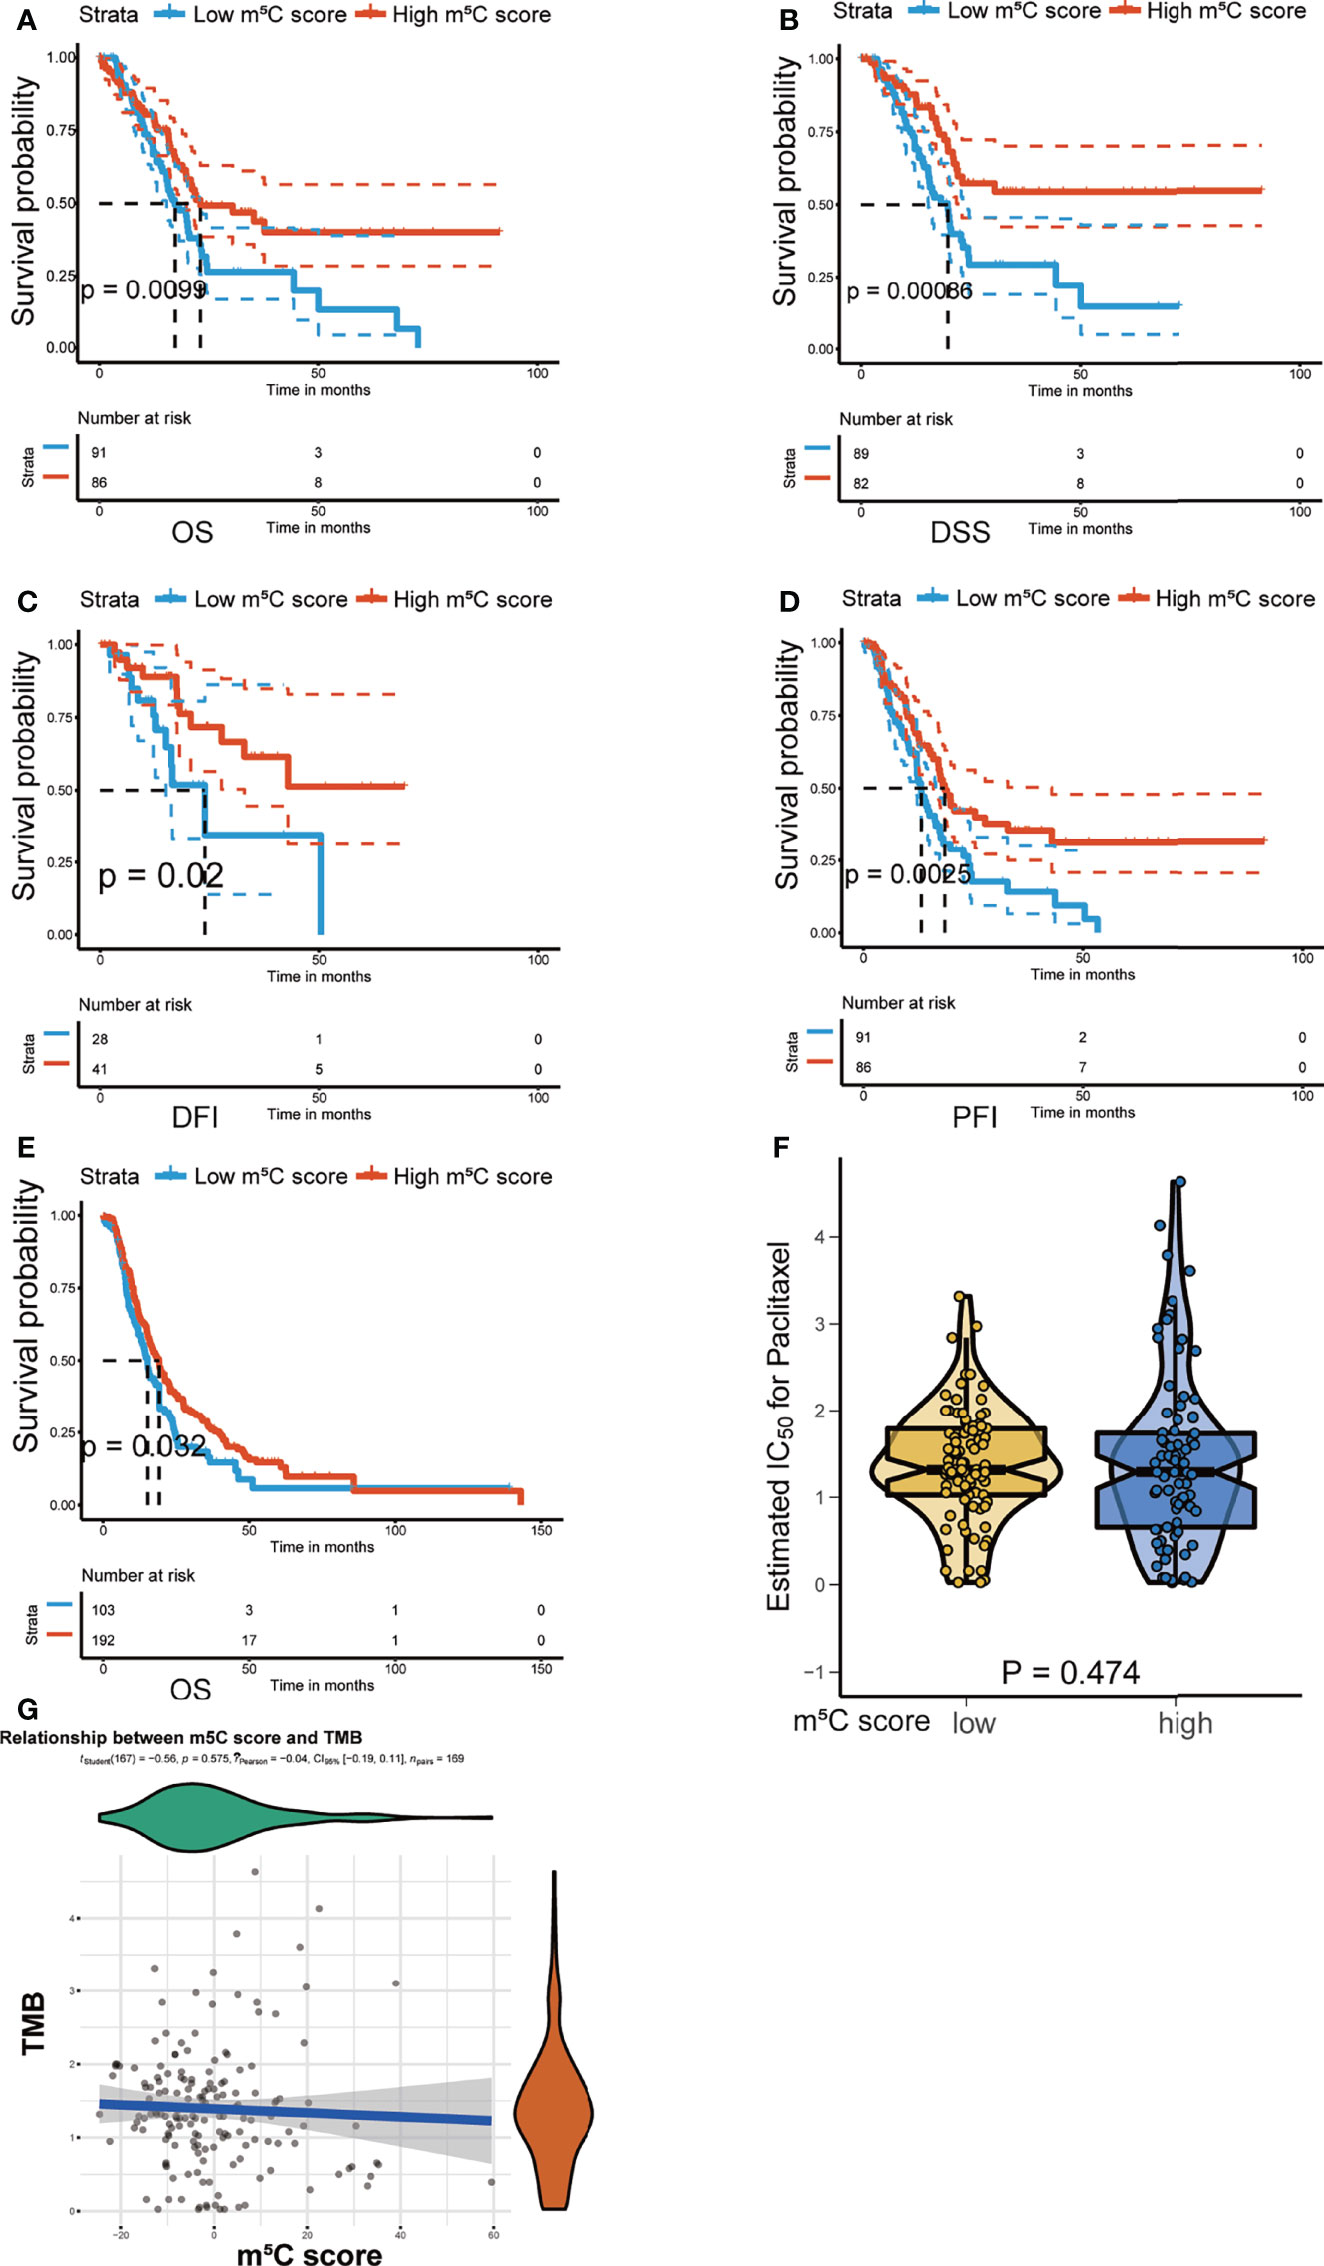
Figure 8 Validation of the utility of the m5C score in predicting PAAD patient prognosis. (A–D) Kaplan–Meier curves of overall survival (OS), disease-specific survival (DSS), disease-free interval (DFI), and progression-free interval (PFI) for patients with PAAD in the high and low m5C score groups in the TCGA PAAD dataset. (E) Kaplan–Meier curves of overall survival (OS) for patients with PAAD in the high and low m5C score groups in the ICGC-AU and ICGC-CA datasets. (F, G) Correlation between the m5C score and tumor mutation burden (TMB).
Exploration of the Mechanism Underlying the Utility of the m5C Score Model
To further uncover the underlying molecular mechanism of the m5C score, we analyzed the correlation of cancer-related driver genes with immune infiltration, the m5C clusters, the m5C gene clusters and the m5C score (Figure 9A). The results indicated that ACVR2A, ARID1A, ARID2, BAP1, BCL11B, BCORL1, BIRC6, CDH10, FAT1, FAT4, FBXW7, GNAS, KDM6A, KRAS, MARK2, NRAS, PCBP1, RBM10, RNF43, SETD1B, SETD2, SF3B1, SMAD3, SMARCA4, SPEN, WT1 and ZNF521 were differentially expressed between the high and low m5C score groups (Figure 9B). Gene set variation analysis (GSVA) was also conducted in the high and low m5C score groups. The terms reactive oxygen species pathway, DNA repair, unfolded protein response, p53 pathway and PI3K-AKT-MTOR pathway were differentially activated. Moreover, terms related to metabolic processes such as fatty acid metabolism, cholesterol homeostasis, glycolysis, and adipogenesis were significantly altered between the high and low m5C score groups. Additionally, inflammation-related pathways were also altered between the high and low m5C score groups, including the interferon alpha response, interferon gamma response, TNFα signaling via NFκB, IL6-JAK-STAT3 signaling and IL2-STAT5 signaling pathways (Figure 9C). Finally, we verified the expression pattern of m5C regulators in PAAD patient tissues and corresponding normal tissues (Figure 10). Consistently, DNMT1, DNMT3A, NSUN2, NSUN3, NSUN5 and YBX1were increased while DNMT3B, NSUN6 and NSUN7 were decreased in PAAD samples when compared with mRNA and immunohistochemical results. Consistent with previous studies, DNMT1, DNMT3A and YBX1 were increased while NSUN6 was decreased in PAAD tissues when compared with adjacent normal tissues (20, 55–57).
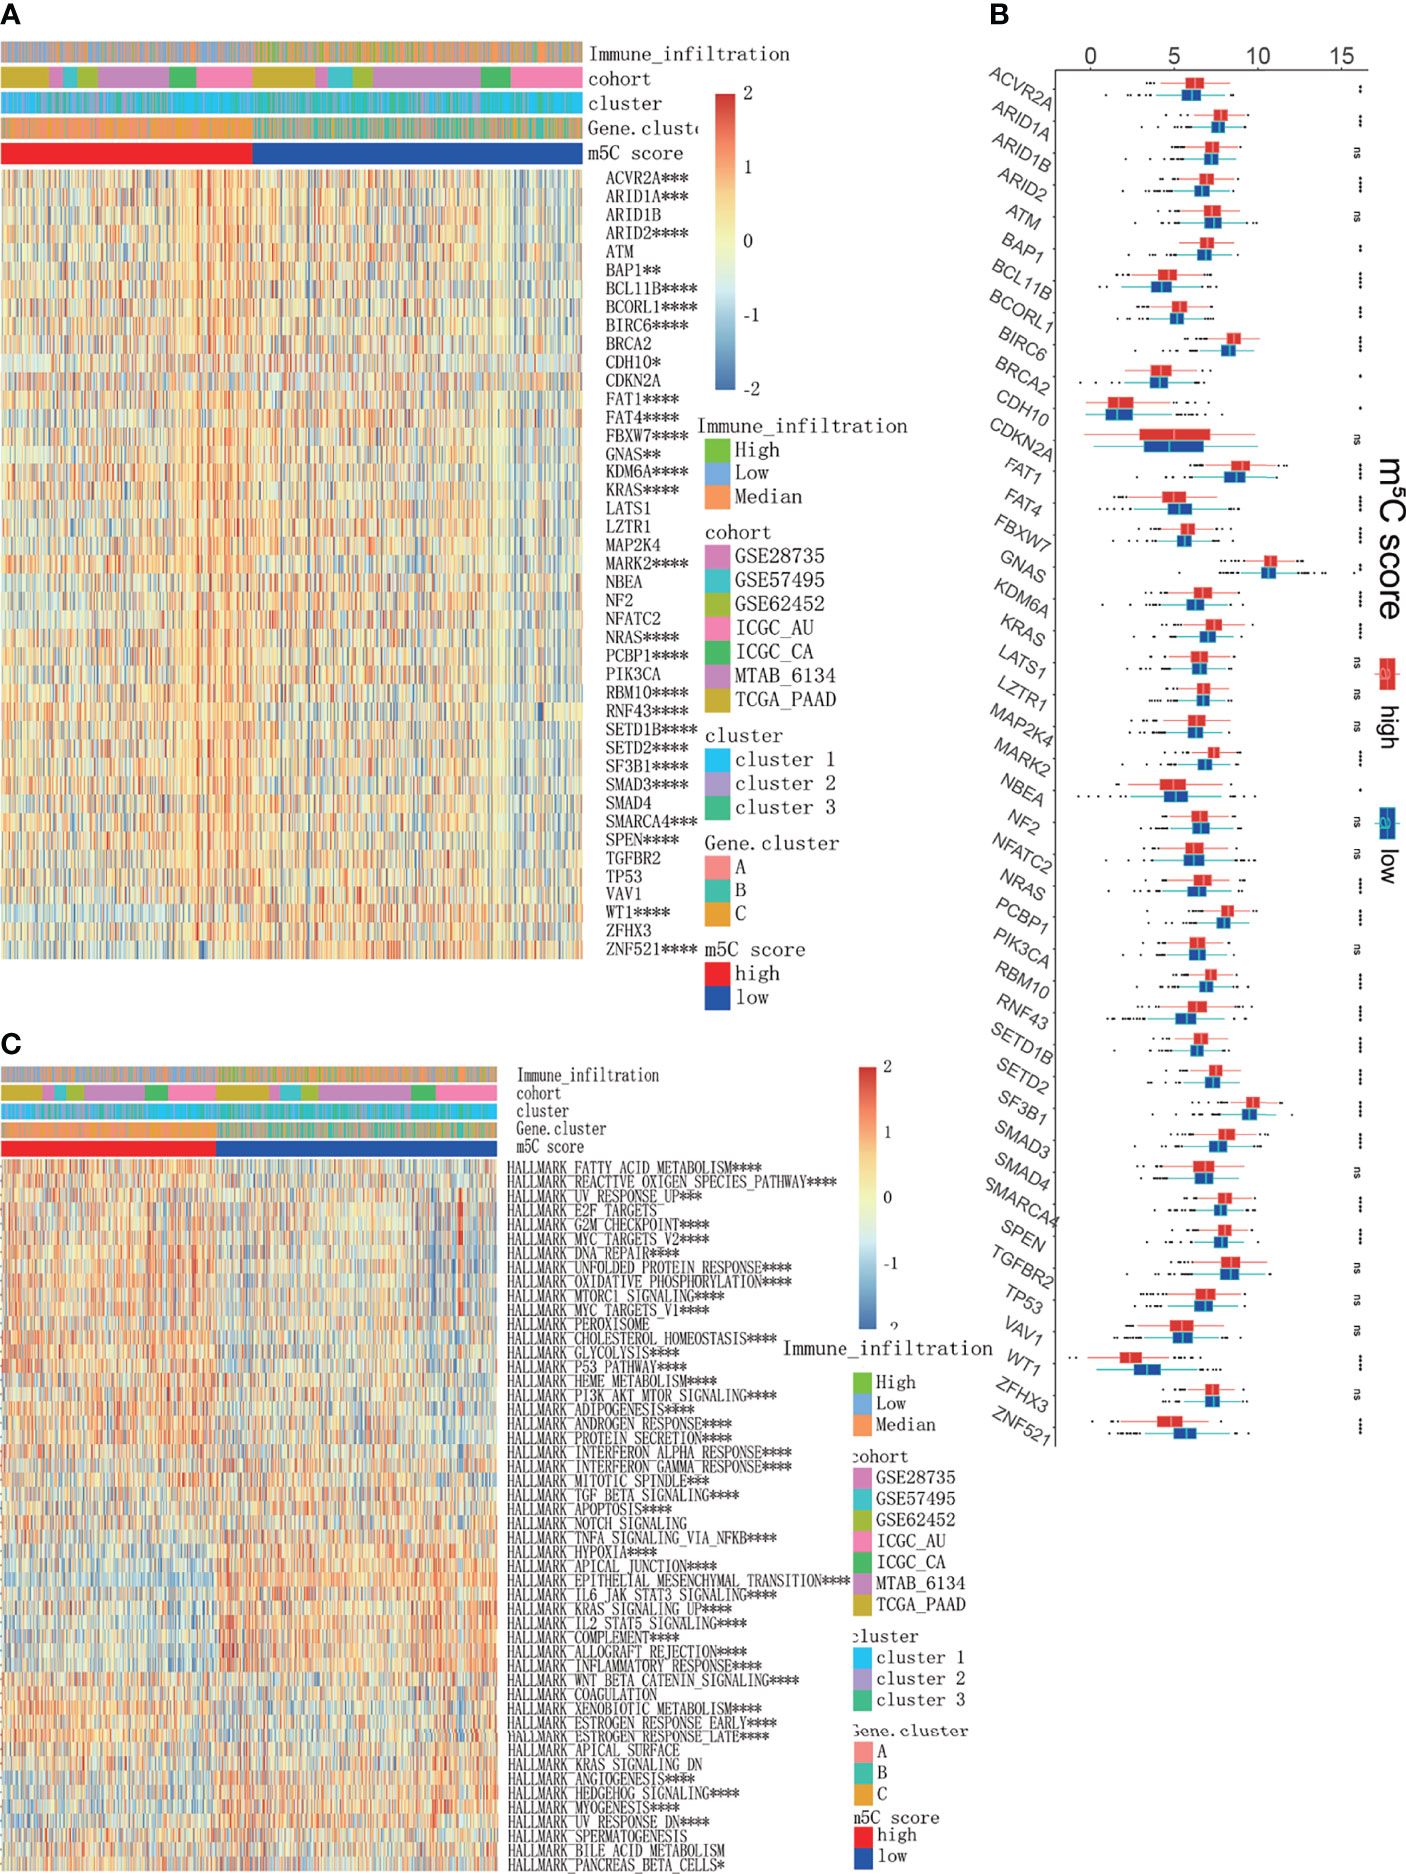
Figure 9 Exploration of the mechanisms underlying the m5C score model. (A, B) Analysis of cancer driver genes in the high and low m5C score groups. (C) GSVA results of all PAAD cohorts between the high and low m5C score groups, which were also characterized by immune infiltration subtypes, clusters and gene clusters. * represents p value < 0.05, ** represents p value < 0.01, *** represents p value < 0.001, **** represents p value < 0.0001, ns means "not statistically significant".
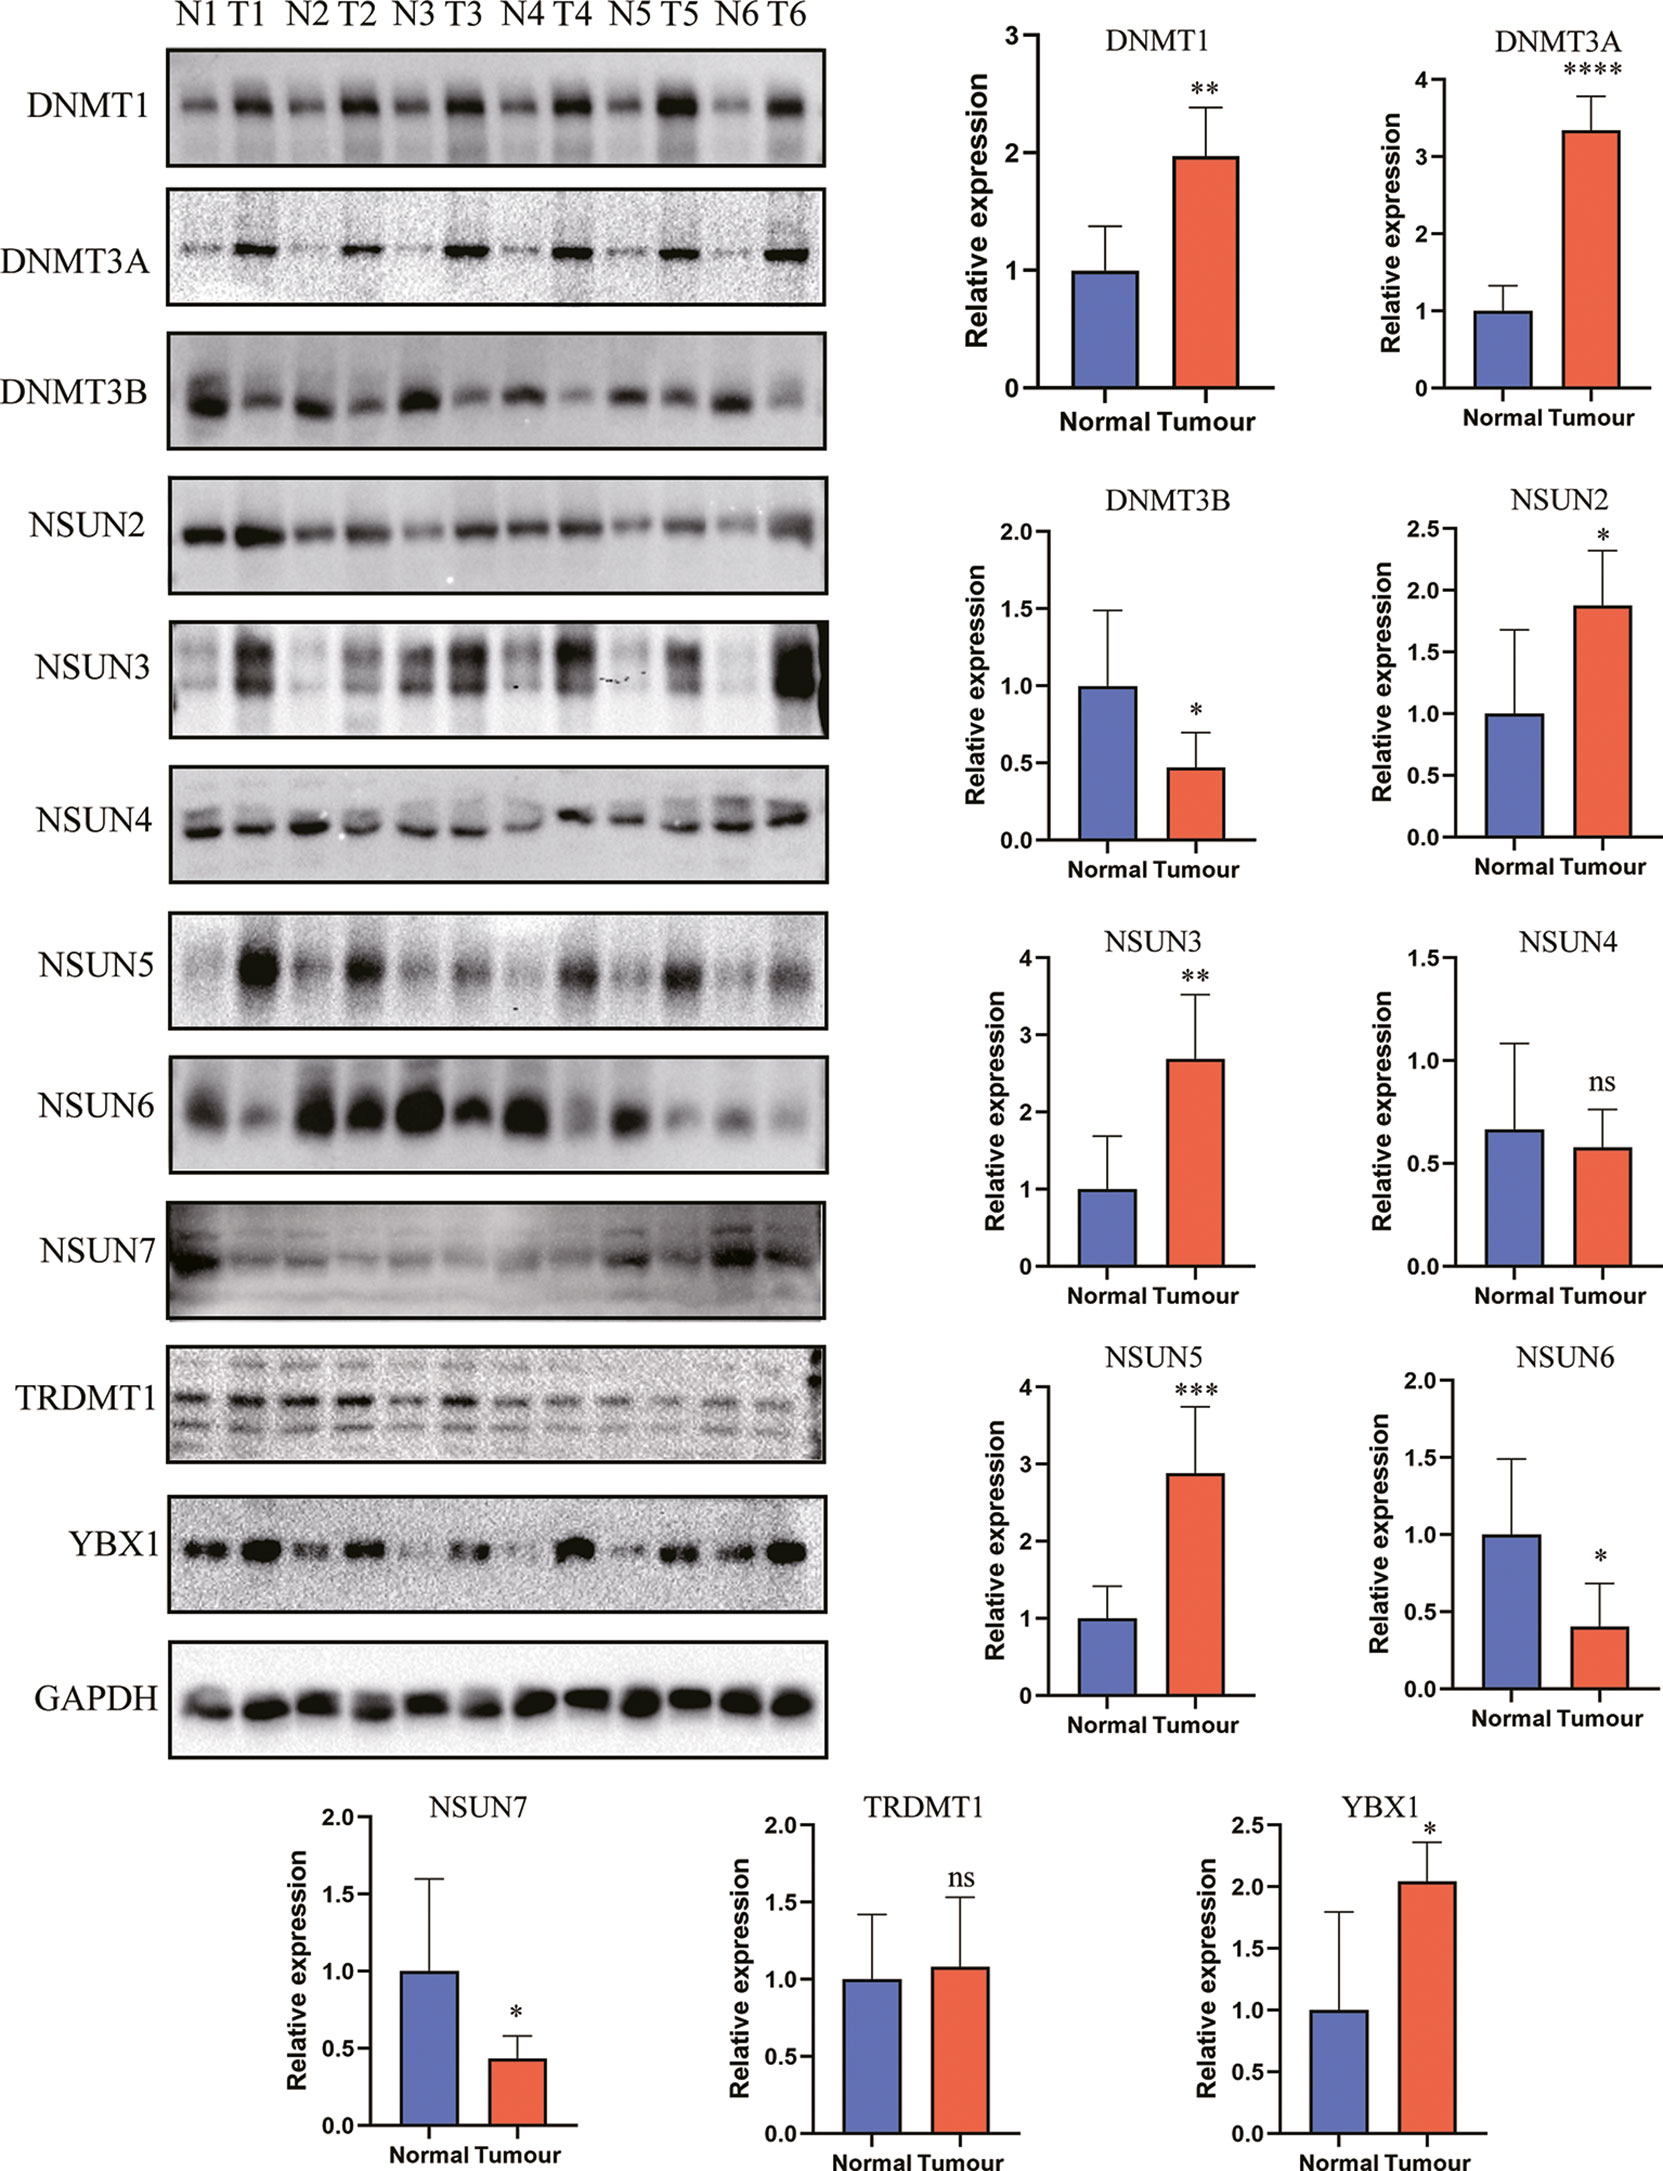
Figure 10 The expression level of m5C regulators in PAAD and control tissues. * represents p value < 0.05, ** represents p value < 0.01, *** represents p value < 0.001, **** represents p value < 0.0001, ns means "not statistically significant".
Discussion
Accumulating evidence suggests that m5C regulators play a crucial role in maintaining the physiological activities of cells. Alteration of the expression or distribution of m5C regulators results in the pathogenesis and development of cancer (58). m5C regulators have been reported to regulate cell proliferation, migration, and chemotherapy resistance and, thus, tumor progression (59). Additionally, m5C regulators have been reported to regulate the immune microenvironment. For example, in CD4+ T cells from patients with SLE, the levels of the m5C writer NSUN2 and methylated m5C genes were found to be decreased (13). In cutaneous melanoma, lung adenocarcinoma, lung squamous cell carcinoma, and other cancer types, bioinformatic analysis have shown that m5C regulators modulate the tumor immune microenvironment, act as immunotherapy indicators and were related to patients’ prognosis (14–19, 22, 60–64). These studies firmly proved that m5C regulators were differentially expressed and modulated the immunotherapy response in multiple cancers. In PAAD, the m5C writer NSUN6 has been shown to repress cell proliferation and tumor development (20). However, the effects of m5C regulators on the immune microenvironment in PAAD are largely unknown. Comprehensive analysis of m5C regulators in PAAD is urgently needed. Understanding the functions and underlying mechanism of m5C regulators will help to establish prognostic indicators and provide potential therapeutic strategies in PAAD.
In the present study, we analyzed the expression and genetic alteration patterns of m5C regulators in PAAD dataset. The patients were divided into m5C clusters and m5C gene clusters based on m5C regulators expression and m5C DEGs, respectively. The results confirmed that m5C regulators are related to the immune microenvironment and PAAD patient prognosis. Additionally, we identified a quantitative indicator, the m5C score, from the m5C gene signatures. m5C score was found to predict immunotherapy response and patient prognosis. The underlying driver genes and pathways of m5C regulators were further studied.
m5C regulators have various expression patterns in different cancers. In hepatocellular carcinoma, NSUN2 expression is increased, and H19 lncRNA stability is maintained to promote cancer development (65). In the present study, we examined the expression patterns of m5C regulators in PAAD. The levels of DNMT1, DNMT3A, NSUN2, NSUN3, NSUN5 and YBX1 were increased while those of DNMT3B, NSUN6 and NSUN7 were decreased in PAAD tissues compared to normal tissues. Specifically, DNMT1, DNMT3A and YBX1 were increased while NSUN6 was decreased in PAAD tissues, which are consistent with previous studies in PAAD (20, 55–57). Though genetic alteration rate is low in some cancer types, it plays a critical role to regulate tumor development and predict prognosis (66). In the present study, we founded 51 of the 259 (19.69%) PAAD patients in 2 studies experienced genetic alterations of m5C regulators. Despite the low alteration rate, these genetic alterations are potential targets to develop targeted drugs. These results hinted that m5C regulators affected PAAD development. However, the underlying mechanism is largely unknown.
The immune microenvironment has been reported to indicate immunotherapy response and patient prognosis (67). In the present study, we analyzed the relationship between m5C regulators and the immune microenvironment. Based on the m5C regulator expression pattern and m5C DEGs, patients were divided into different m5C clusters and m5C gene clusters. The results showed that m5C clusters and m5C gene clusters were related to patient OS status, indicating that m5C regulators play a significant role in PAAD development. In addition, differences in immune cell infiltration and immune-relevant gene expression between the m5C clusters and m5C gene clusters were analyzed. Consistently, we found that NK CD56 bright cells were increased and Treg cells were decreased in m5C cluster 2 and m5C gene cluster C, patients in which had the best prognosis when compared with other groups. NK CD56 bright cells were mainly responsible for the innate immune response. As reported, innate immune response plays a central role in improving immunotherapy response and restraining cancer development (44). However, it can’t be ignored kinds of effector immune cells including CD8+ T cells, cytotoxic cells, TCM and TEM were decreased in gene cluster C. It has been reported these immune cells play a vital role in killing tumor cells (68). In the present study, Treg cells were greatly decreased in gene cluster C, which has been proved to suppress the activation and function of effector immune cells in previous study (5). In our opinion, the effector immune cells and immune-suppressive cells antagonize each other and jointly decide the ultimate immunotherapy response of the patients. We speculated that though infiltrating effector immune cells were decreased in gene cluster C, these effector immune cells were activated and functional due to the decreased Treg. Therefore, gene cluster C had the best prognosis. On the contrary, though effector immune cells were increased in other groups, they were dysfunctional for the increased Treg cells. These effector immune cells lost the ability to inhibit tumor growth, thus leading to a worse prognosis. However, this hypothesis remains to be verified in our future study. In conclusion, m5C regulators modulate immunotherapy and PAAD progression partly by modulating innate immune response and Treg cells.
RNA modification regulators affect cellular homeostasis by controlling target RNA stability and function. m5C regulators have been reported to predict immunotherapy response in multiple cancers (14, 22). However, the predictive and prognostic roles of m5C clusters in PAAD are largely unknown. In the present study, we developed a quantitative indicator of m5C regulators from the m5C gene signatures, called the m5C score. We found that the m5C score was related to immune cell infiltration and immune-related gene expression. Additionally, the m5C score was significantly correlated with immunotherapy response and prognosis indicators, including CAF level, T cell dysfunction, MSI, the TIDE score. These results suggest that the m5C score can predict immunotherapy response. We further examine the chemotherapy agents which were responded differentially in high and low m5C score group. Chemotherapy agents have been reported to enhance immunotherapy response. It’s promising that combination with these agents is potential strategy to improve immunotherapy responsiveness in PAAD.
TMB has been reported to be related to cancer development and potentially to determine the response to immunotherapy (69). The results of the present study showed that there was no significant correlation between the m5C score and TMB, indicating that the m5C score is independent of TMB. It has been reported in previous studies low m5C score was related to a better prognosis of oral squamous cell carcinoma and papillary thyroid carcinoma patients (19, 70). In our study, high m5C score indicated better immunotherapy response and prognosis. It seems inconsistent with previous studies. It’s known PAAD had the unique “cold” immune microenvironment, which is different from that in other cancers. The m5C score represented different immune characteristics in different cancer types. Moreover, the same gene always had opposite effects in different types of cancer. It’s another potential cause for the difference. Moreover, gene cluster C had a higher m5C score when compared with other gene clusters, which further support our conclusion. In summary, our study provided a reliable and quantitative indicator for predicting PAAD immunotherapy response and prognosis.
Finally, we determined the underlying cancer driver genes and molecular pathways. Our study revealed several cancer driver genes that differed between the high and low m5C score groups, including KRAS, FBXW7, and SMAD3. KRAS is the most common cancer driver gene in PAAD (71). The E3 ligase FBXW7 has also been reported to regulate PAAD cell epithelial-mesenchymal transition, ferroptosis and apoptosis (72, 73). GSVA indicated that inflammation and metabolism-relevant pathways were differentially activated between the high and low m5C score groups. Inflammation- and metabolism-related pathways have been reported to regulate the immune microenvironment of PAAD (74, 75). The present study implies that m5C regulators can modulate the TME by influencing inflammation or metabolism. The present study provides novel potential mechanisms to account for the ability of m5C regulators to regulate the TME and predict immunotherapy response. However, the direct target RNAs of m5C regulators that modulate inflammation and metabolic processes in PAAD remain to be explored.
In conclusion, we confirmed that m5C regulators are related to the immune microenvironment and the prognosis of PAAD patients with an integrated dataset. Additionally, we developed the m5C score, a quantitative indicator that can predict immunotherapy response and prognosis. The underlying molecular pathways were examined to further understand the m5C score. The results of our study will assist in identifying PAAD patients suitable for tailored immunotherapy strategies.
Data Availability Statement
The datasets presented in this study can be found in online repositories. The names of the repository/repositories and accession number(s) can be found in the article/Supplementary Material.
Ethics Statement
The studies involving human participants were reviewed and approved by The Research Ethics Committee of Tangdu Hospital. The patients/participants provided their written informed consent to participate in this study.
Author Contributions
HS and JL conceived and designed the whole project. RW, YG, and PM drafted the manuscript. YS, JM, CZ, CY, JS, and DG collected the data. LZ, SL, and TZ analyzed the data and wrote the manuscript. All authors reviewed and approved the final manuscript.
Funding
This study was supported by grants from the National Natural Science Foundation of China to HS (No. 81372255) and to RW (No. 81902523).
Conflict of Interest
The authors declare that the research was conducted in the absence of any commercial or financial relationships that could be construed as a potential conflict of interest.
Publisher’s Note
All claims expressed in this article are solely those of the authors and do not necessarily represent those of their affiliated organizations, or those of the publisher, the editors and the reviewers. Any product that may be evaluated in this article, or claim that may be made by its manufacturer, is not guaranteed or endorsed by the publisher.
Supplementary Material
The Supplementary Material for this article can be found online at: https://www.frontiersin.org/articles/10.3389/fonc.2022.851766/full#supplementary-material
Supplementary Figure 1 | The protein expression of m5C regulators in PAAD and normal tissues obtained from the Human Protein Atlas (HPA) database.
Supplementary Figure 2 | m5C cluster construction. (A-H) Consensus clustering matrix of all 930 PAAD patients for each k (k=2 to 9). (I) Consensus clustering cumulative distribution function (CDF) for k=2 to 9. (J) Relative change in the area under the CDF curve for k=2 to 9;.(K) Tracking plot for k=2 to 9.
Supplementary Figure 3 | Construction of m5C gene clusters. (A-I) Consensus clustering matrix of all 930 PAAD patients for each k (k=2 to 9). (J) Consensus clustering cumulative distribution function (CDF) for k=2 to 9. (K) Relative change in the area under the CDF curve for k=2 to 9. (L) Tracking plot for k=2 to 9.
Supplementary Figure 4 | A heatmap was constructed to delineate the correlation between the m5C score and the TME.
References
1. Mizrahi JD, Surana R, Valle JW, Shroff RT. Pancreatic Cancer. Lancet (2020) 395(10242):2008–20. doi: 10.1016/S0140-6736(20)30974-0
2. Morrison AH, Byrne KT, Vonderheide RH. Immunotherapy and Prevention of Pancreatic Cancer. Trends Cancer (2018) 4(6):418–28. doi: 10.1016/j.trecan.2018.04.001
3. Karamitopoulou E. Tumour Microenvironment of Pancreatic Cancer: Immune Landscape Is Dictated by Molecular and Histopathological Features. Br J Cancer (2019) 121(1):5–14. doi: 10.1038/s41416-019-0479-5
4. Raskov H, Orhan A, Christensen JP, Gogenur I. Cytotoxic CD8(+) T Cells in Cancer and Cancer Immunotherapy. Br J Cancer (2021) 124(2):359–67. doi: 10.1038/s41416-020-01048-4
5. Tanaka A, Sakaguchi S. Regulatory T Cells in Cancer Immunotherapy. Cell Res (2017) 27(1):109–18. doi: 10.1038/cr.2016.151
6. Li W, Song X, Yu H, Zhang M, Li F, Cao C, et al. Dendritic Cell-Based Cancer Immunotherapy for Pancreatic Cancer. Arab J Gastroenterol (2018) 19(1):1–6. doi: 10.1016/j.ajg.2017.05.013
7. Li N, Kang Y, Wang L, Huff S, Tang R, Hui H, et al. ALKBH5 Regulates Anti-PD-1 Therapy Response by Modulating Lactate and Suppressive Immune Cell Accumulation in Tumor Microenvironment. Proc Natl Acad Sci USA (2020) 117(33):20159–70. doi: 10.1073/pnas.1918986117
8. Li H, Hu J, Yu A, Othmane B, Guo T, Liu J, et al. RNA Modification of N6-Methyladenosine Predicts Immune Phenotypes and Therapeutic Opportunities in Kidney Renal Clear Cell Carcinoma. Front Oncol (2021) 11:642159. doi: 10.3389/fonc.2021.642159
9. Guo Y, Wang R, Li J, Song Y, Min J, Zhao T, et al. Comprehensive Analysis of M6a RNA Methylation Regulators and the Immune Microenvironment to Aid Immunotherapy in Pancreatic Cancer. Front Immunol (2021) 12:769425. doi: 10.3389/fimmu.2021.769425
10. Chen YS, Yang WL, Zhao YL, Yang YG. Dynamic Transcriptomic M(5) C and Its Regulatory Role in RNA Processing. Wiley Interdiscip Rev RNA (2021) 12(4):e1639. doi: 10.1002/wrna.1639
11. Chen X, Li A, Sun BF, Yang Y, Han YN, Yuan X, et al. 5-Methylcytosine Promotes Pathogenesis of Bladder Cancer Through Stabilizing mRNAs. Nat Cell Biol (2019) 21(8):978–90. doi: 10.1038/s41556-019-0361-y
12. Peng Z, Wang J, Shan B, Li B, Peng W, Dong Y, et al. The Long Noncoding RNA LINC00312 Induces Lung Adenocarcinoma Migration and Vasculogenic Mimicry Through Directly Binding YBX1. Mol Cancer (2018) 17(1):167. doi: 10.1186/s12943-018-0920-z
13. Guo G, Wang H, Shi X, Ye L, Yan K, Chen Z, et al. Disease Activity-Associated Alteration of mRNA M(5) C Methylation in CD4(+) T Cells of Systemic Lupus Erythematosus. Front Cell Dev Biol (2020) 8:430. doi: 10.3389/fcell.2020.00430
14. Pan J, Huang Z, Xu Y. M5c-Related lncRNAs Predict Overall Survival of Patients and Regulate the Tumor Immune Microenvironment in Lung Adenocarcinoma. Front Cell Dev Biol (2021) 9:671821. doi: 10.3389/fcell.2021.671821
15. Chen H, Ge XL, Zhang ZY, Liu M, Wu RY, Zhang XF, et al. M(5)C Regulator-Mediated Methylation Modification Patterns and Tumor Microenvironment Infiltration Characterization in Lung Adenocarcinoma. Transl Lung Cancer Res (2021) 10(5):2172–92. doi: 10.21037/tlcr-21-351
16. Hu J, Othmane B, Yu A, Li H, Cai Z, Chen X, et al. 5mc Regulator-Mediated Molecular Subtypes Depict the Hallmarks of the Tumor Microenvironment and Guide Precision Medicine in Bladder Cancer. BMC Med (2021) 19(1):289. doi: 10.1186/s12916-021-02163-6
17. Wu J, Hou C, Wang Y, Wang Z, Li P, Wang Z. Comprehensive Analysis of M(5)C RNA Methylation Regulator Genes in Clear Cell Renal Cell Carcinoma. Int J Genomics (2021) 2021:3803724. doi: 10.1155/2021/3803724
18. Xu W, Zhu W, Tian X, Liu W, Wu Y, Anwaier A, et al. Integrative 5-Methylcytosine Modification Immunologically Reprograms Tumor Microenvironment Characterizations and Phenotypes of Clear Cell Renal Cell Carcinoma. Front Cell Dev Biol (2021) 9:772436. doi: 10.3389/fcell.2021.772436
19. Gao L, Chen R, Sugimoto M, Mizuta M, Zhou L, Kishimoto Y, et al. The RNA Methylation Modification 5-Methylcytosine Impacts Immunity Characteristics, Prognosis and Progression of Oral Squamous Cell Carcinoma by Bioinformatics Analysis. Front Bioeng Biotechnol (2021) 9:760724. doi: 10.3389/fbioe.2021.760724
20. Yang R, Liang X, Wang H, Guo M, Shen H, Shi Y, et al. The RNA Methyltransferase NSUN6 Suppresses Pancreatic Cancer Development by Regulating Cell Proliferation. EBioMedicine (2021) 63:103195. doi: 10.1016/j.ebiom.2020.103195
21. Leek JT, Johnson WE, Parker HS, Jaffe AE, Storey JD. The Sva Package for Removing Batch Effects and Other Unwanted Variation in High-Throughput Experiments. Bioinformatics (2012) 28(6):882–3. doi: 10.1093/bioinformatics/bts034
22. Pan J, Huang Z, Xu Y. M5c RNA Methylation Regulators Predict Prognosis and Regulate the Immune Microenvironment in Lung Squamous Cell Carcinoma. Front Oncol (2021) 11:657466. doi: 10.3389/fonc.2021.657466
23. Wilkerson MD, Hayes DN. ConsensusClusterPlus: A Class Discovery Tool With Confidence Assessments and Item Tracking. Bioinformatics (2010) 26(12):1572–3. doi: 10.1093/bioinformatics/btq170
24. Bindea G, Mlecnik B, Tosolini M, Kirilovsky A, Waldner M, Obenauf AC, et al. Spatiotemporal Dynamics of Intratumoral Immune Cells Reveal the Immune Landscape in Human Cancer. Immunity (2013) 39(4):782–95. doi: 10.1016/j.immuni.2013.10.003
25. Barbie DA, Tamayo P, Boehm JS, Kim SY, Moody SE, Dunn IF, et al. Systematic RNA Interference Reveals That Oncogenic KRAS-Driven Cancers Require TBK1. Nature (2009) 462(7269):108–12. doi: 10.1038/nature08460
26. Charoentong P, Finotello F, Angelova M, Mayer C, Efremova M, Rieder D, et al. Pan-Cancer Immunogenomic Analyses Reveal Genotype-Immunophenotype Relationships and Predictors of Response to Checkpoint Blockade. Cell Rep (2017) 18(1):248–62. doi: 10.1016/j.celrep.2016.12.019
27. Guo Y, He Y. Comprehensive Analysis of the Expression of SLC30A Family Genes and Prognosis in Human Gastric Cancer. Sci Rep (2020) 10(1):18352. doi: 10.1038/s41598-020-75012-w
28. Yoshihara K, Shahmoradgoli M, Martinez E, Vegesna R, Kim H, Torres-Garcia W, et al. Inferring Tumour Purity and Stromal and Immune Cell Admixture From Expression Data. Nat Commun (2013) 4:2612. doi: 10.1038/ncomms3612
29. Jiang P, Gu S, Pan D, Fu J, Sahu A, Hu X, et al. Signatures of T Cell Dysfunction and Exclusion Predict Cancer Immunotherapy Response. Nat Med (2018) 24(10):1550–8. doi: 10.1038/s41591-018-0136-1
30. Tang Z, Li C, Kang B, Gao G, Li C, Zhang Z. GEPIA: A Web Server for Cancer and Normal Gene Expression Profiling and Interactive Analyses. Nucleic Acids Res (2017) 45(W1):W98–W102. doi: 10.1093/nar/gkx247
31. Ritchie ME, Phipson B, Wu D, Hu Y, Law CW, Shi W, et al. Limma Powers Differential Expression Analyses for RNA-Sequencing and Microarray Studies. Nucleic Acids Res (2015) 43(7):e47. doi: 10.1093/nar/gkv007
32. Degenhardt F, Seifert S, Szymczak S. Evaluation of Variable Selection Methods for Random Forests and Omics Data Sets. Brief Bioinform (2019) 20(2):492–503. doi: 10.1093/bib/bbx124
33. Hugo W, Zaretsky JM, Sun L, Song C, Moreno BH, Hu-Lieskovan S, et al. Genomic and Transcriptomic Features of Response to Anti-PD-1 Therapy in Metastatic Melanoma. Cell (2016) 165(1):35–44. doi: 10.1016/j.cell.2016.02.065
34. Hanzelmann S, Castelo R, Guinney J. GSVA: Gene Set Variation Analysis for Microarray and RNA-Seq Data. BMC Bioinform (2013) 14:7. doi: 10.1186/1471-2105-14-7
35. Xu L, Deng C, Pang B, Zhang X, Liu W, Liao G, et al. TIP: A Web Server for Resolving Tumor Immunophenotype Profiling. Cancer Res (2018) 78(23):6575–80. doi: 10.1158/0008-5472.CAN-18-0689
36. Hu J, Yu A, Othmane B, Qiu D, Li H, Li C, et al. Siglec15 Shapes a non-Inflamed Tumor Microenvironment and Predicts the Molecular Subtype in Bladder Cancer. Theranostics (2021) 11(7):3089–108. doi: 10.7150/thno.53649
37. Martinez-Jimenez F, Muinos F, Sentis I, Deu-Pons J, Reyes-Salazar I, Arnedo-Pac C, et al. A Compendium of Mutational Cancer Driver Genes. Nat Rev Cancer (2020) 20(10):555–72. doi: 10.1038/s41568-020-0290-x
38. Geeleher P, Cox N, Huang RS. Prrophetic: An R Package for Prediction of Clinical Chemotherapeutic Response From Tumor Gene Expression Levels. PLoS One (2014) 9(9):e107468. doi: 10.1371/journal.pone.0107468
39. Bohnsack KE, Hobartner C, Bohnsack MT. Eukaryotic 5-Methylcytosine (M(5)C) RNA Methyltransferases: Mechanisms, Cellular Functions, and Links to Disease. Genes (Basel) (2019) 10(2):102. doi: 10.3390/genes10020102
40. Zhou S, Treloar AE, Lupien M. Emergence of the Noncoding Cancer Genome: A Target of Genetic and Epigenetic Alterations. Cancer Discov (2016) 6(11):1215–29. doi: 10.1158/2159-8290.CD-16-0745
41. Rostamzadeh D, Yousefi M, Haghshenas MR, Ahmadi M, Dolati S, Babaloo Z. mTOR Signaling Pathway as a Master Regulator of Memory CD8(+) T-Cells, Th17, and NK Cells Development and Their Functional Properties. J Cell Physiol (2019) 234(8):12353–68. doi: 10.1002/jcp.28042
42. Zhang X, Shi M, Chen T, Zhang B. Characterization of the Immune Cell Infiltration Landscape in Head and Neck Squamous Cell Carcinoma to Aid Immunotherapy. Mol Ther Nucleic Acids (2020) 22:298–309. doi: 10.1016/j.omtn.2020.08.030
43. Ohue Y, Nishikawa H, Regulatory T. (Treg) Cells in Cancer: Can Treg Cells Be a New Therapeutic Target? Cancer Sci (2019) 110(7):2080–9. doi: 10.1111/cas.14069
44. Liu S, Galat V, Galat Y, Lee YKA, Wainwright D, Wu J. NK Cell-Based Cancer Immunotherapy: From Basic Biology to Clinical Development. J Hematol Oncol (2021) 14(1):7. doi: 10.1186/s13045-020-01014-w
45. Chen X, Song E. Turning Foes to Friends: Targeting Cancer-Associated Fibroblasts. Nat Rev Drug Discov (2019) 18(2):99–115. doi: 10.1038/s41573-018-0004-1
46. Rodriquenz MG, Roviello G, D'Angelo A, Lavacchi D, Roviello F, Polom K. MSI and EBV Positive Gastric Cancer's Subgroups and Their Link With Novel Immunotherapy. J Clin Med (2020) 9(5):1427. doi: 10.3390/jcm9051427
47. Ren Q, Zhu P, Zhang H, Ye T, Liu D, Gong Z, et al. Identification and Validation of Stromal-Tumor Microenvironment-Based Subtypes Tightly Associated With PD-1/PD-L1 Immunotherapy and Outcomes in Patients With Gastric Cancer. Cancer Cell Int (2020) 20:92. doi: 10.1186/s12935-020-01173-3
48. Chen DS, Mellman I. Oncology Meets Immunology: The Cancer-Immunity Cycle. Immunity (2013) 39(1):1–10. doi: 10.1016/j.immuni.2013.07.012
49. Dalgleish AG. Rationale for Combining Immunotherapy With Chemotherapy. Immunotherapy (2015) 7(3):309–16. doi: 10.2217/imt.14.111
50. Zouein J, Haddad FG, Eid R, Kourie HR. The Combination of Immune Checkpoint Inhibitors and Chemotherapy in Advanced Non-Small-Cell Lung Cancer: The Rational Choice. Immunotherapy (2022) 14(2):155–67. doi: 10.2217/imt-2021-0014
51. Kopantsev EP, Kostina MB, Grankina EV, Kopantseva MR, Egorov VI, Sverdlov ED. Expression of Therapeutic Gene FCU1 Sensitizes Pancreatic Cancer Cells to 5-Fluorocytosine and Enhances the Cytotoxic Effect of 5-Fluorouracil. Bull Exp Biol Med (2016) 161(6):808–10. doi: 10.1007/s10517-016-3517-9
52. Mie T, Sasaki T, Takeda T, Okamoto T, Mori C, Furukawa T, et al. Treatment Outcomes of Erlotinib Plus Gemcitabine as Late-Line Chemotherapy in Unresectable Pancreatic Cancer. Jpn J Clin Oncol (2021) 51(9):1416–22. doi: 10.1093/jjco/hyab091
53. Chalasani P, Kurtin S, Dragovich T. Response to a Third-Line Mitomycin C (MMC)-Based Chemotherapy in a Patient With Metastatic Pancreatic Adenocarcinoma Carrying Germline BRCA2 Mutation. JOP (2008) 9(3):305–8.
54. Samstein RM, Lee CH, Shoushtari AN, Hellmann MD, Shen R, Janjigian YY, et al. Tumor Mutational Load Predicts Survival After Immunotherapy Across Multiple Cancer Types. Nat Genet (2019) 51(2):202–6. doi: 10.1038/s41588-018-0312-8
55. Jing W, Song N, Liu YP, Qu XJ, Qi YF, Li C, et al. DNMT3a Promotes Proliferation by Activating the STAT3 Signaling Pathway and Depressing Apoptosis in Pancreatic Cancer. Cancer Manag Res (2019) 11:6379–96. doi: 10.2147/CMAR.S201610
56. Li A, Omura N, Hong SM, Goggins M. Pancreatic Cancer DNMT1 Expression and Sensitivity to DNMT1 Inhibitors. Cancer Biol Ther (2010) 9(4):321–9. doi: 10.4161/cbt.9.4.10750
57. Liu Z, Li Y, Li X, Zhao J, Wu S, Wu H, et al. Overexpression of YBX1 Promotes Pancreatic Ductal Adenocarcinoma Growth via the GSK3B/Cyclin D1/Cyclin E1 Pathway. Mol Ther Oncolytics (2020) 17:21–30. doi: 10.1016/j.omto.2020.03.006
58. Chellamuthu A, Gray SG. The RNA Methyltransferase NSUN2 and Its Potential Roles in Cancer. Cells (2020) 9(8):1758. doi: 10.3390/cells9081758
59. Mei L, Shen C, Miao R, Wang JZ, Cao MD, Zhang YS, et al. RNA Methyltransferase NSUN2 Promotes Gastric Cancer Cell Proliferation by Repressing P57(Kip2) by an M(5)C-Dependent Manner. Cell Death Dis (2020) 11(4):270. doi: 10.1038/s41419-020-2487-z
60. Huang Z, Pan J, Wang H, Du X, Xu Y, Wang Z, et al. Prognostic Significance and Tumor Immune Microenvironment Heterogenicity of M5c RNA Methylation Regulators in Triple-Negative Breast Cancer. Front Cell Dev Biol (2021) 9:657547. doi: 10.3389/fcell.2021.657547
61. Wu XR, Chen Z, Liu Y, Chen ZZ, Tang F, Chen ZZ, et al. Prognostic Signature and Immune Efficacy of M(1) A-, M(5) C- and M(6) A-Related Regulators in Cutaneous Melanoma. J Cell Mol Med (2021) 25(17):8405–18. doi: 10.1111/jcmm.16800
62. Geng Q, Wei Q, Shen Z, Zheng Y, Wang L, Xue W, et al. Comprehensive Analysis of the Prognostic Value and Immune Infiltrates of the Three-M5c Signature in Colon Carcinoma. Cancer Manag Res (2021) 13:7989–8002. doi: 10.2147/CMAR.S331549
63. Gu X, Zhou H, Chu Q, Zheng Q, Wang J, Zhu H. Uncovering the Association Between M(5)C Regulator-Mediated Methylation Modification Patterns and Tumour Microenvironment Infiltration Characteristics in Hepatocellular Carcinoma. Front Cell Dev Biol (2021) 9:727935. doi: 10.3389/fcell.2021.727935
64. Liu T, Guo L, Liu G, Hu X, Li X, Zhang J, et al. Molecular Characterization of the Clinical and Tumor Immune Microenvironment Signature of 5-Methylcytosine-Related Regulators in Non-Small Cell Lung Cancer. Front Cell Dev Biol (2021) 9:779367. doi: 10.3389/fcell.2021.779367
65. Sun Z, Xue S, Zhang M, Xu H, Hu X, Chen S, et al. Aberrant NSUN2-Mediated M(5)C Modification of H19 lncRNA Is Associated With Poor Differentiation of Hepatocellular Carcinoma. Oncogene (2020) 39(45):6906–19. doi: 10.1038/s41388-020-01475-w
66. Chen H, Yao J, Bao R, Dong Y, Zhang T, Du Y, et al. Cross-Talk of Four Types of RNA Modification Writers Defines Tumor Microenvironment and Pharmacogenomic Landscape in Colorectal Cancer. Mol Cancer (2021) 20(1):29. doi: 10.1186/s12943-021-01322-w
67. Cao R, Yuan L, Ma B, Wang G, Tian Y. Tumour Microenvironment (TME) Characterization Identified Prognosis and Immunotherapy Response in Muscle-Invasive Bladder Cancer (MIBC). Cancer Immunol Immunother (2021) 70(1):1–18. doi: 10.1007/s00262-020-02649-x
68. Farhood B, Najafi M, Mortezaee K. CD8(+) Cytotoxic T Lymphocytes in Cancer Immunotherapy: A Review. J Cell Physiol (2019) 234(6):8509–21. doi: 10.1002/jcp.27782
69. Liu L, Bai X, Wang J, Tang XR, Wu DH, Du SS, et al. Combination of TMB and CNA Stratifies Prognostic and Predictive Responses to Immunotherapy Across Metastatic Cancer. Clin Cancer Res (2019) 25(24):7413–23. doi: 10.1158/1078-0432.CCR-19-0558
70. Li F, Deng Q, Pang X, Huang S, Zhang J, Zhu X, et al. M(5)C Regulator-Mediated Methylation Modification Patterns and Tumor Microenvironment Infiltration Characterization in Papillary Thyroid Carcinoma. Front Oncol (2021) 11:729887. doi: 10.3389/fonc.2021.729887
71. Kaushik AC, Wang YJ, Wang X, Wei DQ. Irinotecan and Vandetanib Create Synergies for Treatment of Pancreatic Cancer Patients With Concomitant TP53 and KRAS Mutations. Brief Bioinform (2021) 22(3):bbaa149. doi: 10.1093/bib/bbaa149
72. Ye Z, Zhuo Q, Hu Q, Xu X, Mengqi L, Zhang Z, et al. FBW7-NRA41-SCD1 Axis Synchronously Regulates Apoptosis and Ferroptosis in Pancreatic Cancer Cells. Redox Biol (2021) 38:101807. doi: 10.1016/j.redox.2020.101807
73. Qin Y, Hu Q, Xu J, Ji S, Dai W, Liu W, et al. PRMT5 Enhances Tumorigenicity and Glycolysis in Pancreatic Cancer via the FBW7/cMyc Axis. Cell Commun Signal (2019) 17(1):30. doi: 10.1186/s12964-019-0344-4
74. Qin C, Yang G, Yang J, Ren B, Wang H, Chen G, et al. Metabolism of Pancreatic Cancer: Paving the Way to Better Anticancer Strategies. Mol Cancer (2020) 19(1):50. doi: 10.1186/s12943-020-01169-7
Keywords: pancreatic adenocarcinoma, m5C regulators, RNA modification, immune microenvironment, immunotherapy
Citation: Wang R, Guo Y, Ma P, Song Y, Min J, Zhao T, Hua L, Zhang C, Yang C, Shi J, Zhu L, Gan D, Li S, Li J and Su H (2022) Comprehensive Analysis of 5-Methylcytosine (m5C) Regulators and the Immune Microenvironment in Pancreatic Adenocarcinoma to Aid Immunotherapy. Front. Oncol. 12:851766. doi: 10.3389/fonc.2022.851766
Received: 10 January 2022; Accepted: 07 March 2022;
Published: 31 March 2022.
Edited by:
Xiao Zhu, Guangdong Medical University, ChinaReviewed by:
Xing Liang, Stanford University, United StatesChongming Jiang, Baylor College of Medicine, United States
Copyright © 2022 Wang, Guo, Ma, Song, Min, Zhao, Hua, Zhang, Yang, Shi, Zhu, Gan, Li, Li and Su. This is an open-access article distributed under the terms of the Creative Commons Attribution License (CC BY). The use, distribution or reproduction in other forums is permitted, provided the original author(s) and the copyright owner(s) are credited and that the original publication in this journal is cited, in accordance with accepted academic practice. No use, distribution or reproduction is permitted which does not comply with these terms.
*Correspondence: Haichuan Su, c3VoY0BmbW11LmVkdS5jbg==; Junqiang Li, amp1bnFpYW5nQDEyNi5jb20=
†These authors have contributed equally to this work and share first authorship