 Kehui Zhang
 Jian Wang‡
 YingYing Zhu
 Jiacheng Li
 Zhe Shi
 Yong Li
- Shanghai Municipal Hospital of Traditional Chinese Medicine, Shanghai University of Traditional Chinese Medicine, Shanghai, China
Objective: This study was conducted in order to gain a better understanding of the molecular mechanisms of stomach adenocarcinoma (STAD), which is necessary to predict the prognosis of STAD and develop novel gene therapy strategies.
Methods: In this study, the gene expression profile of GSE118916 in the Gene Expression Omnibus (GEO) and The Cancer Genome Atlas Program (TCGA) was used to explore the differential co-expression genes of STAD and normal tissues.
Results: A total of 407 STAD samples were collected, consisting of 375 from stomach adenocarcinoma tissues and 32 from normal tissues, as well as RNA-seq count data for 19,600 genes. Forty-two differentially expressed genes were screened by weighted gene co-expression network analysis (WGCNA) and differentially expressed gene analysis. According to the functional annotation analysis of the clusterProfiler R package, these genes were analyzed for GO function enrichment, digestion (biological process), tube bottom material membrane (cell component), and oxidoreductase activity (molecular function). The KEGG pathway was enriched in gastric acid secretion and chemical carcinogenesis. In addition, Cytoscape’s cytoHubba plug-in was used to identify seven hub genes (EWSR1, ESR1, CLTC, PCMT1, TP53, HUWE1, and HDAC1) in a protein–protein interaction (PPI) network consisting of 7 nodes and 11 edges. Compared with normal tissues, CLTC and TP53 genes were upregulated in stomach adenocarcinoma (P < 0.05). TP53 was expressed differently in stages II and IV, EWSR1 was expressed differently in stages II and III, and ESR1 was expressed differently in stages I–III. Among the seven hub genes, Kaplan–Meier analysis and TCGG showed that the expression levels of HDAC1 and CLTC were significantly correlated with OS in patients with stomach adenocarcinoma (P < 0.05). GEPIA2 analysis showed that ESR1 expression was closely correlated with OS and DFS in gastric adenocarcinoma (P < 0.05). Then, the expression of the genes and their correlations were revealed by the R2 Platform (http://r2.amc.nl). Finally, we collected 18 pairs of gastric mucosal tissues from normal people and cancer tissues from patients with stomach adenocarcinoma. The expression levels of the above seven hub genes and their relative protein expression were detected by RT-PCR and immunohistochemistry (IHC). The results showed that the gene and protein expression levels in stomach adenocarcinoma tissues were increased than those in the normal group.
Conclusion: In summary, we believe that the identified hub genes were related to the occurrence of stomach adenocarcinoma, especially the expression of ESR1, HDAC1, and CLTC genes, which are related to the prognosis and overall survival of patients and may become the potential for the future diagnosis and treatment of STAD.
Introduction
Stomach adenocarcinoma (STAD), the core of this primer, is one of the most common malignant tumors in the clinic, which seriously threatens human life and health and brings a huge economic burden to society. Stomach cancer is more common in developing countries, mainly in China (40%) (1, 2). Since the majority of patients are diagnosed at an advanced stage, the prognosis is relatively poor. The 5-year survival rate of patients with advanced STAD is usually <5% (3). The molecular mechanism of STAD has not yet been fully clarified, so it is imperative to look for approaches to predict prognosis and develop new target gene therapy strategies.
In recent years, bioinformatics analysis has been paid more and more attention as a research hotspot. Weighted gene co-expression network analysis (WGCNA) is a method to understand the relationship between gene function and phenotype from genome-wide expression (4). It is applied to screen the co-expression modules of genes that are highly related to clinical diseases, identify gene modules related to clinical features, and finally find the key genes in the disease for further verification. In addition, the traditional biomarkers are still used clinically, and the lack of effective biomarkers for early STAD detection limits the treatment of the disease (5, 6). Differential gene expression analysis is a particular technique, which supplies an approach for studying the molecular mechanism of genome regulation and discovering the difference between the two groups of gene expression (7). These differentially expressed genes may be potential biomarkers to reveal diseases. As a result, the combination of WGCNA and differential gene expression analysis could better identify the core genes which may be used as potential biomarkers for STAD.
In the present study, disease-related mRNA data were obtained from The Cancer Genome Atlas Stomach Adenocarcinoma (TCGA-STAD) and Gene Expression Omnibus (GEO) databases, and differential co-expression genes were finally derived through WGCNA analysis and differential gene expression analysis. Next, we discussed the progress of STAD through Gene Ontology (GO) enrichment analysis, KEGG signal pathway analysis, and protein–protein interaction (PPI) analysis. Meanwhile, we applied online tools and clinical data in the database to verify survival analysis. We also verified differences in the expression of core genes between normal and stomach adenocarcinoma tissues. This study provides a potential basis for exploring the prognosis of STAD and target gene therapy by analyzing the differentially co-expressed genes of STAD.
Method
The analysis of the hub gene extraction management process is shown in Figure 1. We will discuss the specific steps in the subsequent sections.
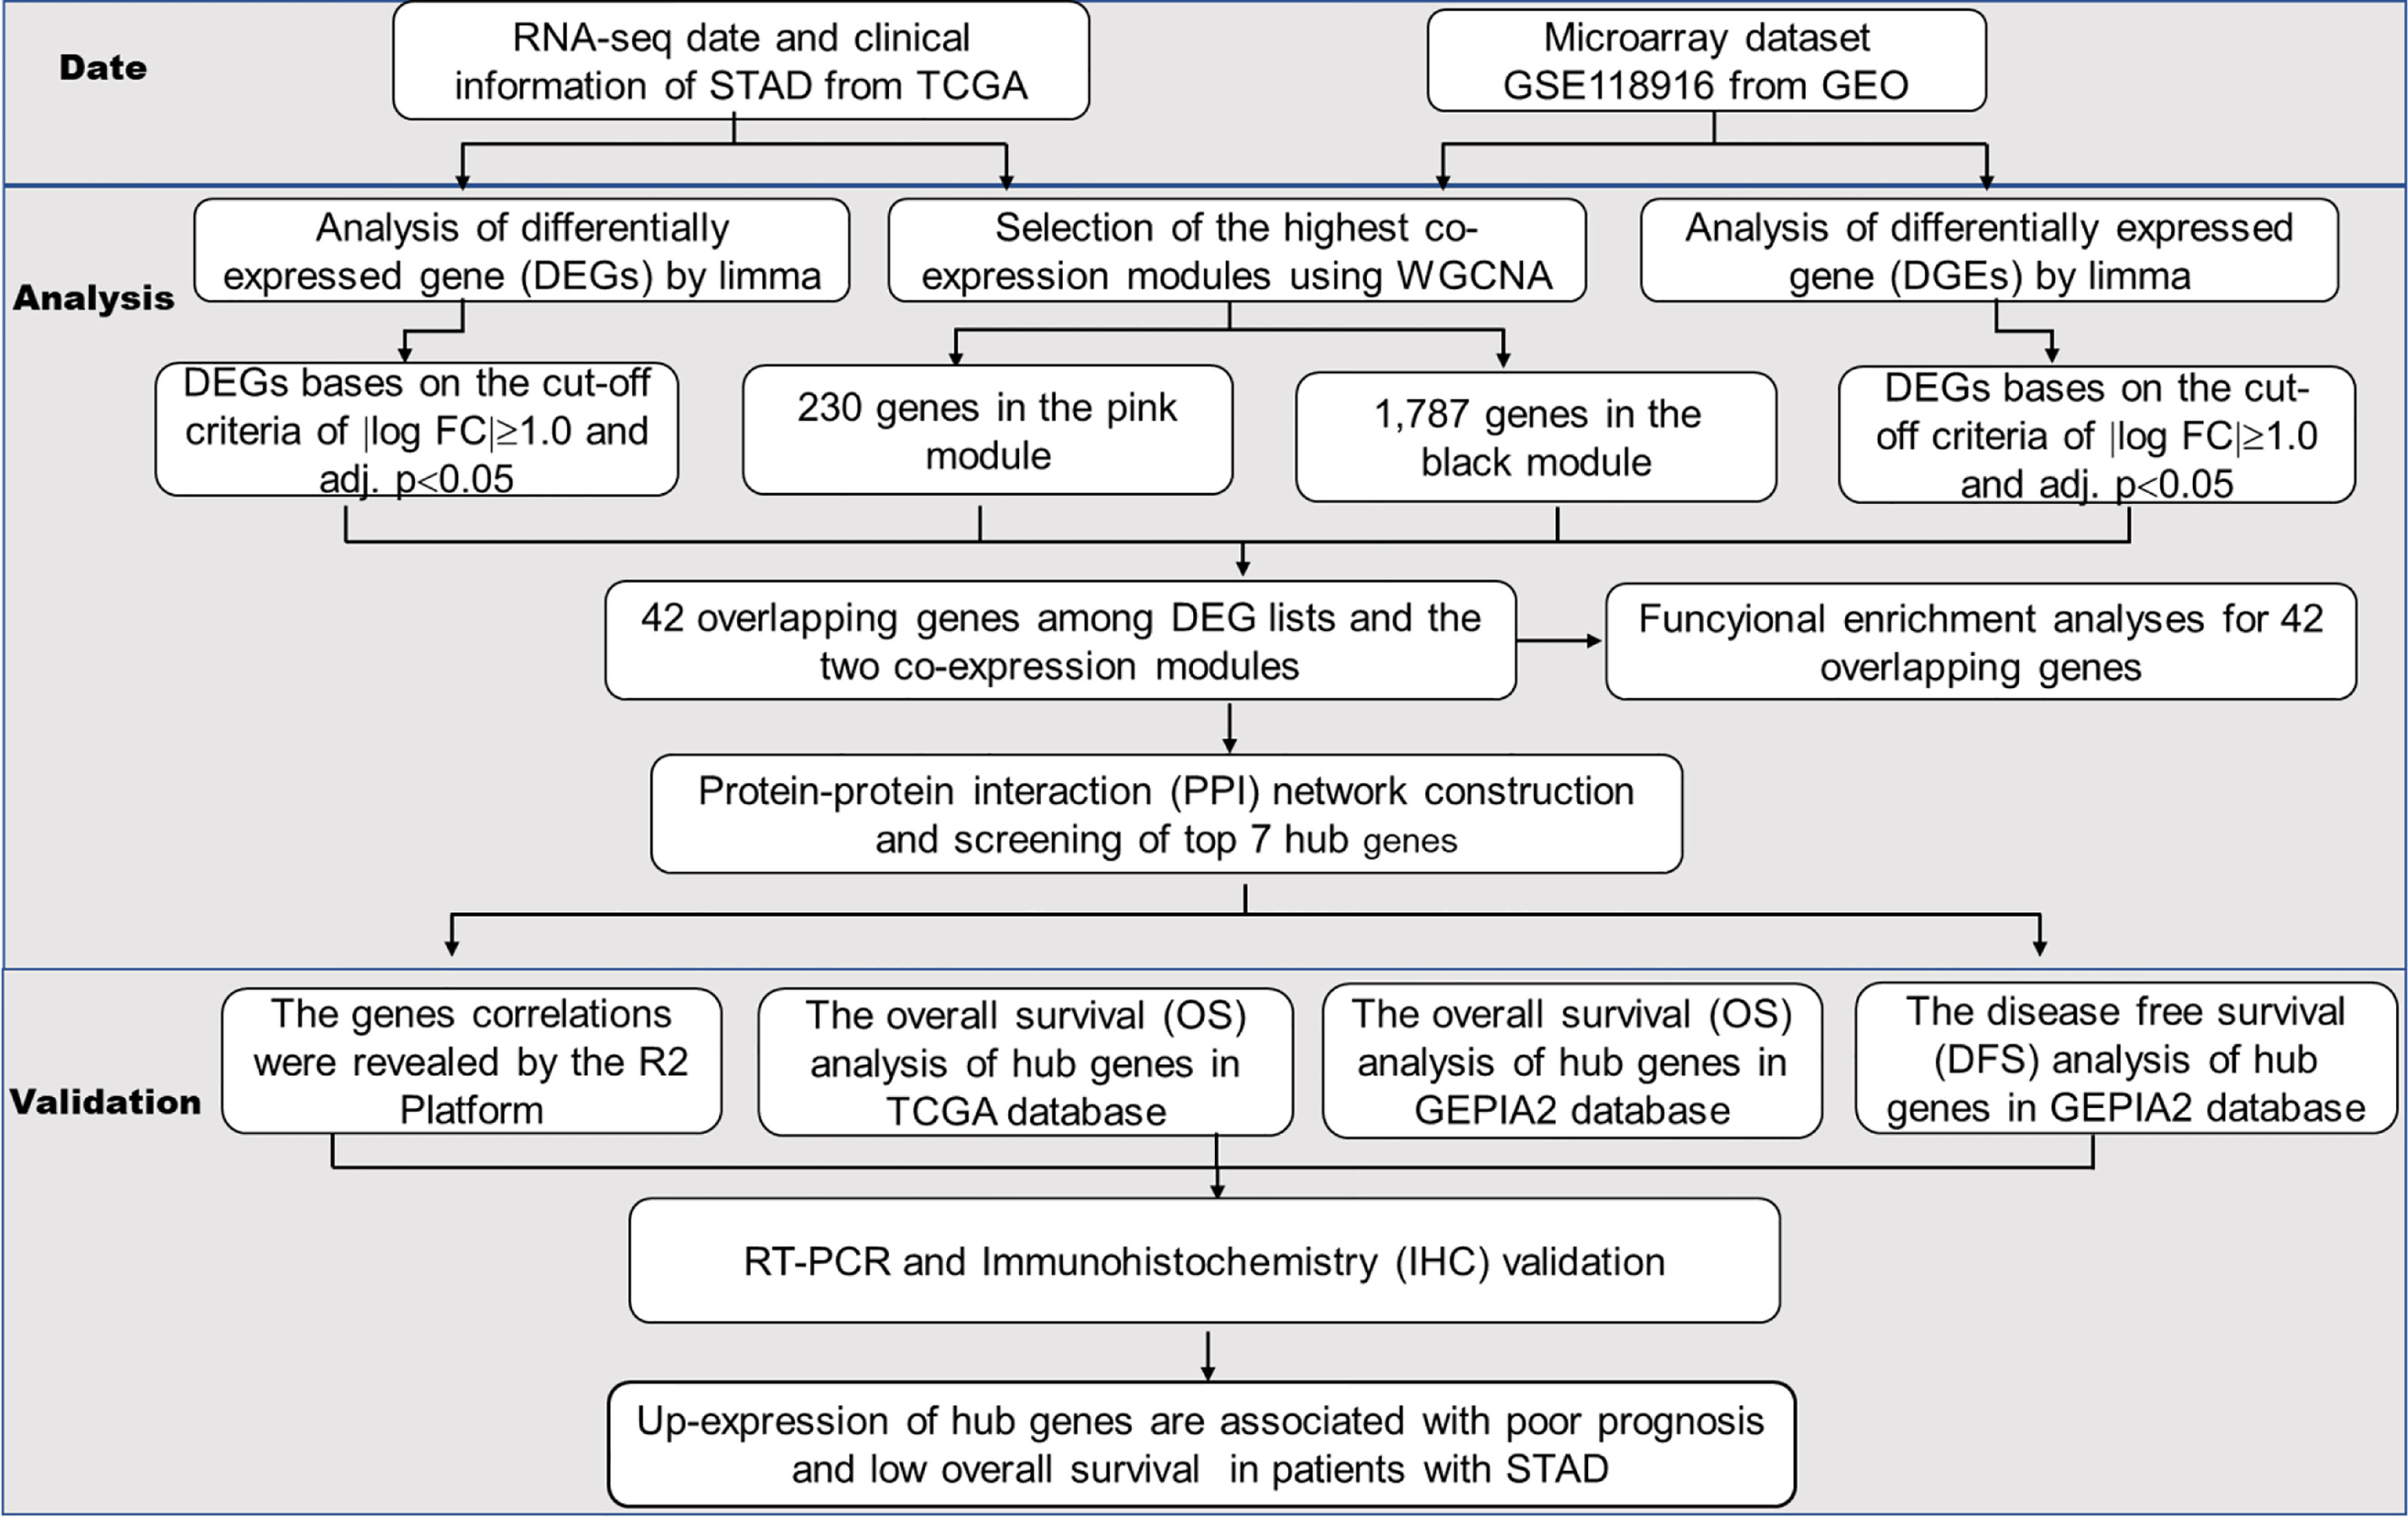
Figure 1 The workflow of the analysis of the hub gene extraction curation pipeline.
Database Extracted From the TCGA and GEO
The TCGA (https://portal.gdc.cancer.gov/) and GEO (https://www.ncbi.nlm.nih.gov/gds) were used to download the gene expression profile of STAD. All data of STAD including clinical information are available for free download through the R package TCGAbiolinks. In total, 407 STAD samples, which include 375 stomach adenocarcinoma and 32 normal tissues, and RNA-seq count data on 19,600 genes were collected. According to the recommendations of the edgeR package guide, genes with low reads were usually meaningless for analysis. Therefore, we kept genes with cpm (counts per million) ≥1. Furthermore, another normalized expression profile of STAD gene GSE118916 from GEO was gained by the R package GEOquery. GSE118916 including 15 cases of patients with STAD tumor specimen pairing and 15 cases of normal tissue was analyzed by using the GPL15207 platform Affymetrix Human Gene Expression Array. Probes were converted to gene markers according to the annotations provided by the producers, and duplicated microprobes of identical genes were removed by defining the midpoint expression value of all related microprobes. Therefore, 18,835 genes were chosen for the succeeding work.
Recognition of Crucial Co-Expression Modules Based on WGCNA
Gene co-expression networks promoted the selection of genes, which can be used to identify potential biomarkers and drug targets. With the help of the WGCNA package, we built the gene expression profiles of TCGA-STAD and GSE118916. With the help of the function pickSoftThreshold, we set soft power β = 3 and 20 to create a scaleless network. Then, the adjacency matrix was created by formula and was transformed into a topological overlap matrix (TOM) as well as the corresponding dissimilarity (1-TOM). After that, similar expression genes were divided into different co-expression modules by constructing the hierarchical clustering tree of the 1-TOM matrix. Module characteristic associations and clinical characteristic information between modules were calculated based on previous studies so that further identification of functional modules in the co-expression network could be conducted. Consequently, modules related to clinical characteristic information and chosen for subsequent analysis were those with high correlation coefficients.
Differential Expression Analysis and Comparison of Modules of Interest
The solution for RNA sequencing and differential expression analysis of microarray data was provided by the R package limma which was applied to screen differentially expressed genes (DEGs) in the TCGA-STAD and GSE118916 datasets to find the DEGs between STAD and normal tissues, respectively. The false discovery rate (FDR) was controlled by P-value which was adjusted by the Benjamini–Hochberg method. Genes with the cutoff criteria of |logFC| ≥1.0 and adj. P <0.05 were regarded as DEGs. The DEGs of the TCGA-STAD and GSE118916 datasets were envisaged as heat maps and volcano plots by the R package ggplot2. After that, the coincident genes between DEGs and the co-expression genes that were screened from the co-expression network were used to verify potential prognostic genes, which were shown in a Venn diagram through the R package VennDiagram.
PPI Construction and Hub Gene Screening
In this research, we used STRING (a tool for online searching of interacting genes) to predict PPI and constructed a PPI network. Based on the STRING database, genes with scores ≥0.4 were screened to construct a network and displayed visually through Cytoscape (V3.7.2). In co-expression networks, the most effective method to combine the central nodes was the maximum clique centrality (MCC) algorithm which was calculated by Cytoscape’s plug-in (cytoHubba). In this research, the genes with the highest MCC values were extracted as hub genes.
Expression Pattern and Prognostic Value of the Hub Gene
With the purpose of asserting the dependability of the hub gene, we assert the expression pattern of the hub gene in normal tissues and stomach adenocarcinoma tissues. The expression degree of the hub gene between the tumor and normal tissue was represented by a box diagram. Based on the clinical information from the TCGA-SATD, the Kaplan–Meier univariate survival analysis was performed by the survival package to find the relationship between the overall survival (OS) of the patient and the hub gene. We used the online tool GEPIA2 to determine the relationship between hub gene expression and disease-free survival (DFS) in STAD. Patients selected for this study completed the follow-up period and were separated into two groups based on the median expression value of the hub gene. Log-rank P <0.05 was considered statistically significant.
The Gene Expression Correlations Revealed on the R2 Platform
The gene expression correlations were revealed by the R2: Genomics Analysis and Visualization Platform (http://r2.amc.nl).
RNA Isolation and Real-Time Polymerase Chain Reaction
Total RNA was extracted using the TRIzol reagent (Invitrogen, USA). PrimeScript® RT reagent kit (TaKaRa, Japan) and SYBR Premix Ex Taq (TaKaRa, Japan) were used for reverse transcription and quantitative real-time polymerase chain reaction (RT-PCR), respectively. The primers were synthesized by Shanghai Shenggong Biology Co., Ltd. The expression levels of genes relative to β-actin mRNA levels in each sample were calculated according to the 2−ΔΔCt method. The primer sequences are shown below: EWSR1 forward, 5′-AGAACTTCGCCTGGAGAACA-3′ and reverse, 5′-GCCACCTCTGAACATTCCAC-3′; ESR1 forward, 5′-CAAGCC CGCTCATGATCAAA-3′ and reverse, 5′-TCAAATCCACAAAGCCTGGC-3′; CLTC forward, 5′-TATCCGTCGGTTCCAGAGTG-3′ and reverse, 5′-AAGTGCCAATGTAGGGTCCA-3′; PCMT1 forward, 5′-GTTCTGTAC CTGCTCCGAGT-3′ and reverse, 5′-ATTTTGCATAGTGGGAGCGG-3′; HUWE1 forward, 5′-GGGAATCCTGGTGTGACTGA-3′ and reverse, 5′-CTGGATGAAGGTCACAGGGT-3′; HDAC1 forward, 5′-ACCAAGTACCAC AGCGATGA-3′ and reverse, 5′-CCTCGGACTTCTTTGCATGG-3′; and TP53 forward, 5′-GCCCCTCCTCAGCATCTTAT-3′ and reverse, 5′-AAAGCTGTTCCGTCCCAGTA-3′.
Protein Expression Was Validated by Immunohistochemistry
Twenty tissue samples were examined: 10 from stomach adenocarcinoma tissues and the others from normal tissues. In brief, the tissue specimens were dewaxed and treated with methanol that contained 3% hydrogen peroxide to deactivate the endogenous peroxidase. Subsequently, the tissue specimens were treated with the primary antibody of GMFG at 4°C overnight and then treated with the secondary antibody (HRP polymer) for 30 min. Furthermore, diaminobenzoquinone (DAB) was used for the next step.
Statistical Analyses
Statistical analyses were carried out using GraphPad Prism 8.0 software (GraphPad Software, Inc., La Jolla, CA, USA). Multiple comparisons were performed with the ANOVA test.
Results
Construction of Weighted Gene Co-Expression Modules
Aiming at finding the functional collection of STAD patients, the WGCNA software package was used for establishing a gene co-expression network which was gained from the TCGA-STAD and GSE118916 datasets. There are nine modules in TCGA-STAD, each of which is assigned a color (Figure 2A). A total of nine modules in TCGA-STAD (Figure 2A) and nine modules in GSE118916 (Figure 3A) were identified in our research since each one of them was identified as one different color. We then produced heat maps of the module–feature relationship to assess the connection of each module with two clinical manifestations. The final outcomes of the model–character relationship are shown in Figures 2B, 3B, indicating that the pink module in TCGA-STAD and the black module in GSE118916 have the strongest correlation with normal tissues (pink module: R = 0.41, P = 9E−18; black module: R = 0.94, P = 8E−15).
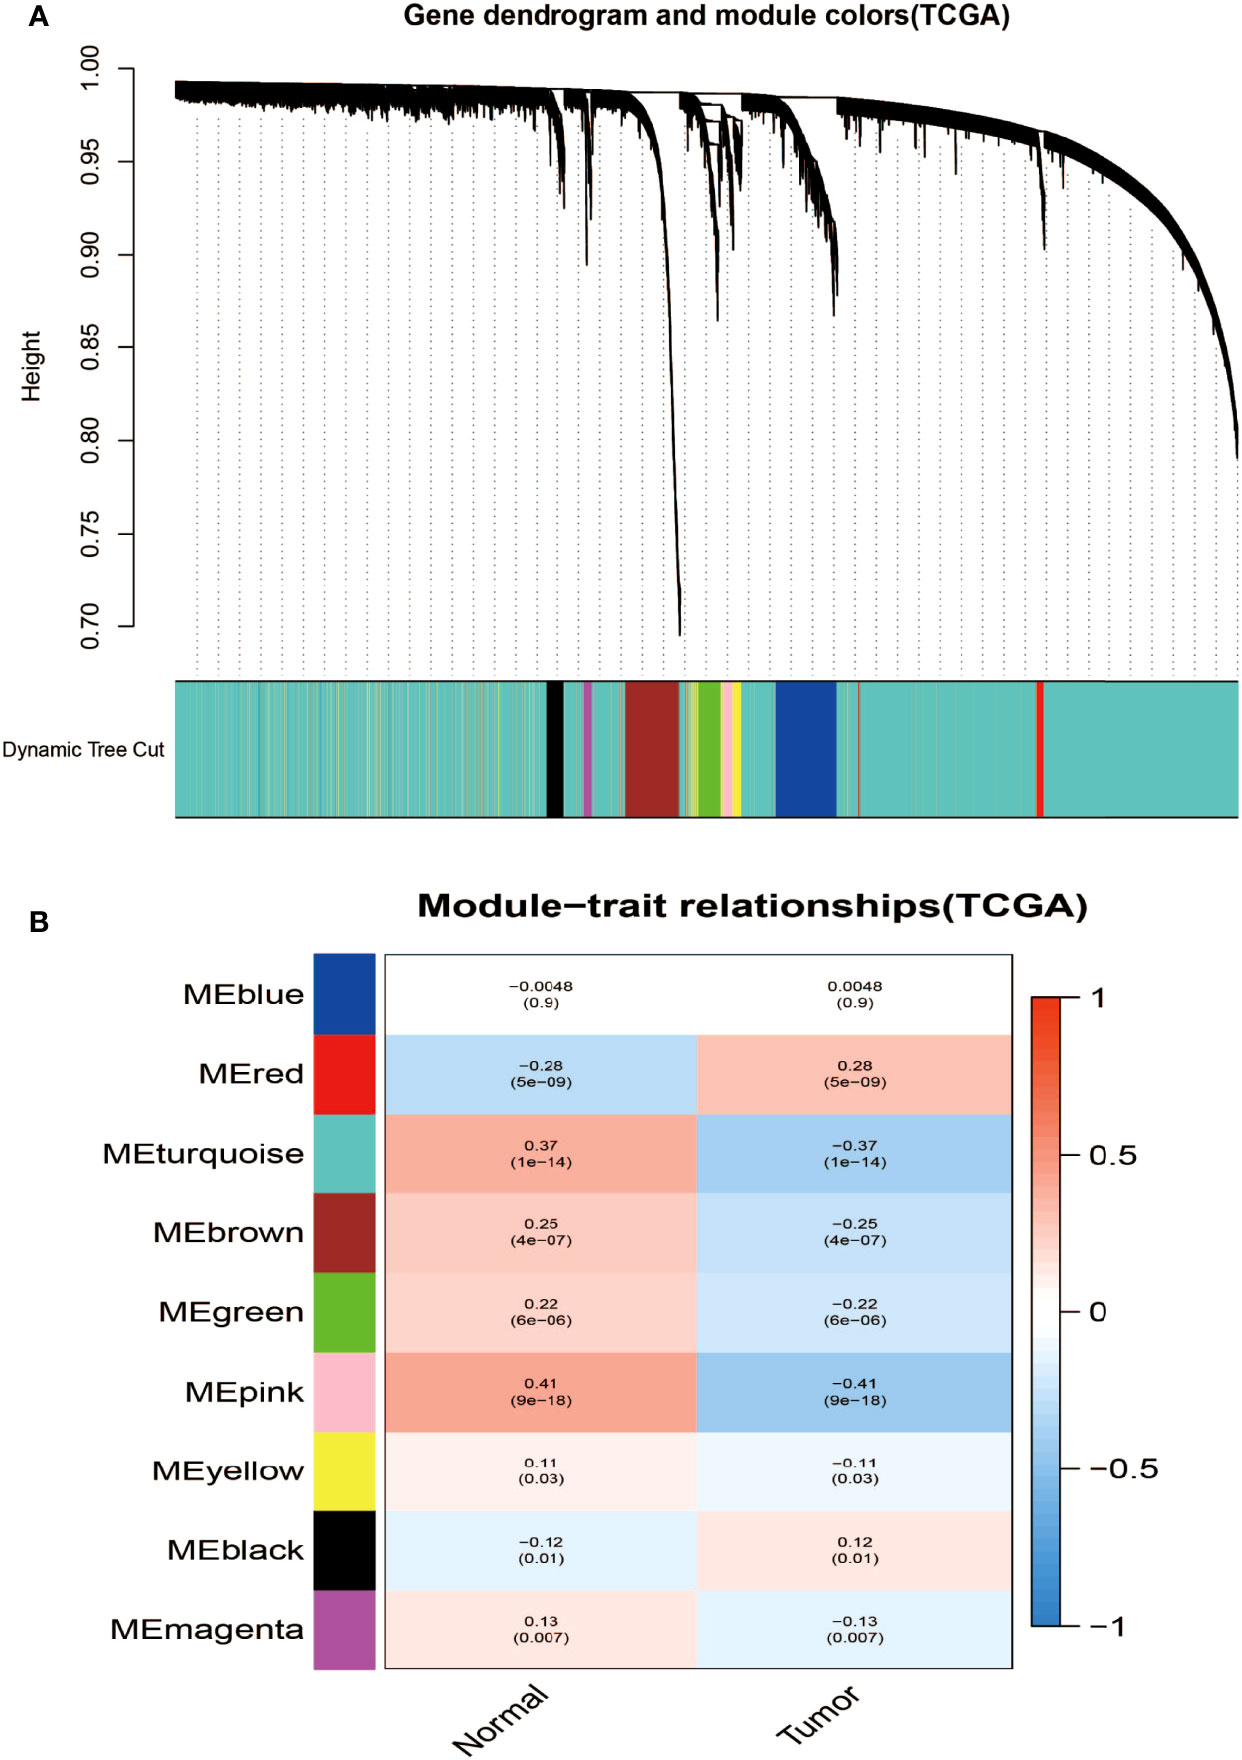
Figure 2 Identification of modules associated with the clinical information in the TCGA-STAD dataset. (A) The cluster dendrogram of co-expression network modules was ordered by a hierarchical clustering of genes based on the 1-TOM matrix. Each module was assigned different colors. (B) Module–trait relationships. Each row corresponds to a color module and each column corresponds to a clinical trait (cancer and normal). Each cell contains the corresponding correlation and P-value.
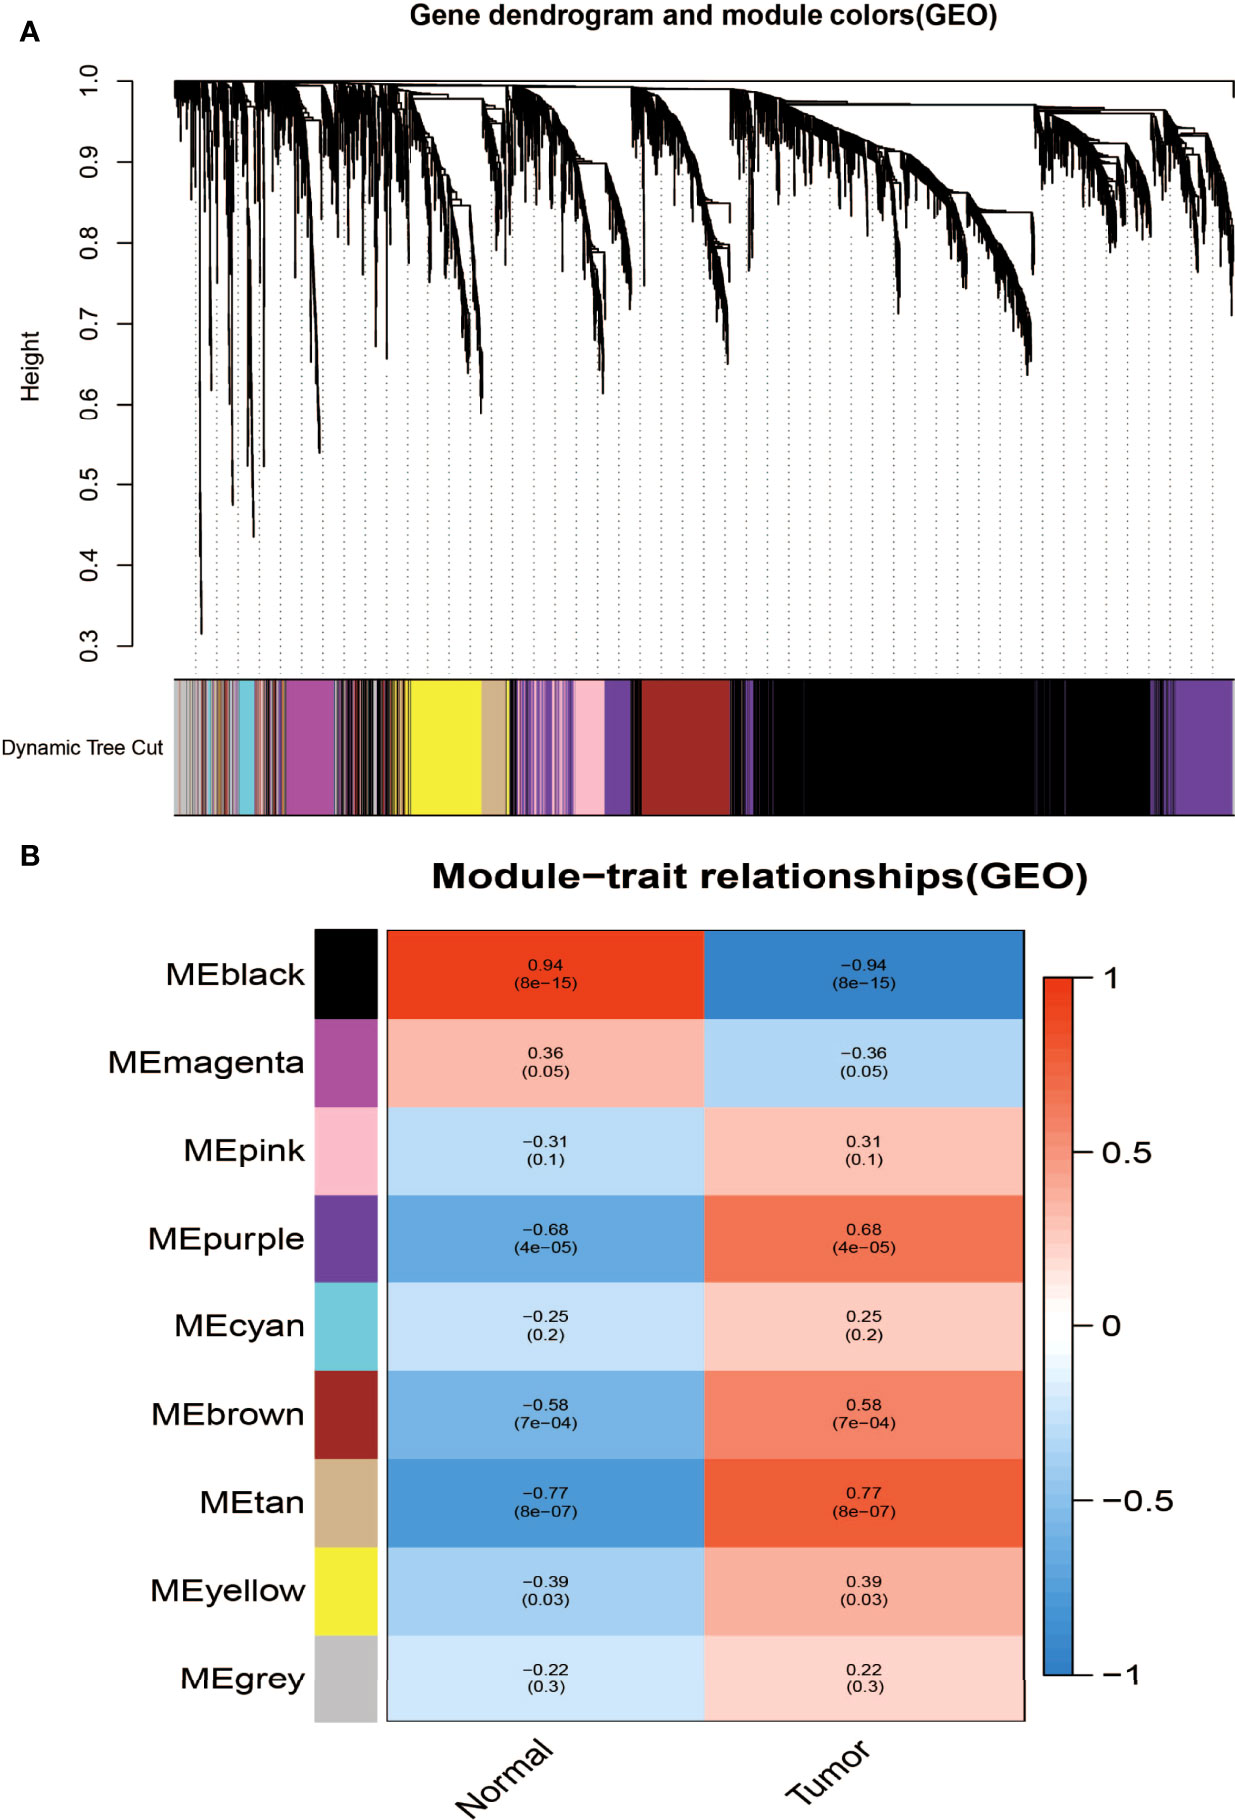
Figure 3 Identification of modules associated with clinical information in the GSE118916 dataset. (A) The cluster dendrogram of co-expression network modules was ordered by a hierarchical clustering of genes based on the 1-TOM matrix. Each module was assigned different colors. (B) Module–trait relationships. Each row corresponds to a color module and each column correlates to a clinical trait (cancer and normal). Each cell contains the corresponding correlation and P-value.
The final outcomes of the model–character relationship are shown in Figures 2B, 3B, indicating that the pink module in TCGA-STAD and the black module in GSE118916 have the strongest correlation with normal tissues (pink module: r = 0.41, P = 9E−18; black module: R = 0.94, P = 8E−15).
Identification of Genes Between the DEG Lists and Co-Expression Modules
According to |log FC| ≥1.0 and adj. truncation standard P <0.05, the limma software package found that there were 582 DEGs in the TCGA dataset (Figures 4A, B, red represents upregulated genes, and green represents downregulated genes) and 1,144 DEGs in the GSE118916 dataset (Figures 4C, D, red represents upregulated genes, green represents downregulated genes) in the tumor tissue expression disorder. As shown in Figure 4E, 230 and 1,787 co-expressed genes were found in the pink module of the TCGA dataset and in the black module of GSE118916, respectively. After crossing the four module genes (the TCGA differential gene, the GEO differential gene, the TCGA pink modular gene, and the GEO black modular gene), a total of 42 overlapping genes were extracted to verify the genes of co-expression modules (Figure 4E).
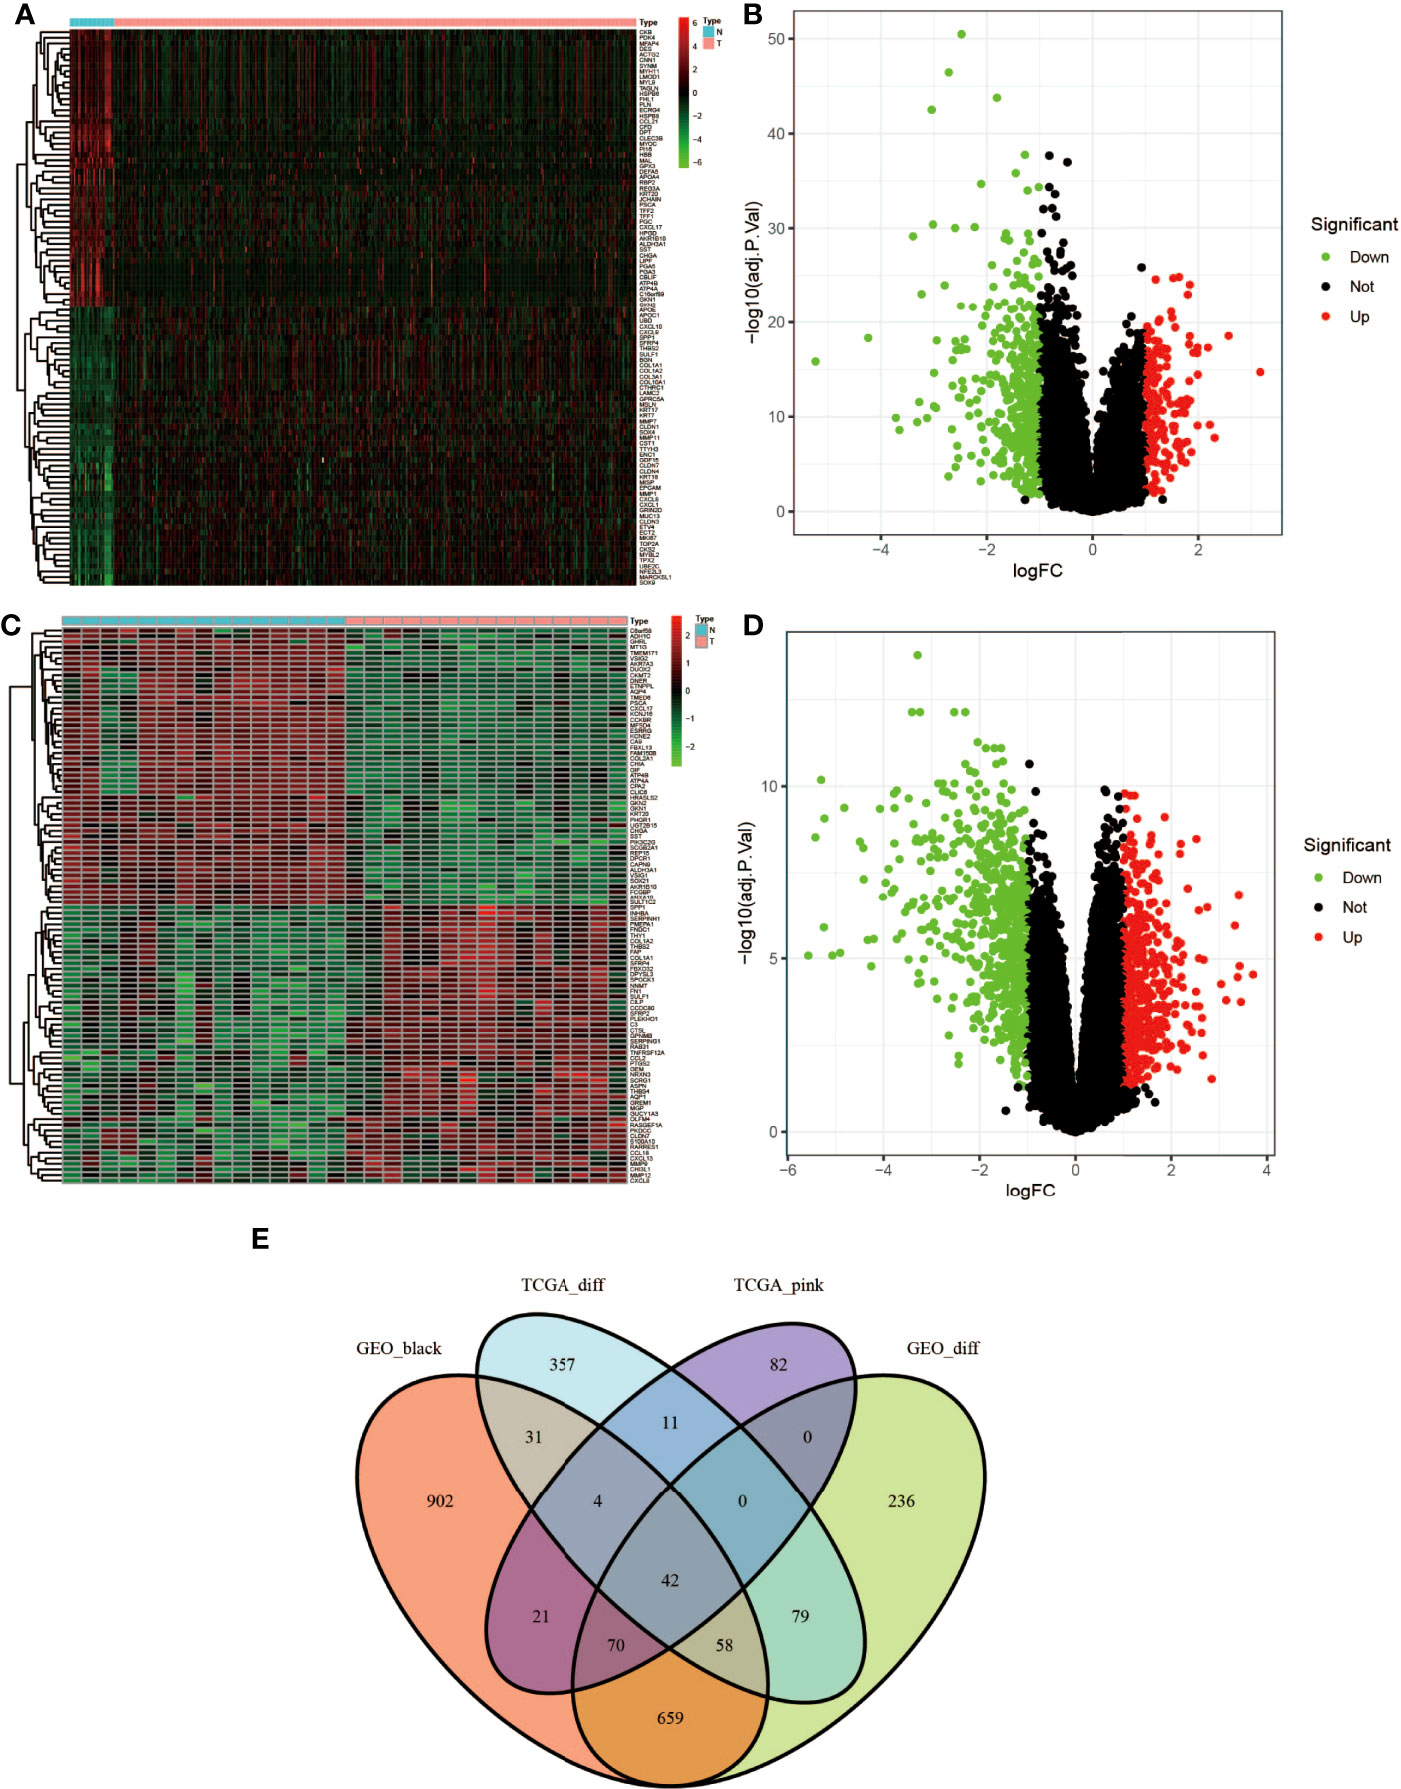
Figure 4 Identification of differentially expressed genes (DEGs) of the TCGA and GSE118916 datasets of STAD with the cutoff criteria of |logFC| ≥1.0 and adj. P <0.05. (A, B) Volcano plot of DEGs in the TCGA dataset. (C, D) Volcano plot of DEGs in the GSE118916 dataset. (E) The Venn diagram of genes among DEGs and co-expression module. In total, there were 42 overlapping genes in the intersection of DEGs and two co-expression modules.
Functional Enrichment Analyses for the 42 Genes
GO which covers three aspects of biology is widely used in the field of bioinformatics. clusterProfiler (v:3.14.3), org.Hs.eg.db (v:3.10.0), and enrichplot (v:1.6.1) in the R language were used to pair 42 of the final PPI subnets. Co-expressed genes were enriched, P-value <0.05 was selected as the screening criterion, and the first 20 genes were selected to draw the bubble chart of GO enrichment analysis (Figure 5A) and KEGG signal pathway analysis (Figure 5B) by the R language ggplot2 (v:3.2.1) package. In GO enrichment analysis, the biological process mainly involves digestion, the digestive system process, tissue homeostasis, hormone metabolism, and maintenance of gastrointestinal epithelium enrichment. The analysis of cell components showed that these genes were mainly engaged in the basolateral plasma membrane, transmembrane transporter complex, transporter complex, sodium:potassium-exchanging ATPase, ATPase-dependent transmembrane transport complex, etc. In addition, the molecular function analysis showed that these 42 genes were related to oxidoreductase activity, alcohol dehydrogenase (NADP+) activity, aldehyde ketone reductase (NADP) activity, sodium–potassium exchange ATPase activity, etc. KEGG signaling pathway analysis mainly involves gastric acid secretion, chemical carcinogenesis, collecting duct acid secretion, glycolysis/gluconeogenesis, fructose and mannose metabolism, tyrosine metabolism, and other signal pathways.

Figure 5 Enrichment analysis for the genes. (A) The bubble chart of GO enrichment analysis. (B) KEGG signal pathway analysis. The color represents the adjusted P-values (BH), and the size of the spots represents the gene number.
PPI Network Construction and Hub Gene Identification of Co-Expressed Genes
We used the “BioGENET” (V:3.0.0) plug-in in Cytoscape (V:3.7.2) to construct a protein interaction network commonly used by the target genes (Figure 6A). The “Cytonca” (V:2.7.6) plug-in in Cytoscape (V:3.7.2) was used to analyze the PPI network topology and identify core genes in the network. The screening criteria is degree centrality (DC) >20 to get a new PPI network (Figure 6B), and then the betweenness centrality (BC) >60 was used to be the final PPI subnetwork (Figure 6C), which includes 7 nodes, 11 side, and 7 core genes. The seven hub genes are from high to low sorting as shown in Table 1, according to BC.
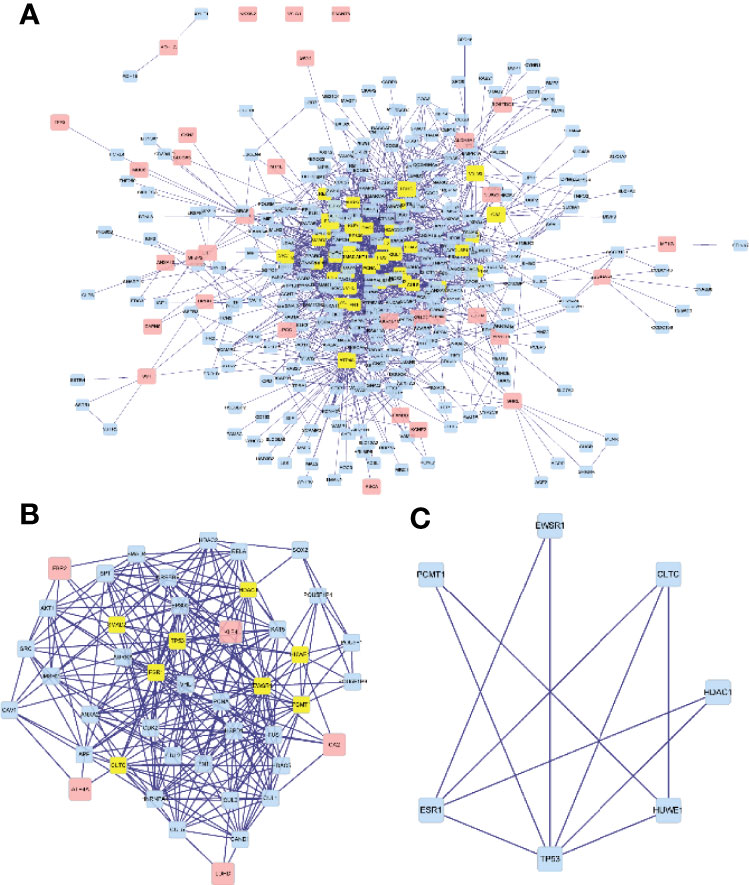
Figure 6 Visualization of the protein–protein interaction (PPI) network and the candidate hub genes. (A) A protein interaction network. (B) Identification of the hub genes from the PPI network in which the screening criterion is degree (DC) >20. (C) The final PPI subnetwork was screened according to BC >60.
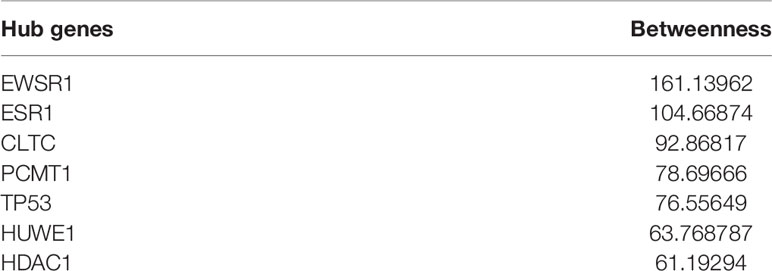
Table 1 Betweenness (BC) from high to low ranking of the seven hub genes.
Hub Gene Expression Pattern, Correlation, Prognostic Value, and Verification of Protein Expression
We checked the transformation level of the hub gene in diverse methods. As shown in Figure 7, the GEPIA2 database was used for analyzing the discrepant expression of seven hub genes in the normal group and the tumor group. In comparison with normal tissues, all hub genes were upregulated in stomach adenocarcinoma. For the follow-up exploration of the relationship between the seven hub genes and tumor stages, a block diagram was further drawn. TP53 was expressed differently in stage 2 and stage 4 tumors, EWSR1 was expressed differently in stage 2 and stage 3 tumors, and ESR1 was expressed in stage 1 tumors. There were differences in the expression between the second and third phases (Figure 8).
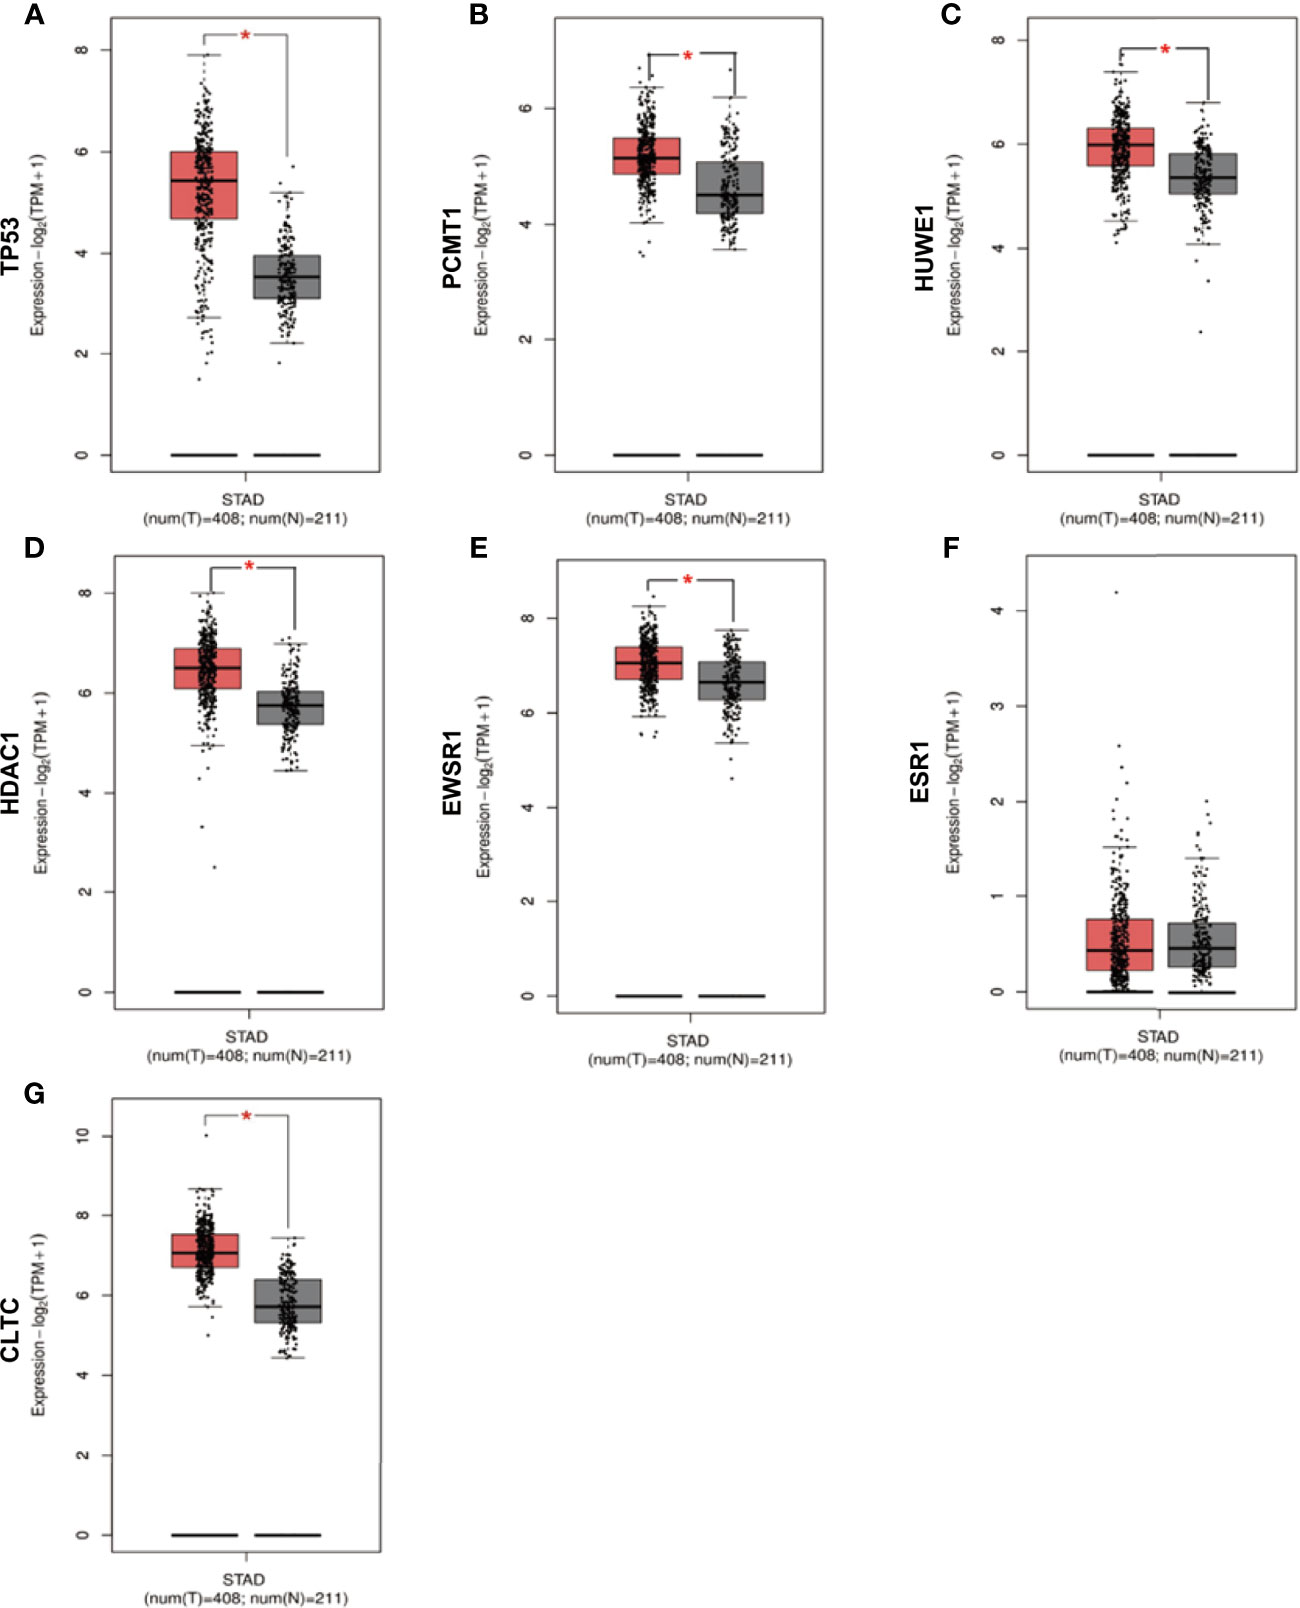
Figure 7 Verification of the expression level of 7 hub genes in STAD and normal tissues from GEPIA2 database. (A) Gene expression valueTP53 among samples of TCGA. (B) Gene expression value PCMT1 among samples of TCGA. (C) Gene expression value HUWE1 among samples of TCGA. (D) Gene expression value HDAC1 among samples of TCGA. (E) Gene expression value EWSR1among samples of TCGA. (F) Gene expression value ESR1 among samples of TCGA. (G) Gene expression value CLTC among samples of TCGA. Data are expressed in mean ± SEM; *P < 0.05, normal group versus tumor group.
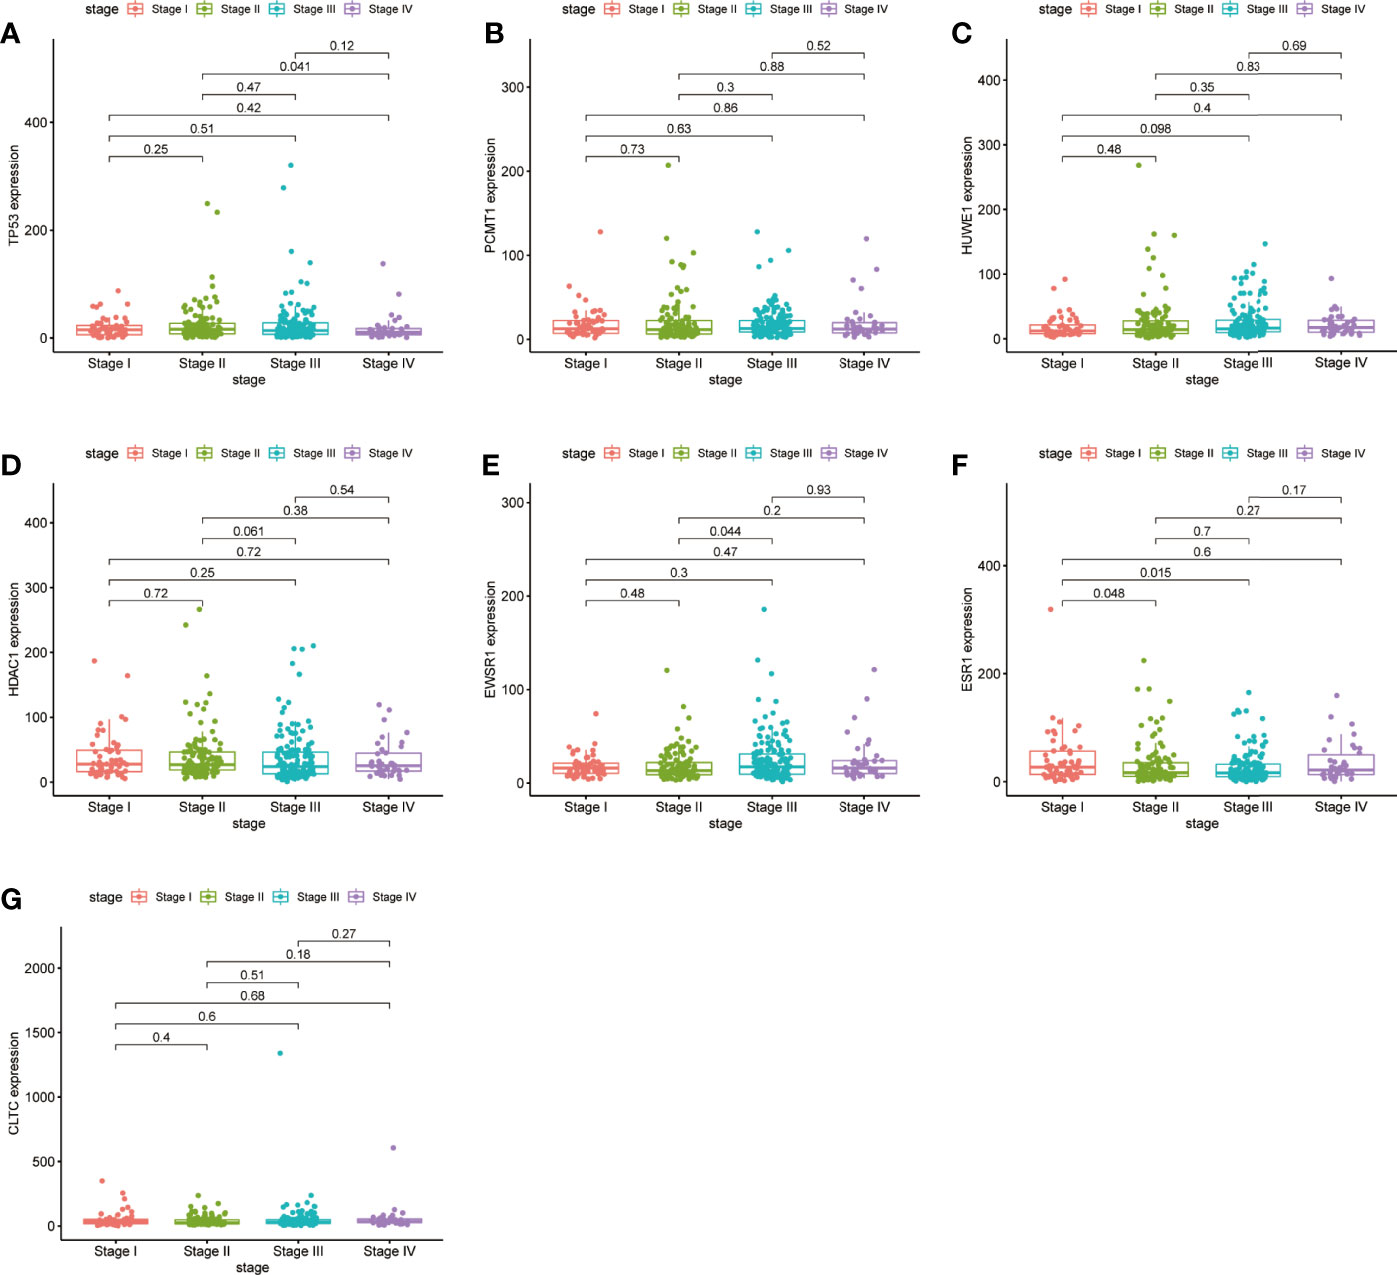
Figure 8 Validation of the expression levels of the seven hub genes of TCGA tissues from the TCGA database. (A) Gene expression value of TP53 among samples of TCGA. (B) Gene expression value of PCMT1 among samples of TCGA. (C) Gene expression value of HUWE1 among samples of TCGA. (D) Gene expression value of HDAC1 among samples of TCGA. (E) Gene expression value of EWSR1 among samples of TCGA. (F) Gene expression value of ESR1 among samples of TCGA. (G) Gene expression value of CLTC among samples of TCGA. P < 0.05 was considered to be a statistically significant difference.
Moreover, we performed OS and DFS analysis on the seven hub genes using the R survival package and Kaplan–Meier plotter and the GEPIA2 database to study the clinical prognostic value of the hub genes in STAD patients. Among the seven hub genes, the Kaplan–Meier analysis of TCGA data showed that the expression levels of HDAC1 and CLTC were drastically relative to the OS in stomach adenocarcinoma patients (P < 0.05) (Figure 9). GEPIA2 analysis showed that the expression of ESR1 was correlated with the OS of stomach adenocarcinoma (Figure 10). It was closely correlated with DFS (P < 0.05) (Figure 11).
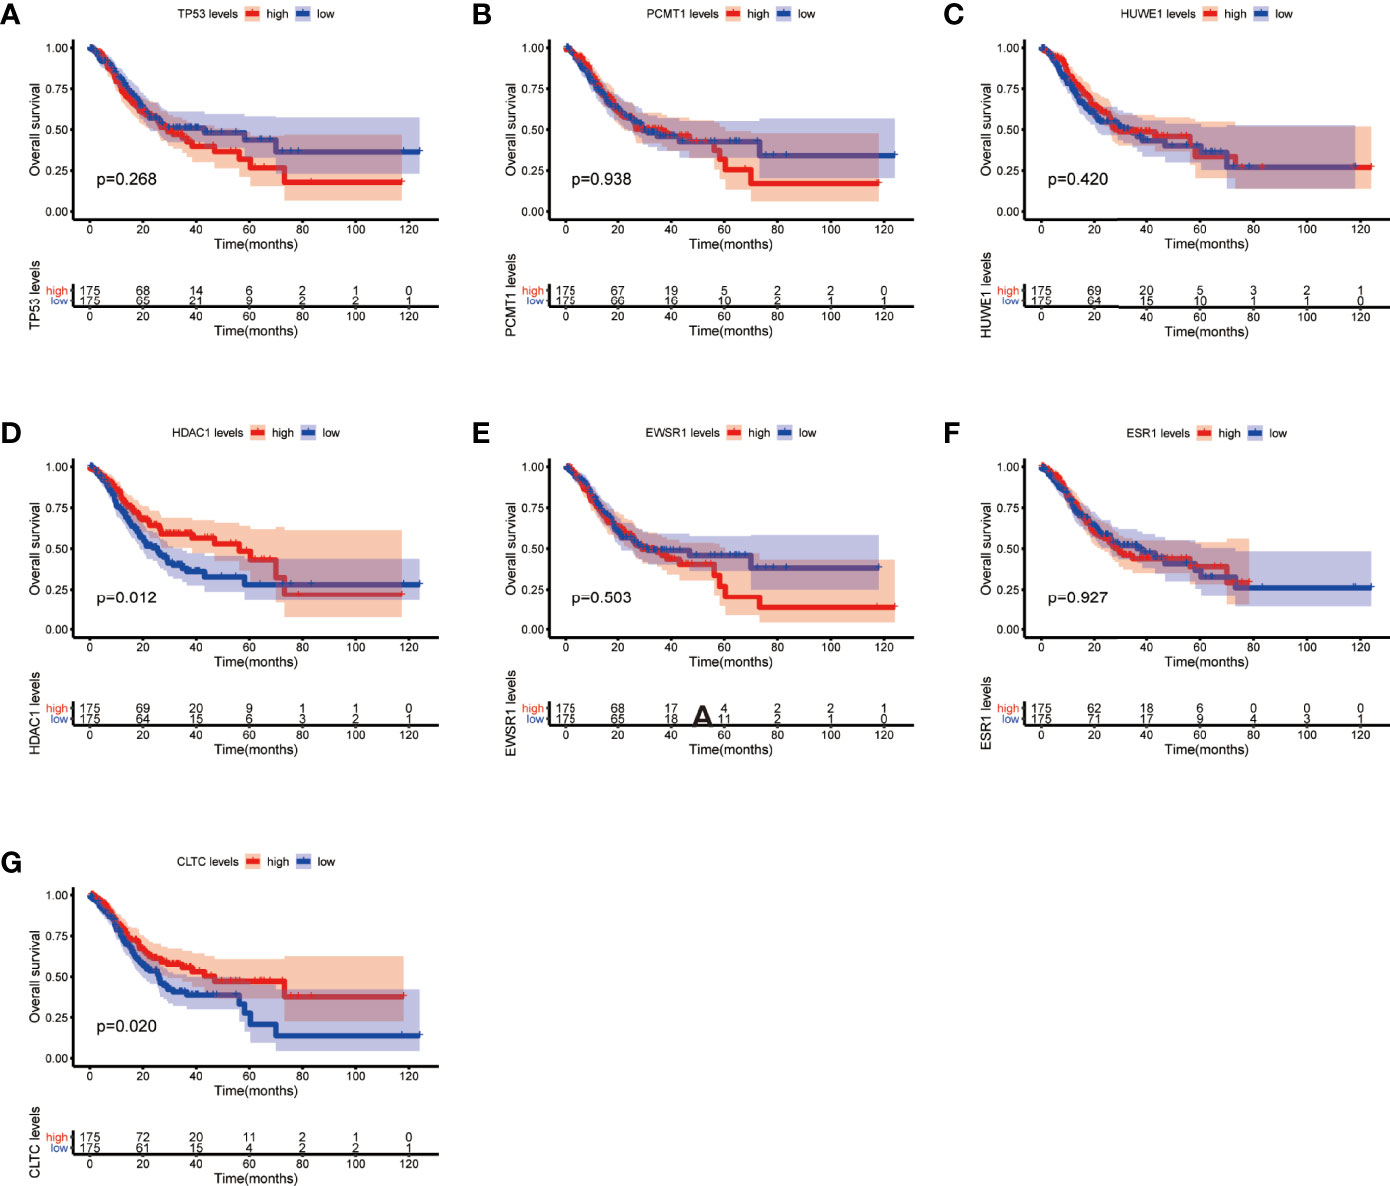
Figure 9 Overall survival (OS) analysis of the seven hub genes in STAD patients from the TCGA database. (A) Survival analysis for TP53 in STAD. (B) Survival analysis for PCMT1 in STAD. (C) Survival analysis for HUWE1 in STAD. (D) Survival analysis for HDAC1 in STAD. (E) Survival analysis for EWSR1 in STAD. (F) Survival analysis for ESR1 in STAD. (G) Survival analysis for CLTC in STAD. The patients were stratified into a high-level group (red) and a low-level group (blue) according to the median expression of the gene. Log-rank P < 0.05 was considered to be a statistically significant difference.
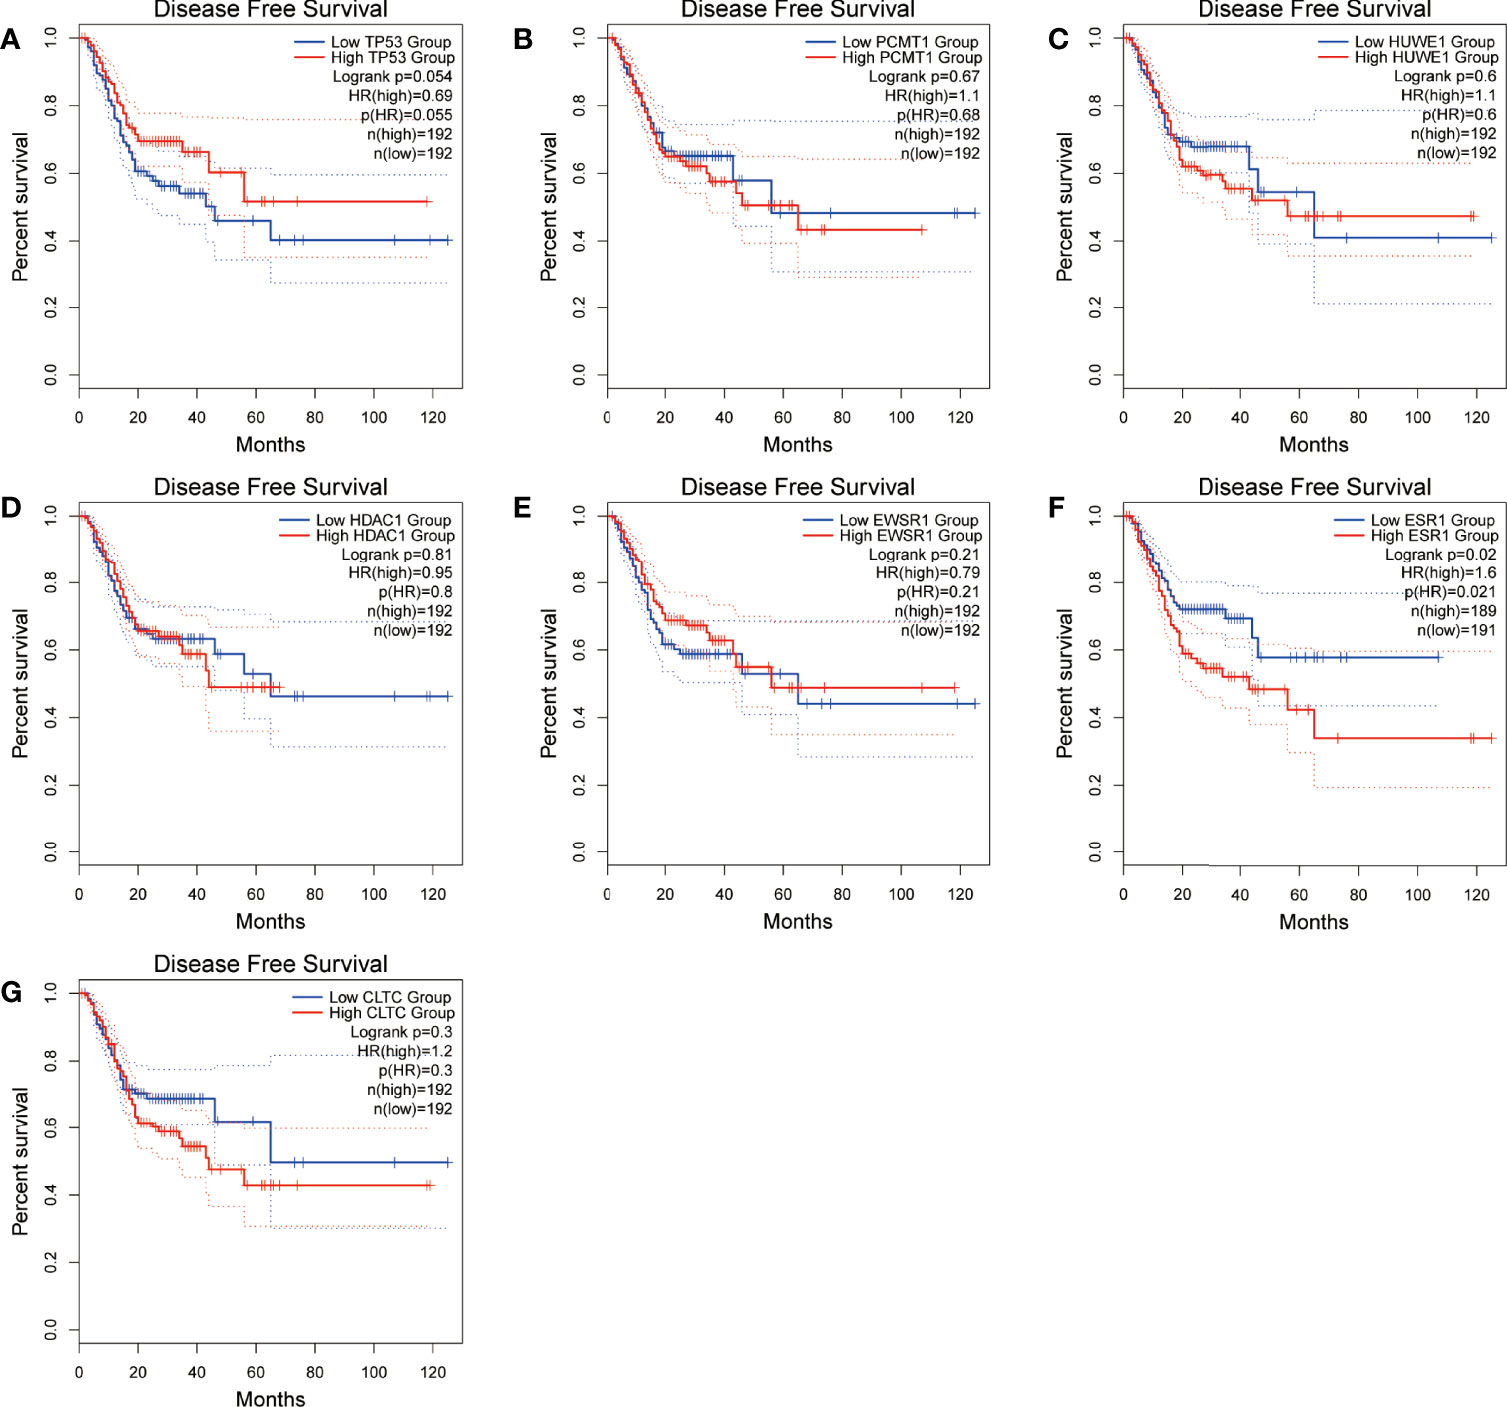
Figure 10 Disease-free survival (DFS) analysis of the seven hub genes in STAD patients from the GEPIA2 database. (A) Survival analysis for TP53 in STAD. (B) Survival analysis for PCMT1 in STAD. (C) Survival analysis for HUWE1 in STAD. (D) Survival analysis for HDAC1 in STAD. (E) Survival analysis for EWS1 in STAD. (F) Survival analysis for ESR1 in STAD. (G) Survival analysis for CLTC in STAD. The patients were stratified into a high-level group (red) and a low-level group (blue) according to the median expression of the gene. Log-rank P < 0.05 was considered to be a statistically significant difference.
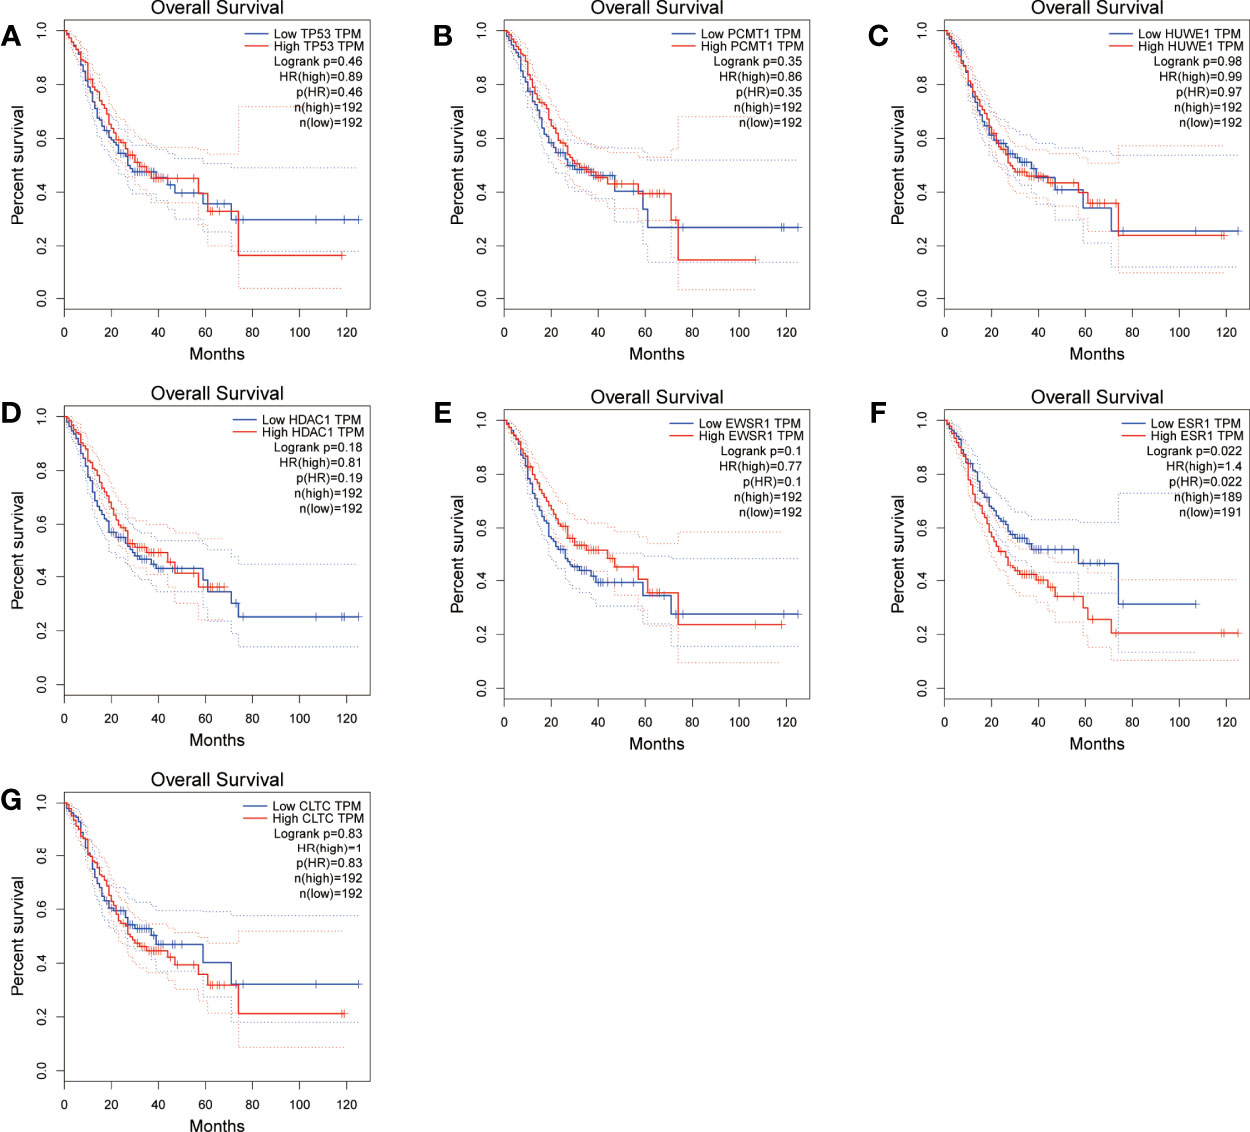
Figure 11 Overall survival (OS) analysis of the seven hub genes in STAD patients from the GEPIA2 database. (A) Survival analysis for TP53 in STAD. (B) Survival analysis for PCMT1 in STAD. (C) Survival analysis for HUWE1 in STAD. (D) Survival analysis for HDAC1 in STAD. (E) Survival analysis for EWSR1 in STAD. (F) Survival analysis for ESR1 in STAD. (G) Survival analysis for CLTC in STAD. The patients were stratified into a high-level group (red) and a low-level group (blue) according to the median expression of the gene. Log-rank P < 0.05 was considered to be a statistically significant difference.
Finally, to validate the expression correlation between the seven hub genes in STAD, the database was used and analyzed via the R2: Genomics Analysis and Visualization Platform (http://r2.amc.nl). As shown in Figure 12, ESR1 expression was positively associated with TP53 expression in STAD (R = 0.429, P = 8.10e−03). In addition, gene pairs that were related to each other also include PCMT1 and HUWE1, CLTC and HUWE1, EWSR1 and HUWE1, ESWR1 and PCMT1, and EWSR1 and CLTC, which were all positively correlated.
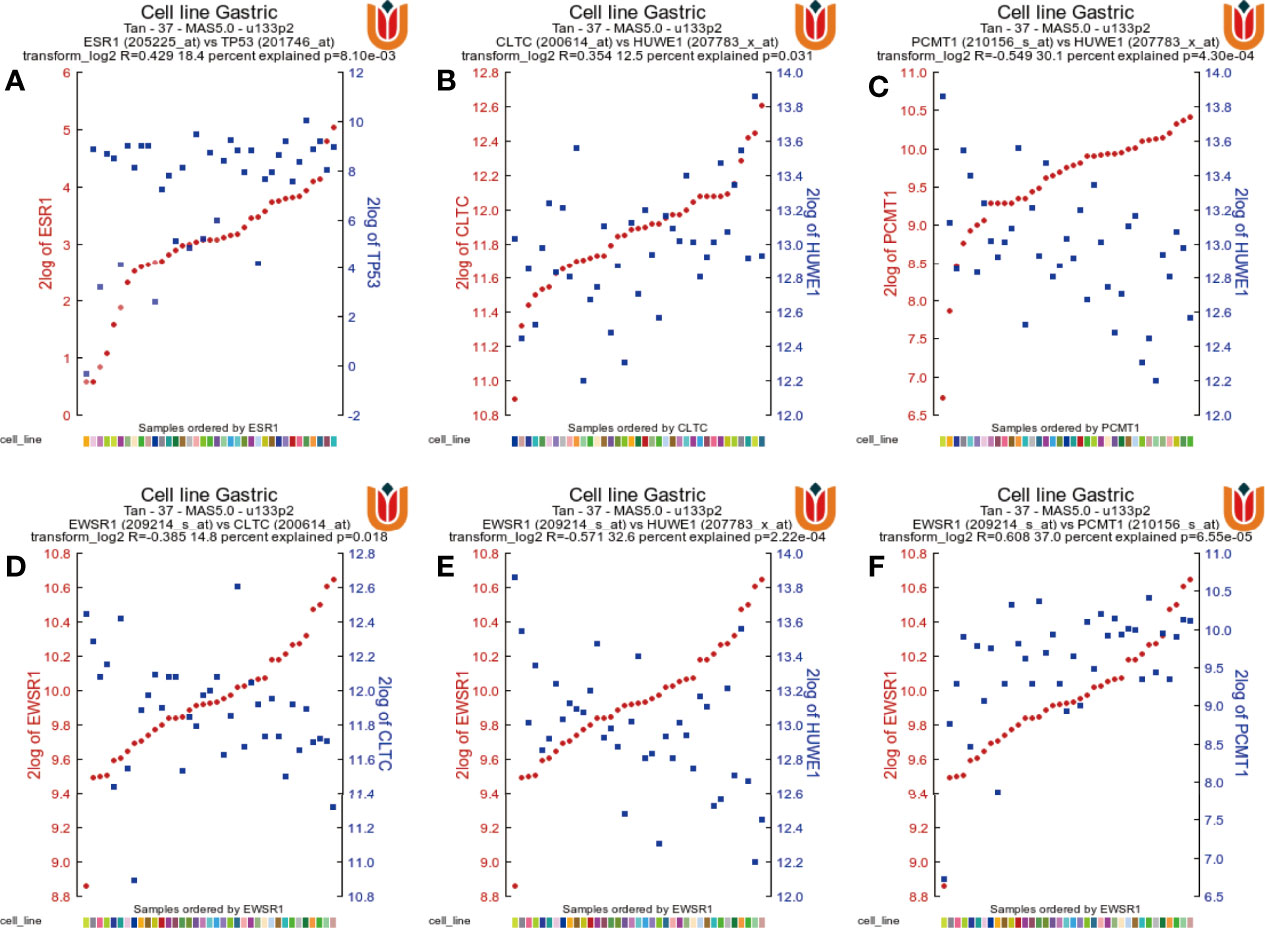
Figure 12 The gene correlations were revealed by the R2 Platform. (A) Correlation between the ESR1 gene and the TP53 gene (R = 0.429, P = 8.10e−03). (B) Correlation between CLTC and HUWE1 (R = 0.354, P = 0.031). (C) Correlation between PCMT1 and HUWE1 (R = 0.549, P = 4.30e−04). (D) Correlation between EWSR1 and CLTC (R = 0.385, P = 0.018). (E) Correlation between EWSR1 and HUWE1 (R = 0.571, P = 2.22e−04). (F) Correlation between EWSR1 and PCMTA (R = 0.608, P = 6.55e−05).
Furthermore, to verify the outcomes of the bioinformatics analysis, we conducted RT-PCR and immunohistochemical staining on gastric adenocarcinoma tissues and normal tissues collected from the hospital. The outcomes showed that the expression level of the hub gene in tumor tissues was highly improved. This was consistent with the related protein expression levels as indicated by the immunohistochemical results (Figures 13, 14).
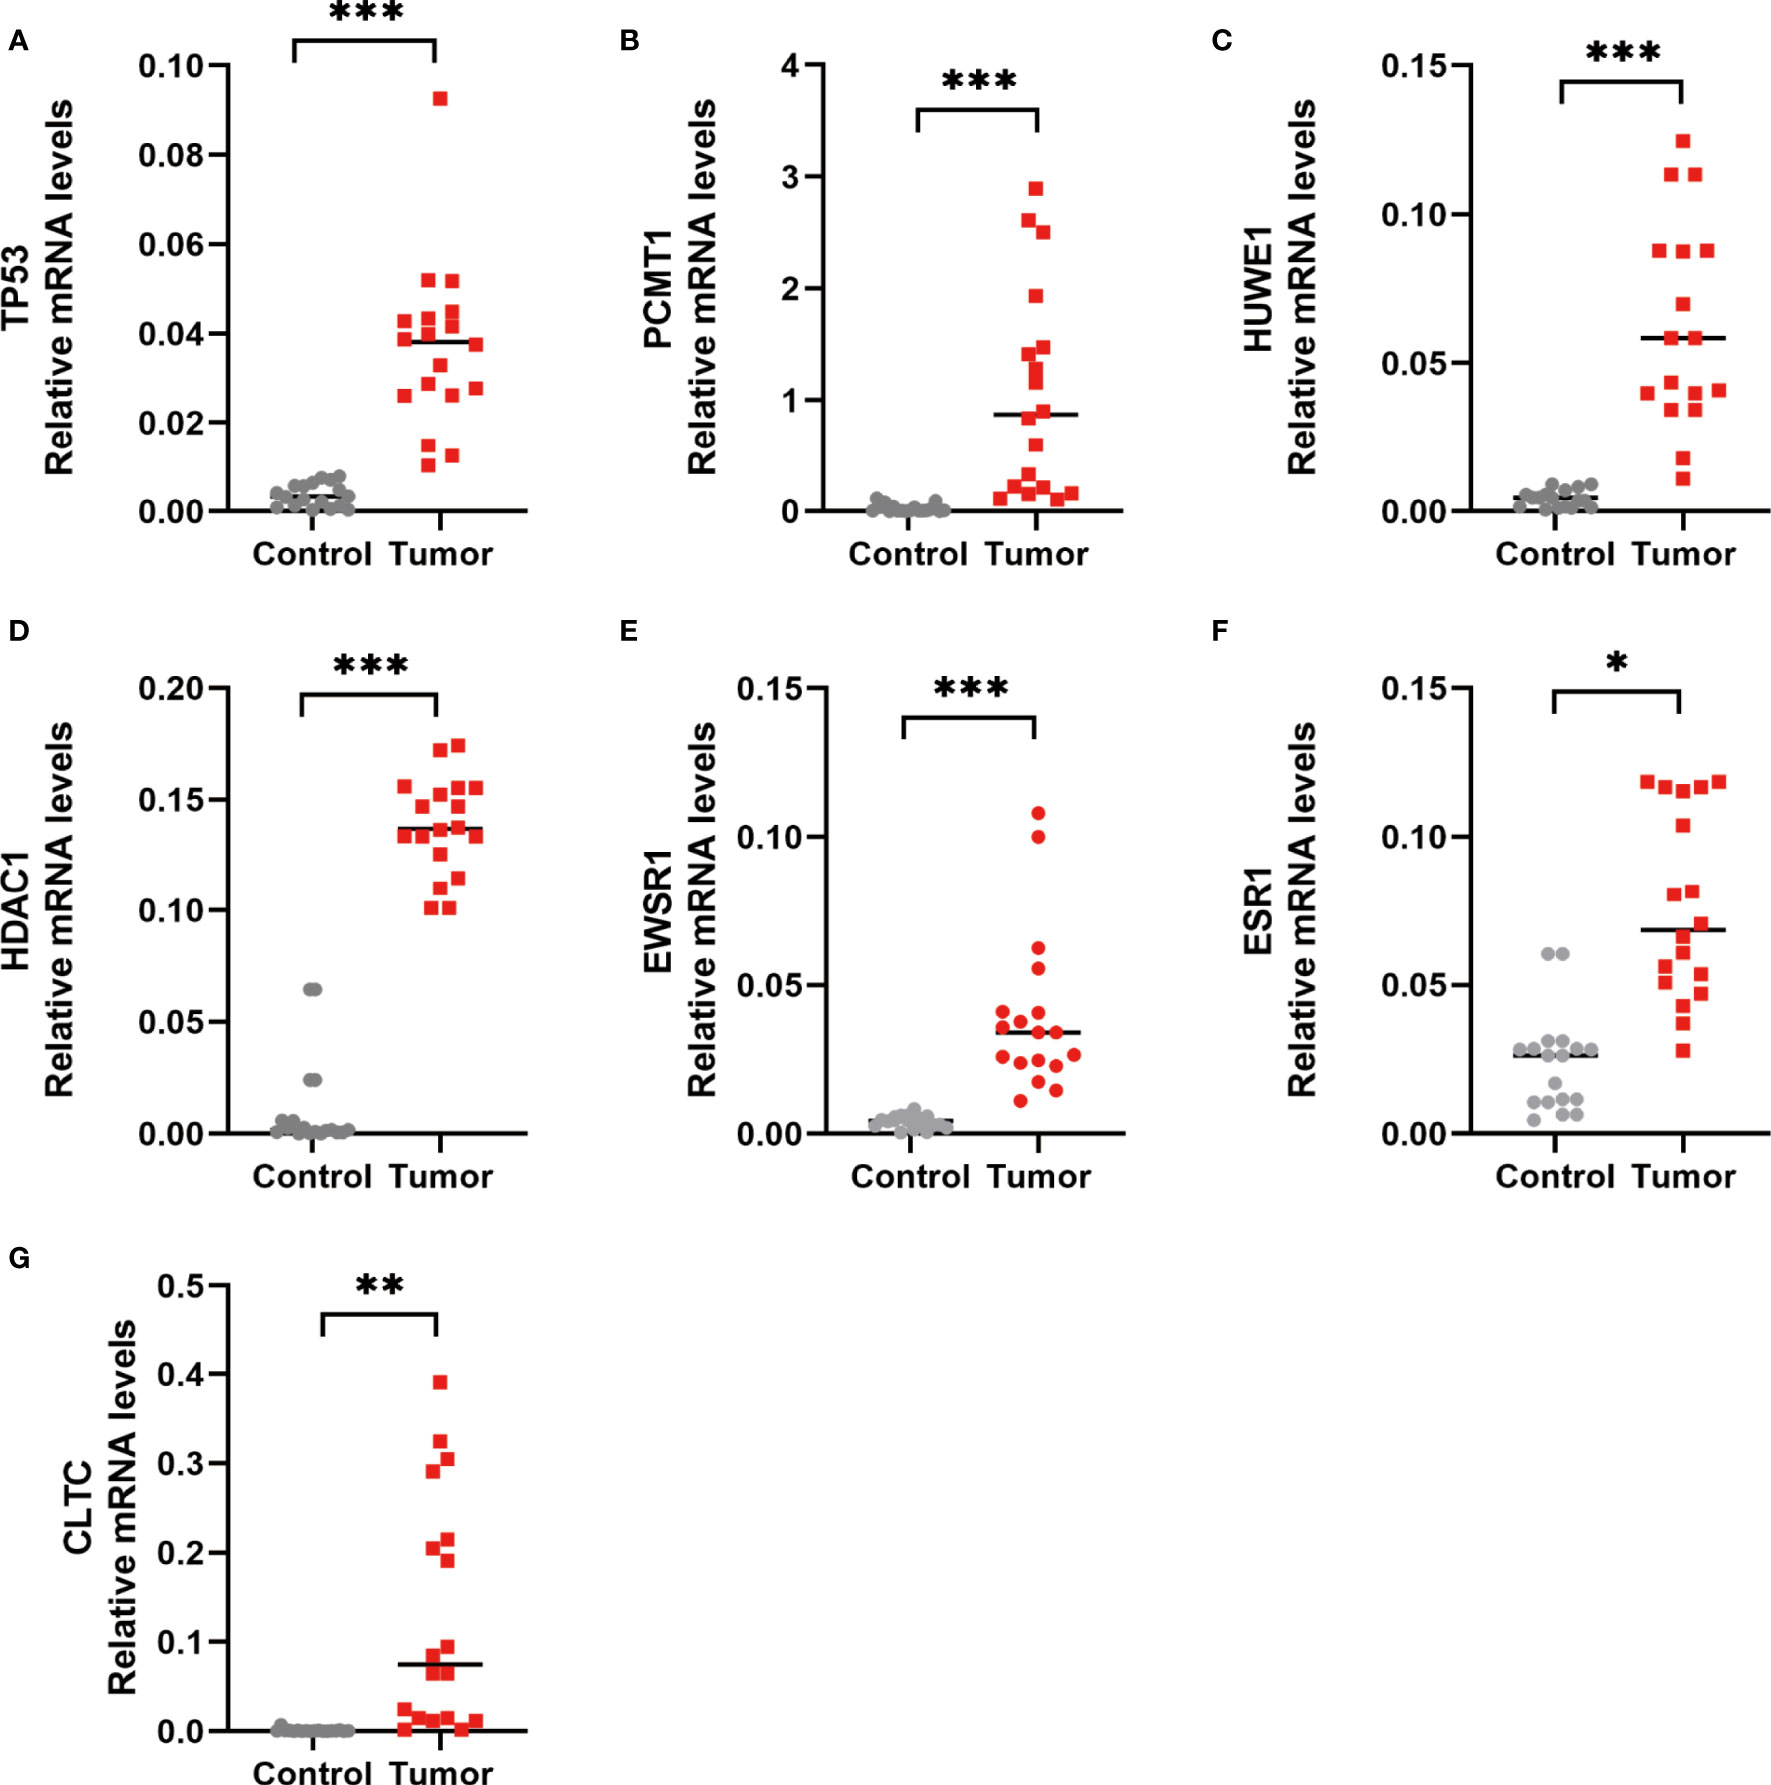
Figure 13 RT-PCR detection of the hub gene in normal and gastric adenocarcinoma tissues. (A) TP53 expression level. (B) PCMT1 expression level. (C) HUWE1 expression level. (D) HDAC1 expression level. (E) EWSR1 expression level. (F) ESR1 expression level. (G) CLTC expression level. *P < 0.05, **P < 0.01, and ***P < 0.001, control versus tumor, were considered to be statistically significant differences.
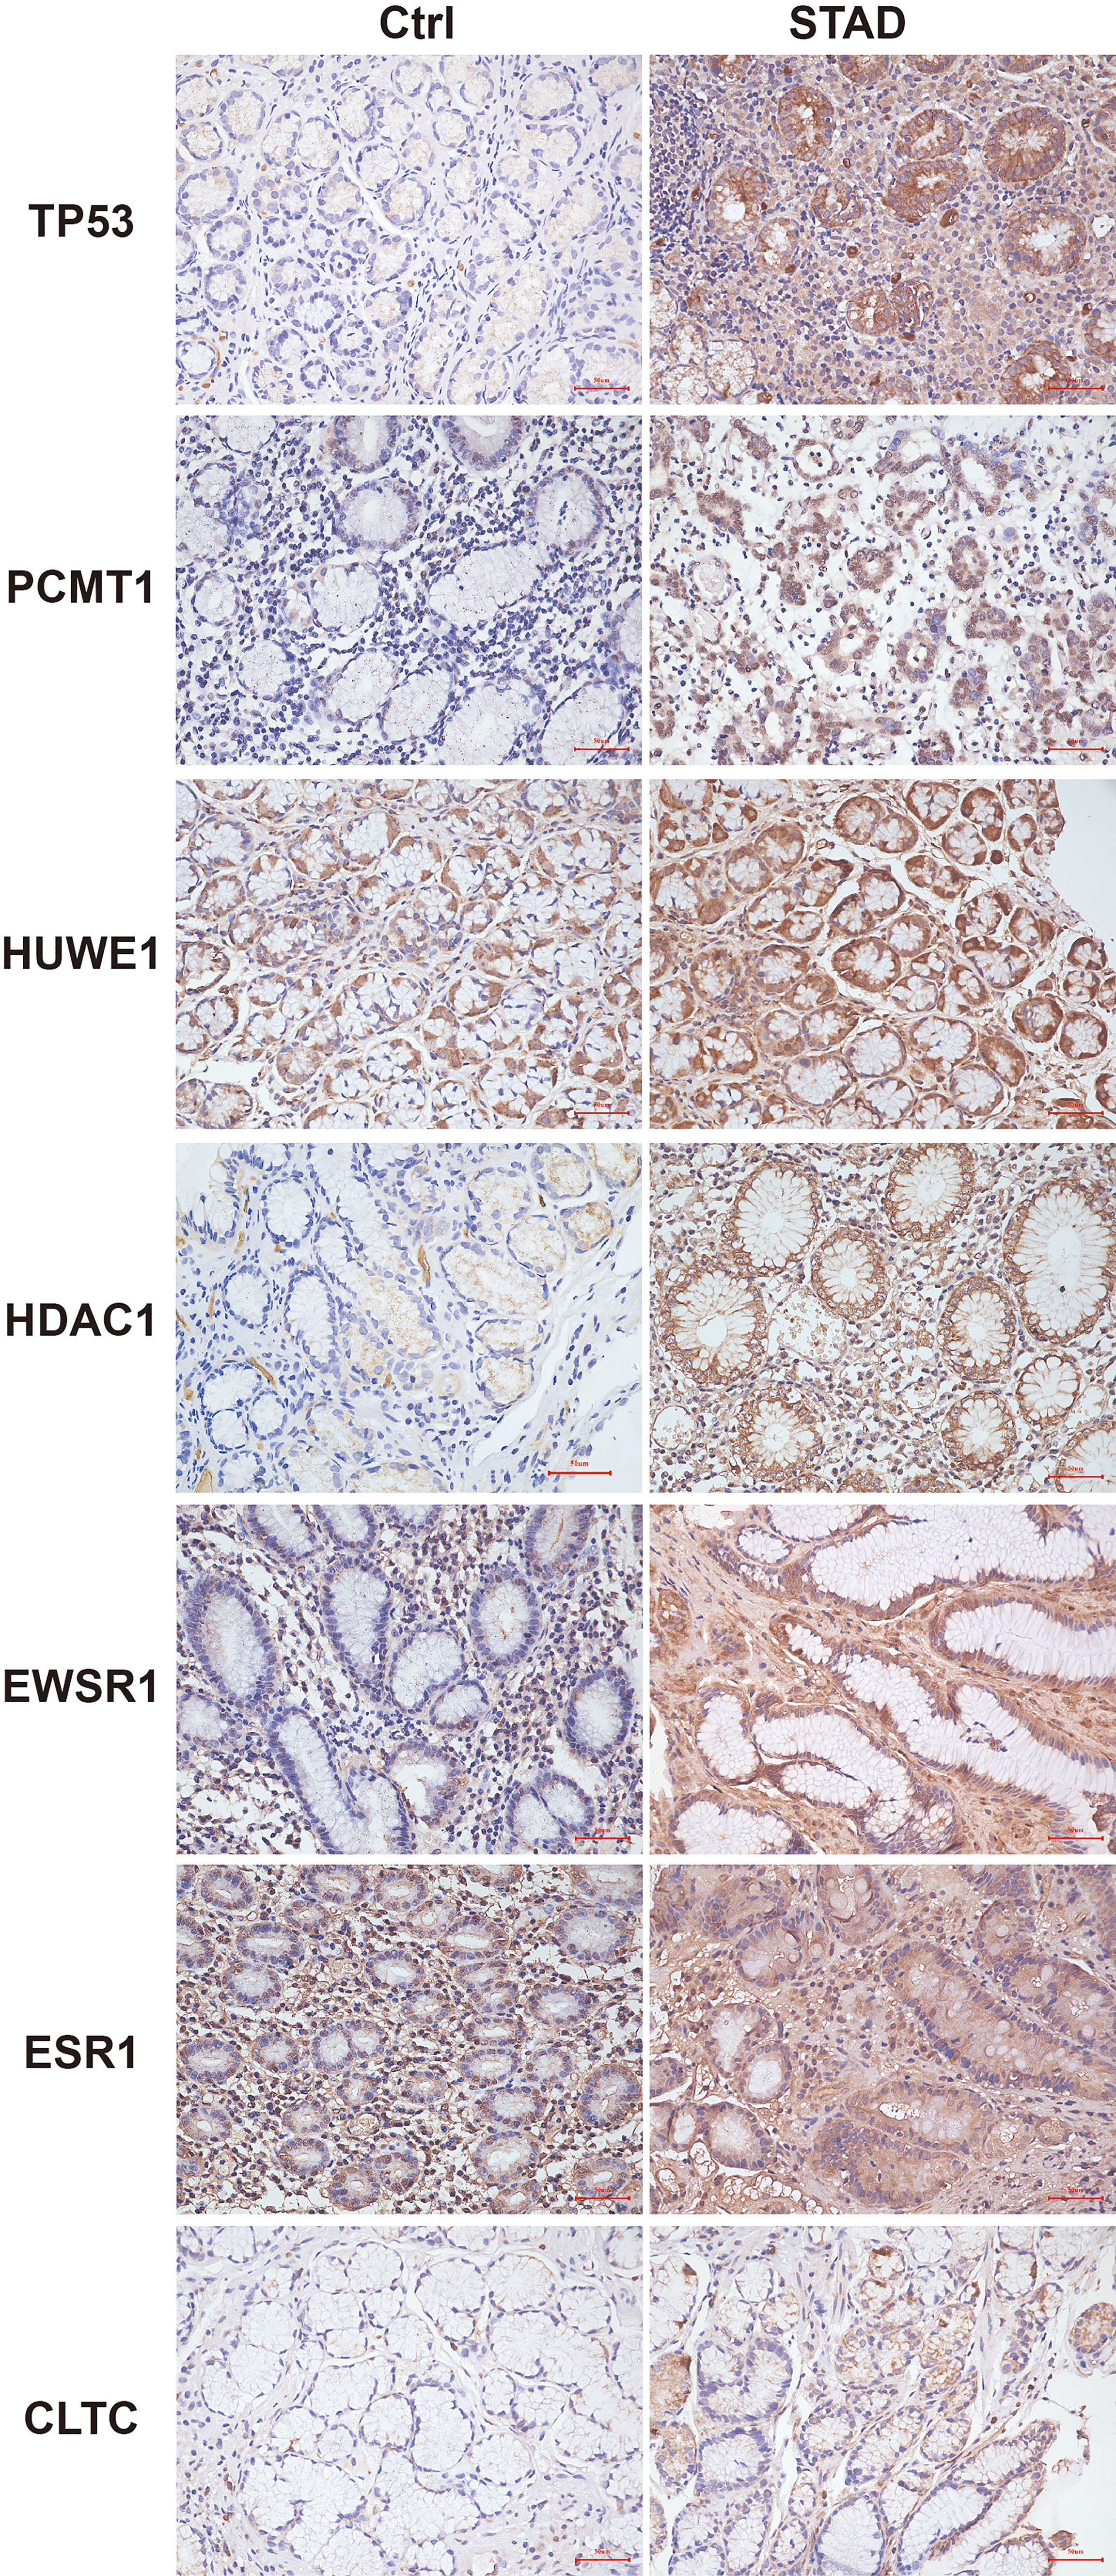
Figure 14 Immunohistochemistry of the seven hub genes in STAD and normal tissues. Brown indicates the intensity of the expressed protein.
Discussion
Although there are various treatments for STAD, such as surgical resection, endoscopic resection, adjuvant chemotherapy, and immunotherapy (8), the prognosis of patients with advanced stomach adenocarcinoma is still very poor, and patients need to bear a lot of treatment costs. In recent years, target gene therapy has become a new treatment method, and some experiments have verified its effectiveness (9, 10), but the molecular mechanism of the pathophysiology of stomach adenocarcinoma is still unclear. Therefore, it is necessary to explore the susceptibility modules and genes of stomach adenocarcinoma and to further search for new biomarkers to predict the prognosis of stomach adenocarcinoma.
In this study, 42 core genes with the same expression trend were screened in the TCGA and GEO databases by integrating bioinformatics analysis. Analysis of the functional annotations of the clusterProfiler package shows that the results indicate a major focus on digestive processes, tissue homeostasis, hormone metabolic process, and maintenance of gastrointestinal epithelium enrichment. In the analysis of the signal pathway, it mainly involves stomach acid secretion, chemical carcinogenesis, collecting duct acid secretion, and other signal pathways. In addition, we established a PPI network and identified seven hub genes associated with STAD through Cytoscape’s cytoHubba plug-in. Compared with normal tissues, hub genes were upregulated in stomach adenocarcinoma (P < 0.05). Similarly, in our verification experiment, the expression of the hub genes showed the same trend. In addition, we found that the expression of ESR1, HDAC1, and CLTC genes in patients with stomach adenocarcinoma may be related to poor prognosis and lower overall survival.
EWSR1 is a polyfunctional protein that regulates cell function and aging by a variety of pathways, and is associated with the occurrence of mesenchymal tumors, multiple myeloma, Ewing’s sarcoma, and other tumors (11–13). PCMT1 is an unfavorable prognostic biomarker that participates in cell migration and invasion by regulating EMT-related genes (14). In our study, EWSR1 was shown to be differentially expressed in stages II and III of gastric cancer. There are no studies on EWSR1 and PCMT1 to confirm that they are related to the occurrence or prognosis of stomach adenocarcinoma, which can be used as points for further research.
HUWE1 encodes a protein containing a C-terminal HECT domain that acts as an E3 ubiquitin ligase. The protein was required for the ubiquitination and subsequent degradation of the anti-apoptotic protein Mcl1. It also ubiquitinates the p53, core histones, and DNA polymerase β. The latest research reported that HUWE1 can promote the proliferation, migration, and invasion of stomach cancer cells by mediating the ubiquitination of TGFBR2 (15). By comparing the expression level of HUWE1 in clinical gastric cancer patients and normal individuals, we showed that the expression level of HUWE1 was increased in tumor tissues. HUWE1 may become a potential target for the treatment of stomach cancer.
p53 is one of the most important tumor suppressors, involved in the regulation of a variety of tumor-related pathways, such as cell cycle, apoptosis, DNA damage repair, metabolism, inflammation and immune response, angiogenesis, and metastasis (16). Its coding gene TP53 is the most common mutation gene in human cancer, while TP53 mutation is usually associated with a poor prognosis of cancer (17). Related studies have shown that TP53 mutations usually inhibit the body’s antitumor immunity and response to cancer immunotherapy (18–20). Conversely, studies have also reported that TP53 mutations can promote antitumor immune activity and responsiveness to immunotherapy (21–23). These contradictory findings suggest that the correlation between TP53 mutations and tumor immunity may be related to the type of cancer. Mutations in TP53 are common and one of the five most important mutations in gastric cancer (24, 25). TP53 has been proven to play an important role in the occurrence and development of gastric cancer (26, 27). Research confirmed that TP53 affects the innate immune system by regulating macrophage function (28). TP53 mutation also plays an important role in activating tumor immunity, which may promote the development of gastric cancer by affecting the immune characteristics of patients (18, 29). When TP53 is mutated, cells proliferate abnormally and transform into cancer cells, and gastric cancer patients with TP53 mutations have a worse prognosis than those without the mutation (30). TP53 can be used to predict the prognosis of gastric cancer. Monitoring the recurrence of gastric cancer by monitoring free DNA mutations can also be used to predict the efficacy of chemotherapy in advanced gastric cancer (31, 32). Our study showed that compared with normal tissues, the expression of the TP53 gene was upregulated in gastric adenocarcinoma, and there was a difference in stages II and IV. Our study showed that the expression of the TP53 gene was upregulated in gastric adenocarcinoma compared with normal tissues, especially the difference in the expression between tumor stages II and IV.
A large number of studies have confirmed that ESR1 can be used as a transcription factor to regulate many complex physiological processes of the human body and plays an important role in the treatment of many cancers, such as breast cancer, prostate cancer, and endometrial cancer (33, 34). ESR1 has the function of encoding estrogen receptor and has been the focus of breast cancer research for a long time, but it is also related to gastric cancer and other types of cancer (35). Some research showed that activation of ESR1 promotes the growth of breast cancer by triggering downstream signaling pathways, such as MAPK and PI3K (36). ESR1 plays an important role in the occurrence and development of breast cancer. It can be used not only as a prognostic index but also as a predictor of endocrine therapy response (37, 38). In addition, ESR1 is an oncogene that promotes the proliferation and metastasis of prostate cancer, and its expression is related to the poor prognosis of patients with prostate cancer (39). There is increasing evidence that estrogen affects the proliferation and tumor progression of the prostate epithelium through the ESR1 signal (40). Although the stomach is not the direct target organ of estrogen, in recent years, accumulating clinical and laboratory evidence has shown that estrogen is closely related to gastric cancer, but its specific mechanism is still unclear to a large extent (41, 42). Estrogen and ESR play not only a normal physiological function in regulating body growth and development but also an important role in the growth, proliferation, invasion, and metastasis of gastric cancer (43, 44). Our results showed that the level of ESR1 was increased in gastric adenocarcinoma patients. We speculate that ESR1 has diagnostic value in clinicopathological features and prognosis of patients with gastric cancer, and selective targeting of the estrogen receptor may be a new therapeutic tool to eliminate tumor growth and metastasis.
HDAC1 is a protein-coding gene, which can catalyze histone deacetylation reaction, and downregulates histone acetylation level, which can compress chromatin into a dense conformation and decrease transcriptional activity (45). Studies have confirmed that HDAC1/2 is significantly increased in many human cancers (46–48), especially in the invasiveness and carcinogenicity of gastric cancer (49, 50). Its high expression is related to advanced stomach cancer, uncontrolled tumor cell proliferation, and poor prognosis (51). The expression of HDAC1 is also one of the independent poor prognostic factors for the overall survival and disease-free survival of patients with stomach cancer (52). Some studies have further shown that the high expression of HDACs is clinically related to lymph node spread and shorter overall survival time in patients with gastric cancer (51, 53). Our results also confirmed that HDAC1 was correlated with tumor occurrence, development, and clinical prognosis. Therefore, HDAC1/2 is an effective therapeutic target for STAD. It has been confirmed that the HDAC inhibitor trichostatin A plays an antiproliferation effect by regulating cell cycle and apoptosis and can increase the chemical sensitivity of gastric cancer cell lines to anticancer drugs, including 5-fluorouracil, PTX, and irinotecan (54, 55). It is of great significance to further develop more alternative treatment strategies in the future and to improve the treatment of patients with gastric cancer.
Clathrin is a protein that plays a major role in the formation of coated vesicles. It forms a triangular shape composed of three clathrin heavy chains and three light chains that spontaneously assemble into a basket lattice to drive the budding process of endocytosis (56). Clathrin heavy chain (CLTC) plays an important role in the uptake of exosomes by the mononuclear phagocyte system (MPS). It has been found that MPS endocytosis in the spleen and liver can be significantly blocked by pre-injection of exosomes loaded with siRNA against CLTC, which then leads to subsequent increased delivery of exosomes in other organs (57). Further studies also confirmed that the blocking strategy using siCLTC-modified exosomes could significantly improve the protective effect of specific exosomes in a model of doxorubicin-induced cardiotoxicity (57). In cancer research, CLTC has also been reported to be involved in tumorigenesis. The CLTC–ALK fusion gene has been shown to be an ALK activator in large B-cell lymphoma and is associated with tumor recurrence (58). This abnormal fusion gene is also thought to be a major factor in congenital primitive plasmacytoid dendritic cell tumors (59). The high expression of CLTC has also been shown to be an independent prognostic factor for tumor-free survival and overall survival in patients with osteosarcoma (60). Transcriptome analysis revealed that CLTC–TFE3 fusion is present in renal cancer and affects many downstream cancer-related pathways (61). A great deal of evidence supports the concept that CLTC fusion protein is involved in tumorigenesis and tumor progression. However, the role of CLTC in gastric adenocarcinoma has not been further studied. Our results show that the expression of CLTC is increased in gastric cancer patients, which is of great significance for the treatment of gastric adenocarcinoma and further exploration of CLTC.
Among the seven hub genes screened, TP53 is the most frequently mutated gene in various human cancers, and 90% of TP53 mutations are missense changes with potential gain-of-function features (62). Cheng et al. highlight the important role of TP53 genomic status in influencing gastric cancer response to DZNep (3-deazacycline A). When evaluating clinical trials of EZH2-targeted agents, such as DZNep, consideration should be given to stratifying gastric cancer patients according to their TP53 genomic status (24). The other six hub genes have no gene mutation records in STAD-related research, but HDAC1 and ESR1 genes have been confirmed to be related to the occurrence and prognosis of gastric adenocarcinoma, associated with the patients’ DFS and OS. The remaining genes have not been studied in the pathogenesis and treatment of STAD. However, we analyzed clinical patient samples and found that the expression of those genes was elevated.
Secondly, the relationships between these hub genes were further studied. In view of the relatively few related literature, we have found only a few pairs of genes that may be associated, including HDAC1 and ESR1, HDAC1 and TP53, and CLTC and TP53, as well as TP53 and ESR1. HDAC1 and ESR1 genes play an important role in regulating the Notch signal transduction pathway (63). Premature ovarian failure (POF) can also be treated by regulating the balance of ESR in the TP53–AKT signaling pathway (64). Studies have shown that loss of heterozygosity (LOH) of TP53 and ESR is higher in ovarian serous cystadenocarcinoma (SCA) and more common in clear cell carcinoma (CCA) and serous tumor with low malignant potential (SLMP), which has been observed in primary ovarian tumors and metastases (65). CLTC–VMP1 gene fusion and TP53 gene mutation were observed in undifferentiated pleomorphic osteosarcoma (66). The rearrangement of the RNA-binding protein EWSR1 characterizes a variety of malignant tumors, including Ewing’s sarcoma (EWSR1/ETS), depilated small round cell tumor (EWSR1/WT1), and some acute lymphoblastic leukemia (EWSR1/ZNF384) (67). Although these fusions involve known cancer genes, they all occur in new fusion partners and previously unreported types of cancer. Some repeatedly mutated genes and gene fusion represent potential drug targets, which can be transformed into a diagnostic basis and can be used in clinical treatment and improvement in the prognosis of patients.
Conclusion
Due to the clinical heterogeneity of patients and the small number of included samples, the number of relevant references that can be retrieved is also small, so there are some limitations. Although we conducted a systematic bioinformatics analysis and identified the potential differential hub genes between tumor and normal tissues, the correlation between the expression of hub genes and its clinical significance is difficult to determine. Moreover, further examinations are needed to clarify their prognostic information. However, the seven hub genes are still expected to be used as potential STAD molecular biomarkers in the future. Further study of these genes can broaden our understanding of the pathogenesis of STAD and highlight the possibility of developing new targeted therapeutic drugs.
Data Availability Statement
The original contributions presented in the study are included in the article/Supplementary Material. Further inquiries can be directed to the corresponding author.
Ethics Statement
The studies involving human participants were reviewed and approved by the Shanghai Municipal Hospital of Traditional Chinese Medicine. The patients/participants provided their written informed consent to participate in this study.
Author Contributions
KZ performed the data acquisition and analysis and wrote the manuscript. JW participated in the revision of the article and data query. The other authors conducted the experimental operation and data collection and analysis. YL conceived the study design and is the guarantor of the article. All authors contributed to the article and approved the submitted version.
Funding
This work was supported by the National Natural Science Foundation of China (No. 81573775; No. 81873157) and the Postgraduate Innovation Training Special Project (Y2020020).
Conflict of Interest
The authors declare that the research was conducted in the absence of any commercial or financial relationships that could be construed as a potential conflict of interest.
Publisher’s Note
All claims expressed in this article are solely those of the authors and do not necessarily represent those of their affiliated organizations, or those of the publisher, the editors and the reviewers. Any product that may be evaluated in this article, or claim that may be made by its manufacturer, is not guaranteed or endorsed by the publisher.
Supplementary Material
The Supplementary Material for this article can be found online at: https://www.frontiersin.org/articles/10.3389/fonc.2022.844990/full#supplementary-material
Supplementary Table 1 | Information of patients.
References
1. Torre LA, Siegel RL, Ward EM, Jemal A. Global Cancer Incidence and Mortality Rates and Trends–An Update. Cancer Epidemiol Biomarkers Prev (2016) 25(1):16–27. doi: 10.1158/1055-9965.Epi-15-0578
2. Ferlay J, Soerjomataram I, Dikshit R, Eser S, Mathers C, Rebelo M, et al. Cancer Incidence and Mortality Worldwide: Sources, Methods and Major Patterns in GLOBOCAN 2012. Int J Cancer (2015) 136(5):E359–86. doi: 10.1002/ijc.29210
3. Meng X-Y, Yang G, Dong C-J, Zheng R-Y. Gastric Adenocarcinoma of the Fundic Gland: A Review of Clinicopathological Characteristics, Treatment and Prognosis. Rare Tumors (2021) 13:20363613211060171. doi: 10.1177/20363613211060171
4. Langfelder P, Horvath S. WGCNA: An R Package for Weighted Correlation Network Analysis. BMC Bioinf (2008) 9:559. doi: 10.1186/1471-2105-9-559
5. Matsuoka T, Yashiro M. Biomarkers of Gastric Cancer: Current Topics and Future Perspective. World J Gastroenterol (2018) 24(26):2818–32. doi: 10.3748/wjg.v24.i26.2818
6. Alessandrini L, Manchi M, De Re V, Dolcetti R, Canzonieri V. Proposed Molecular and miRNA Classification of Gastric Cancer. Int J Mol Sci (2018) 19(6):1683. doi: 10.3390/ijms19061683
7. Segundo-Val IS, Sanz-Lozano CS. Introduction to the Gene Expression Analysis. Methods Mol Biol (2016) 1434:29–43. doi: 10.1007/978-1-4939-3652-6_3
8. Joshi SS, Badgwell BD. Current Treatment and Recent Progress in Gastric Cancer. CA Cancer J Clin (2021) 71(3):264–79. doi: 10.3322/caac.21657
9. Okines AF, Ashley SE, Cunningham D, Oates J, Turner A, Webb J, et al. Epirubicin, Oxaliplatin, and Capecitabine With or Without Panitumumab for Advanced Esophagogastric Cancer: Dose-Finding Study for the Prospective Multicenter, Randomized, Phase II/III REAL-3 Trial. J Clin Oncol (2010) 28(25):3945–50. doi: 10.1200/jco.2010.29.2847
10. Dutton SJ, Ferry DR, Blazeby JM, Abbas H, Dahle-Smith A, Mansoor W, et al. Gefitinib for Oesophageal Cancer Progressing After Chemotherapy (COG): A Phase 3, Multicentre, Double-Blind, Placebo-Controlled Randomised Trial. Lancet Oncol (2014) 15(8):894–904. doi: 10.1016/s1470-2045(14)70024-5
11. Jo VY. EWSR1 Fusions: Ewing Sarcoma and Beyond. Cancer Cytopathol (2020) 128(4):229–31. doi: 10.1002/cncy.22239
12. Nishiyama D, Chinen Y, Isa R, Fujibayashi Y, Kuwahara-Ota S, Yamaguchi J, et al. EWSR1 Overexpression is a Pro-Oncogenic Event in Multiple Myeloma. Int J Hematol (2021) 113(3):381–94. doi: 10.1007/s12185-020-03027-0
13. Thway K, Fisher C. Mesenchymal Tumors With EWSR1 Gene Rearrangements. Surg Pathol Clin (2019) 12(1):165–90. doi: 10.1016/j.path.2018.10.007
14. Dong L, Li Y, Xue D, Liu Y. PCMT1 is an Unfavorable Predictor and Functions as an Oncogene in Bladder Cancer. IUBMB Life (2018) 70(4):291–9. doi: 10.1002/iub.1717
15. He Y, Zhou J, Wan Q. The E3 Ligase HUWE1 Mediates TGFBR2 Ubiquitination and Promotes Gastric Cancer Cell Proliferation, Migration, and Invasion. Invest New Drugs (2021) 39(3):713–23. doi: 10.1007/s10637-020-01041-x
16. Kastenhuber ER, Lowe SW. Putting P53 in Context. Cell (2017) 170(6):1062–78. doi: 10.1016/j.cell.2017.08.028
17. Wang X, Sun Q. TP53 Mutations, Expression and Interaction Networks in Human Cancers. Oncotarget (2017) 8(1):624–43. doi: 10.18632/oncotarget.13483
18. Jiang Z, Liu Z, Li M, Chen C, Wang X. Immunogenomics Analysis Reveals That TP53 Mutations Inhibit Tumor Immunity in Gastric Cancer. Trans Oncol (2018) 11(5):1171–87. doi: 10.1016/j.tranon.2018.07.012
19. Xiao W, Du N, Huang T, Guo J, Mo X, Yuan T, et al. TP53 Mutation as Potential Negative Predictor for Response of Anti-CTLA-4 Therapy in Metastatic Melanoma. EBioMedicine (2018) 32:119–24. doi: 10.1016/j.ebiom.2018.05.019
20. Lyu H, Li M, Jiang Z, Liu Z, Wang X. Correlate the TP53 Mutation and the HRAS Mutation With Immune Signatures in Head and Neck Squamous Cell Cancer. Comput Struct Biotechnol J (2019) 17:1020–30. doi: 10.1016/j.csbj.2019.07.009
21. Dong ZY, Zhong WZ, Zhang XC, Su J, Xie Z, Liu SY, et al. Potential Predictive Value of TP53 and KRAS Mutation Status for Response to PD-1 Blockade Immunotherapy in Lung Adenocarcinoma. Clin Cancer Res (2017) 23(12):3012–24. doi: 10.1158/1078-0432.Ccr-16-2554
22. Ham SW, Jeon H-Y, Jin X, Kim E-J, Kim J-K, Shin YJ, et al. TP53 Gain-of-Function Mutation Promotes Inflammation in Glioblastoma. Cell Death Differ (2019) 26(3):409–25. doi: 10.1038/s41418-018-0126-3
23. Liu ZY, Wang L, Dai HL, Wu P, Jiang TL. Nonplanar Vortex-Induced Vibrations of Cantilevered Pipes Conveying Fluid Subjected to Loose Constraints. Ocean Eng (2019) 178:1–19. doi: 10.1016/j.oceaneng.2019.02.070
24. Cheng LL, Itahana Y, Lei ZD, Chia NY, Wu Y, Yu Y, et al. TP53 Genomic Status Regulates Sensitivity of Gastric Cancer Cells to the Histone Methylation Inhibitor 3-Deazaneplanocin A (DZNep). Clin Cancer Res (2012) 18(15):4201–12. doi: 10.1158/1078-0432.Ccr-12-0036
25. Hu N, Kadota M, Liu H, Abnet CC, Su H, Wu H, et al. Genomic Landscape of Somatic Alterations in Esophageal Squamous Cell Carcinoma and Gastric Cancer. Cancer Res (2016) 76(7):1714–23. doi: 10.1158/0008-5472.Can-15-0338
26. Zhang L, Li W, Cao L, Xu J, Qian Y, Chen H, et al. PKNOX2 Suppresses Gastric Cancer Through the Transcriptional Activation of IGFBP5 and P53. Oncogene (2019) 38(23):4590–604. doi: 10.1038/s41388-019-0743-4
27. Kang MH, Jeong GS, Smoot DT, Ashktorab H, Hwang CM, Kim BS, et al. Correction: Verteporfin Inhibits Gastric Cancer Cell Growth by Suppressing Adhesion Molecule FAT1. Oncotarget (2018) 9(98):37268. doi: 10.18632/oncotarget.26488
28. Muñoz-Fontela C, Mandinova A, Aaronson SA, Lee SW. Emerging Roles of P53 and Other Tumour-Suppressor Genes in Immune Regulation. Nat Rev Immunol (2016) 16(12):741–50. doi: 10.1038/nri.2016.99
29. Zhang C, Zhang M, Ge S, Huang W, Lin X, Gao J, et al. Reduced M6a Modification Predicts Malignant Phenotypes and Augmented Wnt/PI3K-Akt Signaling in Gastric Cancer. Cancer Med (2019) 8(10):4766–81. doi: 10.1002/cam4.2360
30. Solcia E, Klersy C, Mastracci L, Alberizzi P, Candusso ME, Diegoli M, et al. A Combined Histologic and Molecular Approach Identifies Three Groups of Gastric Cancer With Different Prognosis. Virchows Archiv (2009) 455(3):197–211. doi: 10.1007/s00428-009-0813-z
31. Park S, Lee J, Kim YH, Park J, Shin JW, Nam S. Clinical Relevance and Molecular Phenotypes in Gastric Cancer, of TP53 Mutations and Gene Expressions, in Combination With Other Gene Mutations. Sci Rep (2016) 6:34822. doi: 10.1038/srep34822
32. Zha Y, Gan P, Liu Q, Yao Q. TP53 Codon 72 Polymorphism Predicts Efficacy of Paclitaxel Plus Capecitabine Chemotherapy in Advanced Gastric Cancer Patients. Arch Med Res (2016) 47(1):13–8. doi: 10.1016/j.arcmed.2015.12.001
33. Karamanos NK, Theocharis AD, Neill T, Iozzo RV. Matrix Modeling and Remodeling: A Biological Interplay Regulating Tissue Homeostasis and Diseases. Matrix Biol (2019) 75-76:1–11. doi: 10.1016/j.matbio.2018.08.007
34. Theocharis AD, Skandalis SS, Gialeli C, Karamanos NK. Extracellular Matrix Structure. Adv Drug Deliv Rev (2016) 97:4–27. doi: 10.1016/j.addr.2015.11.001
35. Tu Y, Wu Q, He J, Xu J, Yu S, Wang Q, et al. Exploring the Potential Molecular Mechanism of Scutellaria Baicalensis Georgi in the Treatment of Gastric Cancer Based on Network Pharmacological Analysis and Molecular Docking Technology. Front Pharmacol (2021) 12:697704. doi: 10.3389/fphar.2021.697704
36. Su X, Xu X, Li G, Lin B, Cao J, Teng L. ER-α36: A Novel Biomarker and Potential Therapeutic Target in Breast Cancer. Onco Targets Ther (2014) 7:1525–33. doi: 10.2147/ott.S65345
37. Lumachi F, Luisetto G, Basso SM, Basso U, Brunello A, Camozzi V. Endocrine Therapy of Breast Cancer. Curr Med Chem (2011) 18(4):513–22. doi: 10.2174/092986711794480177
38. Gradishar WJ. Tamoxifen–what Next? Oncologist (2004) 9(4):378–84. doi: 10.1634/theoncologist.9-4-378
39. Mishra S, Tai Q, Gu X, Schmitz J, Poullard A, Fajardo RJ, et al. Estrogen and Estrogen Receptor Alpha Promotes Malignancy and Osteoblastic Tumorigenesis in Prostate Cancer. Oncotarget (2015) 6(42):44388–402. doi: 10.18632/oncotarget.6317
40. Royuela M, de Miguel MP, Bethencourt FR, Sánchez-Chapado M, Fraile B, Arenas MI, et al. Estrogen Receptors Alpha and Beta in the Normal, Hyperplastic and Carcinomatous Human Prostate. J Endocrinol (2001) 168(3):447–54. doi: 10.1677/joe.0.1680447
41. Freedman ND, Lacey JV Jr, Hollenbeck AR, Leitzmann MF, Schatzkin A, Abnet CC. The Association of Menstrual and Reproductive Factors With Upper Gastrointestinal Tract Cancers in the NIH-AARP Cohort. Cancer (2010) 116(6):1572–81. doi: 10.1002/cncr.24880
42. Fu Z, Zou F, Deng H, Zhou H, Liu L. Estrogen Protects SGC7901 Cells From Endoplasmic Reticulum Stress-Induced Apoptosis by the Akt Pathway. Oncol Lett (2014) 7(2):560–4. doi: 10.3892/ol.2013.1701
43. Wang X, Huang X, Fu Z, Zou F, Li Y, Wang Z, et al. Biphasic ER-α36-Mediated Estrogen Signaling Regulates Growth of Gastric Cancer Cells. Int J Oncol (2014) 45(6):2325–30. doi: 10.3892/ijo.2014.2660
44. Wang X, Chen Q, Huang X, Zou F, Fu Z, Chen Y, et al. Effects of 17β-Estradiol and Tamoxifen on Gastric Cancer Cell Proliferation and Apoptosis and ER-α36 Expression. Oncol Lett (2017) 13(1):57–62. doi: 10.3892/ol.2016.5424
45. Večeřa J, Bártová E, Krejčí J, Legartová S, Komůrková D, Rudá-Kučerová J, et al. HDAC1 and HDAC3 Underlie Dynamic H3K9 Acetylation During Embryonic Neurogenesis and in Schizophrenia-Like Animals. J Cell Physiol (2018) 233(1):530–48. doi: 10.1002/jcp.25914
46. Ler SY, Leung CH, Khin LW, Lu GD, Salto-Tellez M, Hartman M, et al. HDAC1 and HDAC2 Independently Predict Mortality in Hepatocellular Carcinoma by a Competing Risk Regression Model in a Southeast Asian Population. Oncol Rep (2015) 34(5):2238–50. doi: 10.3892/or.2015.4263
47. Tharkar-Promod S, Johnson DP, Bennett SE, Dennis EM, Banowsky BG, Jones SS, et al. HDAC1,2 Inhibition and Doxorubicin Impair Mre11-Dependent DNA Repair and DISC to Override BCR-ABL1-Driven DSB Repair in Philadelphia Chromosome-Positive B-Cell Precursor Acute Lymphoblastic Leukemia. Leukemia (2018) 32(1):49–60. doi: 10.1038/leu.2017.174
48. Li S, Paterno GD, Gillespie LL. Nuclear Localization of the Transcriptional Regulator MIER1α Requires Interaction With HDAC1/2 in Breast Cancer Cells. PLoS One (2013) 8(12):e84046. doi: 10.1371/journal.pone.0084046
49. Song J, Noh JH, Lee JH, Eun JW, Ahn YM, Kim SY, et al. Increased Expression of Histone Deacetylase 2 is Found in Human Gastric Cancer. Apmis (2005) 113(4):264–8. doi: 10.1111/j.1600-0463.2005.apm_04.x
50. Choi JH, Kwon HJ, Yoon BI, Kim JH, Han SU, Joo HJ, et al. Expression Profile of Histone Deacetylase 1 in Gastric Cancer Tissues. Jpn J Cancer Res (2001) 92(12):1300–4. doi: 10.1111/j.1349-7006.2001.tb02153.x
51. Sun J, Piao J, Li N, Yang Y, Kim KY, Lin Z. Valproic Acid Targets HDAC1/2 and HDAC1/PTEN/Akt Signalling to Inhibit Cell Proliferation via the Induction of Autophagy in Gastric Cancer. FEBS J (2020) 287(10):2118–33. doi: 10.1111/febs.15122
52. Jiang Z, Yang H, Zhang X, Wang Z, Rong R, Wang X. Histone Deacetylase-1 as a Prognostic Factor and Mediator of Gastric Cancer Progression by Enhancing Glycolysis. Hum Pathol (2019) 85:194–201. doi: 10.1016/j.humpath.2018.10.031
53. Weichert W, Röske A, Gekeler V, Beckers T, Ebert MP, Pross M, et al. Association of Patterns of Class I Histone Deacetylase Expression With Patient Prognosis in Gastric Cancer: A Retrospective Analysis. Lancet Oncol (2008) 9(2):139–48. doi: 10.1016/s1470-2045(08)70004-4
54. Suzuki T, Yokozaki H, Kuniyasu H, Hayashi K, Naka K, Ono S, et al. Effect of Trichostatin A on Cell Growth and Expression of Cell Cycle- and Apoptosis-Related Molecules in Human Gastric and Oral Carcinoma Cell Lines. Int J Cancer (2000) 88(6):992–7. doi: 10.1002/1097-0215(20001215)88:6<992::aid-ijc24>3.0.co;2-9
55. Zhang X, Yashiro M, Ren J, Hirakawa K. Histone Deacetylase Inhibitor, Trichostatin A, Increases the Chemosensitivity of Anticancer Drugs in Gastric Cancer Cell Lines. Oncol Rep (2006) 16(3):563–8. doi: 10.3892/or.16.3.563
56. Zhang S, Gao H, Bao G. Physical Principles of Nanoparticle Cellular Endocytosis. ACS Nano (2015) 9(9):8655–71. doi: 10.1021/acsnano.5b03184
57. Wan Z, Zhao L, Lu F, Gao X, Dong Y, Zhao Y, et al. Mononuclear Phagocyte System Blockade Improves Therapeutic Exosome Delivery to the Myocardium. Theranostics (2020) 10(1):218–30. doi: 10.7150/thno.38198
58. De Paepe P, Baens M, van Krieken H, Verhasselt B, Stul M, Simons A, et al. ALK Activation by the CLTC-ALK Fusion is a Recurrent Event in Large B-Cell Lymphoma. Blood (2003) 102(7):2638–41. doi: 10.1182/blood-2003-04-1050
59. Tokuda K, Eguchi-Ishimae M, Yagi C, Kawabe M, Moritani K, Niiya T, et al. CLTC-ALK Fusion as a Primary Event in Congenital Blastic Plasmacytoid Dendritic Cell Neoplasm. Genes Chromosomes Cancer (2014) 53(1):78–89. doi: 10.1002/gcc.22119
60. Shijie L, Zhen P, Kang Q, Hua G, Qingcheng Y, Dongdong C. Deregulation of CLTC Interacts With TFG, Facilitating Osteosarcoma via the TGF-Beta and AKT/mTOR Signaling Pathways. Clin Transl Med (2021) 11(6):e377. doi: 10.1002/ctm2.377
61. Kauffman EC, Ricketts CJ, Rais-Bahrami S, Yang Y, Merino MJ, Bottaro DP, et al. Molecular Genetics and Cellular Features of TFE3 and TFEB Fusion Kidney Cancers. Nat Rev Urol (2014) 11(8):465–75. doi: 10.1038/nrurol.2014.162
62. Baugh EH, Ke H, Levine AJ, Bonneau RA, Chan CS. Why are There Hotspot Mutations in the TP53 Gene in Human Cancers? Cell Death Differ (2018) 25(1):154–60. doi: 10.1038/cdd.2017.180
63. Kao HY, Ordentlich P, Koyano-Nakagawa N, Tang Z, Downes M, Kintner CR, et al. A Histone Deacetylase Corepressor Complex Regulates the Notch Signal Transduction Pathway. Genes Dev (1998) 12(15):2269–77. doi: 10.1101/gad.12.15.2269
64. Liu H, Yang H, Qin Z, Chen Y, Yu H, Li W, et al. Exploration of the Danggui Buxue Decoction Mechanism Regulating the Balance of ESR and AR in the TP53-AKT Signaling Pathway in the Prevention and Treatment of POF. Evid Based Complement Alternat Med (2021) 2021:4862164. doi: 10.1155/2021/4862164
65. Otis C, Krebs P, Quezado M, Albuquerque A, Bryant B, San Juan X, et al. Loss of Heterozygosity in P53, BRCA1, and Estrogen Receptor Genes and Correlation to Expression of P53 Protein in Ovarian Epithelial Tumors of Different Cell Types and Biological Behavior. Hum Pathol (2000) 31(2):233–8. doi: 10.1016/s0046-8177(00)80225-7
66. Ali NM, Niada S, Brini AT, Morris MR, Kurusamy S, Alholle A, et al. Genomic and Transcriptomic Characterisation of Undifferentiated Pleomorphic Sarcoma of Bone. J Pathol (2019) 247(2):166–76. doi: 10.1002/path.5176
Keywords: stomach adenocarcinoma, identification, TCGA, GEO, hub genes
Citation: Zhang K, Wang J, Zhu Y, Liu X, Li J, Shi Z, Cao M and Li Y (2022) Identification of Hub Genes Associated With the Development of Stomach Adenocarcinoma by Integrated Bioinformatics Analysis. Front. Oncol. 12:844990. doi: 10.3389/fonc.2022.844990
Received: 29 December 2021; Accepted: 18 April 2022;
Published: 24 May 2022.
Edited by:
Yuming Jiang, Stanford University, United StatesReviewed by:
Syed Jafar Mehdi, University of Arkansas for Medical Sciences, United StatesZhen Dong, Southwest University, China
Copyright © 2022 Zhang, Wang, Zhu, Liu, Li, Shi, Cao and Li. This is an open-access article distributed under the terms of the Creative Commons Attribution License (CC BY). The use, distribution or reproduction in other forums is permitted, provided the original author(s) and the copyright owner(s) are credited and that the original publication in this journal is cited, in accordance with accepted academic practice. No use, distribution or reproduction is permitted which does not comply with these terms.
*Correspondence: Yong Li, bGl5b25nQHNodXRjbS5lZHUuY24=
†ORCID: Kehui Zhang, orcid.org/0000-0002-3603-6553
‡These authors have contributed equally to this work