
94% of researchers rate our articles as excellent or good
Learn more about the work of our research integrity team to safeguard the quality of each article we publish.
Find out more
ORIGINAL RESEARCH article
Front. Oncol., 31 March 2022
Sec. Cancer Imaging and Image-directed Interventions
Volume 12 - 2022 | https://doi.org/10.3389/fonc.2022.843376
This article is part of the Research TopicArtificial Intelligence in Digital Pathology Image AnalysisView all 16 articles
 Xing Wang1†
 Jia-Jun Qiu2†
 Chun-Lu Tan1
 Yong-Hua Chen1
 Qing-Quan Tan1Shu-Jie Ren1
 Fan Yang3Wen-Qing Yao4
 Dan Cao5
 Neng-Wen Ke1*
 Xu-Bao Liu1*
Backgroud: Tumor grade is the determinant of the biological aggressiveness of pancreatic neuroendocrine tumors (PNETs) and the best current tool to help establish individualized therapeutic strategies. A noninvasive way to accurately predict the histology grade of PNETs preoperatively is urgently needed and extremely limited.
Methods: The models training and the construction of the radiomic signature were carried out separately in three-phase (plain, arterial, and venous) CT. Mann–Whitney U test and least absolute shrinkage and selection operator (LASSO) were applied for feature preselection and radiomic signature construction. SVM-linear models were trained by incorporating the radiomic signature with clinical characteristics. An optimal model was then chosen to build a nomogram.
Results: A total of 139 PNETs (including 83 in the training set and 56 in the independent validation set) were included in the present study. We build a model based on an eight-feature radiomic signature (group 1) to stratify PNET patients into grades 1 and 2/3 groups with an AUC of 0.911 (95% confidence intervals (CI), 0.908–0.914) and 0.837 (95% CI, 0.827–0.847) in the training and validation cohorts, respectively. The nomogram combining the radiomic signature of plain-phase CT with T stage and dilated main pancreatic duct (MPD)/bile duct (BD) (group 2) showed the best performance (training set: AUC = 0.919, 95% CI = 0.916–0.922; validation set: AUC = 0.875, 95% CI = 0.867–0.883).
Conclusions: Our developed nomogram that integrates radiomic signature with clinical characteristics could be useful in predicting grades 1 and 2/3 PNETs preoperatively with powerful capability.
Pancreatic neuroendocrine tumor (PNET) is a relatively rare pancreatic disorder thought to arise in hormone secretory cells of the islets of Langerhans (1) and ever known as islet cell tumor (2). It consists of about 3%–5% of all the pancreatic neoplasm but predominates human neuroendocrine tumors (3). Additionally, the incidence and prevalence of PNETs are steadily increasing in recent decades (4, 5).
PNETs are characterized by tumor heterogeneity (6), and of which the clinical behavior are relatively indolent but vary dramatically (7). Tumor grade is the crucial determinant of the biological aggressiveness of PNETs. Additionally, it is suggested to be associated with lymph node involvement (7), tumor recurrence (8), and overall prognosis (9). According to the 2010 World Health Organization (WHO) classification criteria (10), tumor grade is defined numerically by the proliferative indicator Ki-67, in which low-grade (grade 1 (G1)) tumors have a Ki-67 index from 0% to 2%, intermediate-grade (G2) tumors have a Ki-67 index from 3% to 20%, and high-grade (G3) tumors have a Ki-67 index greater than 20%. Surgery is thought to be the cornerstone of treatment of PNETs in each stage and the only potential way to cure local PNETs (5, 11). However, different surgical strategies could be applied for PNETs of grades 1 and 2/3. The last but not the least, for advanced PNETs, there are also other treatment options, e.g., somatostatin analog (SSA), targeted therapy, or chemotherapy, based on tumor grades. In short, the WHO tumor grading is the best current tool to predict prognosis, guide therapy selection, and aid surgical decision-making by stratification of PNETs.
Of note, tumor grade is always obtained according to postoperative pathology specimen. Although the preoperative endoscopic ultrasound (EUS)-guided fine-needle aspiration cytology (FNA) is proved to be efficient in diagnosing PNETs, the accuracy in differentiating tumor grade remains challenging, possibly due to limited tissue availability or missing the most mitotically active areas (hot pot) of the tumor. The research of Heidsma et al. showed that tumor grade differentiation could be accurately determined by FNA in only 20%–50% of patients (6, 12). Additionally, EUS-guided fine-needle biopsy (FNB) with thicker tissue biopsy needle was reported to have better performance in tumor grade differentiation, as more tumor tissues could be obtained (13). However, both of them were invasive procedures which largely depended on the operators’ experience (13). Therefore, the effective method of preoperatively predicting the pathologic grade of PNETs is still imperatively needed to help establish individualized therapeutic strategies and aid surgical decision-making.
Several previous studies tried to identify the tumor grade of PNETs by computed tomography (CT), magnetic resonance imaging (MRI), and PET/CT (14–17). Although they provided a noninvasive way to preoperatively predict the aggressiveness of PNETs, the accuracy was limited, as the prediction of the frequently occurring heterogeneous tumor was mainly established based on visual observation rather than quantitative information. Recently, “radiomics” brings a new hope for this problem. It is a method that automatically extract a large number of quantitative features from medical images using data-characterization algorithms, and subsequently identify the most significant radiomic signatures through machine learning methods (18, 19). Therefore, we can realize cancer detection, prediction of clinical outcome, and treatment evaluation as reported previously (20, 21). Additionally, radiomics was reported to be successfully applied in differentiating pathologic grading in patients with clear cell renal cell carcinoma (22), colorectal adenocarcinoma (23), etc. Nevertheless, to the best of our knowledge, a noninvasive optimal combined model to incorporate imaging features with clinical characteristics (such as tumor size and tumor margin status) to predict the pathologic grade of PNETs is extremely limited.
Thus, this work attempted to establish a multimodal artificial intelligence (AI) model that integrates a radiomic signature based on plain CT images with clinical features for noninvasive and preoperative prediction of the pathologic grades of PNETs.
This retrospective study was approved by the ethics committee of Sichuan University, and the signed informed consent was waived. From July 2008 to June 2018, patients with histologically confirmed PNETs who underwent surgical resection in our institution were retrospectively reviewed. The patients with a PNET that was too small to display clearly on CT, several patients with cystic PNET, and patients without preoperative CT scan were excluded at the present study. The final diagnosis of PNETs was made by specialized pathologists, including the diagnosis of the tumor grade basing on Ki-67 immunohistochemical staining data. Clinical data were obtained from the electronic medical records or external medical reports, including demographic characteristics and classification. Finally, 139 patients with complete data available were identified for analysis in the present study. Of these, 83 patients were taken randomly as the training set, and the other 56 patients were used for the independent validation set (also called test set, not the set in a crossvalidation approach). The training dataset and validation dataset had an even distribution in patient characteristics (Table 1). No significant difference was found in PNET pathologic grade and clinical characteristics (age, maximum diameter, and clinical stage of the tumor, etc.) between the training dataset and validation dataset.
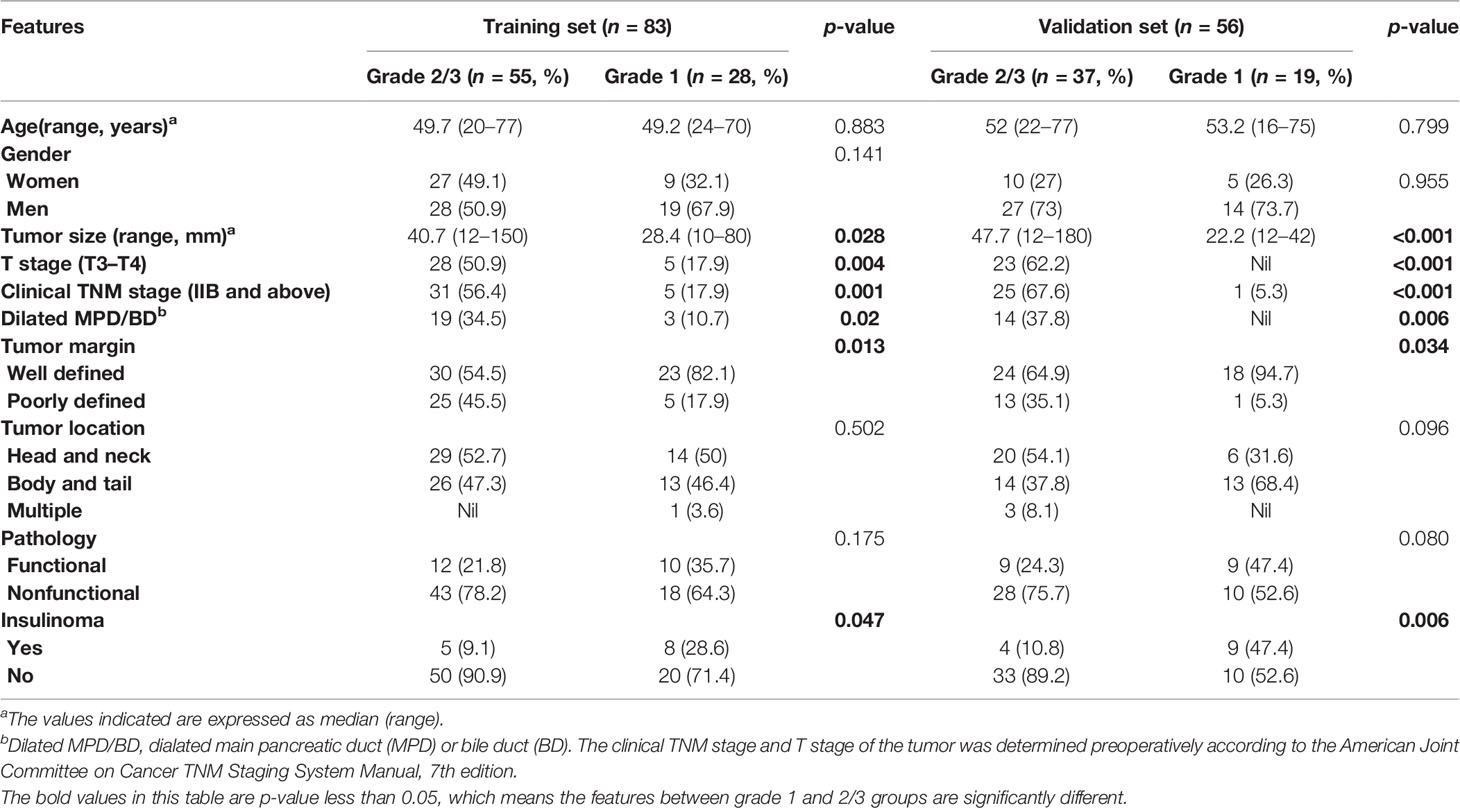
Table 1 Comparison of patient and lesion features between grades 1 and 2/3 groups in training and validation sets.
All patients underwent an abdominal contrast-enhanced CT scan preoperatively. Contrast-enhanced CT scan was performed on three CT scanners including a 16-slice CT (Toshiba Medical Systems, Japan), a 64-, and a 256-slice CT (Philips Healthcare, Netherlands). CT scans used the same CT scanning parameters: tube voltage of 120 kVp, tube current of 125 to 300 mAs, pitch of 0.6 to 1.25 mm, slice thickness of 3 to 5 mm, and reconstruction interval of 3 to 5 mm.
We performed a radiomic analysis on preoperative CT images to evauate the pathologic grades of PNETs. Figure 1 illustrates the work flow of the radiomic analysis.
Step 1: Tumor regions were delineated and segmented into regions of interest (ROIs) from which texture features were extracted. We evaluated the CT images in plain, arterial, and portal venous phases, respectively.
Step 2: We used 10 texture analysis methods to extract features. The Supplementary Material described the methods in detail. A total of 1,133 features were extracted from a ROI (24–26).
Steps 3–4: Preselection was performed on the 1,133 features using the Mann–Whitney U test (p-value ≤ 0.25). We then combined the methods of least absolute shrinkage and selection operator (LASSO) and stepwise logistical regression to perform feature selection. Feature preselection and feature selection were both performed on the training set. A radiomic signature can be built based on the final selected features.
Step 5: We combined the radiomic signature and four clinical data to train SVM-linear models. Features were divided into three groups: radiomic signature (group 1), radiomic signature combining T stage and dilated main pancreatic duct (MPD)/bile duct (BD) (group 2), and radiomic signature combining T stage, dilated MPD/BD, clinical TNM stage, and tumor margin (group 3). The models training and the construction of the radiomic signature were carried out separately in three phases (plain, arterial, and venous). Thus, a total of 9 prediction tasks were performed.
Step 6: The independent validation dataset (n = 56) was tested on the 9 trained models. We chose an optimal model to construct a nomogram, and then used the nomogram to predict the pathologic grades of these 56 patients. A calibration curve and a goodness of fit to the ideal model are calculated to evaluate the nomogram.
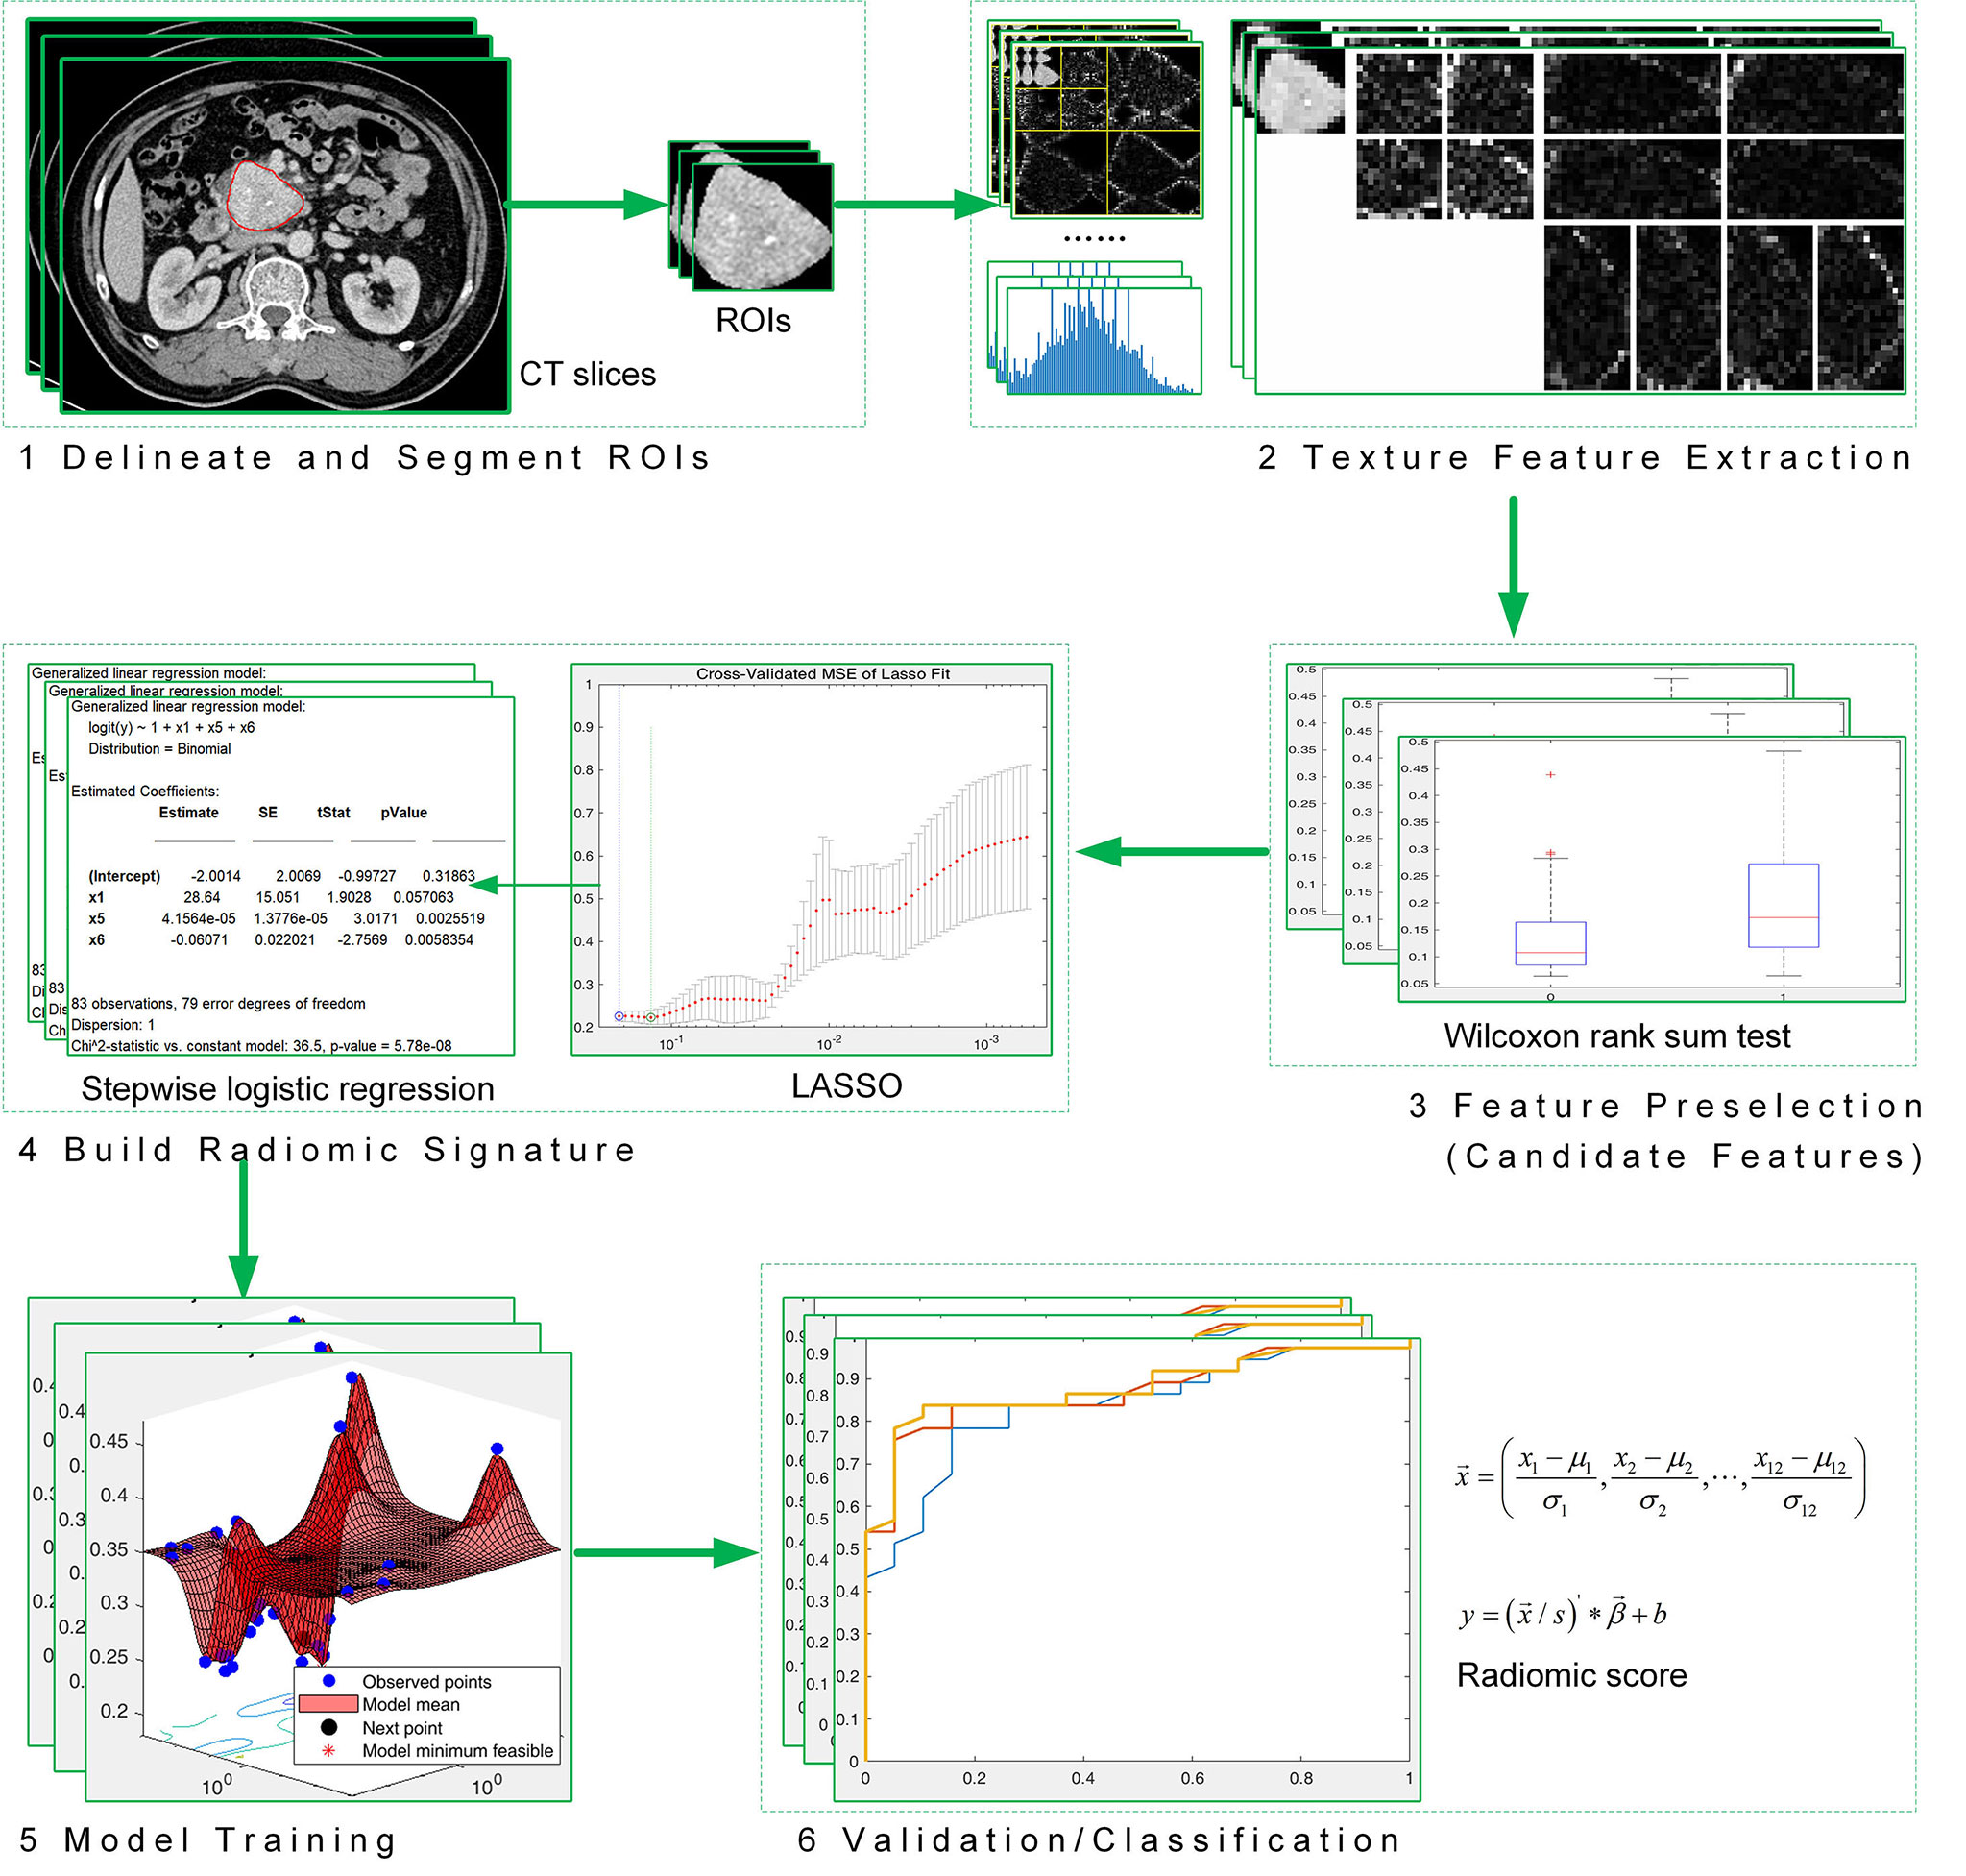
Figure 1 Work flow of radiomic analysis.
The detailed distribution of clinical characteristics in the G1 group (grade 1) and G2/3 group (grade 2/3) is summarized in Table 1. The tumor size of PNET in grade 2/3 group was significantly larger than that in grade 1 group (p = 0.028). T stage (T3–T4), clinical TNM stage (IIB and above), Dilated MPD/BD, and poorly defined tumor margin were more frequently detected in patients with grade 2/3 PNETs than those with grade 1 (p = 0.004, p = 0.001, p = 0.02, and p = 0.013, respectively). The consistent results occurred both in the training and validation datasets.
As illustrated in Figure 1, this study aims to build a radiomic> signature and evaluate the ability of the signature to predict PNET grades. Table 2 shows the features used to build the radiomic signature, that is, the result of feature selection on the training set. We also evaluated the performance of combining the radiomic signature and 4 clinical variables to predict PNET grades. The clinical variables are x9 to x12 in Table 2.
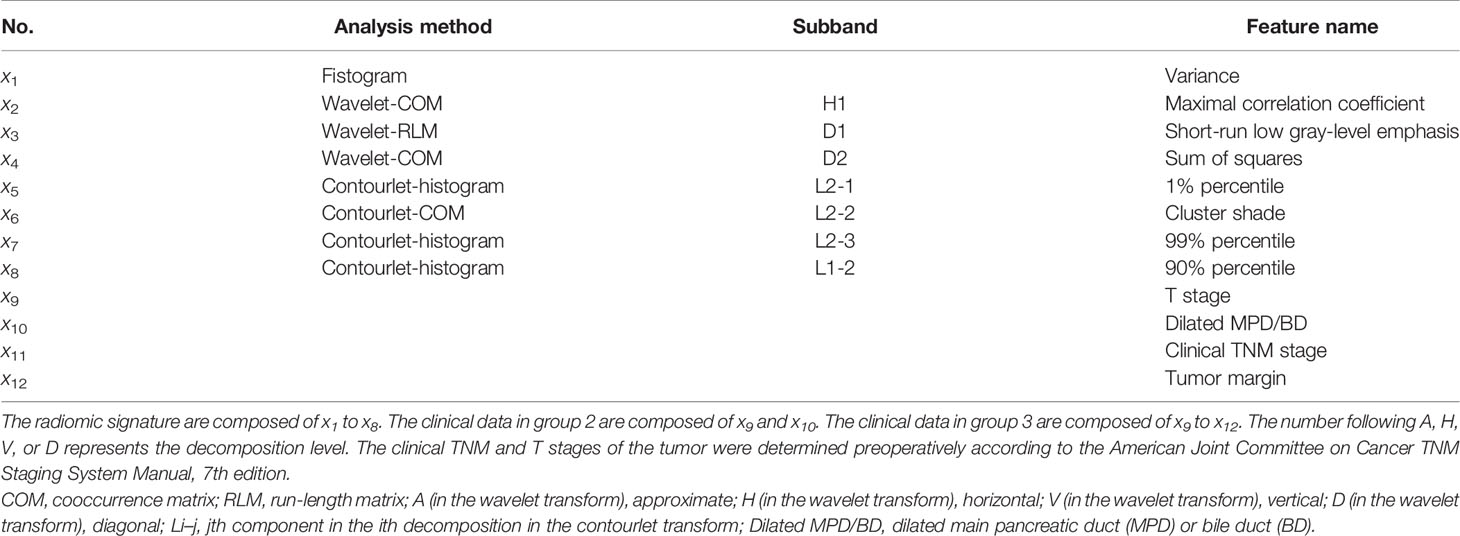
Table 2 Radiomic signature and clinical data.
The linear combination of x1 to x8 in Table 2 expresses the radiomic signature y. The linear combination is shown in Equations (1) and (2).
where y is the score of group 1 (or 2 or 3) for grade 1, −y is the corresponding score for grade 2/3, is an observation comprising the m predictors, s is the kernel scale, β is the bias term, and the vector β contains the coefficients that define an orthogonal vector to the hyperplane,, and μi and σi are the corresponding weighted mean and weighted standard deviation for the ith predictor (used for standardization). When predicting the result, we inputted [−y, y] into the function softmax to obtain the probabilities that the observer belongs to the positive class (grade 2/3) and the negative class (grade 1).
Next, we trained prediction models based on the radiomic signature and the clinical variables to approximately calculate the value of each unknown variable in Equations (1) and (2). We then validated the performance of these models on the independent validation set. The training results and the validation results are shown in Table 3. Of note, compared with A (arterial) phase and V (venous) phase, P (plain) phase obtained the best prediction performance for each group in the validation set. What is more, for each phase, we calculated the receiver operating characteristics curves (ROCs) and compared the ROCs of validation using the DeLong’s test method. Figure 2 illustrates the ROC results. It demonstrates that the models based on the radiomic signature combined with clinical data (models based on groups 2 and 3) obtain better prediction results than the models based on the radiomic signature alone (models based on group 1). Additionally, although the indicator values based on group 3 show the highest performance, the model based on the radiomic signature combined with 4 clinical data in group 3 showed no significantly better prediction results in plain phase, compared with that combined with 2 clinical data in group 2 (p < 0.629). As can be seen from Table 3, the experiments based on plain phase obtained the best prediction performance than other phases. Thus, we also calculated the indicator values of accuracy, sensitivity, and specificity in the experiments of plain phase. Table 4 and Supplementary Figure S2 show the prediction results (on the validation set) as the threshold varied.
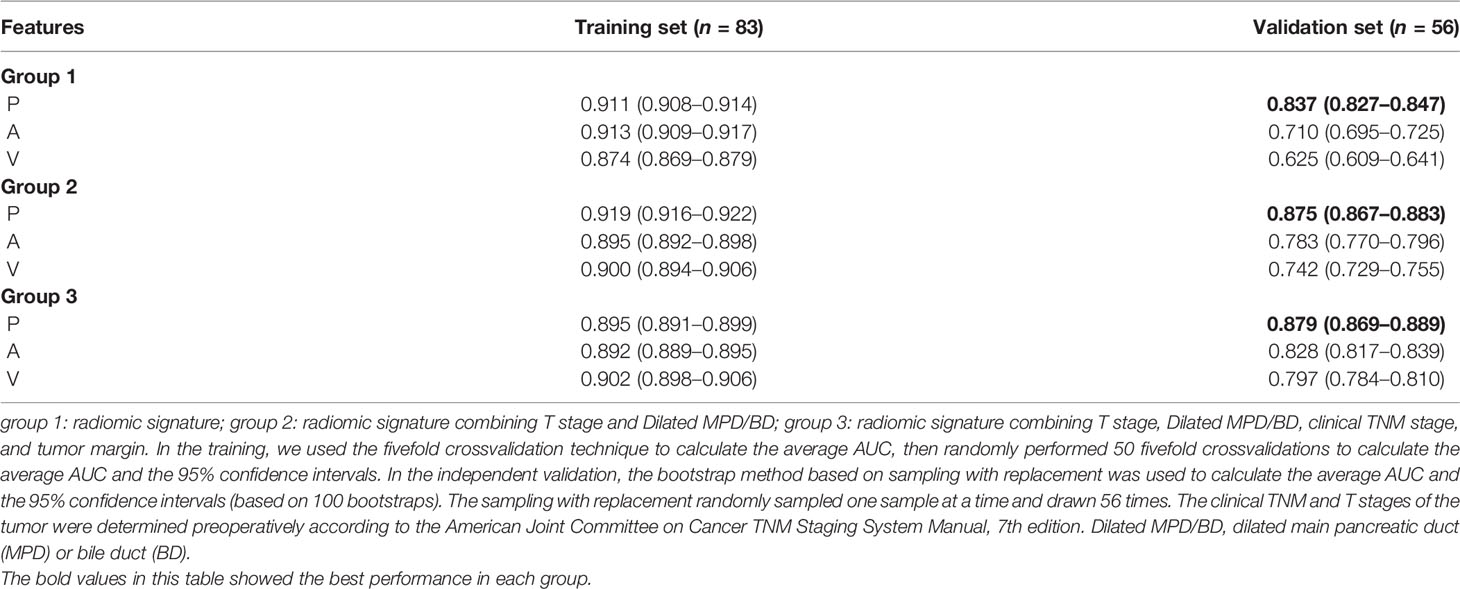
Table 3 Results of training and validation: plain (P), arterial (A), and venous (V); unless otherwise specified, the contents of parentheses are 95% confidence intervals.
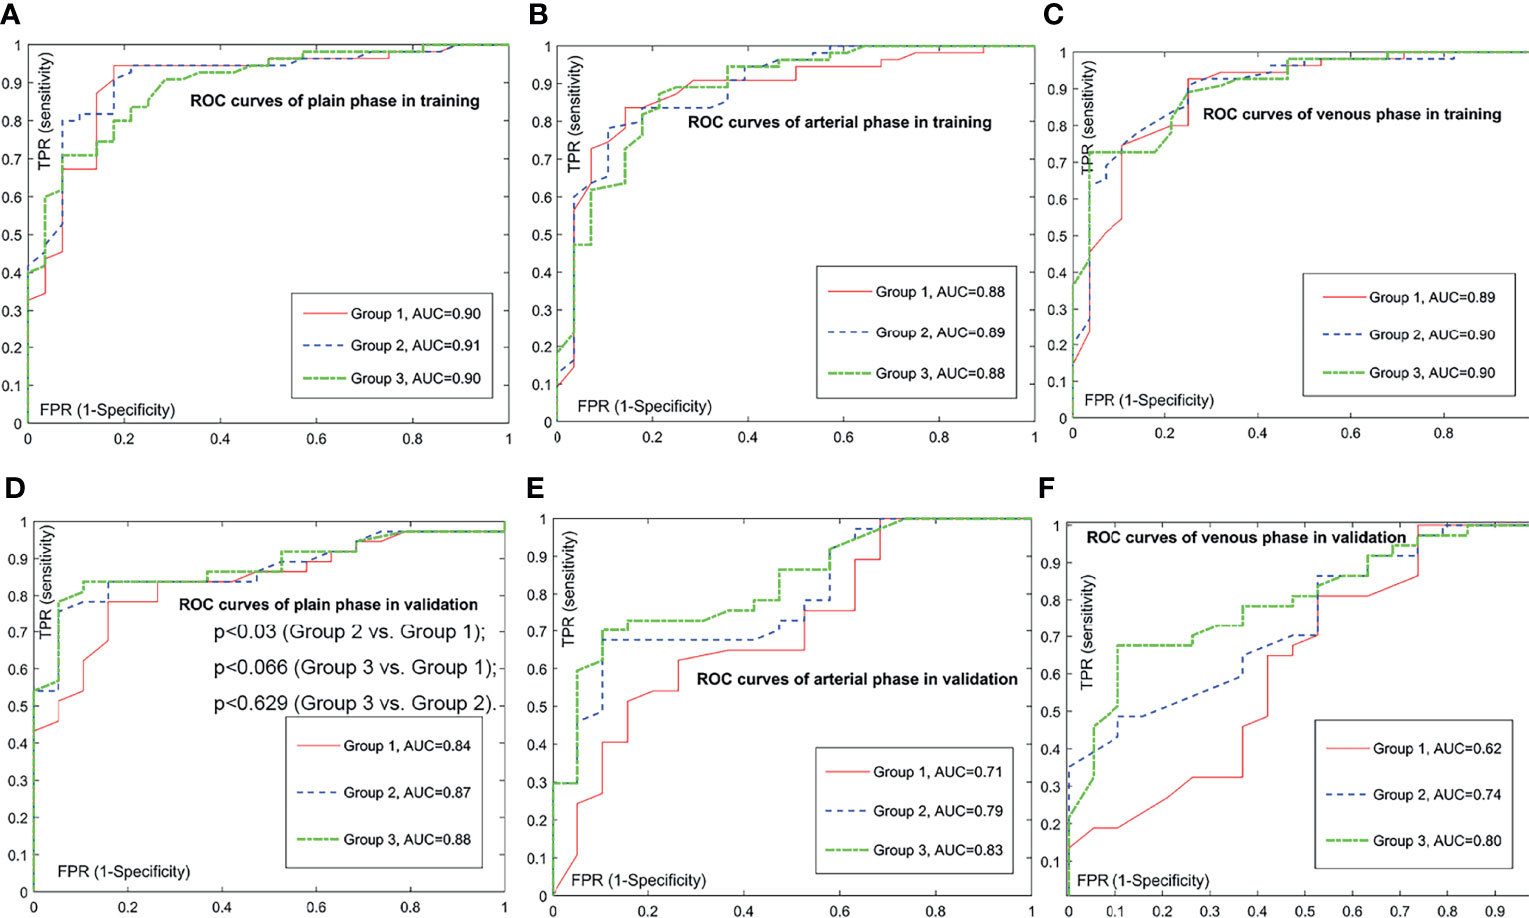
Figure 2 Comparison of receiver operating characteristic (ROC) curves for prediction of the histologic grade. The positive class is grade 2/3; the negative class is grade 1. Subfigure (A–C) illustrate the training ROCs. Subfigures (D–F) illustrate the validation ROCs. In validations, we performed DeLong’s tests to compare two ROC curves. In (D), the DeLong’s tests show that the p-value between the ROC curve of group 3 and the ROC curve of group 1 is less than 0.066, the p-value between the ROC curve of group 3 and the ROC curve of group 2 is less than 0.629, and the p-value between the ROC curve of group 2 and the ROC curve of group 1 is less than 0.030. In subfigure (E), the DeLong’s tests show that the p-value between the ROC curve of group 3 and the ROC curve of group 1 is less than 0.003, the p-value between the ROC curve of group 3 and the ROC curve of group 2 is less than 0.037, and the p-value between the ROC curve of group 2 and the ROC curve of group 1 is less than 0.013. In (F), the DeLong’s tests show that the p-value between the ROC curve of group 3 and the ROC curve of group 1 is less than 0.001, the p-value between the ROC curve of group 3 and the ROC curve of group 2 is less than 0.059, and the p-value between the ROC curve of group 2 and the ROC curve of group 1 is less than 0.003.

Table 4 Validation results based on plain phase as the threshold varied: accuracy (ACC, %), sensitivity (SEN, %), and specificity (SPE, %).
Above all, the model based on the radiomic signature of plain phase combined with 2 clinical data (T stage and Dilated MPD/BD) in group 2 obtained the best prediction performance. Although the prediction results of the model based on the radiomic signature combined with 4 clinical data in group 3 seemed a little better, there was no significant differences between the groups 3 and 2 models (p < 0.629). Consider the balance between the convenience and predictive power of the model, we established a novel nomogram to preoperatively predict histologic grade in PNETs based on the radiomic signature of plain phase combined with 2 clinical data (T stage and Dilated MPD/BD) in group 2 (Figure 3).
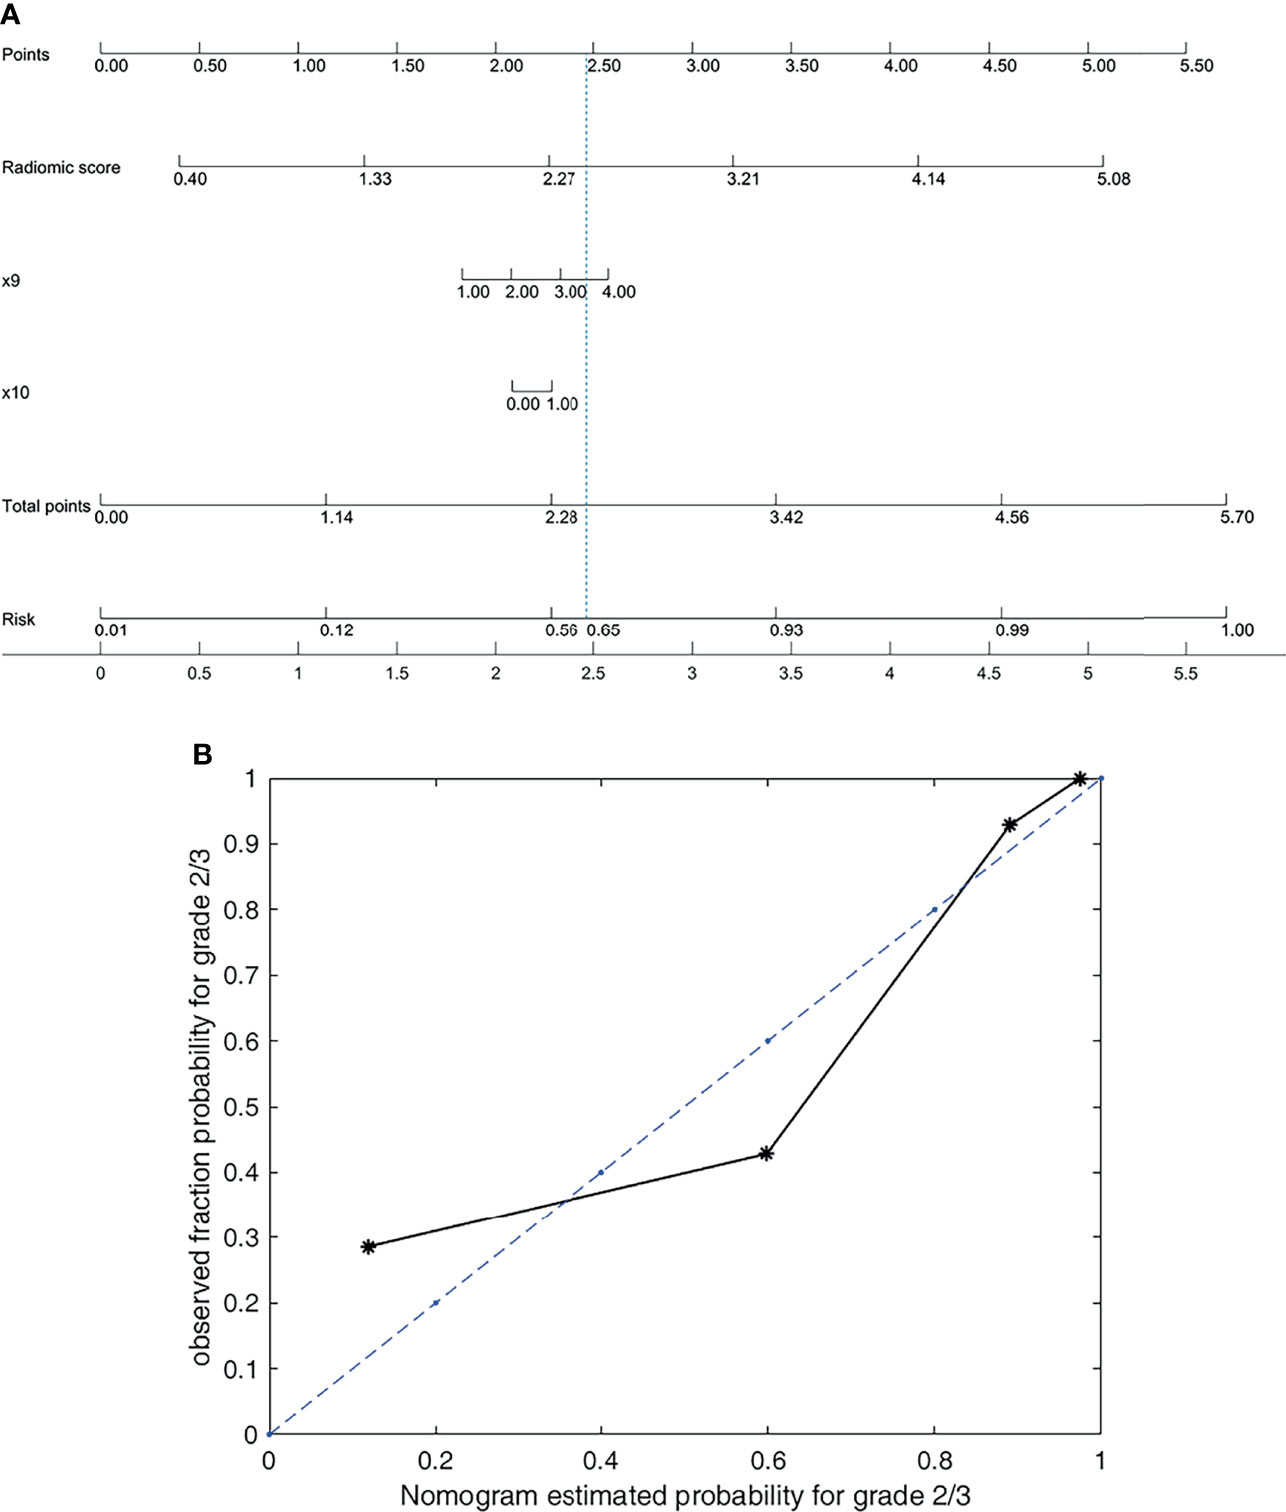
Figure 3 Nomogram and its calibration curve based on group 2 for predicting grade 2/3. (A) Nomogram for group 2. (B) Calibration curve, where the diagonal dotted line is a perfect estimation by an ideal model. The predicted (estimated) probabilities of the validation set were sorted and divided into four groups based on quartiles to calculate the observed true probabilities. We calculated the goodness of fit to evaluate how well the solid line fits the dotted line. The goodness of fit is 0.8683, which indicates that the two lines fit well.
Figure 3 shows that the nomogram achieves a goodness of fit of 0.868 to the ideal model. Correspondingly, the score for the radiomic signature based on plain phase is
The score for the radiomic signature and clinical data in group 2 based on plain-phase is
The score for the radiomic signature and clinical data in group 3 based on plain phase is
PNETs are relatively rare neoplasms, the incidence of which is about 4–5 individuals per 100,000 annually (27). Nevertheless, PNETs have been increasingly detected and diagnosed in recent decades and currently represent the second most common pancreatic tumor followed by pancreatic adenocarcinoma (28). Most of PNETs carry MEN1, ATRX, or DAXX gene mutations, while approximately 15% activate mammalian target of rapamycin (mTOR) signaling (29, 30). PNETs are heterogenous neoplasms, of which the prognosis varies widely. The current most important prognostic stratification factor is WHO tumor grade classification, which might optimize tailored therapeutic strategies. So far, tumor grade is obtained by postoperative pathology. The preoperative fine-needle aspiration (FNA) is invasive, and the accuracy in differentiating tumor grade remains challenging. In the present study, we establish a combined nomogram that integrates a radiomic signature based on plain CT images with clinical features for noninvasive and preoperative prediction of pathologic grades of PNETs with high accuracy.
Firstly, we build a model based on an eight-feature radiomic signature to stratify PNET patients into G1 and G2/3 groups with an AUC of 0.911 (95% CI, 0.908–0.914) and 0.837 (95% CI, 0.827–0.847) in the training and validation cohorts, respectively. Moreover, we identified some objective clinical features (including T stage and dilated main pancreatic duct/bile duct status) related to tumor grade. Interestingly, the predictive performance was further improved by combining the radiomic signature with the clinical features mentioned above as a combined nomogram, achieving an AUC of 0.919 (95% CI, 0.916–0.922) and 0.875 (95% CI, 0.867–0.883) in the training and validation cohorts, respectively.
Recent developments in radiomics attract much interests in tumor detection, subtype classification, therapeutic response assessment, prediction of clinical outcome and tumor monitoring, etc. Most of them were attempt to stratify the biological behavior and optimize tailored therapeutic strategies for these heterogenous tumors such as PNETs. Traditional radiographic assessment [including CT (15) and MRI (17)] which commonly relies on visual evaluation, was previously reported to predict the biological aggressiveness of PNETs. Moreover, (18)F-FDG-PET/CT and (68)Ga-DOTANOC-PET/CT were reported to be useful in predicting tumor grade (14). However, the results vary a lot and the accuracy remains challenging, as the prediction was mainly established based on visual observation rather than quantitative information.
Radiomics and artificial intelligence (AI) automatically extract high-throughput quantitative image data. Just as limited studies reported previously, it could be more useful for differentiating pathologic grading in patients with PNETs than routine CT image features alone (31, 32). Whereas, combining feature engineering and machine learning is a widely used scheme in radiomics-aided diagnosis (32). Deep learning features are highly versatile, their ability to solve specific problems is relatively weak (33). In contrast, building an interpretable AI model based on feature engineering is relatively easy. The output of the model is expected to be understood by physicians in clinical applications. Nomograms based on linear models intuitively illustrate what drives the recognition in machine learning. We build a nomogram based on the group 2 model in plain phase, as shown in Figure 3. Wan’s research (34) investigated the performance of the combination of conventional handcrafted and learning-based features in disease recognition. For a specific research question, they emphasised that developing specific feature selection and model optimization approaches was necessary to achieve high accuracy and robustness. Consistent with this, the present paper proposed our optimized approaches according to the PNET grading issue (as illustrated in Figure 1).
As depicted in Table 1, our data showed that tumor size in grade 2/3 group was significantly larger than that in grade 1 group (p = 0.028). Dilated MPD/BD and poorly defined tumor margin were more frequently detected in patients with grade 2/3 PNETs than those with grade 1 (p = 0.02 and p = 0.013, respectively). Consistent results occurred in both training and validation sets in the present study. Moreover, research by Kim and colleague (15) identified the three indentical tumor CT features above as predictors of higher tumor grade of PNETs. Of note, the assessment of these features was relatively objective and the data can be automatically acquired in bulk. On the contrary, the data of tumor T stage, TNM stage, and diagnosis of insulinoma were obtained partly by doctors’ experience, although these features were suggested to be significantly different between grade 2/3 PNETs and grade 1 group in our study (Table 1). Therefore, to improve the predictive performance, we establish a combined nomogram model that integrates radiomic signature with the former three relatively objective clinical features (including tumor size, tumor margin, and dilated main pancreatic duct/bile duct) (Table 2). To our knowledge, our present comprehensive nomogram is the first study that integrates radiomic signature based on plain CT images with objective clinical features for noninvasive and preoperative prediction of pathologic grades for each PNET patients with high accuracy (both in training and independent validation set). Wenjie Liang and colleagues (35) reported a nomogram combining radiomic signature based on contrast-enhanced CT and clinical stage. Plain CT has lower cost and more convenience than contrast-enhanced CT. Also, accurate preoperative TNM staging of the tumor is difficult, as the preoperative assessment of “N” and “M” status remains challenging. Interestingly, Zhang’s research (36) depicted impressive results based on enhanced CT radiomic features with 3D modeling.
As is known to us, a quite different therapeutic strategy could be applied for PNETs of grades 1 and 2/3. For clinical practice, the present combined nomogram may facilitate personalized treatment decisions for each patient with this heterogeneous tumor. It is noninvasive and could identify PNETs of grades 1 and 2/3 with high accuracy preoperatively. According to ENET guidelines in terms of PNET, NF-PNETs of less than 2 cm with grade 1 were optimized candidates for a “wait and see” policy. Moreover, parenchyma-sparing procedure such as enucleation could be an alternative for PNET with grade 1, while radical resection with formal lymphadenectomy was recommended for PNET with grade 2/3. In addition, the therapeutic strategies for the advanced PNETs of graded 1 and 2/3 varied dramatically (palliative surgery, somatostatin analog, targeted therapy, or chemotherapy). Our present combined model may facilitate tailored surgical decisions. Additionally, given the spatial and temporal heterogeneity of the specific tumor, the noninvasive model can be used repeatedly for tumor monitoring (especially for the patient initially recommended to wait and see) and to dynamically optimize therapeutic regimen for patients with advanced PNETs.
A major limitation of the present study was the relatively insufficient sample size. In addition, given that the G3 group was small (approximately 10% of PNETs in our series and as previously reported), our present nomogram model was established to stratify PNET patients into G1 and G2/3 groups. To better optimize personalized therapeutic strategies, a nomogram to separate G2 and G3 groups is further needed to be established based on lager samples. We are trying to collect more cases from multicenters and explore more appropriate methods to conduct further studies. Thirdly, we used single-layer CT image in this study, while 3D modeling may more comprehensively reflect the overall characteristics of the tumor, it is worth exploring whether it can obtain a more powerful predictive capability. On the other hand, manual tumor segmentation for 3D modeling was time consuming, and it was not applied for small tumors without thin-slice CT scans.
The developed combined nomogram that integrates radiomic signature based on plain CT images with clinical features (including T stage and dilated main pancreatic duct/bile duct status) can effectively predict the pathologic grades of PNETs preoperatively with powerful predictive capability. The noninvasive predictive model could assist clinicians to optimize tailored therapeutic strategies and facilitate surgical decision-making for each patient with PNETs in practice. It intuitively illustrates what drives the recognition in the prediction, which is potentially valuable in actual clinical applications and precision medicine in the future.
The original contributions presented in the study are included in the article/Supplementary Material. Further inquiries can be directed to the corresponding authors.
Ethical review and approval was not required for the study on human participants in accordance with the local legislation and institutional requirements.
XW, J-JQ, DC, X-BL, and N-WK: study concept and design, data analysis and interpretation, and drafting of the manuscript. XW, J-JQ, C-LT, Q-QT, S-JR, and Y-HC: substantial contribution to data acquisition and interpretation and critical revision of the manuscript. XW and J-JQ: substantial contribution to data acquisition and data analysis. All authors: final approval of the manuscript and agreement with all the aspects of the work. All authors contributed to the article and approved the submitted version.
This work was supported in part by research grants from the National Natural Science Foundation of China (82002579), the China Postdoctoral Science Foundation Funded Project (2019M663519), the Science and Technology Support Project of Sichuan Province (2020YFS0262), and the Post-Doctor Research Project, West China Hospital, Sichuan University (2019HXBH044).
The authors declare that the research was conducted in the absence of any commercial or financial relationships that could be construed as a potential conflict of interest.
All claims expressed in this article are solely those of the authors and do not necessarily represent those of their affiliated organizations, or those of the publisher, the editors and the reviewers. Any product that may be evaluated in this article, or claim that may be made by its manufacturer, is not guaranteed or endorsed by the publisher.
The Supplementary Material for this article can be found online at: https://www.frontiersin.org/articles/10.3389/fonc.2022.843376/full#supplementary-material
1. Vortmeyer AO, Huang S, Lubensky I, Zhuang Z. Non-Islet Origin of Pancreatic Islet Cell Tumors. J Clin Endocrinol Metab (2004) 89(4):1934–8. doi: 10.1210/jc.2003-031575
2. Rindi G, Falconi M, Klersy C, Albarello L, Boninsegna L, Buchler MW, et al. TNM Staging of Neoplasms of the Endocrine Pancreas: Results From a Large International Cohort Study. J Natl Cancer Institute (2012) 104(10):764–77. doi: 10.1093/jnci/djs208
3. Fan JH, Zhang YQ, Shi SS, Chen YJ, Yuan XH, Jiang LM, et al. A Nation-Wide Retrospective Epidemiological Study of Gastroenteropancreatic Neuroendocrine Neoplasms in China. Oncotarget (2017) 8(42):71699–708. doi: 10.18632/oncotarget.17599
4. Dasari A, Shen C, Halperin D, Zhao B, Zhou S, Xu Y, et al. Trends in the Incidence, Prevalence, and Survival Outcomes in Patients With Neuroendocrine Tumors in the United States. JAMA Oncol (2017) 3(10):1335–42. doi: 10.1001/jamaoncol.2017.0589
5. Cives M, Strosberg JR. Gastroenteropancreatic Neuroendocrine Tumors. CA: Cancer J Clin (2018) 68(6):471–87. doi: 10.3322/caac.21493
6. Yang Z, Tang LH, Klimstra DS. Effect of Tumor Heterogeneity on the Assessment of Ki67 Labeling Index in Well-Differentiated Neuroendocrine Tumors Metastatic to the Liver: Implications for Prognostic Stratification. Am J Surg Pathol (2011) 35(6):853–60. doi: 10.1097/PAS.0b013e31821a0696
7. Partelli S, Gaujoux S, Boninsegna L, Cherif R, Crippa S, Couvelard A, et al. Pattern and Clinical Predictors of Lymph Node Involvement in Nonfunctioning Pancreatic Neuroendocrine Tumors (NF-PanNETs). JAMA Surg (2013) 148(10):932–9. doi: 10.1001/jamasurg.2013.3376
8. Pulvirenti A, Javed AA, Landoni L, Jamieson NB, Chou JF, Miotto M, et al. Multi-Institutional Development and External Validation of a Nomogram to Predict Recurrence After Curative Resection of Pancreatic Neuroendocrine Tumors. Ann Surg (2019) 274(6):1051–7. doi: 10.1097/SLA.0000000000003579
9. Tan QQ, Wang X, Yang L, Chen YH, Tan CL, Ke NW, et al. Predicting Survival in Non-Functional Pancreatic Neuroendocrine Tumours. ANZ J Surg (2020) 90(10):2026–31. doi: 10.1111/ans.16072
10. Bosman FT, Carneiro F, Hruban RH, Theise ND. WHO Classifcation of Tumours of the Digestive System. Lyon: International Agency for Research on Cancer (2010).
11. Marchegiani G, Landoni L, Andrianello S, Masini G, Cingarlini S, D'Onofrio M, et al. Patterns of Recurrence After Resection for Pancreatic Neuroendocrine Tumors: Who, When, and Where? Neuroendocrinology (2019) 108(3):161–71. doi: 10.1159/000495774
12. Heidsma CM, Tsilimigras DI, Rocha F, Abbott DE, Fields R, Smith PM, et al. Clinical Relevance of Performing Endoscopic Ultrasound-Guided Fine-Needle Biopsy for Pancreatic Neuroendocrine Tumors Less Than 2 Cm. J Surg Oncol (2020) 122(7):1393–400. doi: 10.1002/jso.26158
13. Crinò SF, Ammendola S, Meneghetti A, Bernardoni L, Conti Bellocchi MC, Gabbrielli A, et al. Comparison Between EUS-Guided Fine-Needle Aspiration Cytology and EUS-Guided Fine-Needle Biopsy Histology for the Evaluation of Pancreatic Neuroendocrine Tumors. Pancreatol Off J Int Assoc Pancreatol (IAP) [et al] (2021) 21:443–50. doi: 10.1016/j.pan.2020.12.015
14. Majala S, Seppänen H, Kemppainen J, Sundström J, Schalin-Jäntti C, Gullichsen R, et al. Prediction of the Aggressiveness of Non-Functional Pancreatic Neuroendocrine Tumors Based on the Dual-Tracer PET/Ct. EJNMMI Res (2019) 9(1):116. doi: 10.1186/s13550-019-0585-7
15. Kim DW, Kim HJ, Kim KW, Byun JH, Song KB, Kim JH, et al. Neuroendocrine Neoplasms of the Pancreas at Dynamic Enhanced CT: Comparison Between Grade 3 Neuroendocrine Carcinoma and Grade 1/2 Neuroendocrine Tumour. Eur Radiol (2015) 25(5):1375–83. doi: 10.1007/s00330-014-3532-z
16. Jang KM, Kim SH, Lee SJ, Choi D. The Value of Gadoxetic Acid-Enhanced and Diffusion-Weighted MRI for Prediction of Grading of Pancreatic Neuroendocrine Tumors. Acta radiologica (Stockholm Sweden 1987) (2014) 55(2):140–8. doi: 10.1177/0284185113494982
17. Lotfalizadeh E, Ronot M, Wagner M, Cros J, Couvelard A, Vullierme MP, et al. Prediction of Pancreatic Neuroendocrine Tumour Grade With MR Imaging Features: Added Value of Diffusion-Weighted Imaging. Eur Radiol (2017) 27(4):1748–59. doi: 10.1007/s00330-016-4539-4
18. Lambin P, Leijenaar RTH, Deist TM, Peerlings J, de Jong EEC, van Timmeren J, et al. Radiomics: The Bridge Between Medical Imaging and Personalized Medicine. Nat Rev Clin Oncol (2017) 14(12):749–62. doi: 10.1038/nrclinonc.2017.141
19. Aerts HJ, Velazquez ER, Leijenaar RT, Parmar C, Grossmann P, Carvalho S, et al. Decoding Tumour Phenotype by Noninvasive Imaging Using a Quantitative Radiomics Approach. Nat Commun (2014) 5:4006. doi: 10.1038/ncomms5644
20. Liu Z, Zhang XY, Shi YJ, Wang L, Zhu HT, Tang Z, et al. Radiomics Analysis for Evaluation of Pathological Complete Response to Neoadjuvant Chemoradiotherapy in Locally Advanced Rectal Cancer. Clin Cancer Res an Off J Am Assoc Cancer Res (2017) 23(23):7253–62. doi: 10.1158/1078-0432.CCR-17-1038
21. Huang YQ, Liang CH, He L, Tian J, Liang CS, Chen X, et al. Development and Validation of a Radiomics Nomogram for Preoperative Prediction of Lymph Node Metastasis in Colorectal Cancer. J Clin Oncol Off J Am Soc Clin Oncol (2016) 34(18):2157–64. doi: 10.1200/JCO.2015.65.9128
22. Ding J, Xing Z, Jiang Z, Chen J, Pan L, Qiu J, et al. CT-Based Radiomic Model Predicts High Grade of Clear Cell Renal Cell Carcinoma. Eur J Radiol (2018) 103:51–6. doi: 10.1016/j.ejrad.2018.04.013
23. Huang X, Cheng Z, Huang Y, Liang C, He L, Ma Z, et al. CT-Based Radiomics Signature to Discriminate High-Grade From Low-Grade Colorectal Adenocarcinoma. Acad Radiol (2018) 25(10):1285–97. doi: 10.1016/j.acra.2018.01.020
24. Banik S, Rangayyan RM, Desautels JE. Measures of Angular Spread and Entropy for the Detection of Architectural Distortion in Prior Mammograms. Int J Comput Assist Radiol Surg (2013) 8(1):121–34. doi: 10.1007/s11548-012-0681-x
25. Szczypinski PM, Strzelecki M, Materka A, Klepaczko A. MaZda–a Software Package for Image Texture Analysis. Comput Methods Programs BioMed (2009) 94(1):66–76. doi: 10.1016/j.cmpb.2008.08.005
26. Yang X, Tridandapani S, Beitler JJ, Yu DS, Yoshida EJ, Curran WJ, et al. Ultrasound GLCM Texture Analysis of Radiation-Induced Parotid-Gland Injury in Head-and-Neck Cancer Radiotherapy: An In Vivo Study of Late Toxicity. Med Phys (2012) 39(9):5732–9. doi: 10.1118/1.4747526
27. Yao JC, Hassan M, Phan A, Dagohoy C, Leary C, Mares JE, et al. One Hundred Years After “Carcinoid”: Epidemiology of and Prognostic Factors for Neuroendocrine Tumors in 35,825 Cases in the United States. J Clin Oncol (2008) 26(18):3063–72. doi: 10.1200/JCO.2007.15.4377
28. Pulvirenti A, Marchegiani G, Pea A, Allegrini V, Esposito A, Casetti L, et al. Clinical Implications of the 2016 International Study Group on Pancreatic Surgery Definition and Grading of Postoperative Pancreatic Fistula on 775 Consecutive Pancreatic Resections. Ann Surg (2018) 268(6):1069–75. doi: 10.1097/SLA.0000000000002362
29. Jiao Y, Shi C, Edil BH, de Wilde RF, Klimstra DS, Maitra A, et al. DAXX/ATRX, MEN1, and mTOR Pathway Genes Are Frequently Altered in Pancreatic Neuroendocrine Tumors. Sci (New York NY) (2011) 331(6021):1199–203. doi: 10.1126/science.1200609
30. Scarpa A, Chang DK, Nones K, Corbo V, Patch AM, Bailey P, et al. Whole-Genome Landscape of Pancreatic Neuroendocrine Tumours. Nature (2017) 543(7643):65–71. doi: 10.1038/nature21063
31. Zhao Z, Bian Y, Jiang H, Fang X, Li J, Cao K, et al. CT-Radiomic Approach to Predict G1/2 Nonfunctional Pancreatic Neuroendocrine Tumor. Acad Radiol (2020) 27(12):e272-e81. doi: 10.1016/j.acra.2020.01.002
32. Bi WL, Hosny A, Schabath MB, Giger ML, Birkbak NJ, Mehrtash A, et al. Artificial Intelligence in Cancer Imaging: Clinical Challenges and Applications. CA: Cancer J Clin (2019) 69(2):127–57. doi: 10.3322/caac.21552
33. Niethammer M, Kwitt R, Vialard FX. Metric Learning for Image Registration. Proc IEEE Comput Soc Conf Comput Vision Pattern Recognition (2019) 2019:8455–64. doi: 10.1109/CVPR.2019.00866
34. Wan Y, Yang P, Xu L, Yang J, Luo C, Wang J, et al. Radiomics Analysis Combining Unsupervised Learning and Handcrafted Features: A Multiple-Disease Study. Med Phys (2021) 48:7003–15. doi: 10.1002/mp.15199
35. Liang W, Yang P, Huang R, Xu L, Wang J, Liu W, et al. A Combined Nomogram Model to Preoperatively Predict Histologic Grade in Pancreatic Neuroendocrine Tumors. Clin Cancer Res an Off J Am Assoc Cancer Res (2019) 25(2):584–94. doi: 10.1158/1078-0432.CCR-18-1305
Keywords: pancreas, pancreatic neuroendocrine tumor, tumor grade, radiomics, CT
Citation: Wang X, Qiu J-J, Tan C-L, Chen Y-H, Tan Q-Q, Ren S-J, Yang F, Yao W-Q, Cao D, Ke N-W and Liu X-B (2022) Development and Validation of a Novel Radiomics-Based Nomogram With Machine Learning to Preoperatively Predict Histologic Grade in Pancreatic Neuroendocrine Tumors. Front. Oncol. 12:843376. doi: 10.3389/fonc.2022.843376
Received: 25 December 2021; Accepted: 01 March 2022;
Published: 31 March 2022.
Edited by:
Min Tang, Jiangsu University, ChinaReviewed by:
Yifeng Tao, Carnegie Mellon University, United StatesCopyright © 2022 Wang, Qiu, Tan, Chen, Tan, Ren, Yang, Yao, Cao, Ke and Liu. This is an open-access article distributed under the terms of the Creative Commons Attribution License (CC BY). The use, distribution or reproduction in other forums is permitted, provided the original author(s) and the copyright owner(s) are credited and that the original publication in this journal is cited, in accordance with accepted academic practice. No use, distribution or reproduction is permitted which does not comply with these terms.
*Correspondence: Xu-Bao Liu, eGJsaXVAbWVkbWFpbC5jb20uY24=; Neng-Wen Ke, a2VuZW5nd2VuQHNjdS5lZHUuY24=
†These authors have contributed equally to this work and share first authorship
Disclaimer: All claims expressed in this article are solely those of the authors and do not necessarily represent those of their affiliated organizations, or those of the publisher, the editors and the reviewers. Any product that may be evaluated in this article or claim that may be made by its manufacturer is not guaranteed or endorsed by the publisher.
Research integrity at Frontiers
Learn more about the work of our research integrity team to safeguard the quality of each article we publish.