 Hongjiao Zhang1,2Chengrui Fu2Min Fan2
 Liyong Lu3Yiru Chen2
 Chengxin Liu2Hongfu Sun2Qian Zhao2
 Dan Han2
 Baosheng Li2
 Wei Huang2*
- 1Shandong Cancer Hospital and Institute, Shandong First Medical University and Shandong Academy of Medical Sciences, Jinan, China
- 2Department of Radiation Oncology, Shandong Cancer Hospital and Institute, Shandong First Medical University and Shandong Academy of Medical Sciences, Jinan, China
- 3West China School of Public Health, Sichuan University, Chengdu, China
Purpose: To compare the difference between magnetic resonance imaging (MRI) and computed tomography (CT) in delineating the target area of lung cancer with atelectasis.
Method: A retrospective analysis was performed on 15 patients with lung cancer accompanied by atelectasis. All positioning images were transferred to Eclipse treatment planning systems (TPSs). Six MRI sequences (T1WI, T1WI+C, T1WI+C Delay, T1WI+C 10 minutes, T2WI, DWI) were registered with positioning CT. Five radiation oncologists delineated the tumor boundary to obtain the gross tumor volume (GTV). Conformity index (CI) and dice coefficient (DC) were used to measure differences among observers.
Results: The differences in delineation mean volumes, CI, and DC among CT and MRIs were significant. Multiple comparisons were made between MRI sequences and CT. Among them, DWI, T2WI, and T1WI+C 10 minutes sequences were statistically significant with CT in mean volumes, DC, and CI. The mean volume of DWI, T2WI, and T1WI+C 10 minutes sequence in the target area is significantly smaller than that on the CT sequence, but the consistency is higher than that of CT sequences.
Conclusions: The recognition of atelectasis by MRI was better than that by CT, which could reduce interobserver variability of primary tumor delineation in lung cancer with atelectasis. Among them, DWI, T2WI, T1WI+C 10 minutes may be a better choice to improve the GTV delineation of lung cancer patients with atelectasis.
Introduction
For both men and women, lung cancer is the most common diagnosis of cancer and the leading cause of cancer deaths (1). Radiotherapy is an important treatment for patients with lung cancer, especially for patients with advanced unresectable lung cancer (2). The target description of lung cancer has great variability, especially for lung cancer patients with atelectasis (3–5). The variability of the contour structure may lead to insufficient doses, lower tumor control probability, or excessive doses, resulting in an increase in the probability of normal tissue complication (NTCP). The ability of CT to recognize soft tissue is so limited that it cannot distinguish tumor from atelectasis. Many scholars have begun to explore other imaging methods to distinguish tumors from atelectasis, such as PET-CT and MRI. Related studies have proved that compared with PET-CT, MRI has better spatial resolution and contrast between normal and cancerous tissues (6–9). It is more accurate and repeatable in delineating the target area of lung cancer (10).
However, there is no in-depth study to explore the effect of different MRI sequences on the interobserver difference of target delineation in lung cancer with atelectasis. The purpose of this study is to explore the differences between different MRI-CT fusion sequences and single CT, so as to select the optimal MRI sequence for GTV target delineation of lung cancer with atelectasis.
Materials and methods
Cohort of patients
We retrospectively included 15 lung cancer patients who underwent positioning CT and MRI scans between May 2019 and June 2021. Due to the small number of lung cancer patients who underwent MRI localization, only 15 patients who met the criteria for enrollment were included during the study period. The 15 patients recruited in the study were pathologically diagnosed with lung cancer and imaging diagnosed with atelectasis. The diagnosis of atelectasis was decided by a senior doctor in the imaging department. CT- and MRI-simulated localization images were scanned in the same supine position within a week. Among them, six MRI sequences (T1WI, T1WI+C, T1WI+C Delay, T1WI+C 10 minutes, T2WI, DWI) were all scanned completely during MRI location scanning. Patients with surgically removed or metastatic lung tumors, unclear tumor display, contraindications to MRI, or intolerance were excluded. All the 15 patients in the group were diagnosed with central lung cancer. Among them, one patient had not received treatment, 11 patients had received chemotherapy, one patient had received chemotherapy and immunotherapy, one patient had received chemotherapy and anti-angiogenesis therapy, and one patient had received chemotherapy, immunity, and anti-angiogenesis therapy. The detailed data of the patients are listed in Table 1.

Table 1 Clinical characteristics of the 15 included patients.
Imaging modalities
CT scan and imaging acquisition
All patients underwent CT simulation (Brilliance CT Big Bore; Philips Healthcare, DA Best) before radiotherapy. All of them were fixed with a vacuum negative pressure bag in supine position. Respiratory gating was used during the scan. The CT scan area covered at least the chest. The interslice thickness of the CT scan was 3 mm. At the end of the scan, the enhanced scan was performed by injecting 90 ml iohexol (350 mg/ml).
MRI scan and imaging acquisition
The supine position of MRI was the same as the simulated position of CT. A 3.0-T, 70-cm Bore MR scanner (750W, General Electric Co.) was used for MRI simulation positioning in our hospital. A 20-ml high-pressure injector was used to inject gadoterate meglumine (0.2 mmol/kg) at 2 ml/s followed by 20 ml saline to obtain the enhanced image. Meglumine gadolinate is a paramagnetic contrast agent. A low-dose injection only shortens the T1WI relaxation time and does not affect T2WI imaging. The MRI scanning sequence includes T1WI (WATER : BH AX LAVA-Flex), T1WI+C (WATER : BH AX LAVA-Flex-C), T1WI+C Delay (WATER : BH AX LAVA-Flex-C delay), T1WI+C 10 minutes (WATER : BH AX LAVA-Flex-C 10min), T2WI (RTr Ax T2 fs Propeller), and DWI, in which T1WI+C 10 minutes was specially scanned by our organization. T1WI+C, T1WI+C Delay, and T1WI+C 10 minutes sequences were scanned 15 s, 2 min, and 10 min after injection of a contrast medium, respectively. Because of the large endothelial space and immaturity of the vascular endothelium in the tumor, the contrast medium enters and exits faster than the normal tissue. During the early delayed imaging scan, the contrast medium enters the tumor tissue, and the normal lung tissue begins to strengthen, but the enhancement is not complete. At this time, the boundary between tumor and normal tissue is not clear. When scanning on the 10-min image, the normal lung tissue was completely enhanced, while the tumor tissue showed fast-in and fast-out realization. At this time, all the contrast media had been leaked, and the low signal of the tumor tissue was more obvious compared with that of the fibrous tissue and normal tissue, and the tumor boundary was clearer. We wonder whether T1WI+C 10 minutes sequences can also be used to distinguish lung cancer from atelectasis. This sequence has been proved to be helpful in the delineation of breast cancer lumpectomy cavity (11). The specific principle of the T1WI+C 10 minutes sequence needs to be further studied. The sequence of MRI scanning was T1WI, T1WI+C, T1WI+C Delay, DWI, T2WI, and T1WI+C 10 minutes. In addition, we used respiratory gating in MRI scans to reduce MRI motion artifacts. The patient needs to hold his breath for 18 s during each T1-enhanced correlation sequence scan of the chest. Respiratory trigger was used in T2WI and DWI sequence scanning. The slice thickness of all MRI sequences except DWI was 3 mm. The slice thickness of the DWI scan was 3.6 mm, and there was no scanning interval. In order to keep the consistency of the layer thickness, the DWI image was reconstructed to the 3-mm layer thickness. The repetition time (TR), echo time (TE), and matrix of T1WI, T1WI+C, T1WI+C Delay, and T1WI+C 10 minutes were 4.2 ms, 1.7 ms, 280 × 192, and the field of view (FOV) was 44 × 44, 44 × 44, 44 × 35.2, and 44 × 35.2, respectively. The TR, TE, and matrix of T2W were 7,059 ms, 79 ms, and 384 × 384, respectively. The DWI sequence TE was 60 ms, and the matrix was 128 × 128. The B value was 600 s/mm2.
Imaging fusion
We used respiratory gating in CT and MRI positioning scans to reduce motion artifacts. The analog positioning images of CT and MRI were uploaded to Eclipse treatment planning systems (TPSs). According to the anatomy of the sternum, rib, vertebral body, pulmonary artery, and tumor, each MRI sequence (T1WI, T1WI+C, T1WI+C Delay, T1WI+C 10 minutes, T2WI, DWI) was automatically registered with CT through the planning system, and the fusion stability was increased by manual correction.
Structure delineation
Five radiation oncologists come from our hospital with 17, 16, 14, 7, and 6 years of working experience, respectively. The five observers, all of whom have rich clinical experience and are good at target delineation radiotherapy, were chosen in order to reduce the intra-observer variability. This paper mainly discusses the differences between observations. The five radiation oncologists sketched the tumor contours on CT and CT-MRI fusion images, respectively. The boundary between tumor and atelectasis was determined by referring to the CT structure and coronal and sagittal MRI images when drawing CT-MRI fusion images. The target areas of CT and MRI-CT images were sketched on the same day. We stipulate that CT images are drawn first. Then, CT-MRI image fusion was performed. The fusion image was drawn in the order of T1WI, T1WI+C, T1WI+C Delay, T1WI+C 10 minutes, T2WI, and DWI sequences. According to previous reports, observers were trained in advance to outline only the primary tumor and not the metastatic lymph nodes (12–14). If the lymph node is fused with the primary tumor, it can be delineated (see Figure 1). Prior to the study, all observers had no access to the medical records of all patients and the contours of other observers. In the course of the study, all observers delineated the target independently and were not affected by other factors. The primary tumor that has been delineated in the target area is defined as the standard total target volume (GTV). In this article, the mean volume refers to the average volume delineated by the five observers. Conformity index (CI) and Dice coefficient (DC) were used in articles with similar research methods, which can be used to express the consistency of delineation between observations (15). The mean volume, CI, and DC of each sequence were compared to determine the variability between observers. Related studies have shown that the difference in GTV between different images is due to the shape of the target outline rather than the position of the target center (10). Therefore, in this paper, the volume of the target area is compared, but the center position of the target area is not compared separately. The values of DC and CI also reflected the overlap of the delineator’s target area. CI was equal to the ratio of the overlapping volume to the common volume of all observers. The value of DC was calculated using the ratio of overlapping volume and the average volume contoured by the five observers. The higher the CI and DC values, the higher the consistency of the five observers’ delineation in the target area of a certain sequence, and the smaller the difference. The specific formula of the parameter is as follows:
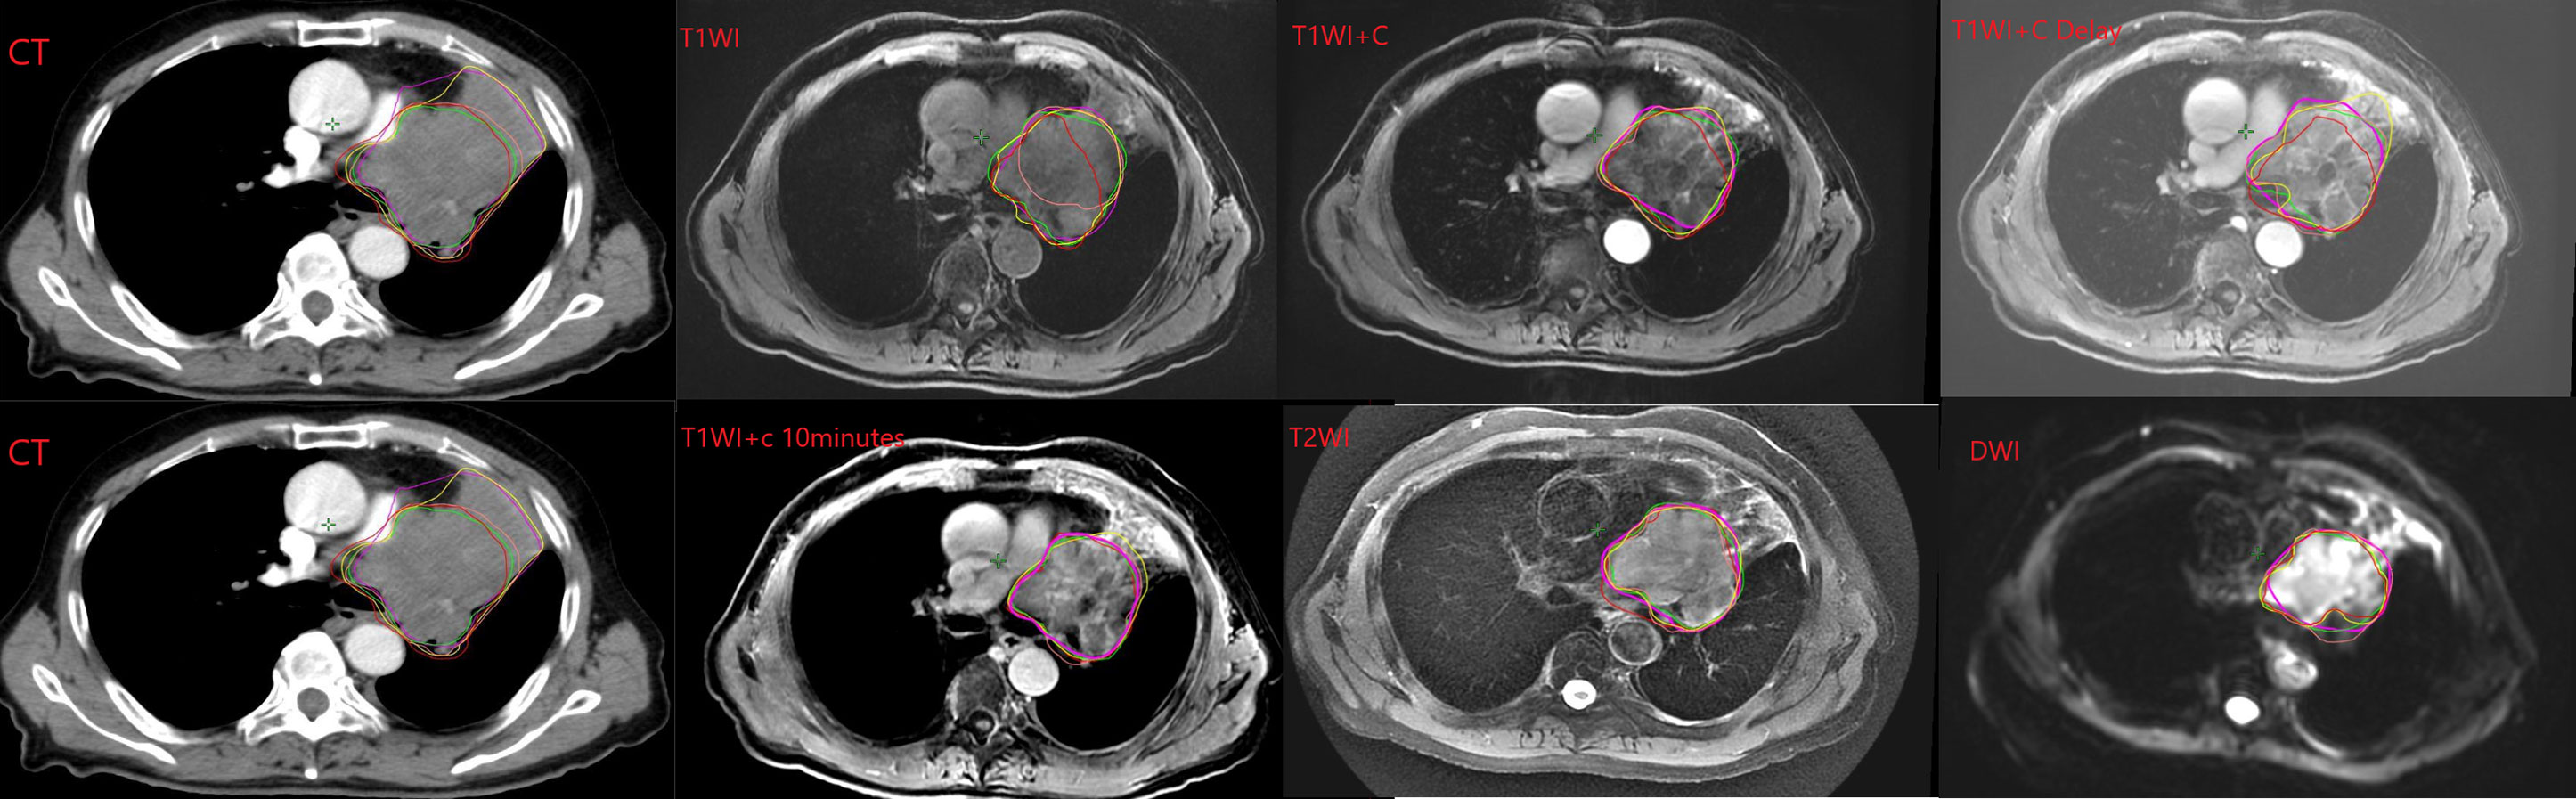
Figure 1 Example of GTV contoured on the different CT and MRI sequences by each observer. Note: The lines of different colors in the picture represent different observers.
Statistical analysis
All analyses were conducted using R software (version 4.0.2) and SPSS software (Version 25.0). P< 0.05 was used to determine statistical significance. The Shapiro–Wilk test was used to test the normality of the distribution of tumor volume, CI, and DC, respectively (16). The W values of the Shapiro–Wilk test for tumor volume, CI, and DC distribution were 0.57218 (P< 0.01), 0.97213 (P = 0.02592), and 0.96955 (P = 0.01611), respectively, suggesting that the distribution of tumor volume, DC, and CI is not normal, as shown in Figure 2. We used Friedman M test to compare the differences of different sequences in CI, DC, and tumor volume. The Wilcoxon rank-sum test was used to compare different MRI sequences with CT pairwise. The Bonferroni method was used to account for multiple comparisons; the corrected P-value was 0.0083. A P-value <0.0083 was considered to be statistically significant.
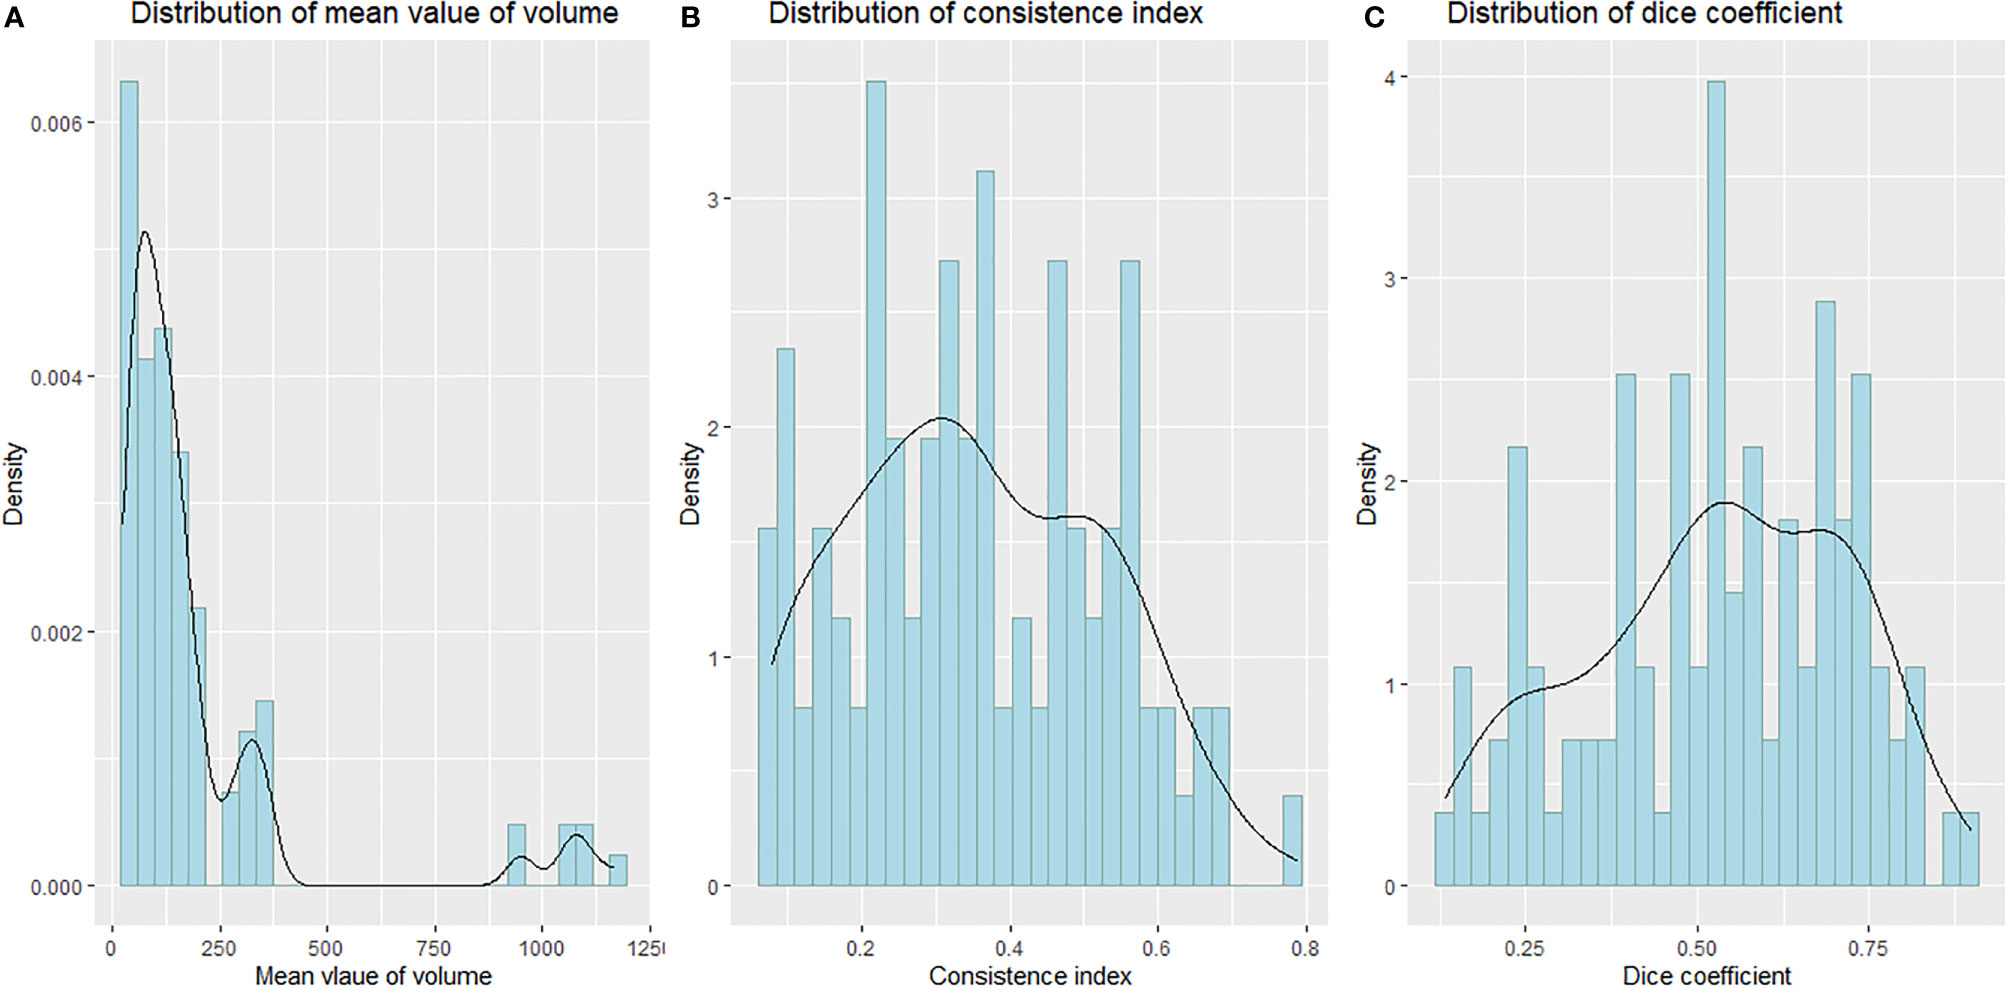
Figure 2 Probability density distribution curve histogram of the mean volume, CI, and DC.
Results
Patient’ delineation volume comparison
The median and quartile spacing of the volumes of CT and MRI sequences as well as the results of statistical analysis are shown in Table 2. The average GTV volume drawn by the five observers was significantly different between the fusion sequences of CT-MRI and CT alone (P<0.01).
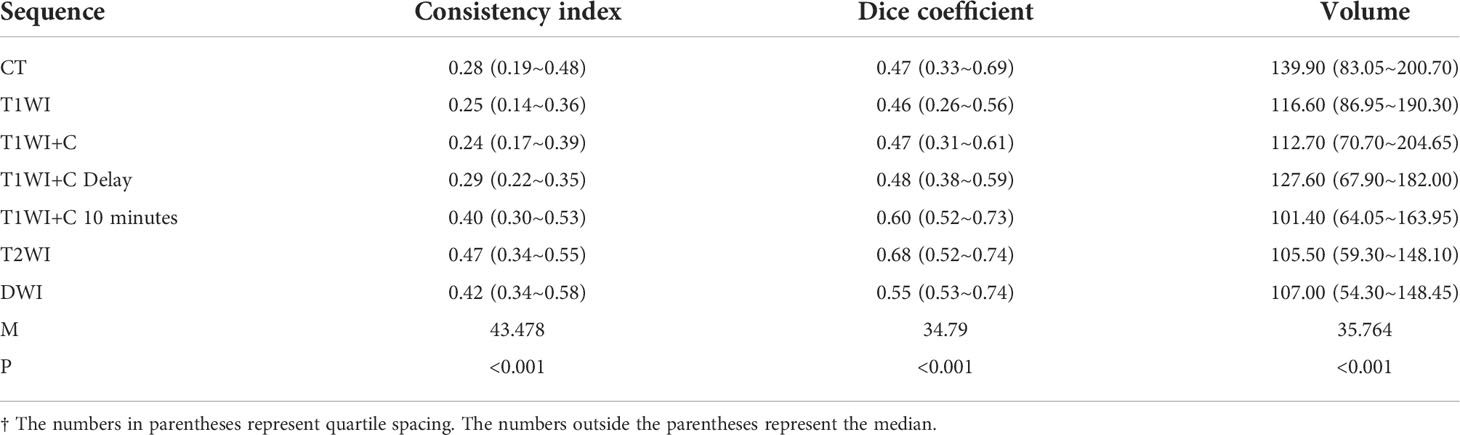
Table 2 Descriptive results of mean volumes, CI, and DC and results of Friedman test.
The six MRI sequences were compared with CT sequences in pairs. The results showed that there were statistical differences in the T1WI+C 10 minutes, T2WI, and DWI sequences compared with the CT sequences (P = 0.002, 0.002, 0.002 < 0.0083). As seen in Table 2, the median of the CT sequence was 139.9, while the median of the T1WI+C 10 minutes, T2WI, and DWI sequences was 101.40, 105.50, and 107.00, all less than that by CT. This shows that the volume sketched by T1WI+C 10 minutes, T2WI, and DWI sequences is smaller than that delineated by CT.
Consistency of GTVs
Every descriptive statistic of CI and DC is also found in Table 2. We can see from Figures 3 and 4 the box diagrams of CI and DC; it can be seen that the median value and variability of the DWI, T2WI, and T1WI+C 10-minute sequence are better than those of CT.
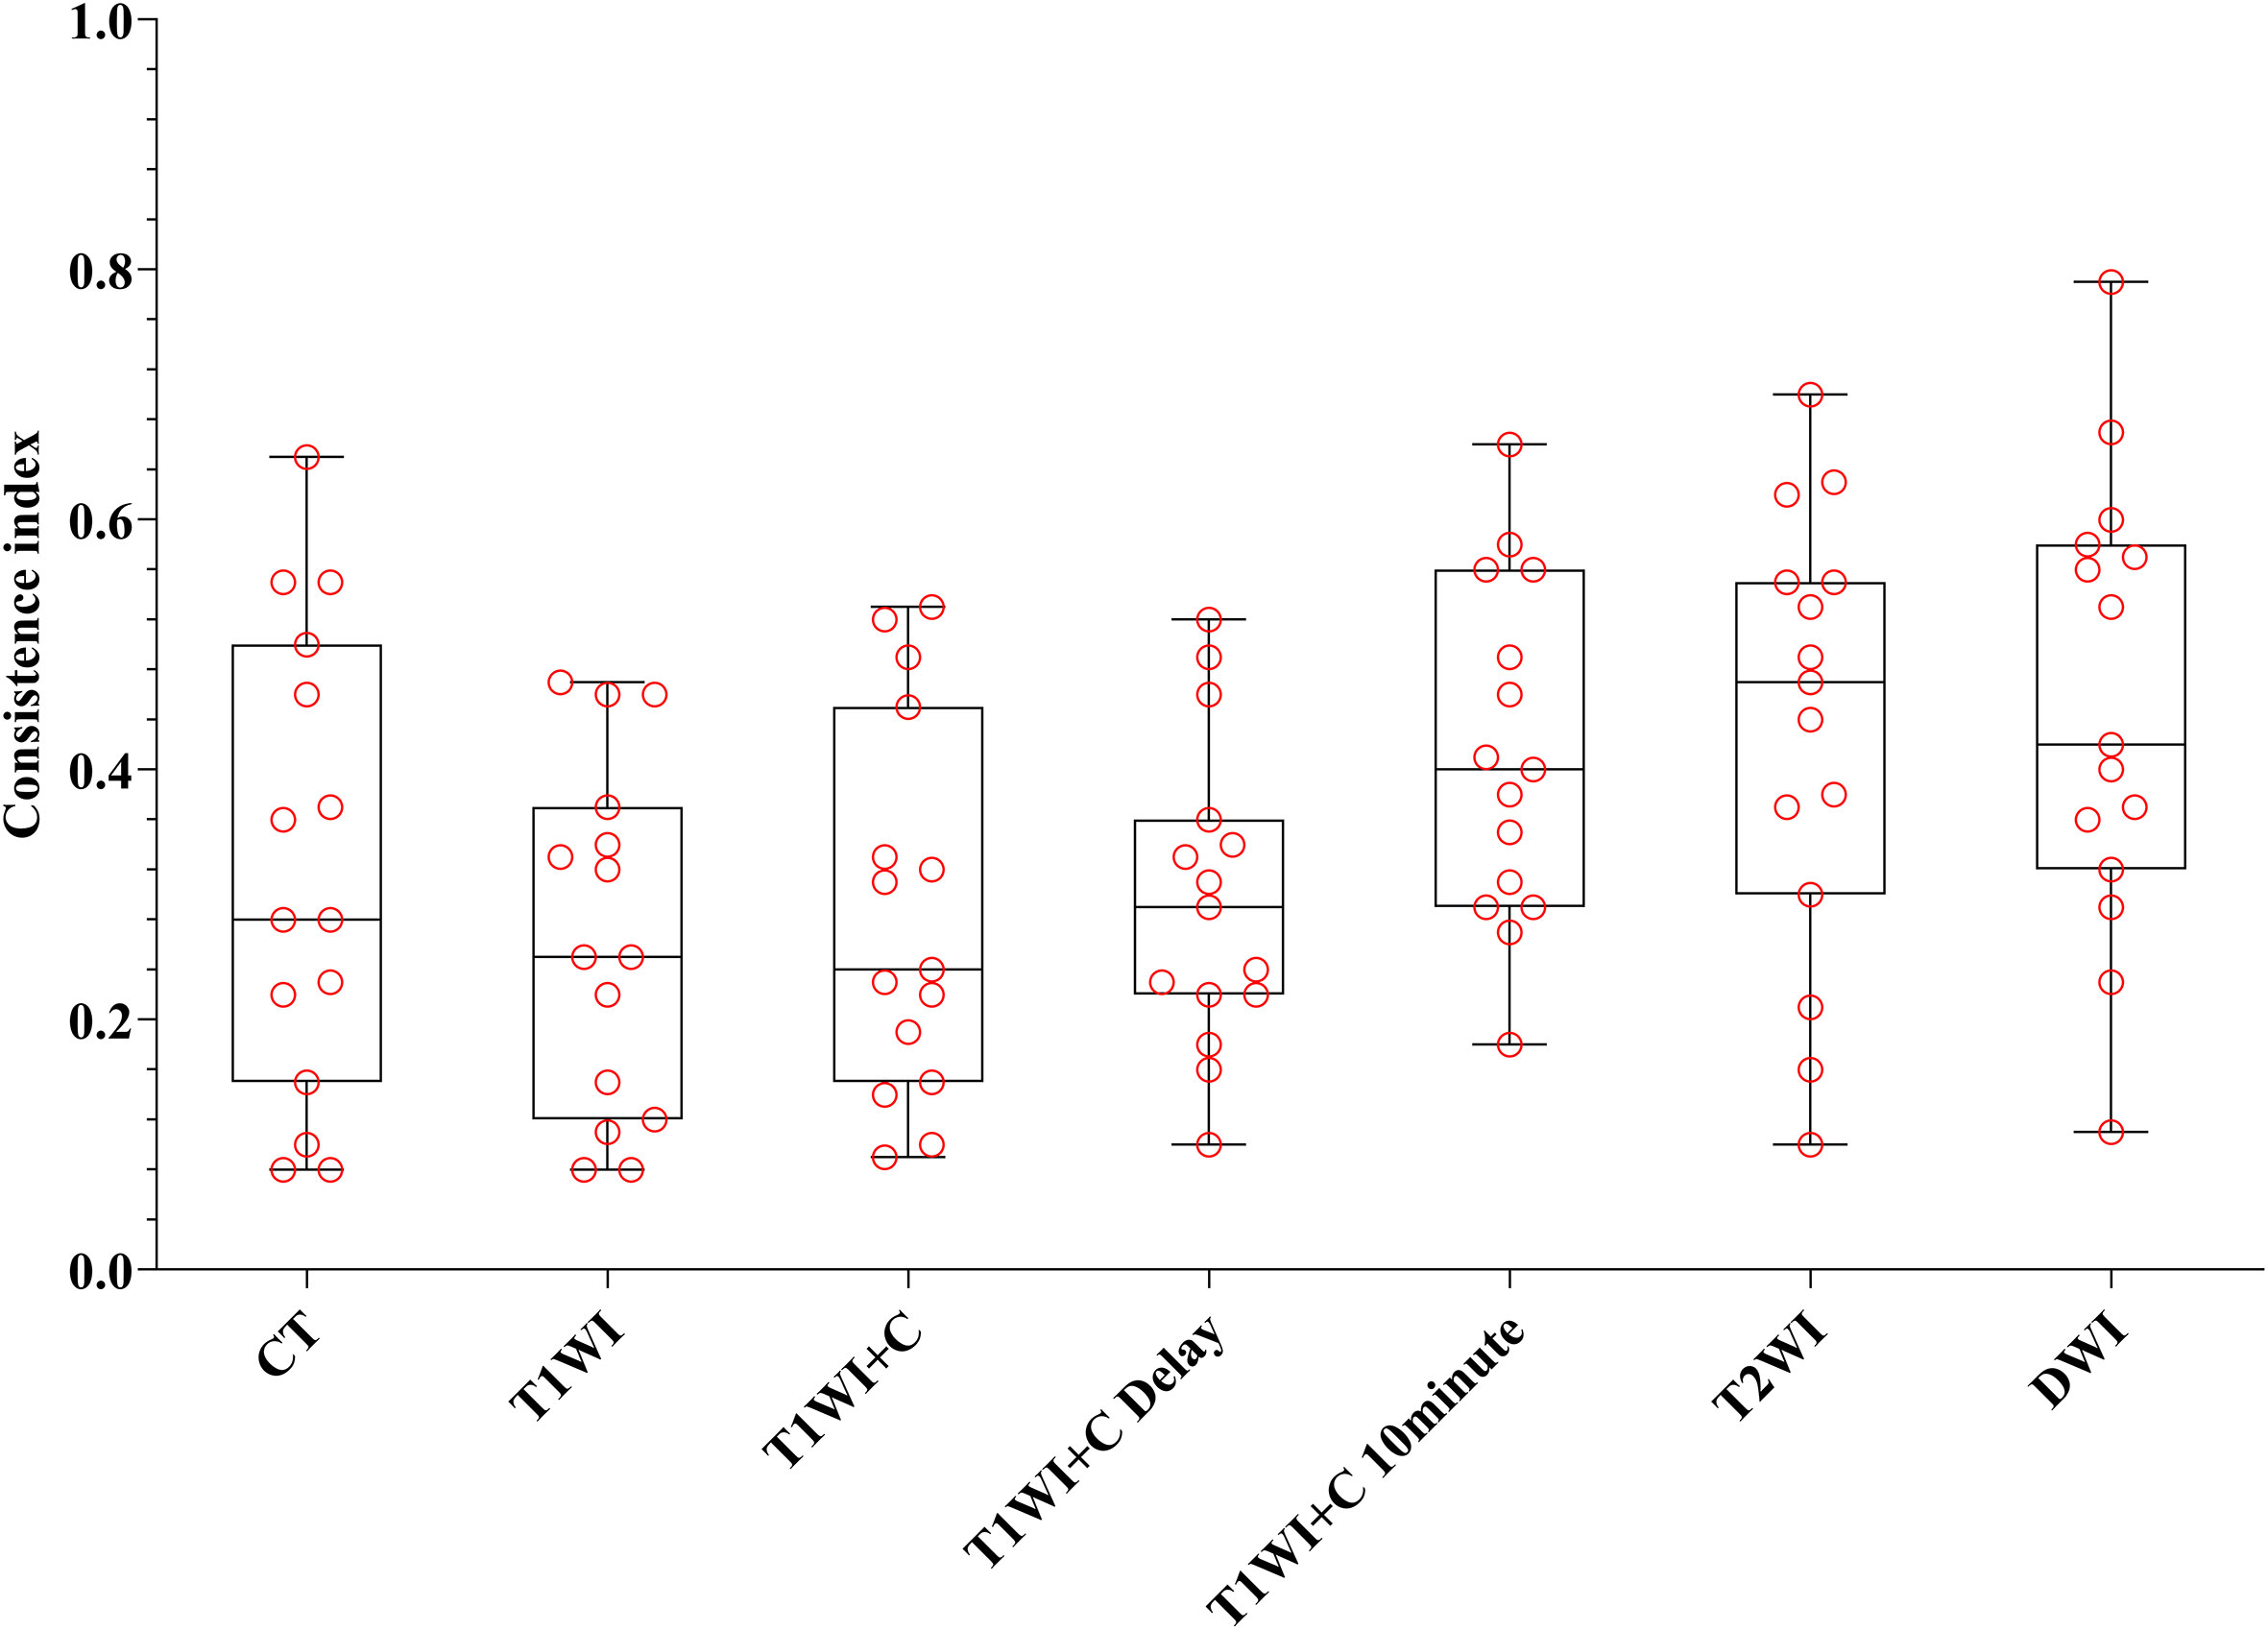
Figure 3 The boxplot of CI. The black line of the box is the median, and the length of the box represents the interquartile range.
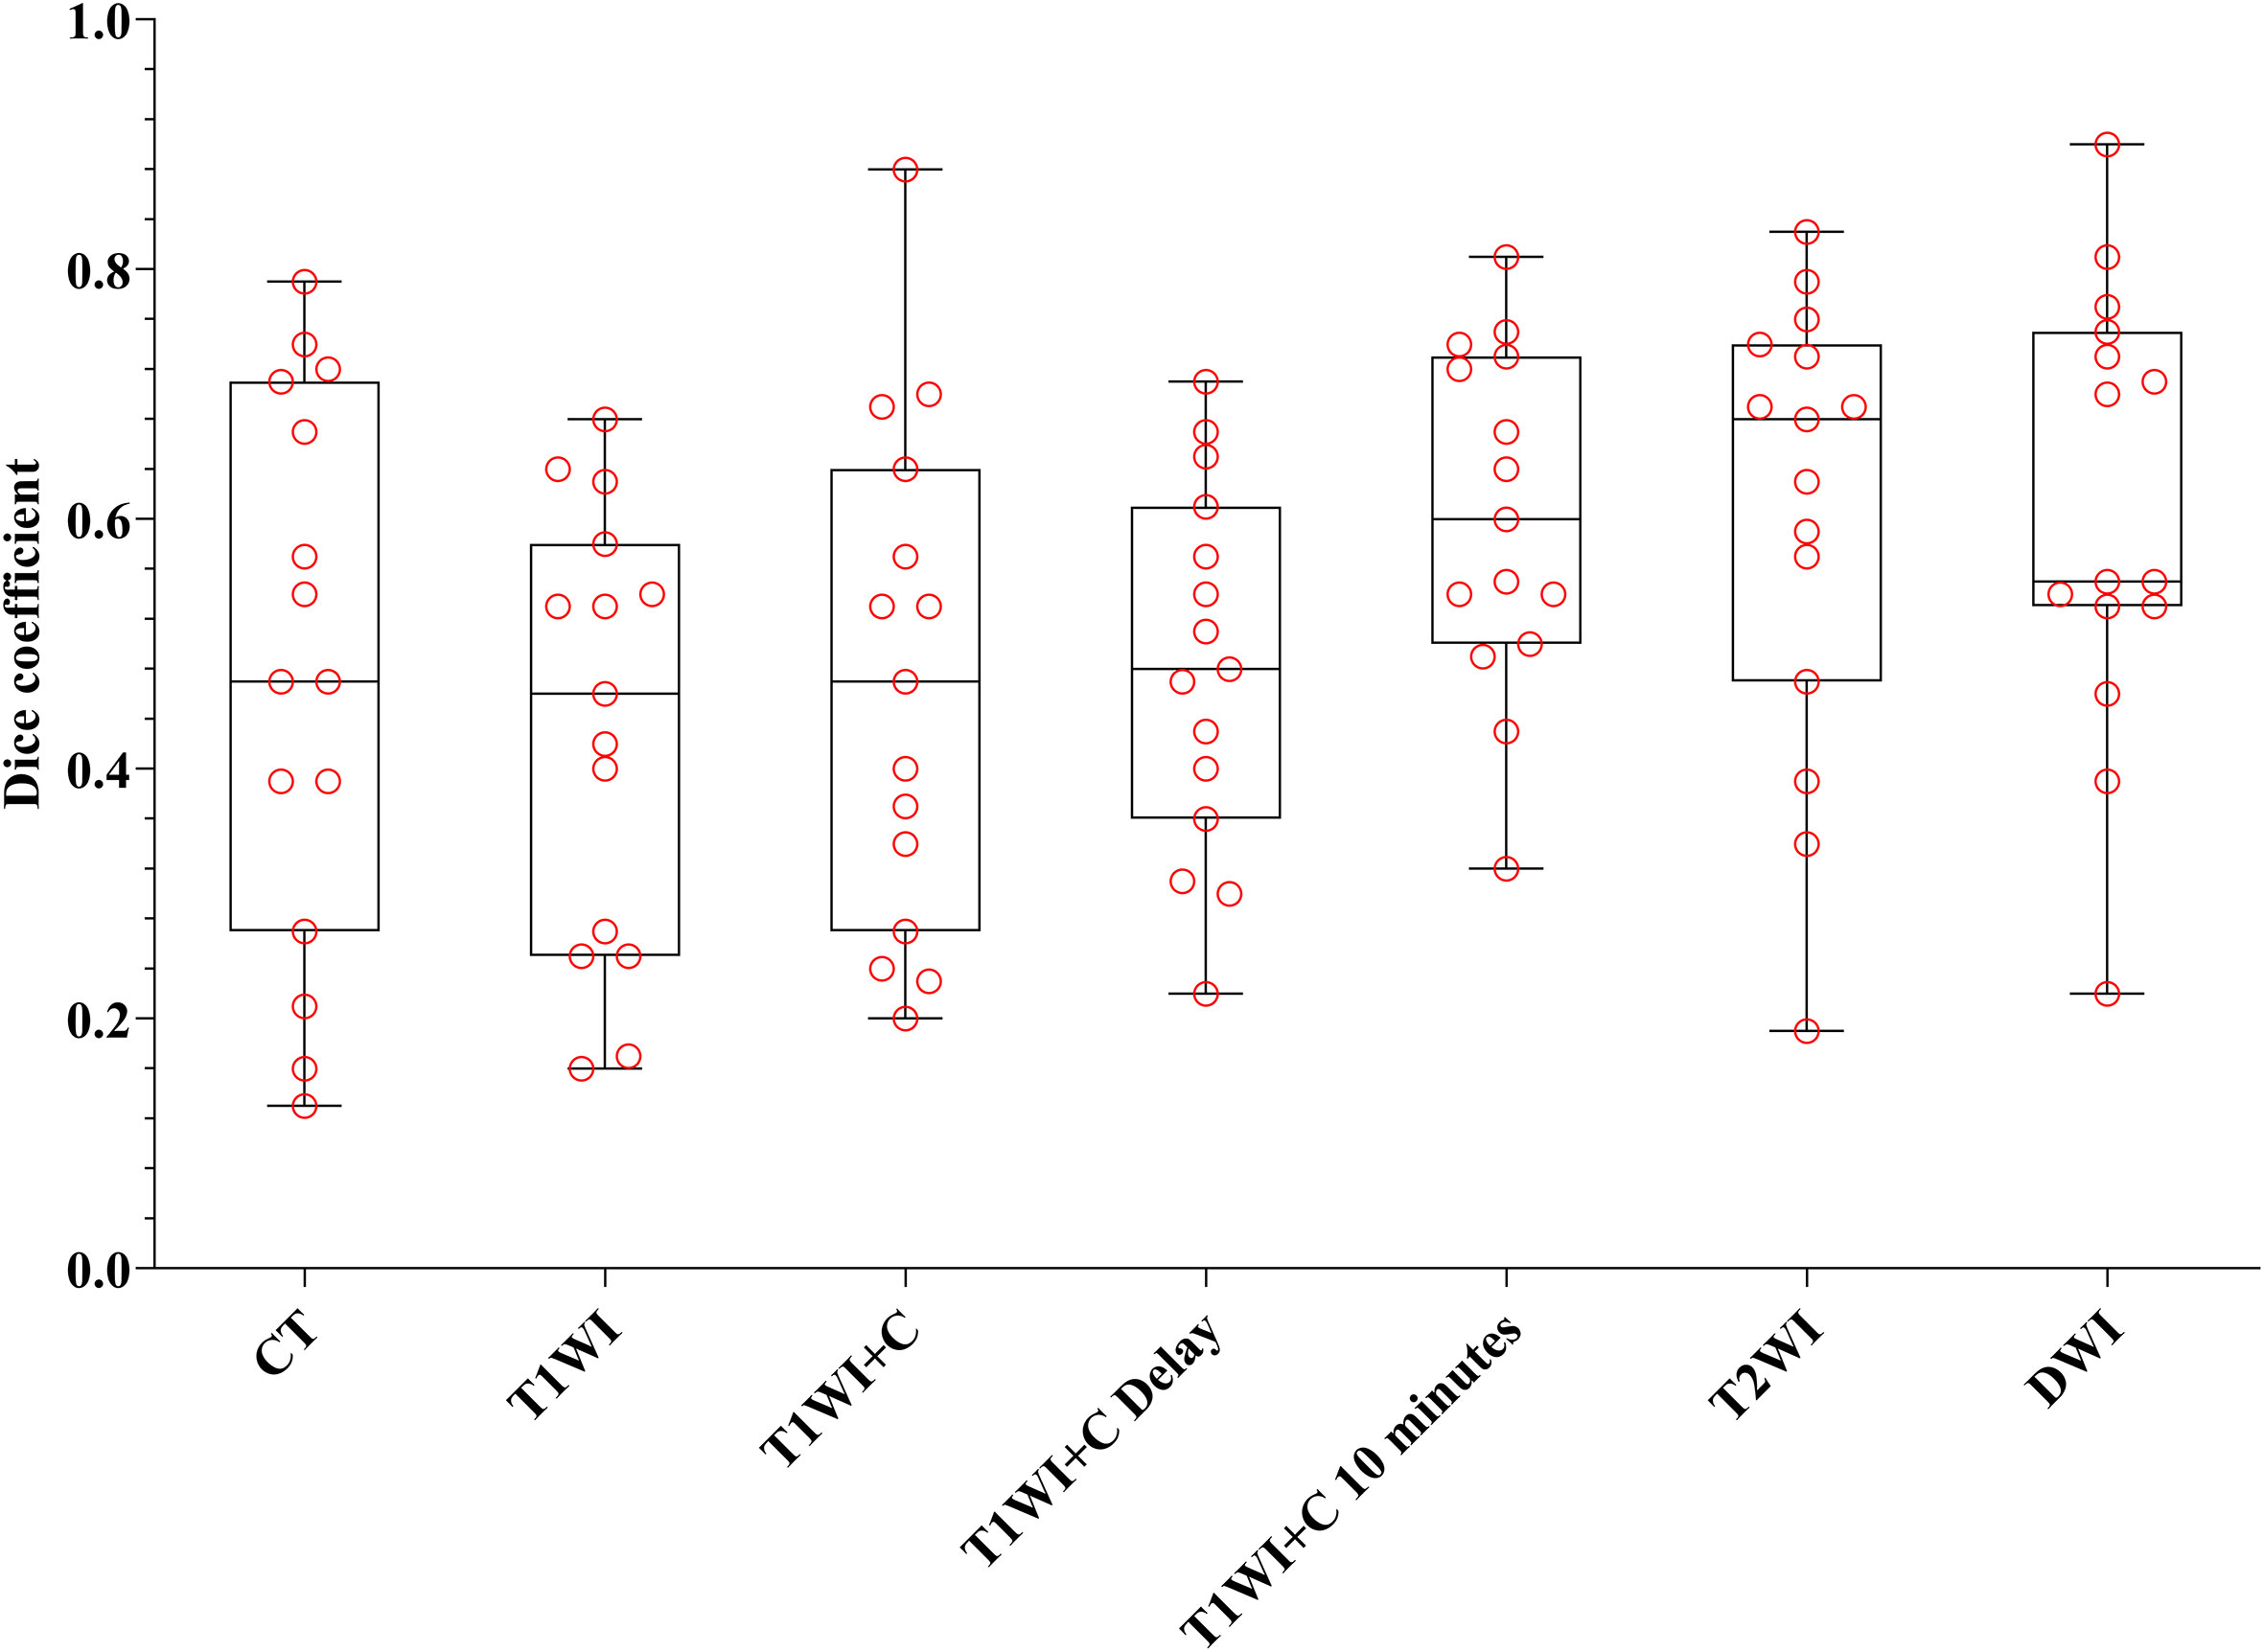
Figure 4 The boxplot of DC. The black line of the box is the median, and the length of the box represents the interquartile range.
Table 2 shows that there were statistical differences in consistency index and DC between CT and MRI sequences. Taking CT as a reference, six MRI sequences were compared with CT sequences in pairs. It is seen in Table 3 that the CI and DC values of the T1WI + C 10 minutes, T2WI, and DWI sequences were statistically different from those of the CT sequence. As mentioned above, it is seen in Figures 3 and 4 that the median of the three sequences is larger than that of CT. It can be concluded that the CI and DC values of the T1WI+C 10 minutes, T2WI, and DWI sequences are greater than those of the CT sequences.
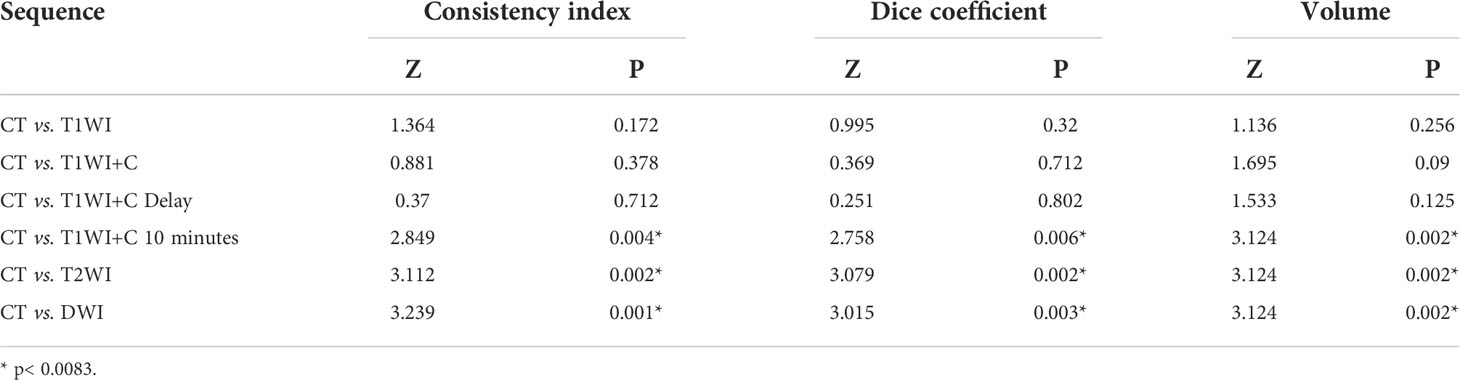
Table 3 The results of the Wilcoxon rank-sum test of mean volumes, CI, and DC.
Discussion
In this study, we compared the differences of target volume, CI, and DC in locating MRI and CT in patients with lung cancer with atelectasis. DWI, T2WI, and T1WI+C 10 minutes sequences were statistically significant with CT in volume, CI, and DC. We can conclude that contours of the observers on CT overestimate the GTV, while MRI, especially the DWI, T2WI, and T1WI+C 10 minutes sequences, can better delineate the target area of lung cancer with atelectasis.
GTV definition in lung cancer is one of the cornerstones in quality assurance of radiotherapy (17, 18). However, there is no unified target delineation standard for lung cancer patients with atelectasis. Contouring variability is significantly larger on the atelectasis interface for all modalities compared with other interfaces (19). Due to its poor soft resolution, CT alone may lead to large differences between observers or within observers. Therefore, many radiation oncologists use a variety of measures to improve the differentiation between tumors and atelectasis.
Many related studies have shown that MRI has a certain advantage in distinguishing atelectasis from tumor tissue because of its good soft tissue recognition ability (19–21). Among them, T2WI and DWI sequences have been proved to be helpful in the differentiation of lung cancer from atelectasis. As technology advances, radiation oncologists begin to experiment with image fusion to increase the accuracy of target delineation and reduce differences between observers. Steenbakkers et al. (18) believed that multimodal imaging and combining different imaging features may be the best way to define GTV most accurately. Karki et al.’s research also confirmed this view (22). According to the study of Fleckenstein et al. (23), the GTV sketched by DWI is much larger than the GTV sketched by PET-CT in non-small cell lung cancer. The safety and effectiveness of DWI-based radiotherapy planning need to be further verified by prospective studies. However, Basson et al. (24) have compared the GTV of lung cancer lesions on CT, MRI, and PET images. The results show that compared with PET, MRI seems to reduce the interobserver variability of GTV depiction of ill-defined lung tumors. MRI can be used to differentiate tumors from atelectasis.
The study by Zhang et al. (10) compared the distance between the centroids of CT, PET-CT, and MRI, and there was no significant difference. This showed that differences in GTVs using different procedures are mainly attributable to the shape of the target delineation, but not the location of the target centers. On the one hand, many studies have confirmed that PET-CT and MRI are better than CT in differentiating tumor from atelectasis. On the other hand, related studies show that DWI-MRI has the highest target delineation accuracy and the lowest variation compared with PET-CT. Therefore, we believe that compared with FDG-PET, MRI may become a more general and practical tool for treatment planning (25). At present, many studies focus on the DWI sequence, but few studies discuss the role of other MRI sequences in the target delineation of lung cancer patients with atelectasis.
Six MRI sequences and not only DWI were studied in this study. Moreover, the effects of T1WI enhancement sequences on each time image were studied from pulmonary vascular perfusion imaging. At present, there is no literature to study whether MRI sequence injection contrast medium 10 minutes scan images can help distinguish tumor and atelectasis. In addition, few articles use CI and DC values to further quantify the differences between interobservers. This is the innovation point of this article.
Studies by Weiss et al. (26) suggest that the lack of continuous education and training is one of the reasons for the variability of tumor contours. Bowden et al. (27) found that the application of the delineation protocol can improve the accuracy of sketching. The average variation rate of the measured GTV decreased from 20% without a plan to 13% with a plan. In clinical practice, all observers have little experience in sketching GTV on MRI. Research by Konert et al. (28) shows that multiple training interventions improve PET/CT-based based target volume delineation accuracy in NSCLC and reduce interobserver variation. In this study, the observers have trained uniformly before contouring the target; only the focus area of the primary tumor was delineated, not the lymph nodes. If the focus of the tumor fuses with the lymph nodes, they are delineated. The error caused by metastatic lymph nodes is reduced. In addition, in treatment planning, positioning technology such as MRI has advanced, whose superior soft-tissue contrast can reduce the uncertainty of organ description (29).
The overall trend shows that the T1WI+C 10 minutes, T2WI, and DWI sequences are obviously superior to those of CT in target delineation, which may help improve the consistency of target delineation in patients with atelectasis of lung cancer and reduce the target volume and normal tissue volume and be better used in clinical practice. In recent years, MRI has been increasingly used in treatment planning in radiotherapy. With the advent of the era of precision radiotherapy, the definition of the tumor target volume is particularly important for conformal intensity-modulated radiotherapy. Compared with CT, MRI can provide better soft-tissue features, coupled with its multi-plane ability and enhanced imaging function; these advantages for target volume description outweigh its lack of electronic density information and potential image distortion. MRI radiation-less imaging, high time resolution, fast sequence, and functional imaging highlight the potential of MRI to improve accuracy. MRI-based delineation provides a better target description for radiotherapy treatment planning (RTP). Furthermore, MRI not only is suitable for initial radiotherapy of tumors but also may be used for retreatment, because it can distinguish between changes caused by cancer recurrence and changes caused by fibrosis after treatment. It can also better depict risk organs (OAR) to avoid doses in RTP (30–32). At present, texture analysis, automatic delineation, 4D-MRI, MRI accelerator, and other emerging technologies are gradually applied in clinical settings (33–36). This study may provide a new application direction for radiotherapy guided by MRI accelerator in the future.
In the course of radiotherapy, the regression or progression of the tumor can lead to the regression or expansion of atelectasis. Atelectasis changes in 10% to 30% of patients with non-small cell lung cancer during treatment (37). Tennyson et al. (38) also showed that during radiotherapy, atelectasis and primary tumor volumes decreased on average 136.7 cm3 (20–369 cm3) for atelectasis and 40 cm3 (-7 to 131 cm3) for primary tumor. It is very important to detect the changes in atelectasis volume during treatment. In practical clinical work, lung cancer patients with atelectasis will be scanned by CBCT imaging every time they are treated with radiotherapy to closely observe the changes of atelectasis, modify the target area in time, and reduce the dose of normal tissue. At present, there is no related research on predicting the geometric changes of lung tissue caused by radiotherapy for atelectasis of lung cancer, which may be a direction of future research.
This study does contain some limitations. Firstly, due to the strict inclusion criteria, the sample size is significantly reduced. Our team is now expanding the sample size for follow-up automatic sketching-related research. Secondly, target delineation lacks the gold standard of pathology, which may need to be further confirmed by prospective studies. Thirdly, the imaging findings of atelectasis and obstructive pneumonia are different in different periods. In the process of delineating, the inflammation period cannot be determined, which undoubtedly increases the difficulty of delineating the target area, which may increase the difference between the observers. Fourthly, the limitation of rigid registration itself could result in inevitable errors, which increases the contingency of the results. Fifthly, PET-CT could have been another modality studied.In addition, there is inevitably some recall bias. Finally, heterogeneity of the study group may affect the results.
In summary, compared with CT, MRI may help to distinguish tumor from atelectasis. In particular, compared with other MRI sequences, T1WI+C 10 minutes is a new discovery. The results of T2WI and DWI are consistent with those of other studies, and they have good identification ability. The formulation of the MRI and CT dual-localization radiotherapy plan may be helpful to reduce the target volume and normal-tissue dose in patients with lung cancer with atelectasis. This study may provide a new direction for MRI-guided radiotherapy. In addition, the prediction of geometric changes of the target area before treatment in patients with lung cancer atelectasis is also worthy of further study.
Data availability statement
The original contributions presented in the study are included in the article/supplementary material. Further inquiries can be directed to the corresponding author.
Ethics statement
The studies involving human participants were reviewed and approved by ethics committee of Shandong Cancer Hospital. Written informed consent for participation was not required for this study in accordance with the national legislation and the institutional requirements.
Author contributions
HZ is responsible for the research design, planning implementation, statistical analysis, and drafting of the manuscript. CF, MF, LL, YC, HS, QZ, DH, and CL participated in the study design and data acquisition. MF and LL carried out the literature search and data aggregation. BL provided the theoretical proof and academic advice. WH is responsible for the topic selection, overall research guidance, and revision of the paper. All authors contributed to the article and approved the submitted version.
Funding
This work was supported by the National Natural Science Foundation of China (No. 81773232), Academic Promotion Program of Shandong First Medical University (Shandong Academy of Medical Sciences) (No. 2020RC002), and Project of Young Taishan Scholars (No. Tsqn201909187).
Conflict of interest
The authors declare that the research was conducted in the absence of any commercial or financial relationships that could be construed as a potential conflict of interest.
Publisher’s note
All claims expressed in this article are solely those of the authors and do not necessarily represent those of their affiliated organizations, or those of the publisher, the editors and the reviewers. Any product that may be evaluated in this article, or claim that may be made by its manufacturer, is not guaranteed or endorsed by the publisher.
Abbreviations
CT, computed tomography; GTV, gross tumor volume; MRI, magnetic resonance imaging; TE, echo time; TR, repetition time; T1WI, WATER : BH AX LAVA-Flex; T1WI+C, WATER : BH AX LAVA-Flex-C; T1WI+C Delay, WATER : BH AX LAVA-Flex-C delay; T1WI+C 10 minutes, WATER : BH AX LAVA-Flex-C 10min; T2WI, RTr Ax T2 fs Propeller; CI, conformity index; DC, Dice coefficient; NTCP, normal tissue complication probability.
References
1. Bray F, Ferlay J, Soerjomataram I, Siegel RL, Torre LA, Jemal A. Global cancer statistics 2018: GLOBOCAN estimates of incidence and mortality worldwide for 36 cancers in 185 countries. CA Cancer J Clin (2018) 68:394–424. doi: 10.3322/caac.21492
2. Sun KX, Zheng RS, Zeng HM, Zhang SW, Zou XN, Gu XY, et al. The incidence and mortality of lung cancer in China, 2014. Zhonghua Zhong Liu Za Zhi (2018) 40(11):805–11. doi: 10.3760/cma.j.issn.0253-3766.2018.11.002
3. Giraud P, Elles S, Helfre S, De Rycke Y, Servois V, Carette MF, et al. Conformal radiotherapy for lung cancer: different delineation of the gross tumor volume (GTV) by radiologists and radiation oncologists. Radiother Oncol (2002) 62(1):27–36. doi: 10.1016/s0167-8140(01)00444-3
4. Vorwerk H, Beckmann G, Bremer M, Degen M, Dietl B, Fietkau R, et al. The delineation of target volumes for radiotherapy of lung cancer patients. Radiother Oncol (2009) 91(3):455–60. doi: 10.1016/j.radonc.2009.03.014
5. Guy CL, Weiss E, Jan N, Reshko LB, Christensen GE, Hugo GD. Effect of atelectasis changes on tissue mass and dose during lung radiotherapy. Med Phys (2016) 43(11):6109. doi: 10.1118/1.4965807
6. Khalil A, Majlath M, Gounant V, Hess A, Laissy JP, Debray MP. Contribution of magnetic resonance imaging in lung cancer imaging. Diagn Interv Imaging (2016) 97(10):991–1002. doi: 10.1016/j.diii.2016.08.015
7. Qi LP, Zhang XP, Tang L, Li J, Sun YS, Zhu GY. Using diffusion-weighted MR imaging for tumor detection in the collapsed lung: a preliminary study. Eur Radiol (2009) 19(2):333–41. doi: 10.1007/s00330-008-1134-3
8. Henzler T, Schmid-Bindert G, Schoenberg SO, Fink C. Diffusion and perfusion MRI of the lung and mediastinum. Eur J Radiol (2010) 76(3):329–36. doi: 10.1016/j.ejrad.2010.05.005
9. Metcalfe P, Liney GP, Holloway L, Walker A, Barton M, Delaney GP, et al. The potential for an enhanced role for MRI in radiation-therapy treatment planning. Technol Cancer Res Treat (2013) 12(5):429–46. doi: 10.7785/tcrt.2012.500342
10. Zhang X, Fu Z, Gong G, Wei H, Duan J, Chen Z, et al. Implementation of diffusion-weighted magnetic resonance imaging in target delineation of central lung cancer accompanied with atelectasis in precision radiotherapy. Oncol Lett (2017) 14(3):2677–82. doi: 10.3892/ol.2017.6479
11. Zhao C, Li J, Wang W, Gong G, Xu L, Zhang Y, et al. DE-MR simulation imaging for prone radiotherapy after breast-conserving surgery: assessing its application in lumpectomy cavity delineation based on deformable image registration. Radiat Oncol (2021) 16(1):91. doi: 10.1186/s13014-021-01817-2
12. Tyng CJ, Chojniak R, Pinto PN, Borba MA, Bitencourt AG, Fogaroli RC, et al. Conformal radiotherapy for lung cancer: interobservers' variability in the definition of gross tumor volume between radiologists and radiotherapists. Radiat Oncol (2009) 4:28. doi: 10.1186/1748-717X-4-28
13. Rodríguez N, Sanz X, Trampal C, Foro P, Reig A, Lacruz M, et al. 18F-FDG PET definition of gross tumor volume for radiotherapy of lung cancer: is the tumor uptake value-based approach appropriate for lymph node delineation? Int J Radiat Oncol Biol Phys (2010) 78(3):659–66. doi: 10.1016/j.ijrobp.2009.08.003
14. Bissonnette JP, Purdie TG, Higgins JA, Li W, Bezjak A. Cone-beam computed tomographic image guidance for lung cancer radiation therapy. Int J Radiat Oncol Biol Phys (2009) 73(3):927–34. doi: 10.1016/j.ijrobp.2008.08.059
15. Cante D, Petrucci E, Piva C, Borca VC, Sciacero P, Bertodatto M, et al. Delineation of the larynx as organ at risk in radiotherapy: a contouring course within "Rete oncologica piemonte-Valle d'Aosta" network to reduce inter- and intraobserver variability. Radiol Med (2016) 121(11):867–72. doi: 10.1007/s11547-016-0668-8
16. Box, GEP, Cox, DR. An analysis of transformations. J R Stat Soc: Ser B (Methodological) (1964) 26:211–43. doi: 10.1111/j.2517-6161.1964.tb00553.x
17. Bourgouin PM, McLoud TC, Fitzgibbon JF, Mark EJ, Shepard JA, Moore EM, et al. Differentiation of bronchogenic carcinoma from postobstructive pneumonitis by magnetic resonance imaging: histopathologic correlation. J Thorac Imaging (1991) 6(2):22–7. doi: 10.1097/00005382-199104000-00006
18. Van de Steene J, Linthout N, de Mey J, Vinh-Hung V, Claassens C, Noppen M, et al. Definition of gross tumor volume in lung cancer: inter-observer variability. Radiother Oncol (2002) 62(1):37–49. doi: 10.1016/s0167-8140(01)00453-4
19. Steenbakkers RJ, Duppen JC, Fitton I, Deurloo KE, Zijp LJ, Comans EF, et al. Reduction of observer variation using matched CT-PET for lung cancer delineation: a three-dimensional analysis. Int J Radiat Oncol Biol Phys (2006) 64(2):435–48. doi: 10.1016/j.ijrobp.2005.06.034
20. Yang RM, Li L, Wei XH, Guo YM, Huang YH, Lai LS, et al. Differentiation of central lung cancer from atelectasis: comparison of diffusion-weighted MRI with PET/CT. PloS One (2013) 8(4):e60279. doi: 10.1371/journal.pone.0060279
21. Shioya S, Haida M, Ono Y, Fukuzaki M, Yamabayashi H. Lung cancer: differentiation of tumor, necrosis, and atelectasis by means of T1 and T2 values measured in vitro. Radiology (1988) 167(1):105–9. doi: 10.1148/radiology.167.1.3347709
22. Karki K, Saraiya S, Hugo GD, Mukhopadhyay N, Jan N, Schuster J, et al. Variabilities of magnetic resonance imaging-, computed tomography-, and positron emission tomography-computed tomography-based tumor and lymph node delineations for lung cancer radiation therapy planning. Int J Radiat Oncol Biol Phys (2017) 99(1):80–9. doi: 10.1016/j.ijrobp.2017.05.002
23. Fleckenstein J, Jelden M, Kremp S, Jagoda P, Stroeder J, Khreish F, et al. The impact of diffusion-weighted MRI on the definition of gross tumor volume in radiotherapy of non-Small-Cell lung cancer. PLoS One (2016) 11(9):e0162816. doi: 10.1371/journal.pone.0162816
24. Basson L, Jarraya H, Escande A, Cordoba A, Daghistani R, Pasquier D, et al. Chest magnetic resonance imaging decreases inter-observer variability of gross target volume for lung tumors. Front Oncol (2019) 9:690. doi: 10.3389/fonc.2019.00690
25. Everitt S, Herschtal A, Callahan J, Plumridge N, Ball D, Kron T, et al. High rates of tumor growth and disease progression detected on serial pretreatment fluorodeoxyglucose-positron emission tomography/computed tomography scans in radical radiotherapy candidates with nonsmall cell lung cancer. Cancer (2010) 116(21):5030–7. doi: 10.1002/cncr.25392
26. Weiss E, Hess CF. The impact of gross tumor volume (GTV) and clinical target volume (CTV) definition on the total accuracy in radiotherapy theoretical aspects and practical experiences. Strahlenther Onkol (2003) 179(1):21–30. doi: 10.1007/s00066-003-0976-5
27. Bowden P, Fisher R, Mac Manus M, Wirth A, Duchesne G, Millward M, et al. Measurement of lung tumor volumes using three-dimensional computer planning software. Int J Radiat Oncol Biol Phys (2002) 53(3):566–73. doi: 10.1016/s0360-3016(02)02783-9
28. Konert T, Vogel WV, Everitt S, MacManus MP, Thorwarth D, Fidarova E, et al. Multiple training interventions significantly improve reproducibility of PET/CT-based lung cancer radiotherapy target volume delineation using an IAEA study protocol. Radiother Oncol (2016) 121(1):39–45. doi: 10.1016/j.radonc.2016.09.002
29. Schmidt MA, Payne GS. Radiotherapy planning using MRI. Phys Med Biol (2015) 60(22):R323–61. doi: 10.1088/0031-9155/60/22/R323
30. Paganelli C, Whelan B, Peroni M, Summers P, Fast M, van de Lindt T, et al. MRI-Guidance for motion management in external beam radiotherapy: current status and future challenges. Phys Med Biol (2018) 63(22):22TR03. doi: 10.1088/1361-6560/aaebcf
31. Khoo VS, Joon DL. New developments in MRI for target volume delineation in radiotherapy. Br J Radiol (2006) 1:S2–15. doi: 10.1259/bjr/41321492
32. Thureau S, Briens A, Decazes P, Castelli J, Barateau A, Garcia R, et al. PET and MRI guided adaptive radiotherapy: Rational, feasibility and benefit. Cancer Radiother (2020) 24(6-7):635–44. doi: 10.1016/j.canrad.2020.06.017
33. Navest RJM, Mandija S, Bruijnen T, Stemkens B, Tijssen RHN, Andreychenko A, et al. The noise navigator: a surrogate for respiratory-correlated 4D-MRI for motion characterization in radiotherapy. Phys Med Biol (2020) 65(1):01NT02. doi: 10.1088/1361-6560/ab5c62
34. Mahon RN, Hugo GD, Weiss E. Repeatability of texture features derived from magnetic resonance and computed tomography imaging and use in predictive models for non-small cell lung cancer outcome. Phys Med Biol (2019). doi: 10.1088/1361-6560/ab18d3
35. Wang C, Tyagi N, Rimner A, Hu YC, Veeraraghavan H, Li G, et al. Segmenting lung tumors on longitudinal imaging studies via a patient-specific adaptive convolutional neural network. Radiother Oncol (2019) 131:101–7. doi: 10.1016/j.radonc.2018.10.037
36. Hall WA, Paulson ES, van der Heide UA, Fuller CD, Raaymakers BW, Lagendijk JJW, et al. The transformation of radiation oncology using real-time magnetic resonance guidance: A review. Eur J Cancer (2019) 122:42–52. doi: 10.1016/j.ejca.2019.07.021
37. Karlsson K, Nyman J, Baumann P, Wersäll P, Drugge N, Gagliardi G, et al. Retrospective cohort study of bronchial doses and radiation-induced atelectasis after stereotactic body radiation therapy of lung tumors located close to the bronchial tree. Int J Radiat Oncol Biol Phys (2013) 87(3):590–5. doi: 10.1016/j.ijrobp.2013.06.2055
Keywords: lung neoplasms, pulmonary atelectasis, radiotherapy, magnetic resonance imaging, computed tomography
Citation: Zhang H, Fu C, Fan M, Lu L, Chen Y, Liu C, Sun H, Zhao Q, Han D, Li B and Huang W (2022) Reduction of inter-observer variability using MRI and CT fusion in delineating of primary tumor for radiotherapy in lung cancer with atelectasis. Front. Oncol. 12:841771. doi: 10.3389/fonc.2022.841771
Received: 22 December 2021; Accepted: 04 July 2022;
Published: 03 August 2022.
Edited by:
Carlo Cavedon, Azienda Ospedaliera Universitaria Integrata - Verona, ItalyCopyright © 2022 Zhang, Fu, Fan, Lu, Chen, Liu, Sun, Zhao, Han, Li and Huang. This is an open-access article distributed under the terms of the Creative Commons Attribution License (CC BY). The use, distribution or reproduction in other forums is permitted, provided the original author(s) and the copyright owner(s) are credited and that the original publication in this journal is cited, in accordance with accepted academic practice. No use, distribution or reproduction is permitted which does not comply with these terms.
*Correspondence: Wei Huang, YWx2aW5iaXJkQDEyNi5jb20=