
94% of researchers rate our articles as excellent or good
Learn more about the work of our research integrity team to safeguard the quality of each article we publish.
Find out more
ORIGINAL RESEARCH article
Front. Oncol., 07 February 2022
Sec. Cancer Imaging and Image-directed Interventions
Volume 12 - 2022 | https://doi.org/10.3389/fonc.2022.839621
This article is part of the Research TopicArtificial Intelligence and MRI: Boosting Clinical DiagnosisView all 28 articles
 Xuhui Fan1†
 Ni Xie2†Jingwen Chen1Tiewen Li3
 Rong Cao1Hongwei Yu1Meijuan He1Zilin Wang1
 Yihui Wang1Hao Liu4
 Han Wang1,2,5*Xiaorui Yin1*
Objectives: This study aims to develop and evaluate multiparametric MRI (MP-MRI)-based radiomic models as a noninvasive diagnostic method to predict several biological characteristics of prostate cancer.
Methods: A total of 252 patients were retrospectively included who underwent radical prostatectomy and MP-MRI examinations. The prediction characteristics of this study were as follows: Ki67, S100, extracapsular extension (ECE), perineural invasion (PNI), and surgical margin (SM). Patients were divided into training cohorts and validation cohorts in the ratio of 4:1 for each group. After lesion segmentation manually, radiomic features were extracted from MP-MRI images and some clinical factors were also included. Max relevance min redundancy (mRMR) and recursive feature elimination (RFE) based on random forest (RF) were adopted to select features. Six classifiers were included (SVM, KNN, RF, decision tree, logistic regression, XGBOOST) to find the best diagnostic performance among them. The diagnostic efficiency of the construction models was evaluated by ROC curves and quantified by AUC.
Results: RF performed best among the six classifiers for the four groups according to AUC values (Ki67 = 0.87, S100 = 0.80, ECE = 0.85, PNI = 0.82). The performance of SVM was relatively the best for SM (AUC = 0.77). The number and importance of DCE features ranked first in the models of each group. The combined models of MP-MRI and clinical characteristics showed no significant difference compared with MP-MRI models according to Delong’s tests.
Conclusions: Radiomics models based on MP-MRI have the potential to predict biological characteristics and are expected to be a noninvasive method to evaluate the risk stratification of prostate cancer.
Prostate cancer (PCa) is the highest incidence cancer and the second leading cause of death among men according to the latest statistics in 2021 (1). Early and precise detection of prostate cancer and subsequent appropriate treatment decisions play an essential role for patients (2, 3).
Nowadays, some tumor biomarkers and biological characteristics have been proved to be useful for evaluating the malignant potential of prostate cancer and may influence the treatment decision-making (4–6). Ki67 as a biomarker of cell proliferation, which is expressed in all phases except resting (G0) phase of the cell cycle, has been demonstrated to be an independent prognostic factor in low volume and grade prostate cancer (7). According to the results of the Mayo model, when the expression of Ki67 increased by 1%, the cancer-specific mortality would increase by1 2% after radical prostatectomy (RP) accordingly (8). S100 is a family of acidic calcium-binding proteins and was found to be upregulated in various tumors (9). Aberg et al. revealed two subtypes of S100 were significantly correlated with short progression-free survival in prostate cancer patients with metastases (10). Extracapsular extension (ECE) could be used as an indication of local advanced prostate cancer (cT3). The positive ECE would increase the risk of death to 5 times than the negative ECE for patients after undergoing radical prostatectomy (11). Surgical margin (SM) is determined by pathological staining of RP specimens. Numerous studies have disclosed that positive SM increased cancer-specific mortality and the likelihood of biochemical recurrence of patients significantly (12–14). Prostate cancer tends to invade and grow along nerves, and it is also considered to be a potential metastatic route, which is called perineural invasion (PNI) (15, 16). PNI has been documented to be associated with biochemical recurrence (BCR) and promoting tumor aggressiveness (16, 17). Therefore, judging these biological characteristics before operation can better evaluate the invasiveness of tumor and may change the clinical decision-making patterns in the future.
Definitely, biopsy can solve some of the above problems to a certain extent and is still the mainstream method. It is reported that the combined technique of fusion targeted and systematic biology has been proved to be helpful to improve the diagnostic accuracy (18). However, the defects of sampling errors and a series of subsequent complications, such as pain and hematuria (19), limit the real-time monitoring and accurate evaluation of biological characteristics by biopsy. Multiparametric-magnetic resonance imaging (MP-MRI) is one of the most accurate noninvasive methods to evaluate local lesions, which contains T1 and T2 sequences that provide anatomical and disease information, as well as other sequences that provide functional information, such as diffusion-weighted imaging (DWI), dynamic contrast enhanced (DCE), and magnetic resonance spectroscopy (MRS) (20). As a routine screening method for prostate cancer, MP-MRI can reflect the phenotype and heterogeneity of prostate cancer by signal intensity and enhancement features (21, 22). Furthermore, MP-MRI images may contain many clinically valuable information related to the different biological characteristics above, such as ECE (23), which may be hard for radiologists to dig out in clinical practice.
Currently, radiomics serves as a novel approach that extracts abundant quantitative features with high throughput, and through machine learning methods to establish prediction models, which were proved to effectively provide more potential useful information for the clinical practice in urology (24, 25). Radiomics of prostate cancer has been widely used in tumor identification, staging, and prognosis evaluation (26, 27). However, more comprehensive and accurate prediction models that can determine the risk stratification and provide references for clinical decision-making for prostate cancer still need to be explored.
Thus, in the present study, we attempted to establish and validate the radiomic predictive models for five biological characteristics related to aggressiveness (Ki67, S100, ECE, PNI, SM) of prostate cancer based on MP-MRI. In addition, some clinical information was also added to establish the corresponding combined models.
This work was approved by the Institutional Review Board (IRB) of Shanghai General Hospital (2021KY107), and the patient’s informed consent was authorized to be waived according to the nature of the research. This retrospective study collected patients who underwent radical prostatectomy from May 2013 to January 2020. The exclusion criteria are as follows: (1) Preoperative DCE-MRI were unavailable (n = 149); (2) No mass lesion found on MRI image (n = 9); (3) Missing DWI (n = 3); (4) Poor imaging quality (n = 10); (5) Missing clinical information (n = 5); (6) Biopsy before MRI leading to unclear lesions (n = 32); and (7) Previous treatment before MRI examinations (n = 12). Finally, we recruited 252 patients as our subjects.
The clinical and pathological information we collected in this study is as follows: age, prostate serum antigen (PSA), white blood cell (WBC), red blood cell (RBC), hemoglobin, lymphocyte, platelet, albumin, alkaline phosphatase (ALP), platelet-to-lymphocyte ratio (PLR), fibrinogen, surgical Gleason score, immunohistochemistry (Ki67, S100, AR), SM, ECE, PNI, seminal vesicle invasion (SVI), and lymphatic vascular invasion (LVI). Details of the above indicators can be found in Supplementary Table S2. Considering the importance of biological characteristics of prostate cancer mentioned above, and the routine indexes of pathological examination, as well as data distribution (balanced or imbalanced), we selected five of them (Ki67, S100, ECE, PNI, SM) as our research indicators. Each of these indicators was classified as a group, and we divided each group into training cohort and validation cohort in the ratio of 4:1. All indicators were divided into positive and negative in the form of binary classification, except Ki67, which was divided into high expression and low expression with 10% as the threshold according to previous studies (7). The gold standard references of this research were based on the results of radical prostatectomy.
Three MRI sequences were included in this study: T2, DWI, DCE (arterial phase), and this combination also meets the PI-RADS v2 (Prostate Imaging-Reporting and Data System, Version 2) standard of MP-MRI (28). The protocols of MRI examinations are described in Supplement A.
The patient’s images and clinical data were imported into the Darwin research platform (https://arxiv.org/abs/2009.00908) for subsequent tumor lesion delineation and model establishment. The work flow is shown in Figure 1. The boundary of the volume of interest (VOIs) on each axial-DWI picture was manually delineated by radiologist 1 (JC, 5 years of experience in urinary imaging). The ROIs on DWI were then copied to the sequences of T2 and DCE. If some of the copied results of the two sequences were not ideal, further modifications were made. Next, radiologist 2 (RC, 8 years of experience in urinary imaging) would review the segmentation results. If there was any objection to the results, the results would be discussed and resegmented until a consensus was reached.
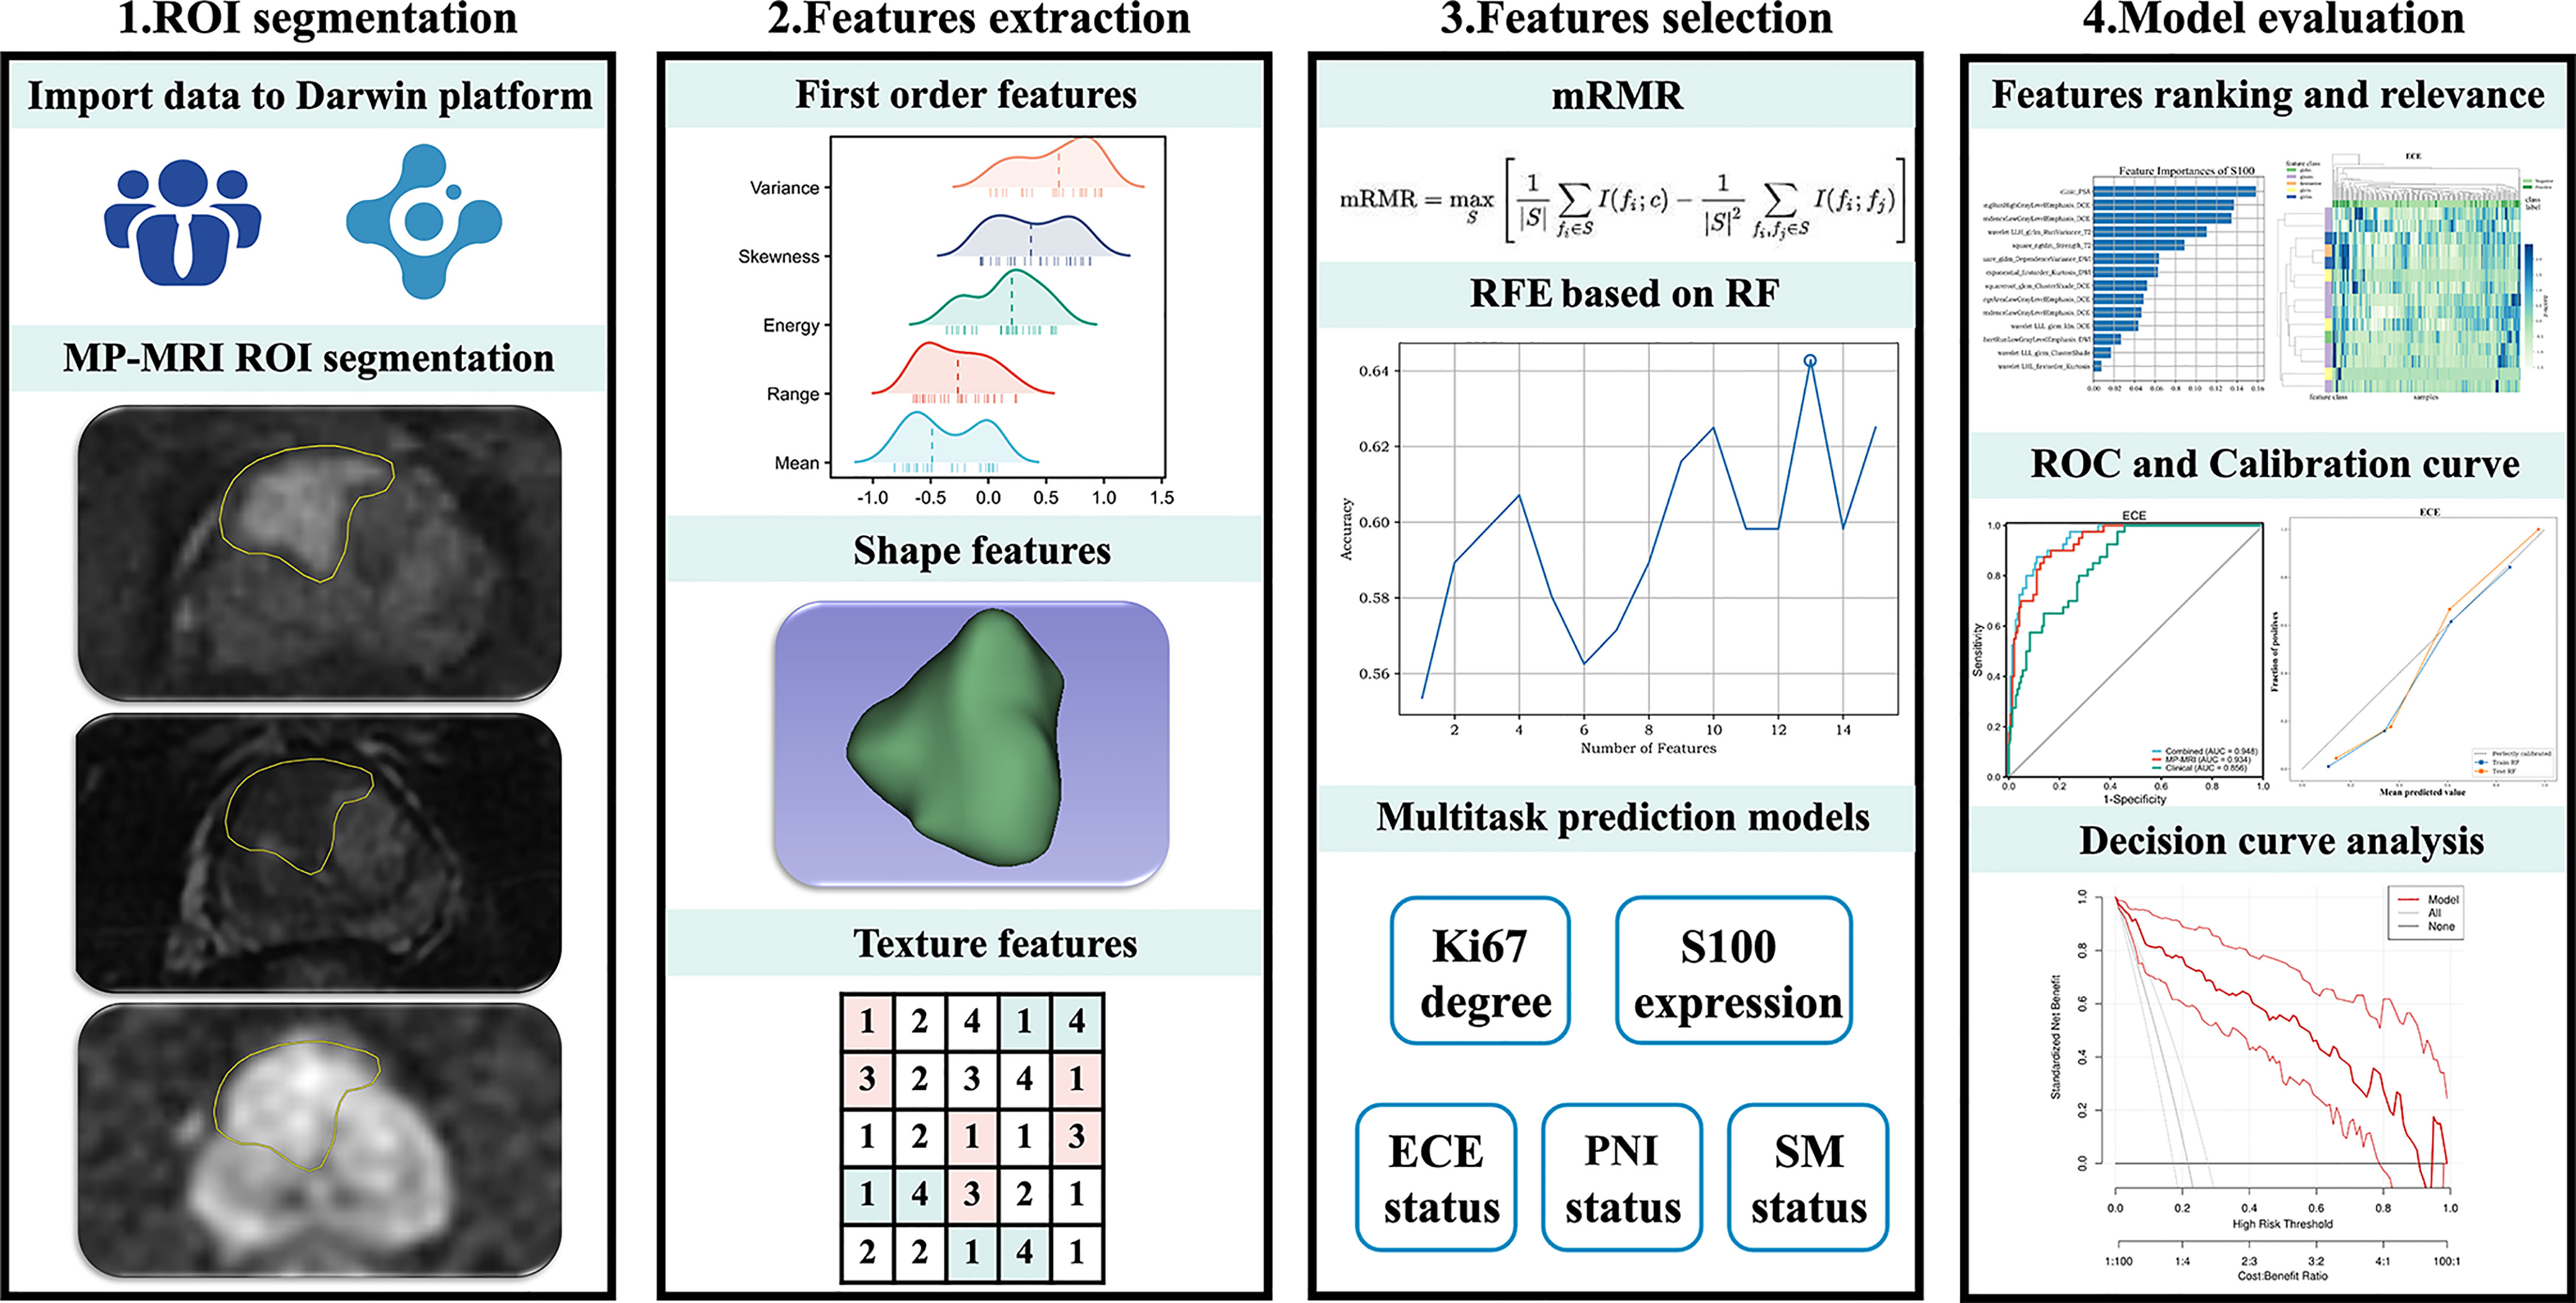
Figure 1 The general workflow of this study.
After finishing segmentation, the feature extraction of lesions was carried out by PyRadiomics package. The original feature classes contain first-order, shape, and texture features. First-order features refer to the distribution of voxel intensities through general and basic metrics, such as range, mean, variance, and kurtosis. Texture features embody: Gray-Level Cooccurrence Matrix (GLCM); Gray-Level Run Length Matrix (GLRLM); Gray-Level Size Zone Matrix (GLSZM); Neighboring Gray-Tone Difference Matrix (NGTDM); and Gray-Level Dependence Matrix (GLDM). Furthermore, we use eight filters and the original images were derived into eight kinds of filtered transformed images: Laplacian of Gaussian (LoG), wavelet, square, square root, logarithm, exponential, gradient, and local binary pattern (LBP). Except shape features, the first-order and texture features mentioned above can also be extracted from the derived images. Due to a single MRI sequence containing 1,781 features, MP-MRI produced 5,343 features in total for this study. The detailed description of the image features mentioned above can be found in https://pyradiomics.readthedocs.io/en/latest/features.html.
Firstly, the extracted feature data were subtracted by the mean and then divided by the variance to achieve data normalization for subsequent comparison. Next, in order to reduce the over fitting of data and find the optimal correlation features, max relevance min redundancy (mRMR) was adopted to find the top 20 features for ECE, PNI, and SM groups and 15 features for Ki67 and S100 groups in the training cohort. Due to some machine learning, classifiers themselves can evaluate the importance of features and find the best feature combination through multiple iterative calculations. Therefore, the recursive feature elimination (RFE) based on random forest (RF) was applied to find the best feature combination step by step based on accuracy.
In this study, six classifiers were included to find the best diagnostic performance among them: support vector machine (SVM), K-nearest neighbor (KNN), random forest, decision tree, logistic regression, and XGBOOST. Support vector machine was based on polynomial kernel function, and the tolerance for misclassified samples was set by the specific penalty coefficient C (from 0.0001 to 1,000). The best k value (number of neighbors) for KNN was found by training in the range of 3–10. For random forest, decision tree, and XGBOOST, the maximum tree depth was constrained to avoid overfitting. To find out whether the clinical data improved the diagnostic performance, several clinical data (age, PSA, WBC, RBC, hemoglobin, lymphocyte, platelet, albumin, ALP, PLR, fibrinogen) were selected to build the clinical models. Meanwhile, they were integrated into the corresponding MP-MRI radiomic models to construct the combined models. The parameters used in the model construction are described in Supplementary Table S1.
The diagnostic efficiency of the models was demonstrated by receiver operating characteristic (ROC) curves and quantified by the area under the curve (AUC). The calibration curve shows the consistency between the prediction model and the actuality. What is more, the decision curve analysis (DCA) illustrated the clinical net benefits brought by the prediction model.
The diagnostic ability of MP-MRI models and combined models was compared by DeLong’s test. The overall comparison of PSA in each group was through Mann-Whitney U test. The case distribution between validation cohorts and training cohorts was compared by Chi-square test. All statistical analysis was performed by R (version 4.0.2). The statistically significant level was set at 0.05.
In this study, a total of 252 PCa patients were included, and the flowchart of patients’ recruitment is depicted in Supplementary Figure S1. The baseline characteristics of PCa patients could be found in Supplementary Table S2. The mean age of the included patients was 68.4 years (50–84 years), and their surgical Gleason score is mainly distributed in 7 (64.7%). According to their pathological results, the included patients were divided into 5 groups: Ki67 (n = 140), S100 (n = 158), ECE (n = 232), PNI (n = 225), and SM (n = 248). As shown in Table 1, the expression of PSA was significantly different in ECE (p < 0.01), PNI (p = 0.03), and SM (p < 0.01) groups, and it was relatively not significant in Ki67 (p = 0.08) and S100 (p = 0.12) groups. Meanwhile, the case composition between the cohort training and validation cohort was roughly the same in each group (p > 0.05).
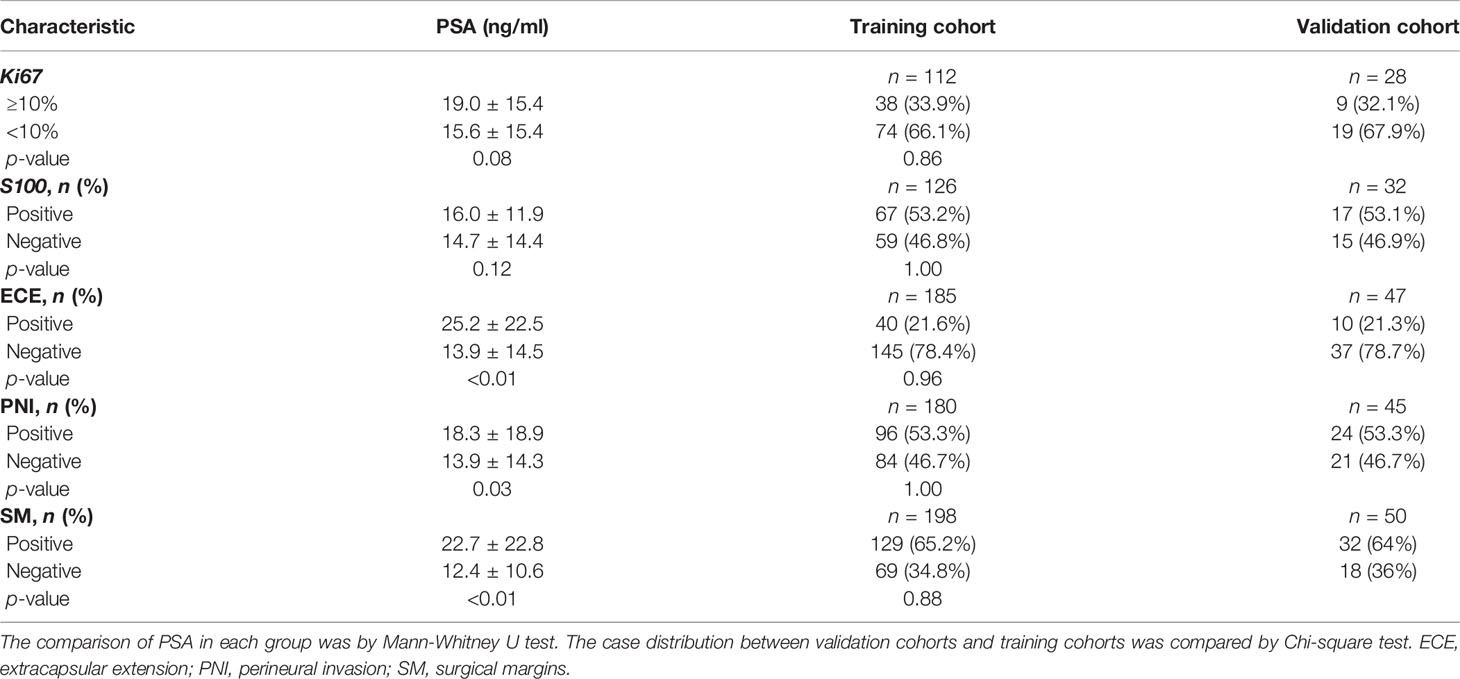
Table 1 Patient profiles of each group.
After applying mRMR to the features extracted from MP-MRI, the top 20 features in ECE, PNI, and SM groups and 15 features in Ki67 and S100 groups were obtained in the training cohort. RFE-RF then selected the resulting features and achieved the best performing feature combination as shown in Figures 2A–D: Ki67 (n = 13), S100 (n = 13), ECE (n = 15), PNI (n = 8), and SM (n = 20). For SM, all its figures are placed in Supplementary Figure S2 for a better result demonstration. Next, principal component analysis (PCA) was performed to extract principal components of features in each group and reduce the dimensions, which made the division of cases in each group more intuitive according to their feature values. As displayed in Figures 2E–H, the selected features could satisfactorily distinguish the positive and negative cases on PCA (for Ki67, they were ≥10% and <10%), especially in the ECE and PNI groups, which successfully divided the cases with different labels into left sides and right sides. According to the heat maps in Figure 3, the color of positive cases or high Ki67 expression cases was generally darker, and the color in heatmaps referred to the values of the selected feature. This also proved the ability of the features themselves to distinguish the biological characteristics of patients. Supplementary Figure S3 showed that the correlation among radiomics features was weak, indicating there was low redundancy among selected features.
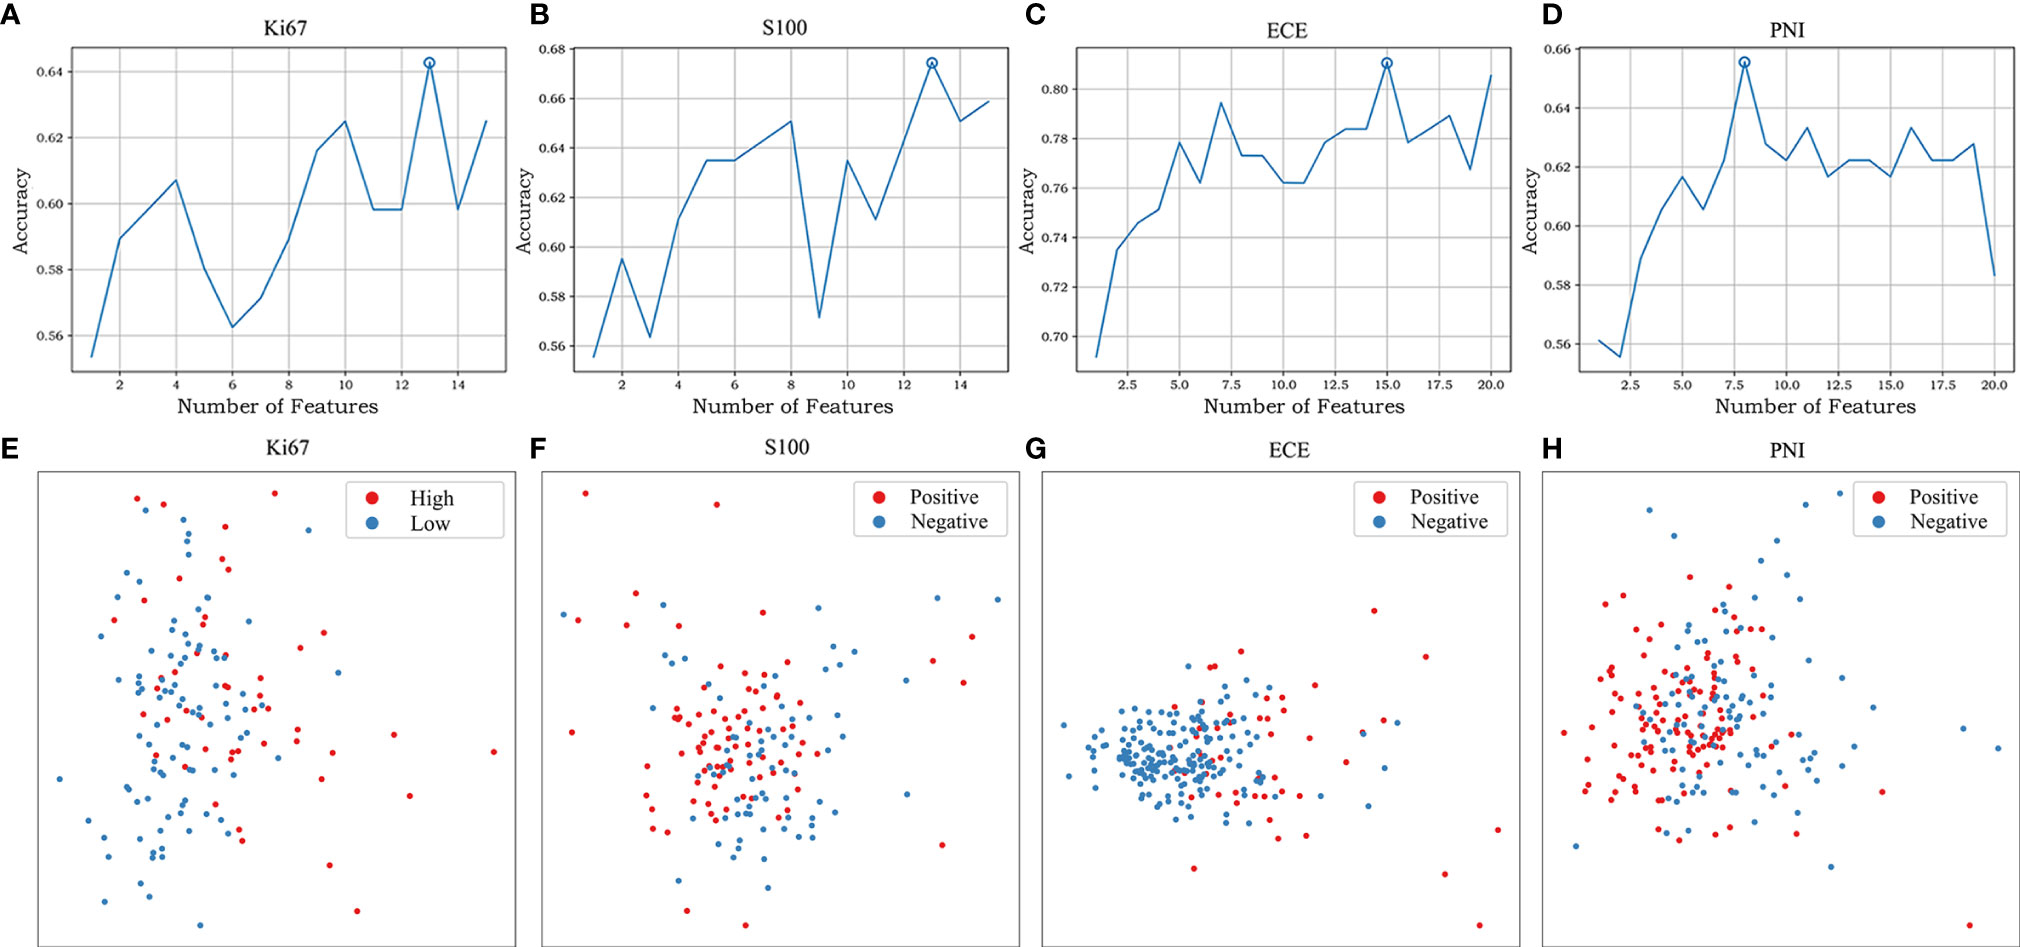
Figure 2 The feature selection of RFE-RF and the distribution of different cases on PCA. RFE-RF (A–D) was applied to find the best feature combination step by step, and the combinations with the highest accuracy will be incorporated into the models. PCA (E–H) showed the selected features could satisfactorily distinguish the division of cases in each group intuitively according to their feature values. The corresponding figures for SM are shown in Supplementary Figure S2.
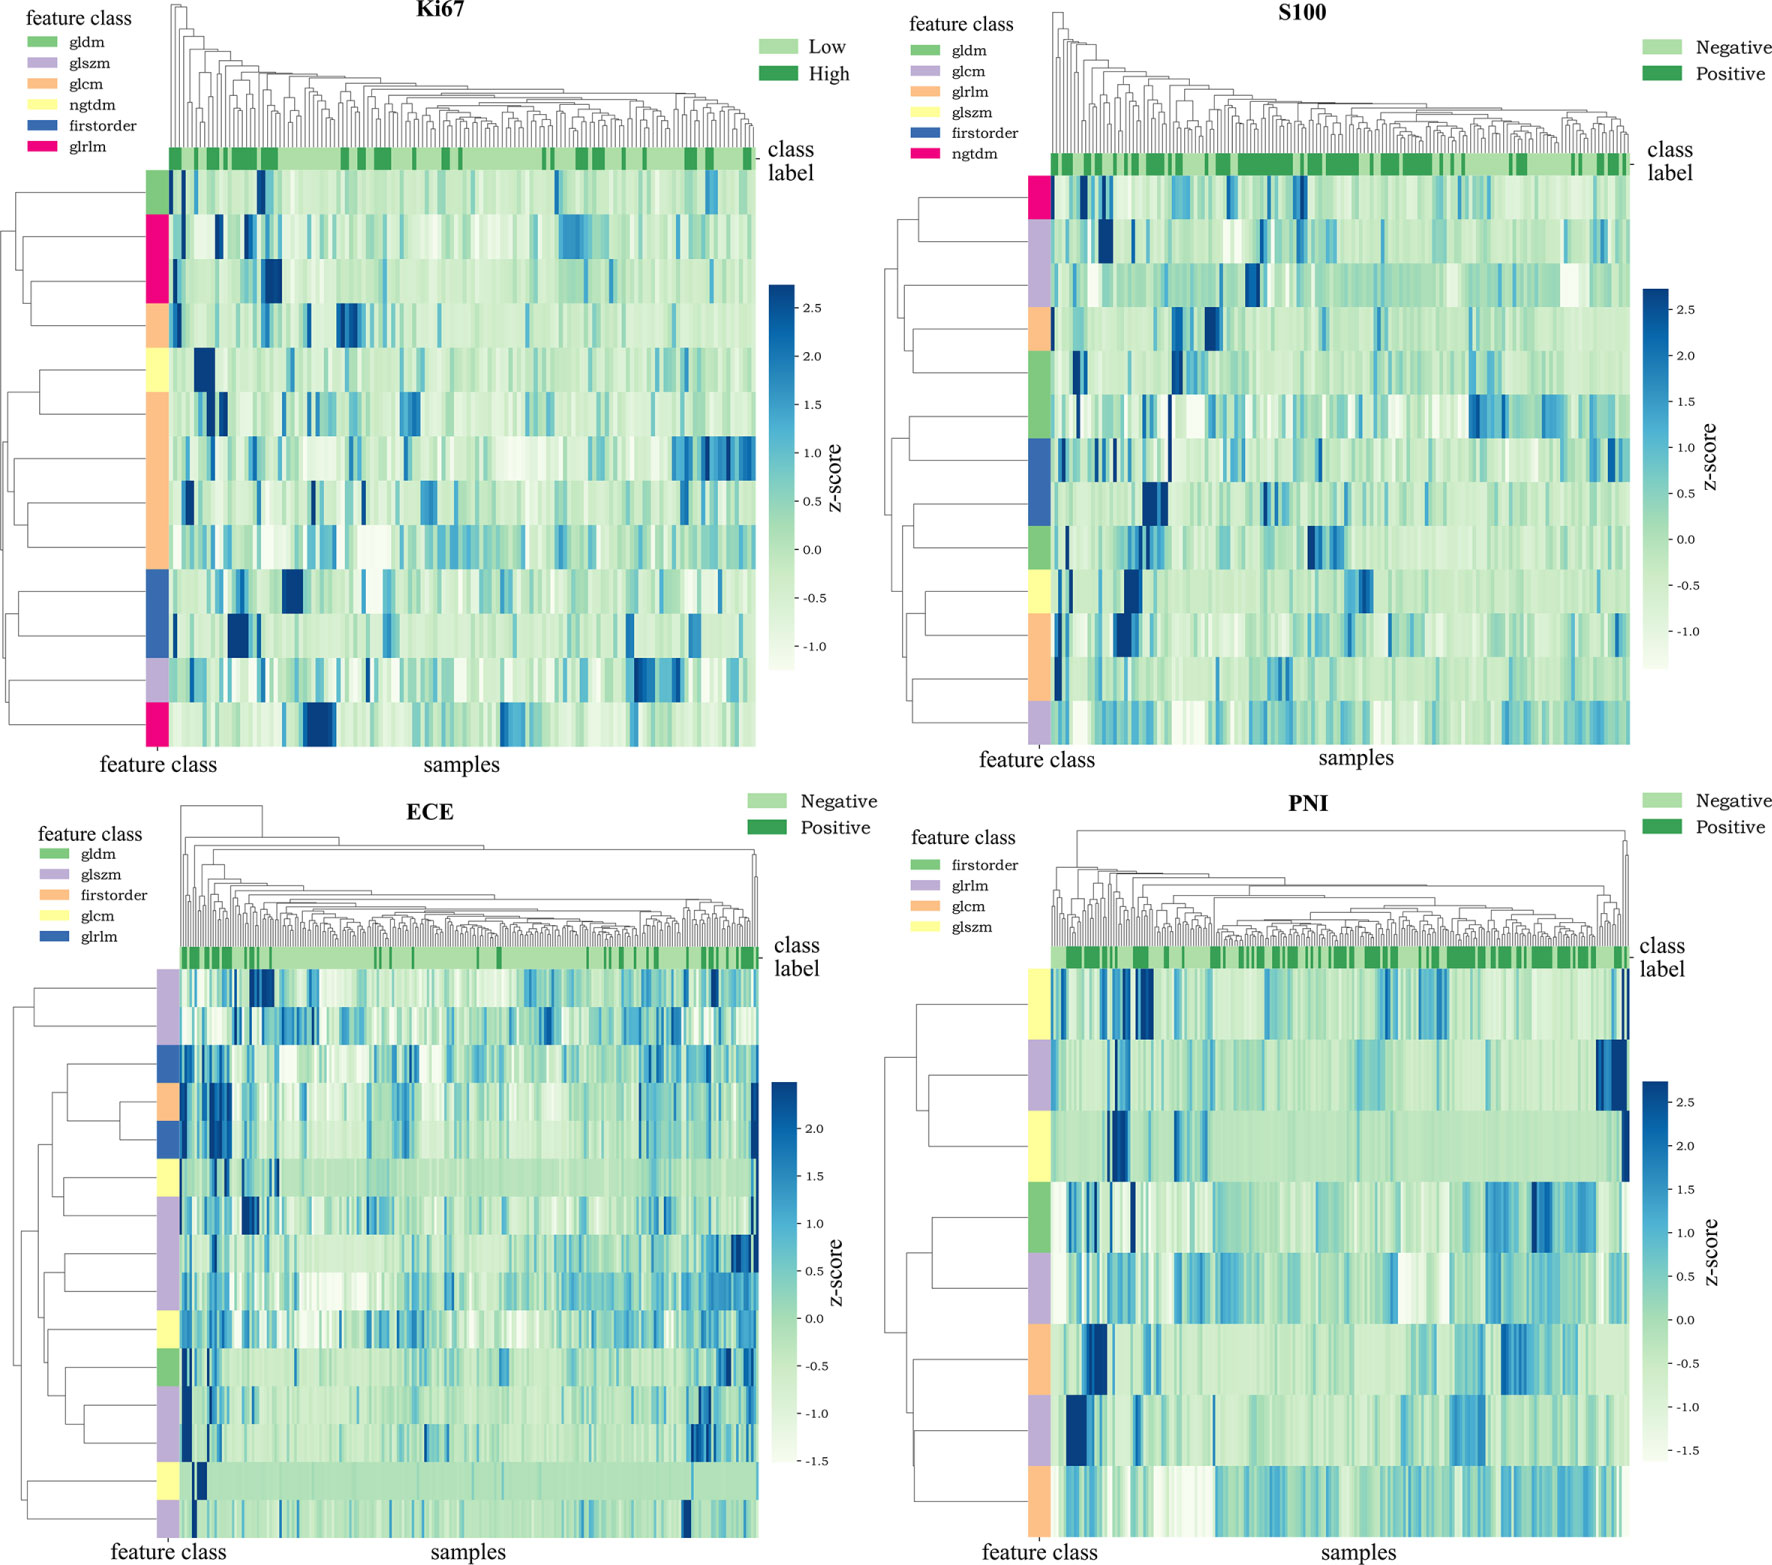
Figure 3 Heat maps of the selected features. The color of the maps represented the value of the selected features. The color of positive cases or high Ki67 expression cases was generally darker. This proved the ability of the features themselves to distinguish the biological characteristics of patients.
The six classifiers (SVM, KNN, random forest, decision tree, logistic regression, and XGBOOST) and their AUC in each group are listed in Table 2. In general, the performance of random forest was the best according to AUC values, and we chose random forest as the prediction models for the four groups (Ki67 = 0.87, S100 = 0.80, ECE = 0.85, PNI = 0.82). As for SM, the performance of SVM was relatively the best (AUC = 0.77), so SVM with polynomial kernel function was selected as the optimal classifier for SM.
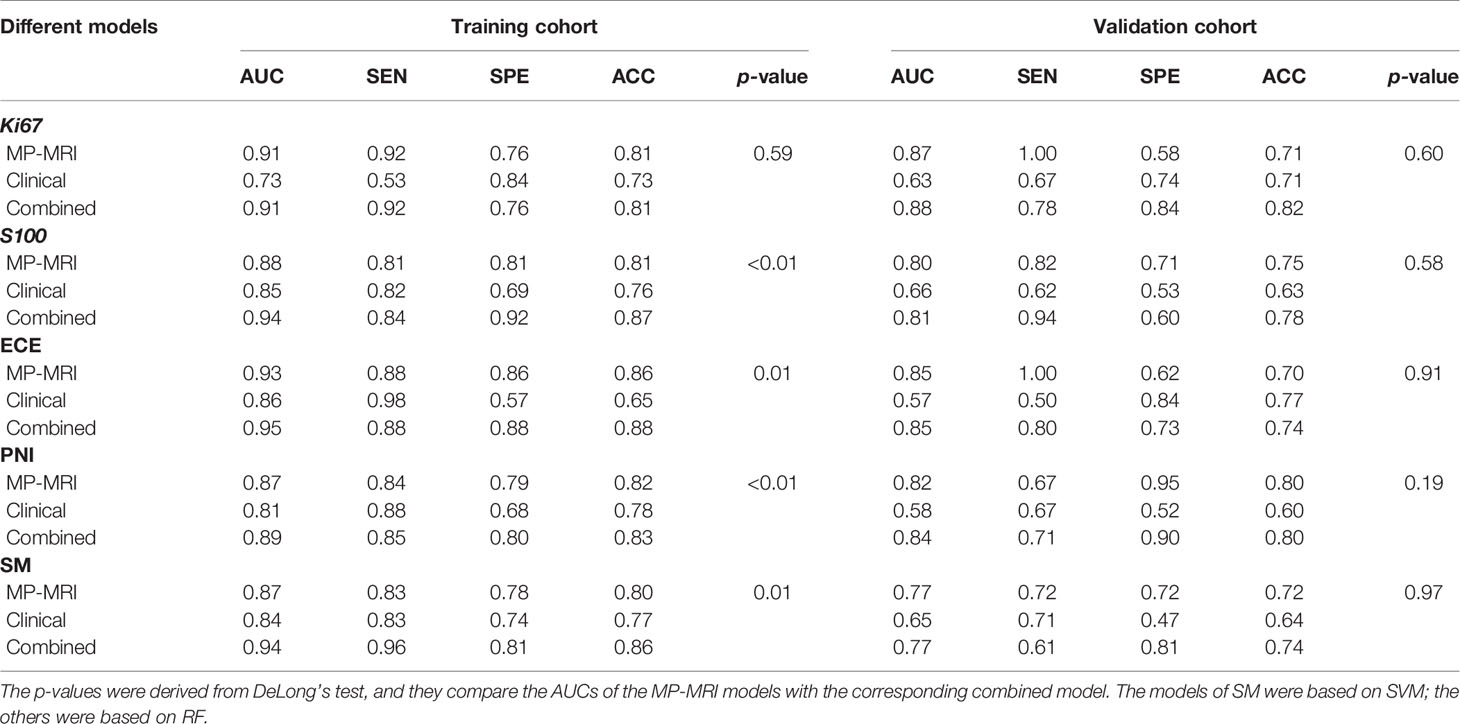
Table 2 Diagnostic performance of optimal models for each group.
The optimal MP-MRI models of the five groups performed satisfactorily both in the training cohorts and validation cohorts (Figure 4; Table 3). The prediction model of Ki67 performed best among the five groups, whose AUC value reached 0.88 in the validation cohort. The second-best model was ECE with AUC value = 0.85. The AUC values of the three remaining models in the validation cohort were 0.80 for S100, 0.82 for PNI, and 0.77 for SM.
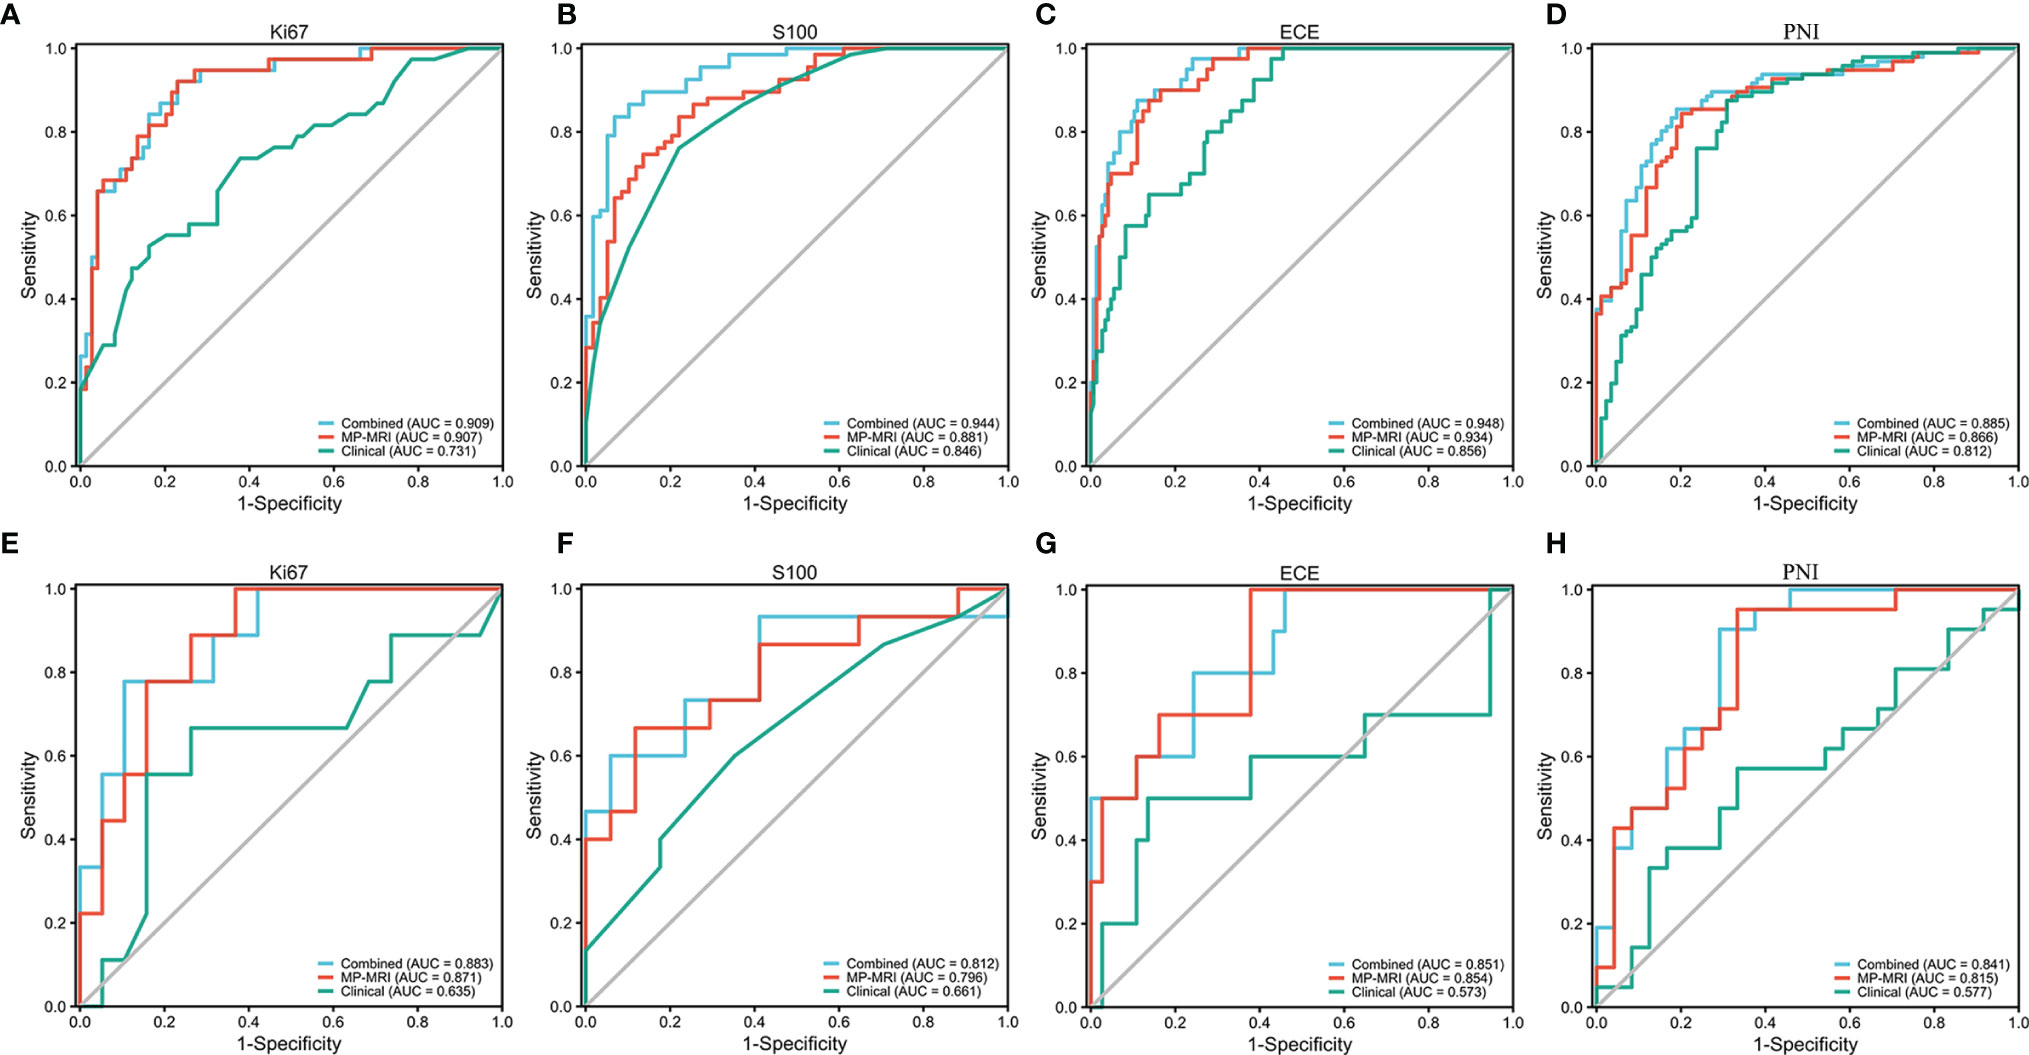
Figure 4 The ROC curves of the MP-MRI, clinical and combined models in the training cohort (A–D) and validation cohort (E–H).
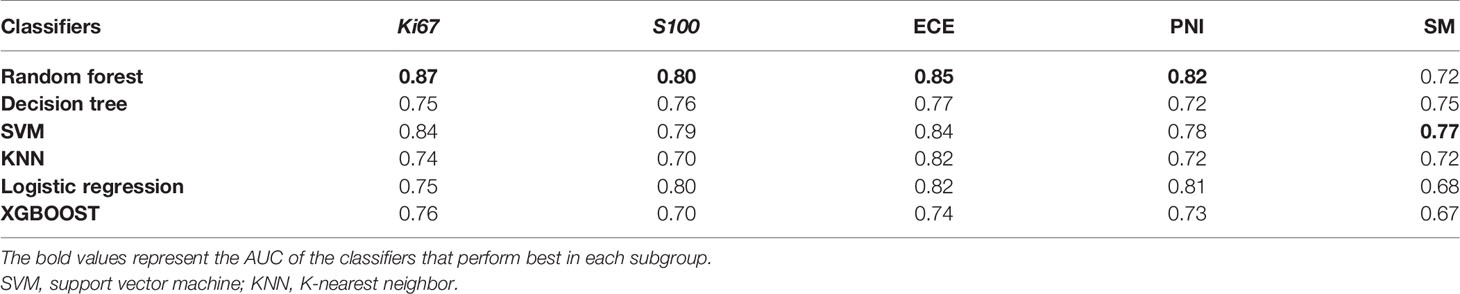
Table 3 AUCs of different MP-MRI radiomic classifiers for predicting the five biological characteristics in the validation cohorts.
As for clinical factors, after REF-RF selection, 2 characteristics were included for Ki67 (PSA, PLR), 1 for S100 (PSA), 4 for ECE (PSA, WBC, PLR, and ALP), 5 for PNI (PLR, age, fibrinogen, PSA, and albumin), and 4 for SM (PSA, fibrinogen, albumin, and lymphocyte). This displayed the level of PSA might be helpful to distinguish five biological characteristics to some extent. Clinical characteristics were then added to the MP-MRI model to form the combined models. As a result, in the training cohort, the combined model was significantly better than the MP-MRI models except the Ki67 group based on Delong’s tests (p < 0.05). Nevertheless, in the validation cohort, there was no significant difference between the two groups (p > 0.05).
Furthermore, the importance of the features in the combined models is demonstrated in Figure 5. The number and importance of DCE features ranked first in models of each group, followed by DWI, and finally T2. This also revealed that DCE sequences could provide more information for predicting the malignant degree of prostate cancer. In addition, in Figure 6, calibration curves displayed the consistency between the prediction model and the actuality was favorable, and when the risk threshold is greater than about 0.1, the prediction model could bring more clinical net benefits according to the DCA. Finally, we provide the examples of VOI delineation on MP-MRI and the corresponding 3D constructions images in Figure 7.
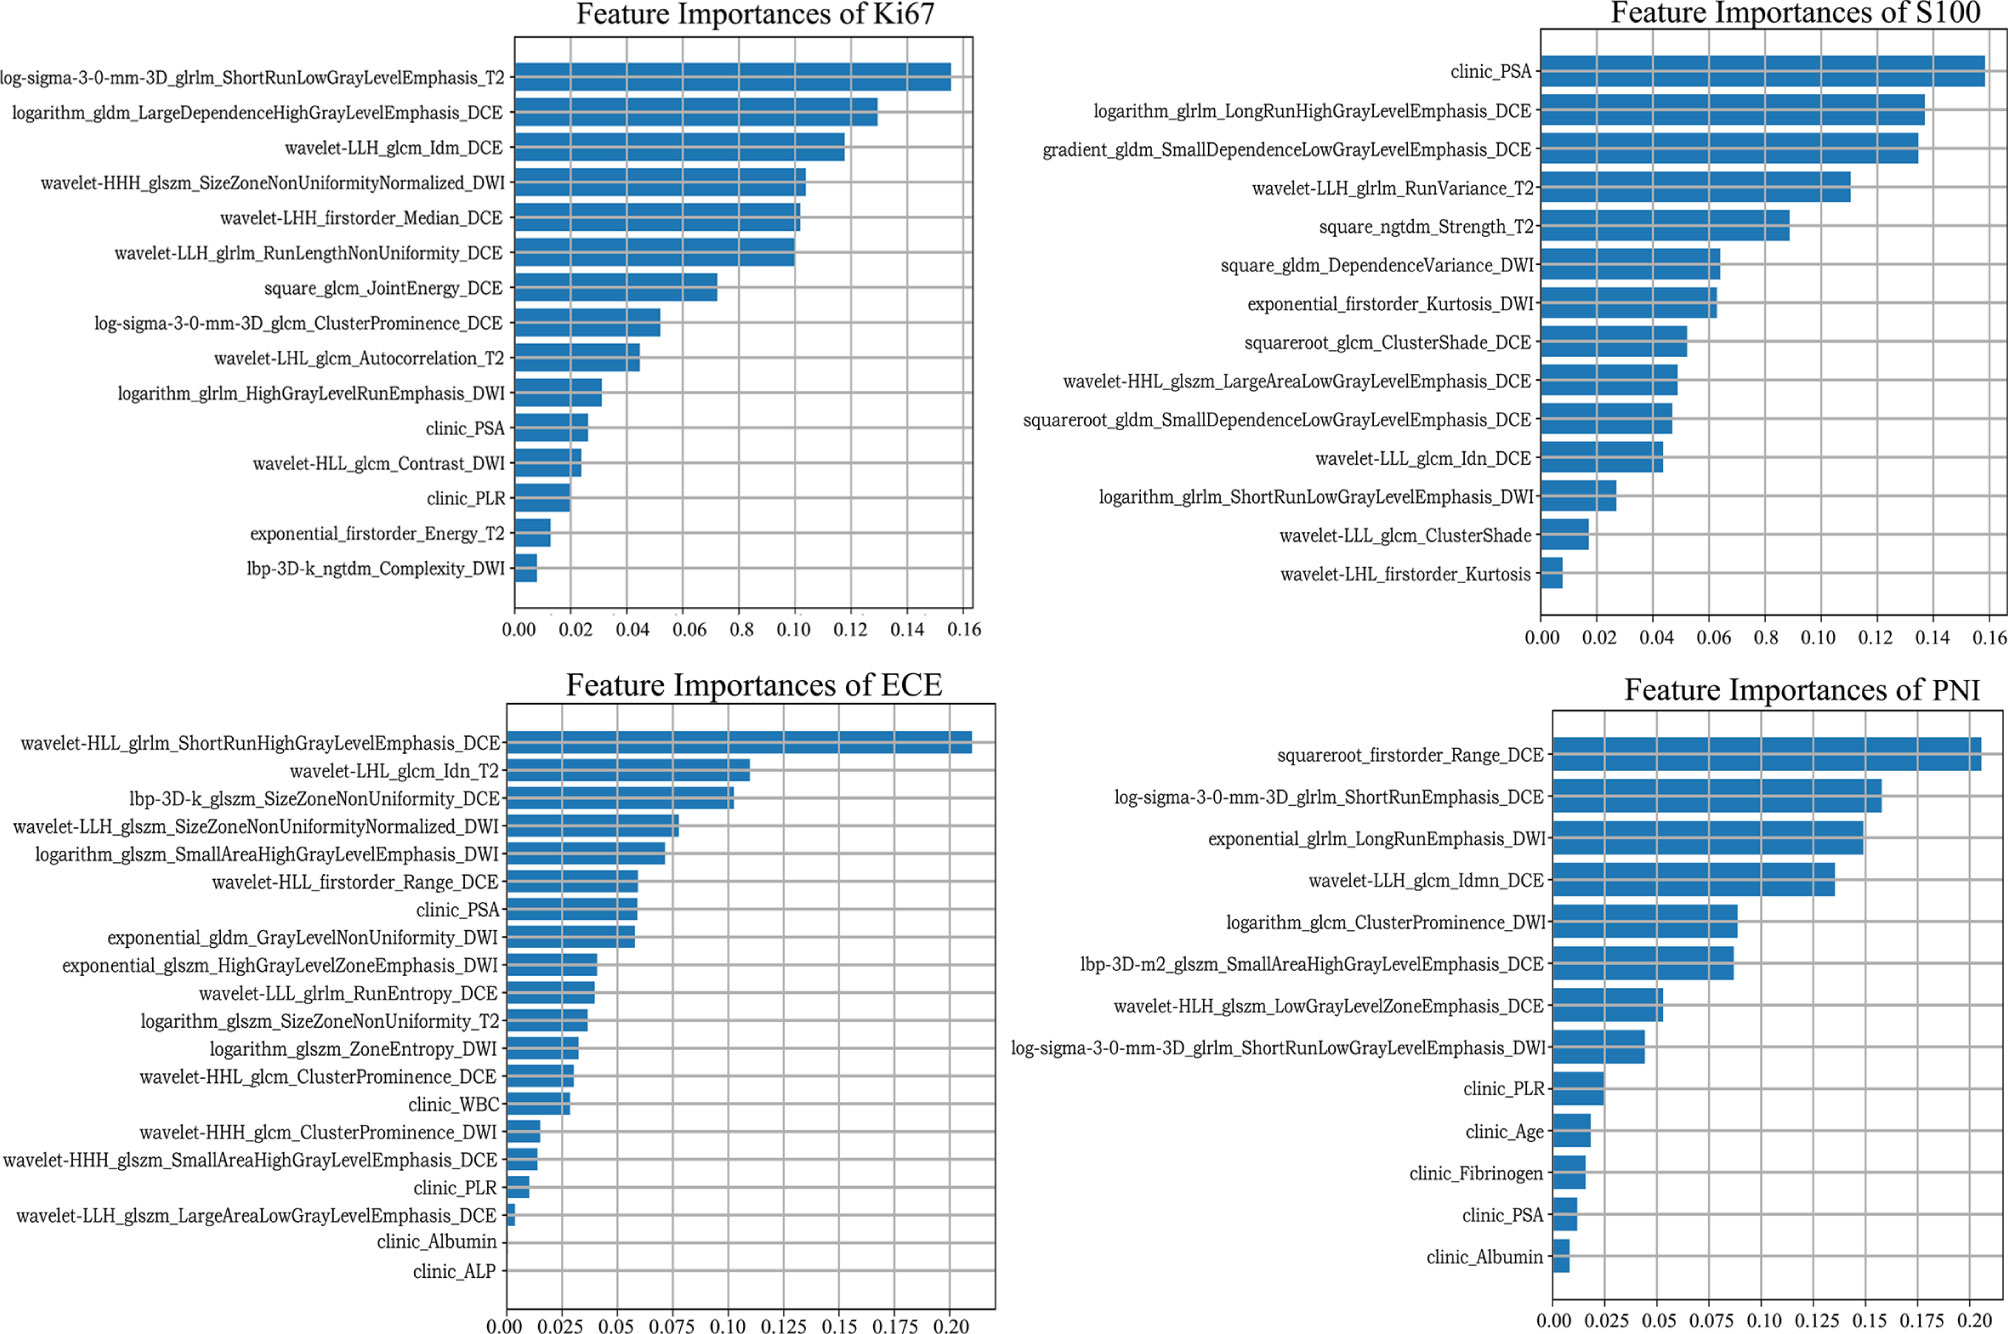
Figure 5 The inbuilt feature importance in each combined model.
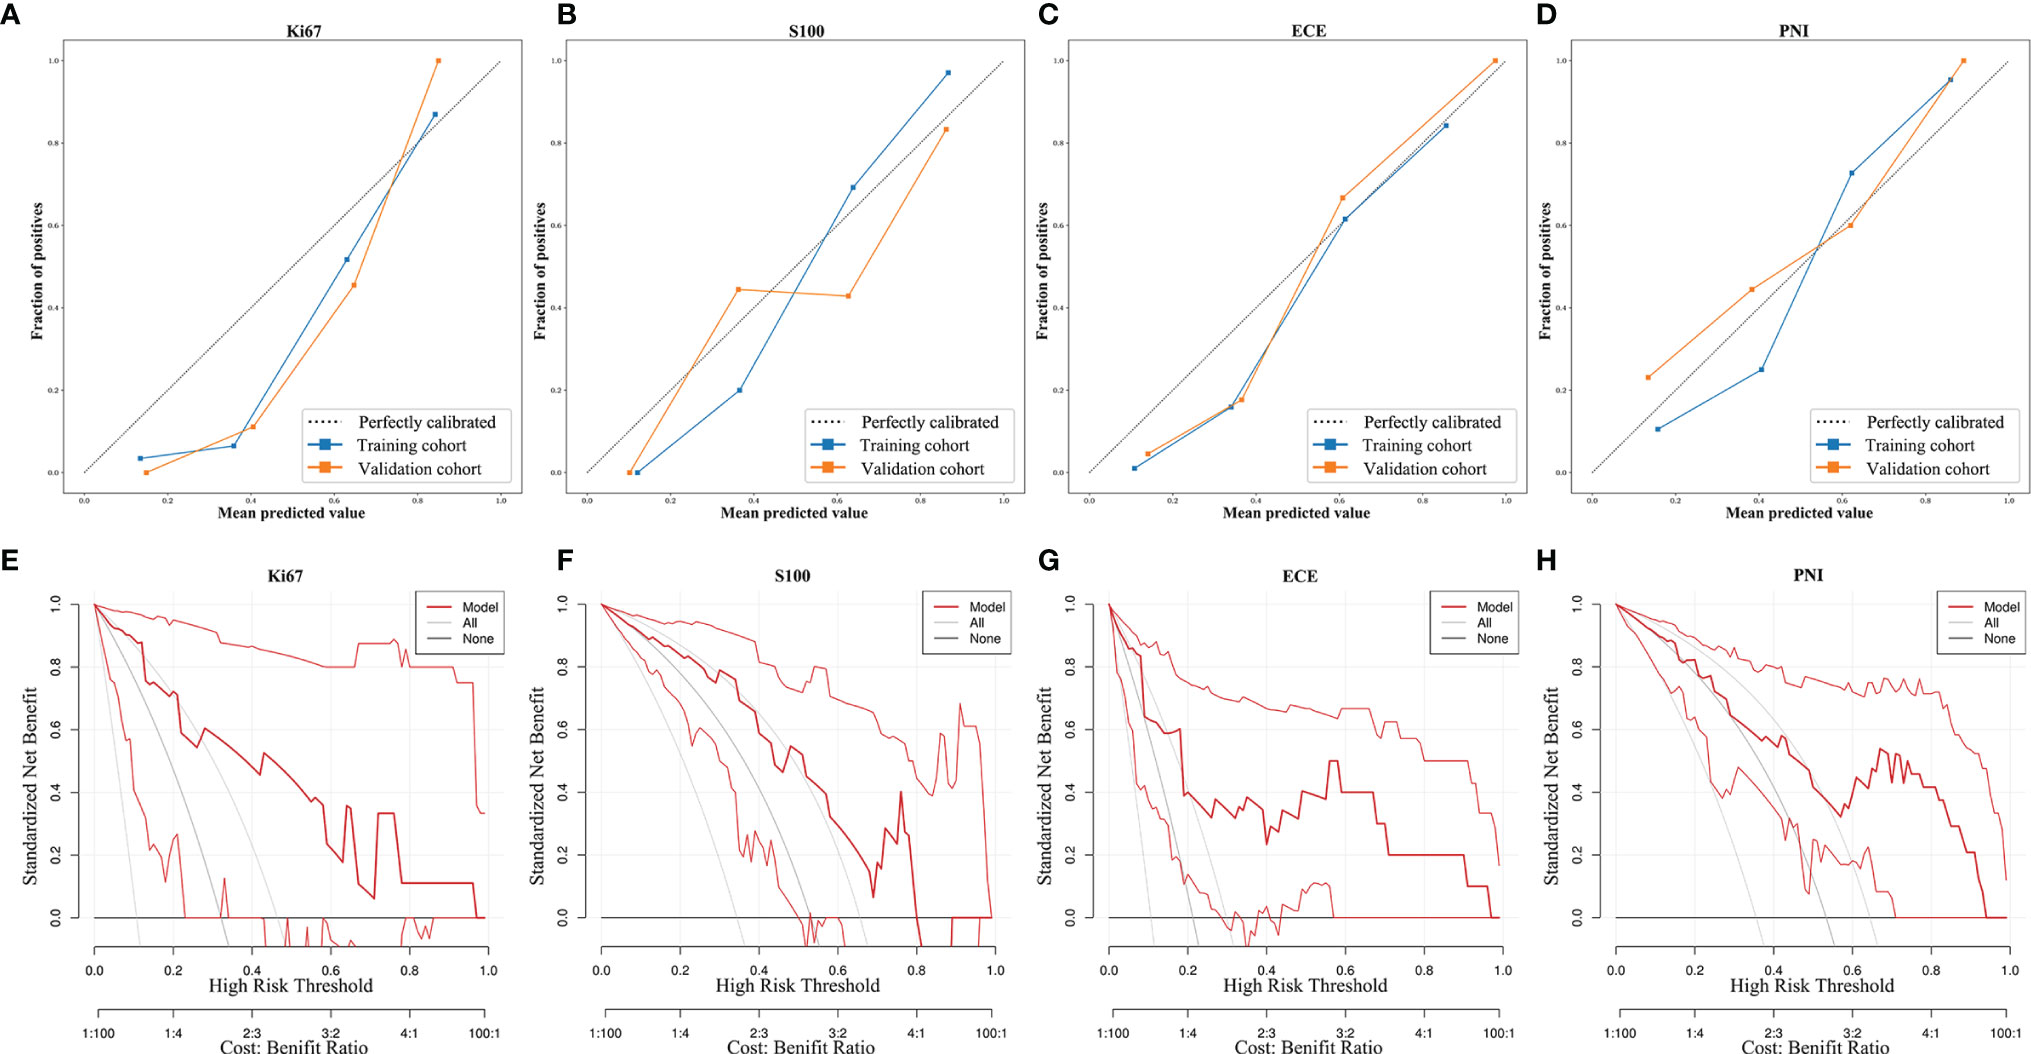
Figure 6 The calibration curves and decision curve analysis of the MP-MRI models. The calibration curves (A–D) show the consistency between the prediction model and the actuality. The dotted reference line indicated perfect calibration. The DCA (E–H) illustrated the clinical net benefits brought by the prediction model. The gray line indicated “treat all,” and the black horizontal line indicated “treat none”.
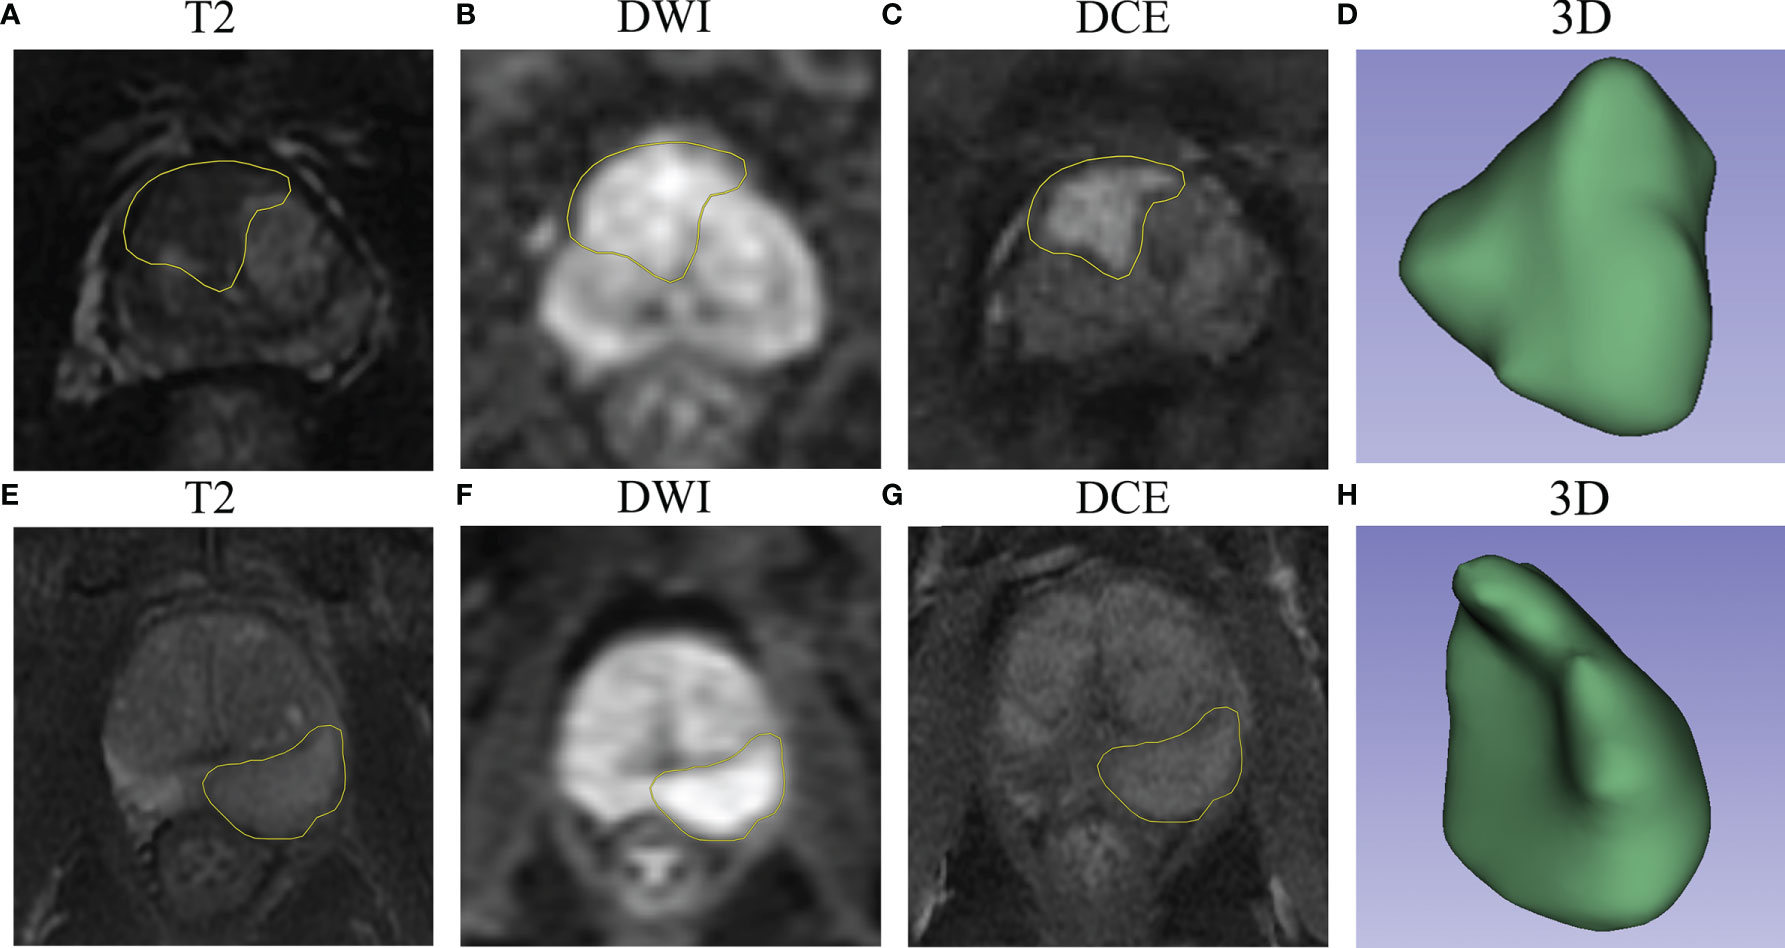
Figure 7 The examples of VOI delineation on MP-MRI. (A–D) A 66-year-old patient was pathologically diagnosed as PNI positive with a typical abnormal signal lesion in the right front of the prostate. (E–H) A 70-year-old patient was diagnosed as PNI negative with a lesion located in the left peripheral zone, and the DCE sequence showed moderate enhancement. (D, H) represent the 3-dimensional reconstruction of the VOI.
In this study, we constructed the machine-learned radiomic models based on six classifiers for the five biological characteristics (Ki67, S100, ECE, PNI, and SM) related to the invasiveness of prostate cancer. ROC curves showed that the diagnostic abilities of these models were ideal with AUC values all greater than 0.8 in the validation cohorts (except SM = 0.77). Meanwhile, we added several clinical characteristics to make the combined models, though they barely improved the accuracy of prediction.
For traditional diagnostic methods, like serum PSA test, digital rectal examinations (DREs), and prostate biopsy, they inevitably have many major deficiencies (19, 29–31). The main deficiencies are that they may lead to overdiagnosis of prostate cancer and missed diagnosis of clinically significant cancer (32–34). As shown in Supplementary Table S2, 22.6% of patients showed Gleason score 6 or less, suggesting that a relevant number of cancers below the threshold which is currently considered clinically significant cancer and leading to overdiagnosis and overtreatment. MP-MRI as a noninvasive method has been recommended as a routine examination of prostate cancer and proved to be beneficial in the detection of clinically significant cancer (21, 22). Recently, the NCCN guidelines clearly pointed out that MP-MRI was helpful to the staging and risk stratification of prostate cancer, and its combination with several biomarkers could reduce unnecessary biopsy (35). Moreover, MP-MRI contains much clinically valuable information, which has not attracted enough attention in clinical practice. Recently, artificial intelligence, such as radiomics, has shown great potential for evaluating the aggressiveness of urological tumors (36). Therefore, radiomics could be used as a novel and efficient way to dig out the information (24). Radiomics has been applied to predict many aspects of prostate cancer, such as cancer diagnosis, Gleason score, treatment response, and early biochemical recurrence (37).
Nowadays, using radiomics to predict multiple biological characteristics of tumors simultaneously has become a trend. In the research of Meng et al. (38), they proposed the radiomic models based on MP-MRI have the ability to predict multiple biological characteristics (HER-2, Ki67, differentiation, lymph node metastasis, and KRAS-2) of rectal cancers. However, to the best of our knowledge, there were fever researches to comprehensively predict various biological characteristics of prostate cancer using radiomics and achieved good diagnostic results. Bai et al. (39) reported their radiomic model could predict the presence of ECE preoperatively, but the AUC value of their integrated model was only 0.71, much lower than ours (AUC = 0.85). He et al. (40) used MP-MRI radiomics to predict ECE (AUC = 0.728, also lower than ours) and SM (AUC = 0.76, similar to ours), yet they did not comprehensively evaluate the aggressiveness of prostate cancer as ours. Therefore, our comprehensive radiomic models made it possible to predict more critical biological characteristics of prostate cancer and improve the prediction accuracy of some biological characteristics compared with the other published AI models.
In the present study, we extracted as many features as the recent literature documented. We then adopted an efficient feature selection method—mRMR, which has been proved advanced in a majority of researches (38, 41), to obtain the most relevant and least redundant features. In addition, the low redundancy of selected features could be testified by the correlation maps in Supplementary Figure S3. RFE-RF then ensured the best combinations of the included features. More and more studies use RFE-RF to select the best feature combinations, yet it needs a large amount of computation so that it is suitable for low-dimensional data after primary selection (42).
For the resulting radiomic features of each group, wavelet features account for larger proportions: 6/13 for Ki67, 5/13 for S100, 9/16 for ECE, 2/8 for PNI, and 7/20 for SM. Wavelet features are derived from the wavelet transform and represent high-dimensional features that cannot be easily deciphered by humans (43). Wavelet features could show the heterogeneity of tumors, and multiple studies have proved its strong prediction ability (38, 44). In addition, DCE sequences occupied a large part of the models. The reason may be that prostate cancer has strong ability of neovascularization, and the morphology and density of neovascularization are closely related to metastasis and prognosis of patients (45, 46). DCE-MRI is exactly a fairly adequate way to demonstrate neovascularization. Also, because of the increased vascular permeability of prostate cancer, we chose the arterial phases of DCE sequences to delineate the lesions (28).
Classifiers play an essential role in machine learning. The six classifiers that were included in this study: SVM, KNN, random forest, decision tree, logistic regression, and XGBOOST. As a result, the classification performance of random forest was generally the best among them. Random forest is composed of a large number of decision trees, and its prediction result is averaged by all the tree predictions, so it can effectively avoid over fitting. It has been documented that random forest occupied a large part of the Kaggle Data Science Competitions and ranked first among 179 classifiers (47).
It is inevitable that there are some coexisting prostatic diseases in patients with prostate cancer. In our study, coexisting diseases contained benign prostatic hyperplasia, chronic prostatitis, prostatic cyst, etc. However, they did not have a great impact on our study and our models still achieved favorable distinguishing ability. The reason may be that the features selected by our screening methods have strong specificity for the corresponding biological characteristics, and many of them reflect the complexity of the lesions, such as texture features (48). For coexisting diseases like prostatic hyperplasia, the density of lesions was relatively more consistent on MP-MRI and they would not make a remarkable difference to the accuracy of our models. The established model should be more applicable to clinical reality. If they were only applied to target diseases and excluding coexisting diseases, the clinical application of the models would be seriously limited.
Although radiomics shows huge potential for the improvement of clinical diagnosis and risk stratification, its practical clinical application is still subject to many difficulties, and its real benefits are required to be further confirmed in prospective cohort studies (49). However, radiomics plays an increasingly important role in medical imaging, and it provides a unique basis for personalized precision treatment (50). In our study, we proved the applicability of radiomics in predicting the multiple biological characteristics of prostate cancer, and we also provided relatively detailed protocol for MP-MRI and key machine-learning parameters to offer a reference for the standardization work in the future (51). The next main steps of radiomics could be to take advantage of deep learning methods (for example, U-Net) to delineate the ROI automatically and to prove the robustness of the radiomic models through multicenter, prospective, randomized-controlled trials (52).
This study had the following limitations: Firstly, this study was a retrospective and single-center study, and this inevitably led to selection bias and lack of samples and external verification. Secondly, some valuable biological characteristics or biomarkers were not included in the model due to incomplete data, for example, gene mutation data, which had great guiding significance for clinical treatment. Thirdly, our models were not as intuitive as a nomogram due to the algorithm of random forest and SVM with polynomial kernel function. Fourthly, the delineation of lesions was performed manually instead of computer-aided, which may lead to inconsistencies in clinical practice. Therefore, our next research focus will be put on multicenter, prospective, more clinically feasible, large-scale, and valuable indicator-based studies.
The present work associated the radiomics features of MP-MRI with five biological characteristics related to the aggressiveness of prostate cancer. The established comprehensive models made it possible to predict more critical biological characteristics of prostate cancer and achieved favorable prediction abilities. Therefore, the models are expected to noninvasively evaluate the risk stratification of prostate cancer and provide valuable guidance for clinical decision-making.
The raw data supporting the conclusions of this article will be made available by the authors, without undue reservation.
The studies involving human participants were reviewed and approved by the Institutional Review Board (IRB) of Shanghai General Hospital (2021KY107). The ethics committee waived the requirement of written informed consent for participation. Written informed consent was not obtained from the individual(s) for the publication of any potentially identifiable images or data included in this article.
XY, HW, and XF designed the study. NX, TL, RC, and HY acquired the data. MH, ZW, and HL analyzed the data. XF and NX wrote the report, which was edited by all authors. YW and XY supervised the project. All authors contributed to the article and approved the submitted version.
This research is financially supported by the National Natural Science Foundation of China (81871400), the Project of Shanghai Science and Technology Committee (19411951403), and the Key Project of Shanghai Education Commission (202101070002E00085).
Author HL was employed by Yizhun Medical Technology Co. Ltd., Beijing, China.
The remaining authors declare that the research was conducted in the absence of any commercial or financial relationships that could be construed as a potential conflict of interest.
All claims expressed in this article are solely those of the authors and do not necessarily represent those of their affiliated organizations, or those of the publisher, the editors and the reviewers. Any product that may be evaluated in this article, or claim that may be made by its manufacturer, is not guaranteed or endorsed by the publisher.
We would like to thank Yizhun Medical AI Technology Co. Ltd, who kindly provided the DARWIN platform and some technical support.
The Supplementary Material for this article can be found online at: https://www.frontiersin.org/articles/10.3389/fonc.2022.839621/full#supplementary-material
1. Siegel RL, Miller KD, Fuchs HE, Jemal A. Cancer Statistics, 2021. CA Cancer J Clin (2021) 71(1):7–33. doi: 10.3322/caac.21654
2. Cuzick J, Thorat MA, Andriole G, Brawley OW, Brown PH, Culig Z, et al. Prevention and Early Detection of Prostate Cancer. Lancet Oncol (2014) 15(11):e484–92. doi: 10.1016/s1470-2045(14)70211-6
3. Malik A, Srinivasan S, Batra J. A New Era of Prostate Cancer Precision Medicine. Front Oncol (2019) 9:1263. doi: 10.3389/fonc.2019.01263
4. Bhavsar T, McCue P, Birbe R. Molecular Diagnosis of Prostate Cancer: Are We Up to Age? Semin Oncol (2013) 40(3):259–75. doi: 10.1053/j.seminoncol.2013.04.002
5. Hoogland AM, Kweldam CF, van Leenders GJ. Prognostic Histopathological and Molecular Markers on Prostate Cancer Needle-Biopsies: A Review. BioMed Res Int (2014) 2014:341324. doi: 10.1155/2014/341324
6. Moussa AS, Li J, Soriano M, Klein EA, Dong F, Jones JS. Prostate Biopsy Clinical and Pathological Variables That Predict Significant Grading Changes in Patients With Intermediate and High Grade Prostate Cancer. BJU Int (2009) 103(1):43–8. doi: 10.1111/j.1464-410X.2008.08059.x
7. Zellweger T, Günther S, Zlobec I, Savic S, Sauter G, Moch H, et al. Tumour Growth Fraction Measured by Immunohistochemical Staining of Ki67 Is an Independent Prognostic Factor in Preoperative Prostate Biopsies With Small-Volume or Low-Grade Prostate Cancer. Int J Cancer (2009) 124(9):2116–23. doi: 10.1002/ijc.24174
8. Tollefson MK, Karnes RJ, Kwon ED, Lohse CM, Rangel LJ, Mynderse LA, et al. Prostate Cancer Ki-67 (MIB-1) Expression, Perineural Invasion, and Gleason Score as Biopsy-Based Predictors of Prostate Cancer Mortality: The Mayo Model. Mayo Clin Proc (2014) 89(3):308–18. doi: 10.1016/j.mayocp.2013.12.001
9. Salama I, Malone PS, Mihaimeed F, Jones JL. A Review of the S100 Proteins in Cancer. Eur J Surg Oncol (2008) 34(4):357–64. doi: 10.1016/j.ejso.2007.04.009
10. Åberg AM, Bergström SH, Thysell E, Tjon-Kon-Fat LA, Nilsson JA, Widmark A, et al. High Monocyte Count and Expression of S100A9 and S100A12 in Peripheral Blood Mononuclear Cells Are Associated With Poor Outcome in Patients With Metastatic Prostate Cancer. Cancers (Basel) (2021) 13(10):2424. doi: 10.3390/cancers13102424
11. Bill-Axelson A, Holmberg L, Garmo H, Taari K, Busch C, Nordling S, et al. Radical Prostatectomy or Watchful Waiting in Prostate Cancer - 29-Year Follow-Up. N Engl J Med (2018) 379(24):2319–29. doi: 10.1056/NEJMoa1807801
12. Zhang L, Wu B, Zha Z, Zhao H, Yuan J, Jiang Y, et al. Surgical Margin Status and Its Impact on Prostate Cancer Prognosis After Radical Prostatectomy: A Meta-Analysis. World J Urol (2018) 36(11):1803–15. doi: 10.1007/s00345-018-2333-4
13. Zhang B, Zhou J, Wu S, Guo M, Zhang Y, Liu R. The Impact of Surgical Margin Status on Prostate Cancer-Specific Mortality After Radical Prostatectomy: A Systematic Review and Meta-Analysis. Clin Transl Oncol (2020) 22(11):2087–96. doi: 10.1007/s12094-020-02358-y
14. Meeks JJ, Eastham JA. Radical Prostatectomy: Positive Surgical Margins Matter. Urol Oncol (2013) 31(7):974–9. doi: 10.1016/j.urolonc.2011.12.011
15. Liebig C, Ayala G, Wilks JA, Berger DH, Albo D. Perineural Invasion in Cancer: A Review of the Literature. Cancer (2009) 115(15):3379–91. doi: 10.1002/cncr.24396
16. Zareba P, Flavin R, Isikbay M, Rider JR, Gerke TA, Finn S, et al. Perineural Invasion and Risk of Lethal Prostate Cancer. Cancer Epidemiol Biomarkers Prev (2017) 26(5):719–26. doi: 10.1158/1055-9965.Epi-16-0237
17. Zhang LJ, Wu B, Zha ZL, Qu W, Zhao H, Yuan J, et al. Perineural Invasion as an Independent Predictor of Biochemical Recurrence in Prostate Cancer Following Radical Prostatectomy or Radiotherapy: A Systematic Review and Meta-Analysis. BMC Urol (2018) 18(1):5. doi: 10.1186/s12894-018-0319-6
18. Rapisarda S, Bada M, Crocetto F, Barone B, Arcaniolo D, Polara A, et al. The Role of Multiparametric Resonance and Biopsy in Prostate Cancer Detection: Comparison With Definitive Histological Report After Laparoscopic/Robotic Radical Prostatectomy. Abdom Radiol (NY) (2020) 45(12):4178–84. doi: 10.1007/s00261-020-02798-8
19. Rosario DJ, Lane JA, Metcalfe C, Donovan JL, Doble A, Goodwin L, et al. Short Term Outcomes of Prostate Biopsy in Men Tested for Cancer by Prostate Specific Antigen: Prospective Evaluation Within ProtecT Study. BMJ (2012) 344:d7894. doi: 10.1136/bmj.d7894
20. Wibmer AG, Vargas HA, Hricak H. Role of MRI in the Diagnosis and Management of Prostate Cancer. Future Oncol (2015) 11(20):2757–66. doi: 10.2217/fon.15.206
21. Stabile A, Giganti F, Rosenkrantz AB, Taneja SS, Villeirs G, Gill IS, et al. Multiparametric MRI for Prostate Cancer Diagnosis: Current Status and Future Directions. Nat Rev Urol (2020) 17(1):41–61. doi: 10.1038/s41585-019-0212-4
22. Patel P, Wang S, Siddiqui MM. The Use of Multiparametric Magnetic Resonance Imaging (mpMRI) in the Detection, Evaluation, and Surveillance of Clinically Significant Prostate Cancer (csPCa). Curr Urol Rep (2019) 20(10):60. doi: 10.1007/s11934-019-0926-0
23. Checcucci E, Amparore D, De Luca S, Autorino R, Fiori C, Porpiglia F. Precision Prostate Cancer Surgery: An Overview of New Technologies and Techniques. Minerva Urol Nefrol (2019) 71(5):487–501. doi: 10.23736/s0393-2249.19.03365-4
24. Lambin P, Rios-Velazquez E, Leijenaar R, Carvalho S, van Stiphout RG, Granton P, et al. Radiomics: Extracting More Information From Medical Images Using Advanced Feature Analysis. Eur J Cancer (2012) 48(4):441–6. doi: 10.1016/j.ejca.2011.11.036
25. Checcucci E, Autorino R, Cacciamani GE, Amparore D, De Cillis S, Piana A, et al. Artificial Intelligence and Neural Networks in Urology: Current Clinical Applications. Minerva Urol Nefrol (2020) 72(1):49–57. doi: 10.23736/s0393-2249.19.03613-0
26. Smith CP, Czarniecki M, Mehralivand S, Stoyanova R, Choyke PL, Harmon S, et al. Radiomics and Radiogenomics of Prostate Cancer. Abdom Radiol (NY) (2019) 44(6):2021–9. doi: 10.1007/s00261-018-1660-7
27. Sun Y, Reynolds HM, Parameswaran B, Wraith D, Finnegan ME, Williams S, et al. Multiparametric MRI and Radiomics in Prostate Cancer: A Review. Australas Phys Eng Sci Med (2019) 42(1):3–25. doi: 10.1007/s13246-019-00730-z
28. Weinreb JC, Barentsz JO, Choyke PL, Cornud F, Haider MA, Macura KJ, et al. PI-RADS Prostate Imaging - Reporting and Data System: 2015, Version 2. Eur Urol (2016) 69(1):16–40. doi: 10.1016/j.eururo.2015.08.052
29. Howrey BT, Kuo YF, Lin YL, Goodwin JS. The Impact of PSA Screening on Prostate Cancer Mortality and Overdiagnosis of Prostate Cancer in the United States. J Gerontol A Biol Sci Med Sci (2013) 68(1):56–61. doi: 10.1093/gerona/gls135
30. Schröder FH, Hugosson J, Roobol MJ, Tammela TL, Ciatto S, Nelen V, et al. Screening and Prostate-Cancer Mortality in a Randomized European Study. N Engl J Med (2009) 360(13):1320–8. doi: 10.1056/NEJMoa0810084
31. Kasivisvanathan V, Rannikko AS, Borghi M, Panebianco V, Mynderse LA, Vaarala MH, et al. MRI-Targeted or Standard Biopsy for Prostate-Cancer Diagnosis. N Engl J Med (2018) 378(19):1767–77. doi: 10.1056/NEJMoa1801993
32. Chang AJ, Autio KA, Roach M 3rd, Scher HI. High-Risk Prostate Cancer-Classification and Therapy. Nat Rev Clin Oncol (2014) 11(6):308–23. doi: 10.1038/nrclinonc.2014.68
33. Cowan T, Baker E, McCray G, Reeves F, Houlihan K, Johns-Putra L. Detection of Clinically Significant Cancer in the Anterior Prostate by Transperineal Biopsy. BJU Int (2020) 126 Suppl 1:33–7. doi: 10.1111/bju.15124
34. Bangma CH, Roobol MJ. Defining and Predicting Indolent and Low Risk Prostate Cancer. Crit Rev Oncol Hematol (2012) 83(2):235–41. doi: 10.1016/j.critrevonc.2011.10.003
35. Carroll PH, Mohler JL. NCCN Guidelines Updates: Prostate Cancer and Prostate Cancer Early Detection. J Natl Compr Canc Netw (2018) 16(5s):620–3. doi: 10.6004/jnccn.2018.0036
36. Checcucci E, De Cillis S, Granato S, Chang P, Afyouni AS, Okhunov Z. Applications of Neural Networks in Urology: A Systematic Review. Curr Opin Urol (2020) 30(6):788–807. doi: 10.1097/mou.0000000000000814
37. Suarez-Ibarrola R, Hein S, Reis G, Gratzke C, Miernik A. Current and Future Applications of Machine and Deep Learning in Urology: A Review of the Literature on Urolithiasis, Renal Cell Carcinoma, and Bladder and Prostate Cancer. World J Urol (2020) 38(10):2329–47. doi: 10.1007/s00345-019-03000-5
38. Meng X, Xia W, Xie P, Zhang R, Li W, Wang M, et al. Preoperative Radiomic Signature Based on Multiparametric Magnetic Resonance Imaging for Noninvasive Evaluation of Biological Characteristics in Rectal Cancer. Eur Radiol (2019) 29(6):3200–9. doi: 10.1007/s00330-018-5763-x
39. Bai H, Xia W, Ji X, He D, Zhao X, Bao J, et al. Multiparametric Magnetic Resonance Imaging-Based Peritumoral Radiomics for Preoperative Prediction of the Presence of Extracapsular Extension With Prostate Cancer. J Magn Reson Imaging (2021) 54(4):1222–30. doi: 10.1002/jmri.27678
40. He D, Wang X, Fu C, Wei X, Bao J, Ji X, et al. MRI-Based Radiomics Models to Assess Prostate Cancer, Extracapsular Extension and Positive Surgical Margins. Cancer Imaging (2021) 21(1):46. doi: 10.1186/s40644-021-00414-6
41. De Jay N, Papillon-Cavanagh S, Olsen C, El-Hachem N, Bontempi G, Haibe-Kains B. mRMRe: An R Package for Parallelized mRMR Ensemble Feature Selection. Bioinformatics (2013) 29(18):2365–8. doi: 10.1093/bioinformatics/btt383
42. Tana MM, McCoy D, Lee B, Patel R, Lin J, Ohliger MA. Texture Features From Computed Tomography Correlate With Markers of Severity in Acute Alcohol-Associated Hepatitis. Sci Rep (2020) 10(1):17980. doi: 10.1038/s41598-020-74599-4
43. Bhattacharjee S, Kim CH, Park HG, Prakash D, Madusanka N, Cho NH, et al. Multi-Features Classification of Prostate Carcinoma Observed in Histological Sections: Analysis of Wavelet-Based Texture and Colour Features. Cancers (Basel) (2019) 11(12):1937. doi: 10.3390/cancers11121937
44. Aerts HJ, Velazquez ER, Leijenaar RT, Parmar C, Grossmann P, Carvalho S, et al. Decoding Tumour Phenotype by Noninvasive Imaging Using a Quantitative Radiomics Approach. Nat Commun (2014) 5:4006. doi: 10.1038/ncomms5006
45. Berman RM, Brown AM, Chang SD, Sankineni S, Kadakia M, Wood BJ, et al. DCE MRI of Prostate Cancer. Abdom Radiol (NY) (2016) 41(5):844–53. doi: 10.1007/s00261-015-0589-3
46. Mucci LA, Powolny A, Giovannucci E, Liao Z, Kenfield SA, Shen R, et al. Prospective Study of Prostate Tumor Angiogenesis and Cancer-Specific Mortality in the Health Professionals Follow-Up Study. J Clin Oncol (2009) 27(33):5627–33. doi: 10.1200/jco.2008.20.8876
47. Fernandez-Delgado M, Cernadas E, Barro S, Amorim D. Do We Need Hundreds of Classifiers to Solve Real World Classification Problems? J Mach Learn Res (2014) 15:3133–81. doi: 10.1117/1.JRS.11.015020
48. Xu X, Zhang X, Tian Q, Zhang G, Liu Y, Cui G, et al. Three-Dimensional Texture Features From Intensity and High-Order Derivative Maps for the Discrimination Between Bladder Tumors and Wall Tissues via MRI. Int J Comput Assist Radiol Surg (2017) 12(4):645–56. doi: 10.1007/s11548-017-1522-8
49. Ferro M, de Cobelli O, Vartolomei MD, Lucarelli G, Crocetto F, Barone B, et al. Prostate Cancer Radiogenomics-From Imaging to Molecular Characterization. Int J Mol Sci (2021) 22(18):9971. doi: 10.3390/ijms22189971
50. Lambin P, Leijenaar RTH, Deist TM, Peerlings J, de Jong EEC, van Timmeren J, et al. Radiomics: The Bridge Between Medical Imaging and Personalized Medicine. Nat Rev Clin Oncol (2017) 14(12):749–62. doi: 10.1038/nrclinonc.2017.141
51. Papadimitroulas P, Brocki L, Christopher Chung N, Marchadour W, Vermet F, Gaubert L, et al. Artificial Intelligence: Deep Learning in Oncological Radiomics and Challenges of Interpretability and Data Harmonization. Phys Med (2021) 83:108–21. doi: 10.1016/j.ejmp.2021.03.009
Keywords: radiomics, prostate cancer, magnetic resonance imaging, biological characteristics, risk stratification
Citation: Fan X, Xie N, Chen J, Li T, Cao R, Yu H, He M, Wang Z, Wang Y, Liu H, Wang H and Yin X (2022) Multiparametric MRI and Machine Learning Based Radiomic Models for Preoperative Prediction of Multiple Biological Characteristics in Prostate Cancer. Front. Oncol. 12:839621. doi: 10.3389/fonc.2022.839621
Received: 20 December 2021; Accepted: 11 January 2022;
Published: 07 February 2022.
Edited by:
Daniel Rodriguez Gutierrez, Nottingham University Hospitals NHS Trust, United KingdomReviewed by:
Felice Crocetto, Federico II University Hospital, ItalyCopyright © 2022 Fan, Xie, Chen, Li, Cao, Yu, He, Wang, Wang, Liu, Wang and Yin. This is an open-access article distributed under the terms of the Creative Commons Attribution License (CC BY). The use, distribution or reproduction in other forums is permitted, provided the original author(s) and the copyright owner(s) are credited and that the original publication in this journal is cited, in accordance with accepted academic practice. No use, distribution or reproduction is permitted which does not comply with these terms.
*Correspondence: Xiaorui Yin, eWlueGlhb3J1aThAMTYzLmNvbQ==; Han Wang, aGFuLndhbmdAc2hzbXUuZWR1LmNu
†These authors have contributed equally to this work and share first authorship
Disclaimer: All claims expressed in this article are solely those of the authors and do not necessarily represent those of their affiliated organizations, or those of the publisher, the editors and the reviewers. Any product that may be evaluated in this article or claim that may be made by its manufacturer is not guaranteed or endorsed by the publisher.
Research integrity at Frontiers
Learn more about the work of our research integrity team to safeguard the quality of each article we publish.