Abstract
Background:
This study aims to explore the key targets and signaling pathways of the traditional Chinese medicine Phellodendron and Anemarrhena drug pair (PADP) for the treatment of liver cancer.
Methods:
Firstly, bioinformatics technology was used to analyze GSE62232 gene chip to obtain the differential genes of liver cancer. A network pharmacology technology was used to find the active components of PADP and their targets. Secondly, the differential genes were imported into STRING database to draw a PPI network, and network topology structure map combined with Cytoscape software. And the R language was used to identify differential gene targets and pathways through GO and KEGG pathway enrichment analysis. In addition, AutoDock Vina was used for molecular docking of core targets and core compounds. Moreover, GEPIA online analysis tool was used to perform survival analysis of the core target genes. Finally, RT-PCR was used to verify the changes of key target genes. CCK−8 assay was performed to detect cell proliferation. Flow cytometry was performed to detect the cell cycle and apoptotic. Transwell invasion assay was performed to detect cell invasion.
Results:
Firstly, a total of 21,654 genes were obtained. After screening, 1019 differential genes were obtained, including 614 down-regulated genes and 405 up-regulated genes. Furthermore, after screening by ADME standards, 52 active ingredients were obtained, of which 37 were Phellodendron and 15 were Anemarrhena. And a total of 36 differential genes have been identified, including 13 up-regulated genes and 23 down-regulated genes. Moreover, through enrichment analysis, we found that PADP may treat liver cancer through multiple channels and multiple pathways including the p53 signaling pathway, IL-17 signaling pathway, TNF signaling pathway, Toll-like receptor signaling pathway and so on. Secondly, the molecular docking results showed that there was certain affinity between the core compounds and core target genes. In addition, GEPIA online analysis showed that ESR1, AR, CCNB1, CDK1, AKR1C3 and CCNA2 might become potential target genes for the survival and prognosis of PADP for the treatment of liver cancer. Finally, it was found that PADP could up regulate genes ESR1 and AR, down regulate genes CCNB1, CDK1, AKR1C3, and CCNA2. PADP could promote the apoptosis of liver cancer cells, shorten the cell cycle, and inhibit the proliferation and invasion of liver cancer cells.
Conclusion:
PADP may treat liver cancer through multiple targets, multiple channels, and multiple pathways, thereby suppressing cancer cells and improving the living quality of patients.
Introduction
As we all know, liver cancer is the third leading cause of cancer-related deaths, especially in developing countries, where the incidence has increased in recent years. Globally, there are approximately 630,000 new liver cancer cases each year, more than half of which occur in China (1). With high morbidity and death rates, liver cancer has become one of the most common cancers in the world (2). At present, the prognosis of liver cancer after chemotherapy, radiotherapy, and surgery is the main focus of medical research (3). Traditional Chinese medicine plays a vital role in the treatment of early liver cancer, reducing the complications of radiotherapy, chemotherapy and postoperative surgery in the advanced liver cancer, and improving the clinical symptoms of patients. The combination of Phellodendron and Anemarrhena is a well-known drug pair of traditional Chinese medicine, which has significant effect in the treatment of liver cancer with damp-heat and liver-kidney yin deficiency. Phellodendron has the effects of clearing away heat and dampness, purging fire and detoxifying, nourishing yin and reducing fire. Modern pharmacological studies have shown that Phellodendron contains many active ingredients and exerts a wide range of physiological activities. It includes anti-tumor activity, antibacterial and immunosuppressive (4). At the same time, as a traditional Chinese herbal medicine, Anemarrhena possesses the effects of nourishing yin, moistening dryness, clearing heat and purging fire (5). Studies have shown that Anemarrhena has protective effect on the liver (6) and has anti-tumor effects (7). Overall, PADP has positive effect on inhibiting the growth of cancer cells in patients with liver cancer, alleviating clinical symptoms of patients, improving their living quality, and increasing the survival period of patients. Due to the complex composition of traditional Chinese medicines (8), it is difficult for traditional pharmacological research methods to systematically explain the mechanism of action and signaling pathways of PADP on the treatment of liver cancer. Therefore, the mechanism of PADP on the treatment of liver cancer has not yet been clarified.
Traditional Chinese medicine network pharmacology is a technology that integrates multiple disciplines such as systems biology, pharmacology, and computer analysis (9–11). It connects drugs and diseases from an overall perspective, and provides new strategies for exploring the mechanism of traditional Chinese medicine and developing new drugs. At present, the research and development of traditional Chinese medicine urgently necessitates the application of network pharmacology of traditional Chinese medicine, which coincides with the thinking model of the overall view of traditional Chinese medicine. Bioinformatics is a new discipline based on the intersection of molecular biology and mathematics, computer science, statistics and other disciplines. It can be used to study the relationship and laws of biological genes and diseases. In addition, it has rapidly developed into the most attractive frontier of life sciences today (12, 13). Molecular docking plays an important guiding role in the development and design of drugs and may provide keen insights in protein function prediction and other important issues.
This article used network pharmacology combined with bioinformatics technology to explore the mechanism and signaling pathways of PADP for the treatment of liver cancer and used molecular docking technology and cell assays to verify the results.
Materials and Methods
Data Acquisition and Annotation of GEO Gene Chip
The liver cancer related targets were obtained from the GEO database (https://www.ncbi.nlm.nih.gov/geo/) developed by the National Center for Biotechnology Information, and the original gene chip data number GSE62232 was downloaded. The gene chip data set, which has a total of 91 samples, including 81 liver tumor samples from liver cancer patients and 10 normal human liver tissue samples, was derived from the gene chip sequencing of the University of Battieril, France. And the samples were detected using the Affymetrix U133plus v2 array (GPL570) platform. Finally, the Perl language was used to annotate the GEO data, that was, converting the probe matrix into a gene matrix.
Acquisition of Differential Genes
Firstly, the above genes were divided into tumor group and normal group by Perl language. Then the limma software package in R language was used to analyze the gene chip data to obtain the gene differential expressions (DEGs) between tumor group and normal group in GPL570. The logFC and adjusted P value were used as the screening conditions. Genes that met |LogFC| ≥1 and adjusted P<0.05 were considered as significantly differentially expressed genes. The volcano plot and heatmap plot of the corresponding differential genes were obtained using the pheatmap package in R language.
Acquisition of Chemical Components and Targets of PADP
In this study, the Traditional Chinese Medicine Systems Pharmacology Database and Analysis Platform (TCMSP) (14) (http://tcmspw.com/tcmsp.php) was used to obtain the active chemical components and to predict targets of Phellodendron and Anemarrhena. In the reference standard for evaluating whether a compound can become a drug, oral bioavailability (OB) and drug-like (DL) are two commonly used indicators (15). Here, we used OB ≥ 30% and DL ≥ 0.18 as the screening threshold to obtain the active components of Phellodendron and Anemarrhena. At the same time, Perl language was used to predict the target genes corresponding to the above active components in the TCMSP database. Combined with the UniProt database (16) (http://www.uniprot.org/, update in 2018-04-10), the full name of the retrieved gene was converted into its official name (gene symbol).
Compounds-Targets Network Diagram
The active compounds selected by the above TCMSP database and their predicted target genes were imported into Cytoscape_v3.6.1 software (17) (http://www.Cytoscape.org/) to construct a compounds-targets network diagram.
Intersection of Disease Genes and Drug Genes
The target genes predicted by the effective components of Phellodendron and Anemarrhena were intersected with the up-regulated and down-regulated genes respectively in the differential genes of liver cancer. Using the “VennDiagram” package in R to draw a Venn diagram.
Construction of Traditional Chinese Medicine Compound Regulation Network
The target genes predicted by the active ingredients of PADP and the differential genes of liver cancer were intersected and imported into the Cytoscape_v3.6.1 software to construct an ingredients–targets network diagram of PADP in the treatment of liver cancer. Then, the above-mentioned intersection genes were imported into the STRING database (https://string-db.org/) for protein-protein interaction (PPI) analysis, the txt file was downloaded and copied to excel for annotation, and then imported into Cytoscape software to draw the core genes PPI network diagram. At the same time, the intersection genes were introduced into R language to draw core genes bar graph.
PPI and Network Topology Analysis
The above intersection genes were input into Cytoscape software, and the “Bisogenet” package in the software was used for PPI analysis to obtain a PPI network diagram, while the CytoNCA package in the software was used for network topology analysis. And the DTP, BIOGRID, HPRD, INTACT, MIMT, BIND were selected as data sources.
GO Analysis and KEGG Pathway Enrichment Analysis
Combining Gene Ontology (GO) (http://GeneOntology.org/) and Kyoto Encyclopedia of Genes and Genomes (KEGG) (https://www.kegg.jp/kegg/), “colorspace”, “stringi”, “ggplot2” packages in R language and “DOSE”, “clusterProfiler”, “enrichplot” packages in BiocManager database (18) (http://www.bioconductor.org/) were applied. Selected the filter condition organization = “hsa” and set “P vulue Cutoff = 0.05 and Q vulue Cutoff = 0.05”. Cellular component (CC), biological process (BP) and molecular function (MF) biological processes of GO enrichment analysis were shown in the form of bubble charts, and KEGG pathway enrichment analysis was shown in the form of bar charts.
Construction of KEGG Relationship Network
The pathway ID number and the genes enriched by the pathway were respectively imported into Cytoscape software. And then the number of adjacent nodes in the network was calculated and the size of the nodes in the network was determined according to the number of adjacent nodes to construct a KEGG relationship network.
Molecular Docking Verification of Core Compounds and Core Target Genes
Firstly, select the top 10 core compounds and download the two-dimensional structure diagrams of the compounds from the PubChem database, import Chem3D software to draw the three-dimensional structure diagrams of the core compounds and optimize the energy, save them in mol2 format, and then import the AutoDockTools-1.5.6 software to add charge, display rotatable keys, and save as pdbqt format. Secondly, download the protein crystals corresponding to the top 10 down-regulated genes and the top 5 up-regulated genes in the PDB database, import Pymol software to remove water molecules and heteromolecules, and then import AutoDockTools-1.5.6 software to add hydrogen atoms and charge operations, save to pdbqt format, and then import Discovery Studio 3.5 Client software to search for active pockets. Finally, the above core compounds were used as ligands, and core target gene corresponding proteins were used as receptors for molecular docking, and the results of interaction force were analyzed and interpreted using Discovery Studio 3.5 Client.
Survival Analyses for Hub Genes
The association between overall survival (OS) and the hub genes was determined using the online tool GEPIA. The lower 25% and upper 75% of gene expression were set as the standard for analysis. In the present study, HCC patients were categorized into 2 groups based on the median expression values of hub genes. We calculate the hazards ratio based on Cox PH Model and add the 95% CI as dotted line. Log-rank test results with P<0.05 were regarded as statistically significant.
Quantitative Real-Time PCR (RT-PCR) to Detect mRNA Expression
RT-PCR was used to verify the effect of PADP on the changes of key target genes in human hepatocarcinoma HepG2 cell line and Huh7 cell line, include the down-regulated genes ESR1 and AR, and up-regulated genes CCNB1, CDK1, AKR1C3, and CCNA2. HepG2 and Huh7 cells were cultured in Dulbecco’s Modified Eagle Medium (DMEM, Gibco, USA) mixed with 10% fatal bovine serum (FBS, Gibco, USA). PADP was dissolved in PBS and then filtered with a 0.44um filter. HepG2 and Huh7 were then treated with PADP solution (200mg/L, half Phellodendron and half Anemarrhena) for 24h. The PCR procedure followed the previously published steps (19, 20). Total RNAs from HepG2 cell line were isolated by using RNAiso Plus (TaKaRa, Dalian, China) according to the manufacturer’s protocol. The cDNAs were produced with a Prime-Script RT reagent kit and incubated at 37°C for 15 min and at 85°C for 5 s. Quantitative real-time PCRs were performed using a StepOnePlus device (Applied Biosystems) at 95°C for 10 s, followed by 40 cycles at 95°C for 5 s and at 60°C for 20 s, according to the instructions for the SYBR Premix Ex Taq kit (TaKaRa, Dalian, China). The data were analyzed by the 2−ΔΔCT method. All the primer sequences (Table 1) were designed and synthesized by Tsingke (Wuhan, China). GAPDH was set as the housekeeping gene.
Table 1
| Genes | Forward (5′-3′) | Reverse (5′-3′) |
|---|---|---|
| ESR1 | GGGAAGTATGGCTATGGAATCTG | TGGCTGGACACATATAGTCGTT |
| AR | TACCAGCTCACCAAGCTCCT- | GCTTCACTGGGTGTGGAAAT |
| CCNB1 | GGTTGGGTCGGCCTCTACCT | AGCCAGGTGCTGCATAACTGGAA |
| CDK1 | CGTGGGGGAGCGGATTT | CGGAGGGCGAGTATTGAGGA |
| AKR1C3 | GTTGCCTATAGTGCTCTGGGATCT | GGACTGGGTCCTCCAAGAGG |
| CCNA2 | GTAAACAGCCTGCGTTCACC | ACTTCAACTAACCAGTCCACGAG |
| GAPDH | ACCACAGTCCATGCCATCAC | TCCACCACCCTGTTGCTGTA |
Primers for RT-PCR.
Cell Counting Kit−8 (CCK−8) Assay to Detect Cell Proliferation
CCK−8 assay was performed to detect cell viability and cell proliferation. The HepG2 cells and Huh7 cells were seeded in the 96-well culture plates at a density of 1×10⁵ cells/well and incubated for 24 h at 37°C and 5% CO2 atmosphere, respectively. Cells were exposed to 200 mg/L PADP and further incubated for 24 h. The medium was replaced with 100 µL of fresh medium containing 10% CCK8 (Dojindo Molecular Technologies, Inc), and cells were incubated for 4 h at 37°C and 5% CO2 atmosphere. The OD450 nm absorbance value in each well was determined by the scanning porous spectrophotometer (Thermo Scientific, China). Cell proliferation rate (%) was used to describe the effect of PADP on cellular viability, and calculated as follow equation: Cell proliferation rate (%) = (OD PADP – OD Blank)/(OD Control – OD Blank)× 100%.
Flow Cytometry Detect the Cell Cycle Distribution and Apoptotic Rate
Flow cytometry was conducted to detect the cell cycle distribution and apoptotic rate. The Annexin V−FITC/PI cell apoptosis detection kit and cell cycle assay kits were bought from NanJing KeyGen Biotech Co., Ltd. (cat. no. KGA108). Cells were digested with 0.25% pancreatin (MedChemExpress; cat. no. HY−B2118) without EDTA. Cell apoptosis was assessed using the AnnexinV−FITC/PI cell apoptosis detection kit according to the manufacturer’s protocol. Briefly, cells were re−suspended in 500 µl binding buffer mixed with 5 µl AnnexinV−FITC, then mixed with 5 µl PI and incubated at room temperature in the dark for 15 min. The cell cycle was assessed using the cell cycle detection kit according to the manufacturer’s protocol. Cells were washed with PBS, centri−fuged with 350 x g for 5 min at 4°C, fixed with pre−cooled 70% ethanol at 4°C for 1−2 h, washed for a second time and the cell suspension was stained at 37°C for 15 min with 1 ml PI/Triton X−100 (20 µg PI/0.1% Triton X−100) containing 0.2 mg RNase.
Transwell Invasion Assay to Detect Cell Invasion
Transwell invasion assay was performed to detect cell invasion. After adjusted at the concentration of 1 × 10⁵ cells/mL with the medium, The HepG2 cells and Huh7 cells were seeded 100 µL/well into the upper chamber of the transwell migration chamber. The medium with a concentration of 200mg/L of PADP was added lower chamber. The cells were then incubated for 24 h at 37°C and 5% CO2 atmosphere. The chamber was removed and fixed with methanol for 20 min. After dried at room temperature, the cells were stained with crystal violet for 20 min. Cells that did not pass through the upper part of the chamber were removed with a wet cotton swab, and then the chamber was placed under an inverted microscope to calculate remaining cells.
Statistical Analysis
SPSS 13.0 software was used for statistical analysis of the data. The results were expressed as means ± SDs. One-way analysis of variance (ANOVA) or Student’s t test was performed to examine the differences between groups. A P value less than 0.05 was considered statistically significant.
Results
GEO Gene Chip and Differential Gene Analysis
A total of 21654 genes were obtained by analyzing the GSE62232 gene chip. After screening, a total of 1019 differential genes were obtained, including 614 down-regulated genes and 405 up-regulated genes. The heat map and volcano diagram of the differential genes were shown in Figures 1A, B respectively.
Figure 1
Drug Chemical Components and Targets
After searching the TCMSP database and screening by the ADME standard, a total of 221 compounds and 52 active ingredients were obtained, of which Phellodendron had 140 compounds and 37 active ingredients, while Anemarrhena had 81 compounds and 15 active ingredients. The target genes corresponding to the above active ingredients were combined and deduplicated, and 201 target genes were finally obtained. Compounds-targets network diagram was shown in Figure 1C. The annotations for active ingredients and targets was shown in Table S1 in Supplementary Material. The top 10 core compounds selected according to Figure 1C and Table S1 were shown in Table 2.
Table 2
| No. | Degree layout | Mol ID | Compound | 2D structure | OB | DL | Herb |
|---|---|---|---|---|---|---|---|
| 1 | 141 | MOL000098 | quercetin | 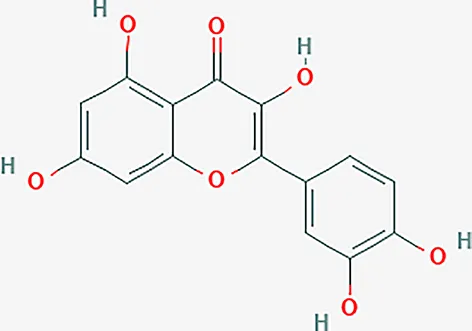 | 46.43 | 0.28 | Phellodendron |
| 2 | 56 | MOL000422 | kaempferol | 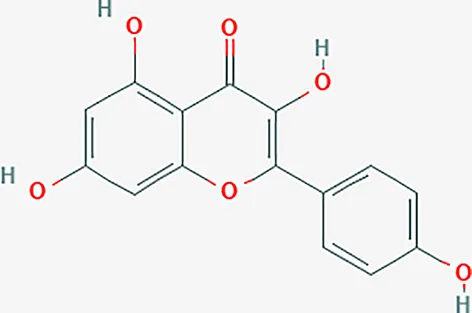 | 41.88 | 0.24 | Anemarrhena |
| 3 | 54 | MOL000449 | stigmasterol | 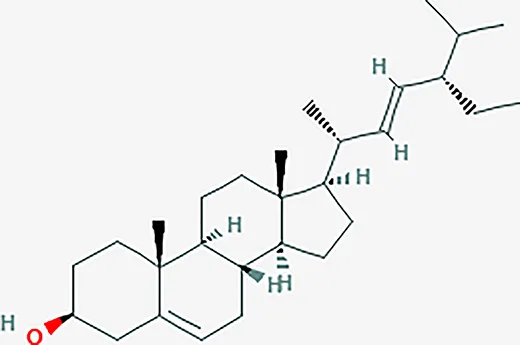 | 43.83 | 0.76 | Phellodendron |
| 4 | 32 | MOL004373 | Anhydroicaritin | 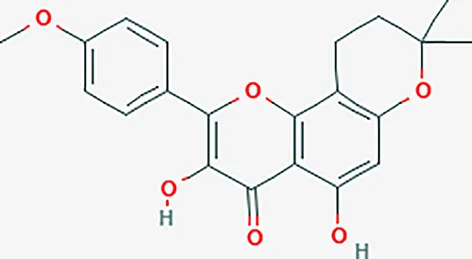 | 45.41 | 0.44 | Phellodendron |
| 5 | 31 | MOL000790 | Isocorypalmine |  | 35.77 | 0.59 | Anemarrhena |
| 6 | 28 | MOL000358 | beta-sitosterol |  | 36.91 | 0.75 | Phellodendron |
| 7 | 28 | MOL001455 | (S)-Canadine |  | 53.83 | 0.77 | Phellodendron |
| 8 | 24 | MOL002670 | Cavidine |  | 35.64 | 0.81 | Phellodendron |
| 9 | 22 | MOL000787 | Fumarine | 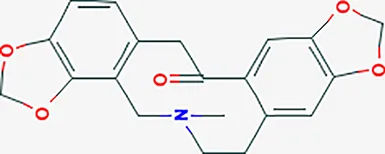 | 59.26 | 0.83 | Phellodendron |
| 10 | 19 | MOL002651 | Dehydrotanshinone II A | 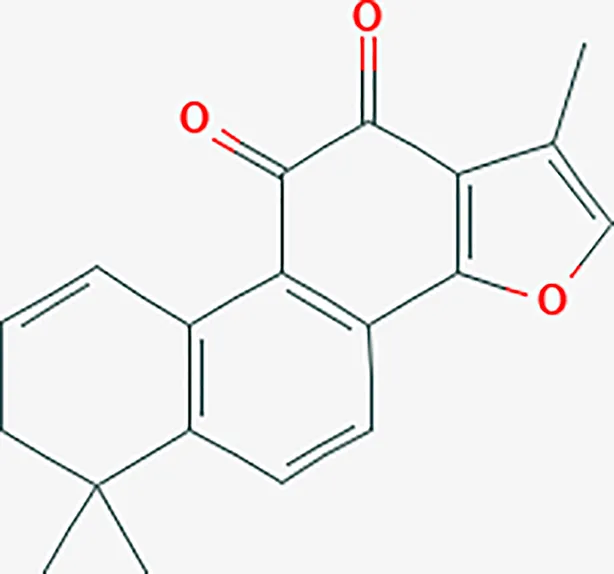 | 43.76 | 0.4 | Phellodendron |
Core compounds.
Intersection of Disease Genes and Drug Genes
The up-regulated genes and down-regulated genes in the liver cancer differential genes were intersected with the genes of PADP to obtain the Venn diagram. As can be seen from Figure 1D, there were 200 target genes for the active ingredient predicted by PADP, and 405 genes were up-regulated, and 614 differential genes were down-regulated in liver cancer. There were 36 genes of PADP for the treatment of liver cancer, of which 13 genes were up-regulated and 23 genes were down-regulated (Figure 1D). The up-regulated genes included BAX, MAP2, CDK1, BIRC5, HSPB1, CCNB1, TOP2A, NQO1, CXCL11, CXCL10, SPP1, AKR1C3 and CCNA2. While the down-regulated genes included ESR1, AR, ADRB2, ADRA1A, CYP3A4, CYP1A2, CYP2B6, NR3C2, ADH1C, ADRB1, PON1, CA2, FOS, HMOX1, CYP1A1, CCL2, SULT1E1, NR1I2, ABCG2, CXCL2, NR1I3, IGFBP3 and PCOLCE.
Construction of Traditional Chinese Medicine Compound Regulation Network
The traditional Chinese medicine compound regulation network diagram consisted of 61 nodes. It can be seen from Figure 2A that there were 17 effective components of Phellodendron and 8 effective components of Anemarrhena for the treatment of liver cancer. And MOL000449 was an effective component for treating liver cancer shared by both. Besides, there were 36 genes of PADP for treating liver cancer.
Figure 2
Screening of Core Genes
The PPI network diagram of PADP for liver cancer was shown in Figure 2B. A bar graph of the first 10 down-regulated genes and the first 5 up-regulated genes was shown in Figure 2C.
Construction of PPI Network and Analysis of Network Topology
The gene of PADP for treating liver cancer was input into Cytoscape software, and the PPI network diagram was obtained using the “Bisogenet” package (Figure 2D). The nodes represent proteins, and the links represent the degree of association between proteins. It can be seen from Figure 2D that the PPI network had a total of 2352 nodes and 57734 connections. The first filter, set degree > 81, and finally got 414 nodes and 16688 connections (Figure 2E). The second filter, set betweeness > 200, and finally got 24 nodes and 140 connections (Figure 2F).
GO Biological Process and KEGG Pathway Enrichment Analysis
The R language was used to perform enrichment analysis of GO biological process and KEGG pathway for treatment of liver cancer with PADP. Finally, the enrichment numbers of BP, CC, and MF were 397, 3, and 44, respectively. A total of 23 pathways were related to the efficacy of PADP for the treatment of liver cancer. The bubble chart of the top 20 entries was shown in Figure 3A.
Figure 3
KEGG Relationship Network Construction
A KEGG relationship network diagram was constructed for the top 20 pathways and genes enriched in pathways for the treatment of liver cancer by PADP (Figure 3B). It can be seen from Figure 3B that genes such as CYP3A4, CYP1A2, FOS, CCL2, CXCL2, CXCL10, CYP1A1, ADH1C, BAX, and CYP2B6 occupied a large rectangular area, indicating that these genes play a key role in the mechanism of PADP on the treatment of liver cancer.
Molecular Docking Verification of Core Compounds and Core Target Genes
The protein crystals corresponding to the core target genes were searched through the PDB database, and the protein crystal names corresponding to the up-regulated genes CCNB1, CDK1, NQO1, AKR1C3, CCNA2 were 6guk, 1x8b, 1h69, 1zq5 and 6gue. While the protein crystal names corresponding to the down-regulated genes ESR1, AR, FOS, CYP1A1, CYP3A4, CYP1A2, CYP2B6, ABCG2, HMOX1 and CCL2 were 5aau, 5obk, 1kms, 6o5y, 4d6z, 2hi4, 5ufg, 5tf7, 6qgv and 5coy, respectively. The docking results were shown in Figure 3C. It can be seen from Figure 3C that except for the corresponding crystal affinity scores of stigmasterol and CCL2 of -4.5 kcal/mol, the scores of the other compounds and protein crystals were all less than -5 kcal/mol, suggesting that the above-mentioned core compounds have good affinity with core gene proteins. Part of the interaction forces between ligands and receptors were shown in Figure 3D.
Survival Analyses for Hub Genes
As shown in Figure 4, GEPIA online analysis tool was used to perform survival analysis of the 5 up-regulated and 10 down-regulated genes. The survival analysis of down-regulated genes ESR1 and AR, up-regulated genes CCNB1, CDK1, AKR1C3 and CCNA2 is statistically significant (P<0.05). Therefore, key targets ESR1, AR, CCNB1, CDK1, AKR1C3 and CCNA2 were identified for experimental verification.
Figure 4
Changes of the mRNA of the Key Target Genes and the Validation of Cell Proliferation, Apoptotic, Cell Cycle and Invasion
RT-PCR was used to verify the effect of PADP on the changes of target genes in human hepatocarcinoma HepG2 cell line. As shown in Figures 5A–F, compared with the control group, the mRNA expression of ESR1 and AR were increased in PADP group (P<0.05), and the mRNA expression of CCNB1, CDK1, AKR1C3 and CCNA2 were decreased in PADP group (P<0.05). The effect of PADP on cell proliferation of HepG2 cells was measured using the CCK-8 assay. As shown in Figure 5G, the cell viability rate of HepG2 cells decreased significantly after administered of PADP (P<0.05). The effect of PADP on cell apoptotic and cell cycle of HepG2 cells were measured using the Flow cytometry. As shown in Figures 5H, I, the apoptotic rate was significantly increased in PADP group (P<0.05), and proportion of S phase cells was significantly decreased in PADP group (P<0.05). Transwell invasion assay was performed to detect cell invasion. As shown in Figure 5J, the invaded cells per field were significantly decreased in PADP group (P<0.05). Likewise, as shown in Figure S1 in the Supplementary Material, we came to similar conclusions in the Huh7 cell line. The above cell-based assays showed that PADP could promote the apoptosis of liver cancer cells, shorten the cell cycle, and inhibit the proliferation and invasion of liver cancer cells.
Figure 5
Discussion
Liver cancer is one of the most widespread types of cancer and is notorious for its high morbidity and mortality (21, 22). In this study, bioinformatics technology was used to obtain differential genes of liver cancer. At the same time, network pharmacology technology was used to obtain the effective components of Phellodendron and Anemarrhena and corresponding target genes, which provided important theoretical basis for the treatment of liver cancer with PADP.
Firstly, in this study, the GSE62232 chip was analyzed by using bioinformatics technology. A total of 1019 differential genes were obtained, including 614 down-regulated genes and 405 up-regulated genes. After searching the TCMSP database and screening by ADME standards through Chinese medicine network pharmacology technology, a total of 52 active ingredients of PADP were obtained, of which 37 active ingredients were Phellodendron and 15 active ingredients were Anemarrhena.
After intersecting the disease differential genes with the drug target genes, there were 36 genes from PADP to treat liver cancer, of which 13 genes were up-regulated and 23 genes were down-regulated. The above-mentioned differential genes and predicted active ingredient targets were used to construct a traditional Chinese medicine active ingredients-targets network diagram of PADP in the treatment of liver cancer. It can be seen from Figure 2A that the number of effective components of Phellodendron and Anemarrhena for treating liver cancer were 17 and 8 respectively, of which MOL000449 (stigmasterol) was shared by both. The main target genes of this effective component included NR3C2, ADH1C, ADRB2, ADRB1, ADRA1A. Studies have shown that plant sterols such as stigmasterol have tumor suppressive effects and can reduce beta amyloid production through different mechanisms (23, 24).
Secondly, this study performed PPI analysis on the above target genes. It is well known that protein-protein interactions are the basis of cellular functions in living organisms and play an important role in regulating physiological and pathological conditions. The core genes of PPI were further studied to obtain the core genes network diagram and bar graph. Simultaneously, the PPI and network topology analysis were performed on the genes of PADP for treating liver cancer. From the topological structure of the PPI network in Figures 2D–F, in addition to the three genes (ESRI, AR, and HSPB1) predicted above, the PADP may be related to many other genes in the treatment of liver cancer. After screening, 21 genes highly related to the treatment of liver cancer by PADP were finally obtained, including TP53, NTRK1, CUL3, CDK2, MCM2, CUL7, and COPS5. Among them, TP53, MCM2, and CDK2 are mainly related to the cell cycle. Studies have shown that TP53 is an important tumor suppressor, and about 30-50% of mutations occur in liver cancer (25). MCM2 is significantly related to the survival and progression of liver cancer, and its potential mechanism in liver cancer prognosis may involve the cell cycle (26). CDK2 is expressed in hepatocellular carcinoma stem cells and can promote the cycle progression of liver cancer cells (27). CUL3 and CUL7 are members of the Cullin ubiquitin ligase family and are involved in the regulation of various cancer-related biological pathways. Liu G (28) showed that CUL7 can promote epithelial-mesenchymal transition in liver cancer, and its high expression in liver tumors is related to poor prognosis. Besides, COPS5 can regulate the deubiquitination of cullin, thereby controlling a variety of biological processes, which has been reported in a variety of cancers (liver, pancreatic, breast, etc) (29).
Meanwhile, this study used R language to perform GO biological process enrichment analysis and KEGG pathway analysis of PADP for treating liver cancer genes. From the analysis of GO biological process enrichment, it can be seen that BP mainly focused on life processes such as metabolism, cellular response, and transcription; CC mainly focused on cell components of protein kinase complexes; MF mainly focused on the aspects of enzyme activity and the binding reaction of various biological processes. It can be seen from Figure 3A that the PADP can play a role in treating liver cancer through multiple pathways, including p53 signaling pathway, IL-17 signaling pathway, TNF signaling pathway, Toll-like receptor signaling pathway and Chemokine signaling pathway. In addition, it can be known from the signaling pathway that the diseases most closely related to liver cancer were hepatitis B colorectal cancer. The macro level of the signaling pathways mainly promotes the occurrence of liver cancer by affecting bile secretion, endocrine resistance, platinum drug resistance, chemical carcinogenesis. And at the micro level, it mainly affects cellular senescence, apoptosis-multiple species, biosynthesis and metabolism of cytochrome P450 and hormone, and then promotes the occurrence and development of liver cancer.
At the same time, a KEGG relationship network was constructed for the KEGG enrichment pathway and core genes in this study. In addition to the above signaling pathways, there were numerous biological processes that affect the occurrence and progression of liver cancer, among which hsa00980 (Metabolism of xenobiotics by cytochrome P450), hsa0083 (Retinol metabolism) and hsa00140 (Steroid hormone biosynthesis) had the most abundant genes. As we all know, the liver is known to be the central organ regulating glucose homeostasis, exogenous metabolism, and steroid biosynthesis and degradation (30). Steroid hormone biosynthesis is mainly achieved by enzymes of the cytochrome P450 family (31). Metabolism of xenobiotics by cytochrome P450 is a group of membrane-bound proteins that are mainly found in the liver and intestine. It can catalyze the metabolism of a variety of endogenous and exogenous substances, and is closely related to the occurrence of liver cancer (32–34). The liver is the most important storage organ, which contains retinol metabolizing enzymes and participates in retinol metabolism (35). Researches have shown that decreased hepatic retinol levels were observed in chemically induced liver injury, suggesting retinol metabolism were increased in liver diseases (36). Studies by Cheng YW et al. showed that retinol metabolism was involved in the process of liver fibrosis and was closely related to malignant tumors (37). In addition, it can be inferred from Figure 3B that genes such as CYP3A4, CYP1A2, FOS, CCL2, CXCL2, CXCL10, CYP1A1, ADH1C, BAX, and CYP2B6 play a key role in the mechanism of PADP on the treatment of liver cancer. Among them, CYP3A4 (38), CYP1A2 (39), CYP1A1 (40) and CYP2B6 (41) are members of the cytochrome P450 family and they are involved in the pathogenesis of liver cancer in certain ways. Increasing evidence indicate that chemokines and their receptors play a role in tumorigenesis, development and metastasis. CXCL2 and CXCL10 are genes enriched by Chemokine signaling pathway; CXCL2 promotes the proliferation and metastasis of liver cancer cells (42); and CXCL10 is associated with enhanced T cell infiltration in tumors (43). In addition, genes such as FOS (44), CCL2 (45), ADH1C (46) and BAX (47) are also associated with the occurrence of liver cancer.
Finally, according to the molecular docking results in Figure 3C, it can be seen that the small molecule compound was tightly bound to the protein residue through various interaction forces such as van der waals, convational hydrogen bond, pi-sigma, pi-pi T-shaped, pi-cation, pi-donor hydrogen bond and so on. It can be seen from Figure 4 that the survival analysis of down-regulated genes such as ESR1 and AR, up-regulated genes such as CCNB1, CDK1, AKR1C3 and CCNA2 is statistically significant, suggesting that the above genes may become potential target genes for the survival and prognosis of PADP for the treatment of liver cancer. RT-PCR indicated that PADP can increase the mRNA expression of ESR1 and AR and decrease the mRNA expression of CCNB1, CDK1, AKR1C3 and CCNA2. Meanwhile, cell assays showed that PADP could promote the apoptosis of liver cancer cells, shorten the cell cycle, and inhibit the proliferation and invasion of liver cancer cells. ERS1 and AR were identified as relatively high-involved molecules, which suggested that these proteins may play essential roles in HCC progression (48). The polymorphisms of ESR1 were related to HCC risk among chronic HBV carriers (49). AR plays critical roles in HCC, it is one of the important target molecules for the treatment of HCC (50). AR might enhance HCC initiation and eary development, but suppress HCC metastasis at the later stages of the disease (51). Studies have shown that high expression of CDK1, CCNB1, and CCNA2 is associated with reduced overall survival in patients with liver cancer (52). CCNB1 was related with cell proliferation in HCC patients. In addition, CCNB1 is also closely related to the proliferation, migration and invasion of hepatoma cells (53). CDK1 plays an important regulatory role in cell cycle regulation, and CDK1 can increase cellular viability and promote proliferation in HCC cell lines (54). AKR1C3 is known to be involved in the metabolism and biosynthesis of estrogens, androgens, progesterone, and prostaglandins. AKR1C3 can promote tumor cell proliferation, metastasis, invasion, and angiogenesis, and inhibit tumor cell apoptosis and differentiation (55). The upregulation of CCNA2 might thus play a key role in the dysregulation of normal growth in HCC carcinogenesis (56).
In summary, PADP may up regulate genes ESR1, AR, and down regulate genes CCNB1, CDK1, AKR1C3, and CCNA2, through p53 signaling pathway, IL-17 signaling pathway, TNF signaling pathway and Toll-like receptor signaling pathway, thereby promoting the apoptosis of liver cancer cells, shortening the cell cycle, and inhibiting the proliferation and invasion of liver cancer cells. And the mechanism of action is shown in Figure 6.
Figure 6
Funding
This work was supported by the National Science Foundation of China (82100630 and 82100894) and by the Fundamental Research Funds for the Central Universities (2042021kf0080).
Publisher’s Note
All claims expressed in this article are solely those of the authors and do not necessarily represent those of their affiliated organizations, or those of the publisher, the editors and the reviewers. Any product that may be evaluated in this article, or claim that may be made by its manufacturer, is not guaranteed or endorsed by the publisher.
Statements
Data availability statement
The datasets presented in this study can be found in online repositories. The names of the repository/repositories and accession number(s) can be found in the article/Supplementary Material.
Author contributions
XR and YW conceived and designed the study. XR and YW wrote the paper. XR, WL, and PD performed the study and analyzed the data. YW and PD supervised the study and revised the manuscript. All authors read and approved the final manuscript.
Acknowledgments
We thank the central laboratory at Renmin Hospital of Wuhan University (Wuhan, Hubei, China) for their support of our study.
Conflict of interest
The authors declare that the research was conducted in the absence of any commercial or financial relationships that could be construed as a potential conflict of interest.
Supplementary material
The Supplementary Material for this article can be found online at: https://www.frontiersin.org/articles/10.3389/fonc.2022.838152/full#supplementary-material
Abbreviations
BP, Biological process; CC, Cellular component; DAVID, Database for Annotation, Visualization and Integrated Discovery; DL, Drug-like; GEO, Gene Expression Omnibus; GO, Gene Ontology; KEGG, Kyoto Encyclopedia of Genes and Genomes; MF, Molecular function; OB, Oral bioavailability; OS, Overall Survival; PADP, Phellodendron and Anemarrhena drug pair; PDB, Protein Data Bank; PPI, Protein-protein interaction; STRING, Search Tool for the Retrieval of Interacting Genes; TCMSP, Traditional Chinese Medicine Systems Pharmacology Database and Analysis Platform; UniProt, Unified Protein; CCK−8, Cell Counting Kit−8.
References
1
KennedyKGrahamSMAroraNShuhartMCKimHN. Hepatocellular Carcinoma Among US and Non-US-Born Patients With Chronic Hepatitis B: Risk Factors and Age at Diagnosis. PloS One (2018) 13(9):e0204031. doi: 10.1371/journal.pone.0204031
2
GongXZhengYHeGChenKZengXChenZ. Multifunctional Nanoplatform Based on Star-Shaped Copolymer for Liver Cancer Targeting Therapy. Drug Deliv (2019) 26(1):595–603. doi: 10.1080/10717544.2019.1625467
3
ChaiZYinXChenJShiJSunJLiuCet al. MicroRNA-101 Modulates Cisplatin Chemoresistance in Liver Cancer Cells via the DNA-PKcs Signaling Pathway. Oncol Lett (2019) 18(4):3655–63. doi: 10.3892/ol.2019.10674
4
ZhangHJiangHZhangHLiuJHuXChenL. Anti-Tumor Efficacy of Phellamurin in Osteosarcoma Cells: Involvement of the PI3K/AKT/mTOR Pathway. Eur J Pharmacol (2019) 858:172477. doi: 10.1016/j.ejphar.2019.172477
5
LiXLiuYGuanWXiaYZhouYYangBet al. Physicochemical Properties and Laxative Effects of Polysaccharides From Anemarrhena Asphodeloides Bge. In Loperamide-Induced Rats. J Ethnopharmacol (2019) 240:111961. doi: 10.1016/j.jep.2019.111961
6
WuZTQiXMShengJJMaLLNiXRenJet al. Timosaponin A3 Induces Hepatotoxicity in Rats Through Inducing Oxidative Stress and Down-Regulating Bile Acid Transporters. Acta Pharmacol Sin (2014) 35(9):1188–98. doi: 10.1038/aps.2014.65
7
WuDLLiaoZDChenFFZhangWRenYSWangCCet al. Benzophenones From Anemarrhena Asphodeloides Bge. Exhibit Anticancer Activity in HepG2 Cells via the NF-kappaB Signaling Pathway. Molecules (2019) 24(12):2246. doi: 10.3390/molecules24122246
8
ZhouWCaiBShanJWangSDiL. Discovery and Current Status of Evaluation System of Bioavailability and Related Pharmaceutical Technologies for Traditional Chinese Medicines–Flos Lonicerae Japonicae–Fructus Forsythiae Herb Couples as an Example. Int J Mol Sci (2015) 16(12):28812–40. doi: 10.3390/ijms161226132
9
QiQLiRLiHYCaoYBBaiMFanXJet al. Identification of the Anti-Tumor Activity and Mechanisms of Nuciferine Through a Network Pharmacology Approach. Acta Pharmacol Sin (2016) 37(7):963–72. doi: 10.1038/aps.2016.53
10
CasasAIHassanAALarsenSJGomez-RangelVElbatreekMKleikersPet al. From Single Drug Targets to Synergistic Network Pharmacology in Ischemic Stroke. Proc Natl Acad Sci USA (2019) 116(14):7129–36. doi: 10.1073/pnas
11
PanBShiXDingTLiuL. Unraveling the Action Mechanism of Polygonum Cuspidatum by a Network Pharmacology Approach. Am J Transl Res (2019) 11(11):6790–811.
12
GuanNNWangCCZhangLHuangLLiJQPiaoX. In Silico Prediction of Potential miRNA-Disease Association Using an Integrative Bioinformatics Approach Based on Kernel Fusion. J Cell Mol Med (2020) 24(1):573–87. doi: 10.1111/jcmm.14765
13
YaoJZhangZLiSLiBWangXH. Melittin Inhibits Proliferation, Migration and Invasion of Bladder Cancer Cells by Regulating Key Genes Based on Bioinformatics and Experimental Assays. J Cell Mol Med (2020) 24(1):655–70. doi: 10.1111/jcmm.14775
14
RuJLiPWangJZhouWLiBHuangCet al. TCMSP: A Database of Systems Pharmacology for Drug Discovery From Herbal Medicines. J Cheminform (2014) 6:13. doi: 10.1186/1758-2946-6-13
15
LovingKALinAChengAC. Structure-Based Druggability Assessment of the Mammalian Structural Proteome With Inclusion of Light Protein Flexibility. PloS Comput Biol (2019) 10(7):e1003741. doi: 10.1371/journal.pcbi.1003741
16
UniProt Consortium. UniProt: a Worldwide Hub of Protein Knowledge. Nucleic Acids Res (2019) 47:D506–15. doi: 10.1093/nar/gky1049
17
ZhangYFHuangYNiYHXuZM. Systematic Elucidation of the Mechanism of Geraniol via Network Pharmacology. Drug Des Devel Ther (2019) 13:1069–75. doi: 10.2147/DDDT.S189088
18
LiaoYSmythGKShiW. The R Package Rsubread Is Easier, Faster, Cheaper and Better for Alignment and Quantification of RNA Sequencing Reads. Nucleic Acids Res (2019) 47(8):e47. doi: 10.1093/nar/gkz114
19
WangYYangFJiaoFZChenQZhangWBWangLWet al. Modulations of Histone Deacetylase 2 Offer a Protective Effect Through the Mitochondrial Apoptosis Pathway in Acute Liver Failure. Oxid Med Cell Longev (2019) 2019:8173016. doi: 10.1155/2019/8173016
20
WangYChenHChenQJiaoFZZhangWBGongZJ. The Protective Mechanism of CAY10683 on Intestinal Mucosal Barrier in Acute Liver Failure Through LPS/TLR4/MyD88 Pathway. Mediators Inflamm (2018) 2018:7859601. doi: 10.1155/2018/7859601
21
CassanoMOffnerSPlanetEPiersigilliAJangSMHenryHet al. Polyphenic Trait Promotes Liver Cancer in a Model of Epigenetic Instability in Mice. Hepatology (2017) 66(1):235–51. doi: 10.1002/hep.29182
22
FuYLiuSZengSShenH. From Bench to Bed: The Tumor Immune Microenvironment and Current Immunotherapeutic Strategies for Hepatocellular Carcinoma. J Exp Clin Cancer Res (2019) 38(1):396. doi: 10.1186/s13046-019-1396-4
23
GuesmiFTyagiAKPrasadSLandoulsiA. Terpenes From Essential Oils and Hydrolate of Teucrium Alopecurus Triggered Apoptotic Events Dependent on Caspases Activation and PARP Cleavage in Human Colon Cancer Cells Through Decreased Protein Expressions. Oncotarget (2018) 9(64):32305–20. doi: 10.18632/oncotarget.25955
24
AhmadiMTaherianfardMShomaliT. Zataria Multiflora Could Improve Hippocampal Tau Protein and TNFalpha Levels and Cognitive Behavior Defects in a Rat Model of Alzheimer’s Disease. Avicenna J Phytomed (2019) 9(5):465–73.
25
WangRYinCLiXXYangXZYangYZhangMYet al. Reduced SOD2 Expression Is Associated With Mortality of Hepatocellular Carcinoma Patients in a Mutant P53-Dependent Manner. Aging (Albany NY) (2016) 8(6):1184–200. doi: 10.18632/aging.100967
26
LiaoXLiuXYangCWangXYuTHanCet al. Distinct Diagnostic and Prognostic Values of Minichromosome Maintenance Gene Expression in Patients With Hepatocellular Carcinoma. J Cancer (2018) 9(13):2357–73. doi: 10.7150/jca.25221
27
AnJXuJLiJJiaSLiXLuYet al. HistoneH3 Demethylase JMJD2A Promotes Growth of Liver Cancer Cells Through Up-Regulating miR372. Oncotarget (2017) 8(30):49093–109. doi: 10.18632/oncotarget.17095
28
LiuGClaretFXZhouFPanY. Jab1/COPS5 as a Novel Biomarker for Diagnosis, Prognosis, Therapy Prediction and Therapeutic Tools for Human Cancer. Front Pharmacol (2018) 9:135. doi: 10.3389/fphar.2018.00135
29
JangSMRedonCEAladjemMI. Chromatin-Bound Cullin-Ring Ligases: Regulatory Roles in DNA Replication and Potential Targeting for Cancer Therapy. Front Mol Biosci (2018) 5:19. doi: 10.3389/fmolb.2018.00019
30
DragMSkinkyte-JuskieneRDoDNKogelmanLJAKadarmideenHN. Differential Expression and Co-Expression Gene Networks Reveal Candidate Biomarkers of Boar Taint in Non-Castrated Pigs. Sci Rep (2017) 7(1):12205. doi: 10.1038/s41598-017-11928-0
31
StrehlCEhlersLGaberTButtgereitF. Glucocorticoids-All-Rounders Tackling the Versatile Players of the Immune System. Front Immunol (2019) 10:1744. doi: 10.3389/fimmu.2019.01744
32
MakPJDenisovIGGrinkovaYVSligarSGKincaidJR. Defining CYP3A4 Structural Responses to Substrate Binding. 2011. Raman Spectroscopic Studies of a Nanodisc-Incorporated Mammalian Cytochrome P450. J Am Chem Soc (2011) 133(5):1357–66. doi: 10.1021/ja105869p
33
YuTWangXZhuGHanCSuHLiaoXet al. The Prognostic Value of Differentially Expressed CYP3A Subfamily Members for Hepatocellular Carcinoma. Cancer Manag Res (2018) 10:1713–26. doi: 10.2147/CMAR.S159425
34
ChenJJiangSWangJRenukuntlaJSirimullaSChenJ. A Comprehensive Review of Cytochrome P450 2E1 for Xenobiotic Metabolism. Drug Metab Rev (2019) 51(2):178–95. doi: 10.1371/journal.pone.0205747
35
PettinelliPArendtBMTeterinaAMcGilvrayIComelliEMFungSKet al. Altered Hepatic Genes Related to Retinol Metabolism and Plasma Retinol in Patients With Non-Alcoholic Fatty Liver Disease. PloS One (2018) 13(10):e0205747. doi: 10.1371/journal.pone.0205747
36
LeeYSYiHSSuhYGByunJSEunHSKimSYet al. Blockade of Retinol Metabolism Protects T Cell-Induced Hepatitis by Increasing Migration of Regulatory T Cells. Mol Cells (2015) 38:998–1006. doi: 10.14348/molcells.2015.0218
37
ChengYWPincasHHuangJZachariahEZengZNottermanDAet al. High Incidence of LRAT Promoter Hypermethylation in Colorectal Cancer Correlates With Tumor Stage. Med Oncol (2014) 31(11):254. doi: 10.1007/s12032-014-0254-7
38
OwenARannardS. Strengths, Weaknesses, Opportunities and Challenges for Long Acting Injectable Therapies: Insights for Applications in HIV Therapy. Adv Drug Deliv Rev (2016) 103:144–56. doi: 10.1016/j.tibtech.2009.02.009
39
FernandesTGDiogoMMClarkDSDordickJSCabralJM. High-Throughput Cellular Microarray Platforms: Applications in Drug Discovery, Toxicology and Stem Cell Research. Trends Biotechnol (2009) 27(6):342–9. doi: 10.1016/j.tibtech.2009.02.009
40
BrittainELThennapanTMaronBAChanSYAustinEDSpiekerkoetterEet al. Update in Pulmonary Vascular Disease 2016 and 2017. Am J Respir Crit Care Med (2018) 198(1):13–23. doi: 10.1164/rccm.201801-0062UP
41
SzigethyEKniselyMDrossmanD. Opioid Misuse in Gastroenterology and Non-Opioid Management of Abdominal Pain. Nat Rev Gastroenterol Hepatol (2018) 15(3):168–80. doi: 10.1038/nrgastro.2017.141
42
SongXWangZJinYWangYDuanW. Loss of miR-532-5p In Vitro Promotes Cell Proliferation and Metastasis by Influencing CXCL2 Expression in HCC. Am J Transl Res (2015) 7(11):2254–61.
43
Jiménez-SánchezAMemonDPourpeSVeeraraghavanHLiYVargasHAet al. Heterogeneous Tumor-Immune Microenvironments Among Differentially Growing Metastases in an Ovarian Cancer Patient. Cell (2017) 170(5):927–938 e20. doi: 10.1016/j.cell.2017.07.025
44
TasselliLZhengWChuaKF. SIRT6: Novel Mechanisms and Links to Aging and Disease. Trends Endocrinol Metab (2017) 28(3):168–85. doi: 10.1016/j.tcb.2018.04.006
45
SiebenCJSturmlechnerIvan de SluisBvan DeursenJM. Two-Step Senescence-Focused Cancer Therapies. Trends Cell Biol (2018) 28(9):723–37. doi: 10.1016/j.tcb.2018.04.006
46
RatnaAMandrekarP. Alcohol and Cancer: Mechanisms and Therapies. Biomolecules (2017) 7(3):61. doi: 10.3390/biom7030061
47
LiuLMLinPYangHDangYWChenG. Gene Profiling of HepG2 Cells Following Nitidine Chloride Treatment: An Investigation With Microarray and Connectivity Mapping. Oncol Rep (2019) 41(6):3244–56. doi: 10.3892/or.2019.7091
48
HuangJChenFZhongZTanHYWangNLiuYet al. Interpreting the Pharmacological Mechanisms of Huachansu Capsules on Hepatocellular Carcinoma Through Combining Network Pharmacology and Experimental Evaluation. Front Pharmacol (2020) 11:414. doi: 10.3389/fphar.2020.00414
49
ZhouXZhuHQLuJ. Regulation of Gene Expression in HBV- and HCV-Related Hepatocellular Carcinoma: Integrated GWRS and GWGS Analyses. Int J Clin Exp Med (2014) 7:4038–50.
50
KandaTYokosukaO. The Androgen Receptor as an Emerging Target in Hepatocellular Carcinoma. J Hepatocell Carcinoma (2015) 2:91–9. doi: 10.2147/JHC.S48956
51
ShiLLinHLiGJinRAXuJSunYet al. Targeting Androgen Receptor (AR)→IL12A Signal Enhances Efficacy of Sorafenib Plus NK Cells Immunotherapy to Better Suppress HCC Progression. Mol Cancer Ther (2016) 15:731–42. doi: 10.1158/1535-7163.MCT-15-0706
52
ChenQFXiaJGLiWShenLJHuangTWuP. Examining the Key Genes and Pathways in Hepatocellular Carcinoma Development From Hepatitis B Virus-Positive Cirrhosis. Mol Med Rep (2018) 18:4940–50. doi: 10.3892/mmr.2018.9494
53
GuJLiuXLiJHeY. MicroRNA-144 Inhibits Cell Proliferation, Migration and Invasion in Human Hepatocellular Carcinoma by Targeting CCNB1. Cancer Cell Int (2019) 19:15. doi: 10.1186/s12935-019-0729-x
54
HuaSJiZQuanYZhanMWangHLiWet al. Identification of Hub Genes in Hepatocellular Carcinoma Using Integrated Bioinformatic Analysis. Aging (Albany NY) (2020) 12:5439–68. doi: 10.18632/aging.102969
55
XiaoXZLinLYZhuangMKZhongCMChenFL. Roles of AKR1C3 in Malignancy. Chin Med J (2021) 134:1052–4. doi: 10.1097/CM9.0000000000001379
56
ShiraishiTMatsuyamaSKitanoH. Large-Scale Analysis of Network Bistability for Human Cancers. PloS Comput Biol (2010) 6:e1000851. doi: 10.1371/journal.pcbi.1000851
Summary
Keywords
Phellodendron and Anemarrhena drug pair, liver cancer, network pharmacology, bioinformatics, molecular docking
Citation
Ruan X, Li W, Du P and Wang Y (2022) Mechanism of Phellodendron and Anemarrhena Drug Pair on the Treatment of Liver Cancer Based on Network Pharmacology and Bioinformatics. Front. Oncol. 12:838152. doi: 10.3389/fonc.2022.838152
Received
17 December 2021
Accepted
09 March 2022
Published
07 April 2022
Volume
12 - 2022
Edited by
Jiang-Jiang Qin, Institute of Cancer and Basic Medicine, (CAS), China
Reviewed by
Zhuo-Xun Wu, St. John’s University, United States; Han Wu, Eastern Hepatobiliary Surgery Hospital
Updates
Copyright
© 2022 Ruan, Li, Du and Wang.
This is an open-access article distributed under the terms of the Creative Commons Attribution License (CC BY). The use, distribution or reproduction in other forums is permitted, provided the original author(s) and the copyright owner(s) are credited and that the original publication in this journal is cited, in accordance with accepted academic practice. No use, distribution or reproduction is permitted which does not comply with these terms.
*Correspondence: Peng Du, 931926500@qq.com; Yao Wang, rm003743@whu.edu.cn
†These authors have contributed equally to this work
This article was submitted to Pharmacology of Anti-Cancer Drugs, a section of the journal Frontiers in Oncology
Disclaimer
All claims expressed in this article are solely those of the authors and do not necessarily represent those of their affiliated organizations, or those of the publisher, the editors and the reviewers. Any product that may be evaluated in this article or claim that may be made by its manufacturer is not guaranteed or endorsed by the publisher.