
94% of researchers rate our articles as excellent or good
Learn more about the work of our research integrity team to safeguard the quality of each article we publish.
Find out more
ORIGINAL RESEARCH article
Front. Oncol., 08 June 2022
Sec. Hematologic Malignancies
Volume 12 - 2022 | https://doi.org/10.3389/fonc.2022.820136
This article is part of the Research TopicMachine Learning in Hematologic MalignanciesView all 6 articles
 Zsombor Ritter1*
 László Papp2
 Katalin Zámbó1
 Zoltán Tóth3Dániel Dezső1Dániel Sándor Veres4Domokos Máthé4,5
 Ferenc Budán6,7Éva Karádi8Anett Balikó9László Pajor10Árpád Szomor11Erzsébet Schmidt1
 Hussain Alizadeh11
Purpose: For the identification of high-risk patients in diffuse large B-cell lymphoma (DLBCL), we investigated the prognostic significance of in vivo radiomics derived from baseline [18F]FDG PET/CT and clinical parameters.
Methods: Pre-treatment [18F]FDG PET/CT scans of 85 patients diagnosed with DLBCL were assessed. The scans were carried out in two clinical centers. Two-year event-free survival (EFS) was defined. After delineation of lymphoma lesions, conventional PET parameters and in vivo radiomics were extracted. For 2-year EFS prognosis assessment, the Center 1 dataset was utilized as the training set and underwent automated machine learning analysis. The dataset of Center 2 was utilized as an independent test set to validate the established predictive model built by the dataset of Center 1.
Results: The automated machine learning analysis of the Center 1 dataset revealed that the most important features for building 2-year EFS are as follows: max diameter, neighbor gray tone difference matrix (NGTDM) busyness, total lesion glycolysis, total metabolic tumor volume, and NGTDM coarseness. The predictive model built on the Center 1 dataset yielded 79% sensitivity, 83% specificity, 69% positive predictive value, 89% negative predictive value, and 0.85 AUC by evaluating the Center 2 dataset.
Conclusion: Based on our dual-center retrospective analysis, predicting 2-year EFS built on imaging features is feasible by utilizing high-performance automated machine learning.
Non-Hodgkin lymphoma (NHL) is globally the most common hematological malignancy, accounting for nearly 3% of cancer diagnoses and deaths (1). The NHLs are a diverse group of malignancies, about 80% of which are of B-cell origin (B-NHL) in the Western hemisphere. The most common histologic subtype in adults worldwide is diffuse large B-cell lymphoma (DLBCL), comprising about 30%–40% of NHLs diagnosed each year (2, 3). DLBCL comprises a heterogeneous group of diseases with different biology, clinical presentations, and response to treatment (4, 5). DLBCL is potentially curable with standard treatment in 50%–60% of cases. About 25%–30% of patients are resistant to standard chemo-immunotherapy; therefore, other therapeutic approaches are utilized, namely, 20% of patients are treated with salvage therapy including high-dose therapy and autologous hematopoietic stem cell transplantation (4, 6, 7).
Advances on the understanding of the genetic landscape and molecular features of DLBCL have identified high-risk groups with poor response to chemo-immunotherapy. There is an unmet clinical need to identify these high-risk patients as early as possible in order to apply targeted and more intensive therapy on individualized basis, as the majority of refractory or relapsed patients will eventually die from their disease. The initial evaluation of DLBCL patients is aimed at determining the stage of the disease and assessing for end-organ damage either by the disease and/or preexisting comorbid conditions. The workup in a patient with suspected lymphoma usually starts with comprehensive chemistry panel including complete blood counts with differentials, hemostasis parameters, renal function, hepatic function, lactate dehydrogenase enzyme (LDH), beta-2-microglobulin (B2M), hepatitis B and C, Epstein–Barr Virus (EBV), and human immunodeficiency viral serology. Lymph node biopsy is required to establish a definitive diagnosis of lymphoma; this should be an excisional biopsy rather than a needle biopsy, because nodal architecture is often difficult to assess when small amounts of tissue are used (8–10).
After the histologic confirmation of DLBCL, imaging study is requested to assess the extent and stage of disease. The preferred imaging modality is functional imaging with 2-deoxy-2-[18F]fluoro-D-glucose [(18F)(FDG)] positron emission tomography/x-ray computed tomography (PET/CT) (hereinafter referred to as [18F]FDG PET/CT). This modality is the mostly used at baseline, prior to the start of treatment and for monitoring the efficacy of therapy (11–13).
Taking into consideration that about 20%–25% of patients are primarily resistant to the current 1st-line treatment with rituximab-based chemo-immunotherapy (14), identifying the high-risk group that does not respond has very high priority. One of these modalities could be the use of conventional and textural parameters derived from the baseline [18F]FDG PET/CT. Methods to individualize treatment choices are being increasingly employed in different clinical trials, yielding favorable correlations with improved response rates (5, 15). Studies in the field of cancer imaging research have been actively engaged with radiomics in combination with machine learning (16). However, radiomics has been reported to be sensitive to various factors such as individual biology, acquisition protocols, choice of delineation, binning and resolution, as well as calculation methods, which challenge prior studies to repeat (17). Nevertheless, standardization proposals such as the Imaging Biomarker Standardization Initiative (IBSI) (18) support the endeavor to report findings in a repeatable way.
In DLBCL patients, disease characteristics and outcomes vary widely, pointing to the importance of patient’s classification through identification of sensitive prognostic features especially prior to the start of therapy. For this purpose, we have tried to elucidate the prognostic significance of metabolic heterogeneity (19). We have highlighted metabolically active tumor volume and standardized uptake value (SUV)-based parameters such as SUV-max, SUV-min, total metabolic tumor volume (TMTV), and total lesion glycolysis (TLG) and compared their applicability with other radiomic parameters as well as clinical and pathological data.
We hypothesize that 2-year event-free survival (EFS) prediction models built on these features are feasible by utilizing automated machine learning in a multi-center environment. Hence, the objectives of this study were (a) to collect a dual-center dataset including conventional PET, radiomics, and clinical parameters of DLBCL patients; (b) to build a 2-year EFS prediction model by using one center data; and (c) to validate the established model by an independent dataset coming from another center.
The baseline pretreatment [18F]FDG PET/CT scans of 85 patients diagnosed with DLBCL performed in the period between January 2014 and December 2019 were assessed. The [18F]FDG PET/CT scans were carried out in two centers: at University of Pécs, Department of Medical Imaging—Center 1 including 41 patients, and at University of Kaposvár, Hungary—Center 2 including 44 patients. The median age of patients in this study population was 59 years (range: 23–81 years) with 48.20% (n = 41) of patients older than 60. In this cohort, 40 (47%) patients were male, and 45 (53%) were female. The patients with incomplete medical records and those who received non-standard treatments were excluded from the final analysis. The Eastern Cooperative Oncology Group (ECOG) performance status >2 was reported in 27 (31.80%) cases (in 2 cases, the ECOG status was unknown) with ECOG status unknown in 2 patients. All patients were treated with standard R-CHOP-21 treatment regimen for at least 4 full cycles. The patients were classified to germinal center B-cell-like (GCB) or activated B-cell (non-GCB) type using the Hans algorithm (20). The data regarding the cell of origin (COO) (based on the Hans algorithm) were available in 82 patients; 29 (37.60%) were GCB and 53 (62.40%) were non-GCB. The clinical stage was evaluated by the modified Ann Arbor and Lugano classification.
The pathological and clinical data and the Revised International Prognostic Index (R-IPI) were also determined before the initiation of the therapy (R-IPI: 0: 8, 1: 15, 2: 23, 3: 27, 4: 12 patients).
EFS was defined as the time from registration date to disease relapse, progression, or death related to the lymphoma. Complete response (CR), partial response (PR), progression (PD), refractory disease, and relapse were defined according to the International Working Group response criteria for lymphoma (11, 21).
Pretreatment whole-body [18F]FDG PET/CT scans were performed using a Mediso AnyScan 16 PET/CT scanner in 41 patients (Center 1) and a Siemens Biograph Truepoint 64 PET/CT scanner in 44 patients (Center 2). All patients in the study were subjected to full history and complete clinical examination including the clinical stage of the disease. The patients were instructed to fast for 6 h before the scan. Blood glucose level was ensured to be below <8 mmol/L in all patients before the injection of radiotracer. Intravenous (i.v.) injection of [18F]FDG through an i.v. line with a dose of 3–4 MBq/kg was administered. After tracer injection, the patient was asked to stay for at least 60 min in a dark room covered by warm blankets. No speaking, chewing, or reading was allowed.
During a PET-CT examination in Center 1, we execute a low-dose CT scan first with the following parameters: x-ray tube voltage: 120 kVp (depending on the patient’s size, 140 kVp is used in bariatric patients), x-ray tube current: 24–26 mAs (also depending on the patient’s size, a higher tube current can be applied in bariatric patients), pitch: 1.5, and slice thickness: 2.5 mm. In order to achieve attenuation correction and accurate body mapping, the CT series has to cover the whole PET range of patients from skull to mid-thighs. After this step, the PET acquisition follows the CT series without delay. We have applied the 3D acquisition method for PET data collection with a 3 min frame time. Usually, between 7 and 10 bed positions can cover a general scan range, by axial FOV: 15.12 cm (longitudinal FOV in the patient’s z-axis). According to the manufacturer’s recommendations, the PET images were iteratively reconstructed using the Tera-Tomo™ 3D image reconstruction algorithm in a 167 × 167 × 234 matrix, which resulted in an isotropic voxel size of 4 mm.
In the Center 2 PET-CT examination, we execute a low-dose CT scan first with the following parameters: x-ray tube voltage: 120 kVp (depending on the patient’s size, 140 kVp is used in bariatric patients), x-ray tube current: reference effective mAs: 60 using CareDose, pitch: 1.5, and slice thickness: 5 mm. In order to achieve attenuation correction and accurate body mapping, the CT series shall cover the whole PET range of patients from skull to mid-thigs. After this step, the PET acquisition follows the CT series without delay. We apply 3D mode acquisition for PET data collection with 3 min frame time. Usually, between 7 and 9 bed positions can cover a general scan range, by axial FOV: 16.2 cm (longitudinal FOV in the patient’s z-axis). PET images were iteratively reconstructed using the 2D OSEM (3i8s, 5 mm Gaussian filtering) image reconstruction algorithm in a 168 × 168 matrix.
Lymphoma lesions were detected by InterView FUSION ver. 3.10 (Mediso Medical Imaging Systems Ltd., Budapest, Hungary) clinical evaluation software. The average SUV-max value of the liver (3.5–5.5) served as a reference threshold for the semi-automated algorithm (22). This approach was selected to minimize the effects of patient-specific radiotracer distributions (23). The average of three randomly placed volumes of interest (VOIs) from the unaffected liver regions was used. After the execution of the algorithm with the selected parameters from the automatically segmented regions, the non-affected regions, such as regions with physiological activity (urine in kidneys or in the bladder, or brain activity) or radiotracer accumulations, which are not related to the lymphoma (such as bowel uptake caused by metformin intake), were manually excluded. TLG, TMTV, and SUV-max were automatically calculated across all delineated lesions. Furthermore, SUV-peak values were segmented from the VOI with the highest activity. For further radiomic feature extraction, the largest VOI was selected in each patient. From each of these VOIs, IBSI radiomic features including intensity, histogram, morphological, neighborhood gray-tone difference matrix (NGTDM), gray-level co-occurrence matrix (GLCM), gray-level run length matrix, (GLRLM), and gray-level size zone matrix (GLSZM) features were extracted. For the IBSI-conform reporting details of the radiomic analysis, see Supplementary Table 1.
During the follow up, 2-year EFS was chosen as a clinically relevant cutoff point (24). Based on this criterion, patients were selected into two groups. In Group 0, the patients had no events during the 2-year follow up, and in group 1, the patients had primary refractory disease or relapsed during the 2-year period.
A chi-square test was used for the assessment of binary variables via SPSS (SPSS statistical software 27). First, data from both centers were evaluated together based on 2-year EFS. A significant association was sought between the two groups, defined above and the following clinical data: sex, stage, R-IPI, and COO. Data were also separated by the two centers, where the [18F]FDG PET/CT scans were performed. A significant relationship was sought between the two centers and the two clinical outcomes, stages, R-IPI values, and COO. The test results were considered statistically significant if the p-value was under 0.05.
The Center 1 dataset was utilized as a training set, given that it had more balanced remission–progression subgroups compared to Center 2 (Table 2). The dataset underwent automated machine learning analysis from the Dedicaid AutoML Research package (Dedicaid GmbH, Vienna, Austria). This step included automated data preprocessing for redundancy reduction, class imbalance reduction, as well as feature engineering, ranking, and selection (25). The data were split into 100-fold via random subsampling (26), and mixed ensemble learning was applied in each fold to generate a model predicting the final 2-year EFS. For quality control, the AutoML approach also performed a single-center cross-validation across the 100-fold of Center 1. Lastly, the final feature ranking was generated by averaging the 100-fold feature importance and normalizing them to the sum of 1.0. Features higher than half of the highest feature rank were considered high-ranking and were analyzed for imaging biomarker identifications.
For details of the automated machine learning process, including all methodological steps and their parameters, see the Supplemental Material.
The dataset of Center 2 was utilized as an independent test set to validate the established predictive model built by the dataset of Center 1. Confusion matrix analytics were utilized to calculate the number of true-positive, true-negative, false-positive, and false-negative prediction occurrences of each Center 2 case. Sensitivity, specificity, positive predictive value, accuracy, and area under the receiver operator characteristic (ROC) curve (AUC) were calculated across the validation cases.
At the end of the standard induction therapy, 55 patients achieved complete metabolic remission. During the 2-year follow-up, 14 patients had primary refractory disease, 14 patients relapsed within 12 months, and 2 patients had relapsed within 24 months. In summary, after the end of therapy, 30 patients had detectable metabolically active tumor tissue and relapsed within 24 months (Figure 1).

Figure 1 Comparison of clinical outcomes based on maximum intensity projection (MIP) images in three patients (A–C). By each patient, the first image shows primary staging, the second shows interim PET scan, and the third shows post-treatment restaging scan. The red arrows indicate FDG avid lymphoma foci. (A) Patient in complete remission to treatment. The increased FDG uptake in all three images was a sign of thyroiditis. (B) Patient without complete remission during and after the therapy. The interim scan showed Deauville score 4. (C) Patient had an interim scan with Deauville score 3 but relapsed after the treatment.
Using the data of the chi-square test, a significant association between COO, R-IPI, or stages and the specified groups was identified. There were significantly more patients in group 1 with non-GCB subtype, who had higher R-IPI values and stages. There was no significant difference between the sexes and between the groups. The clinicopathological features of patients are described in Table 1. In addition, patients were divided on the basis of the center where the [18F]FDG PET/CT scan was performed. No association between the two above-specified clinical outcomes (based on 2-year EFS), R-IPI, stages, or COO and the center where the examinations were performed was identified (Table 2).
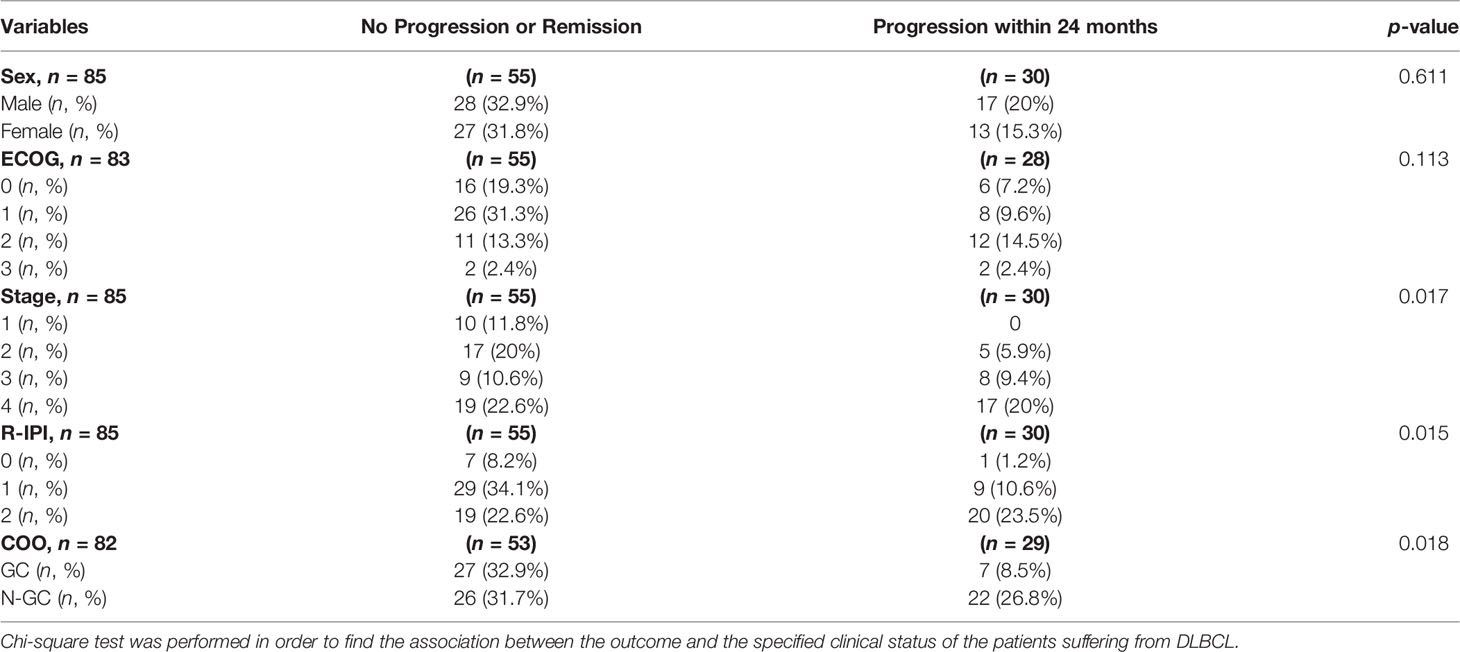
Table 1 Comparison of clinical outcome of the patients and their clinical data.
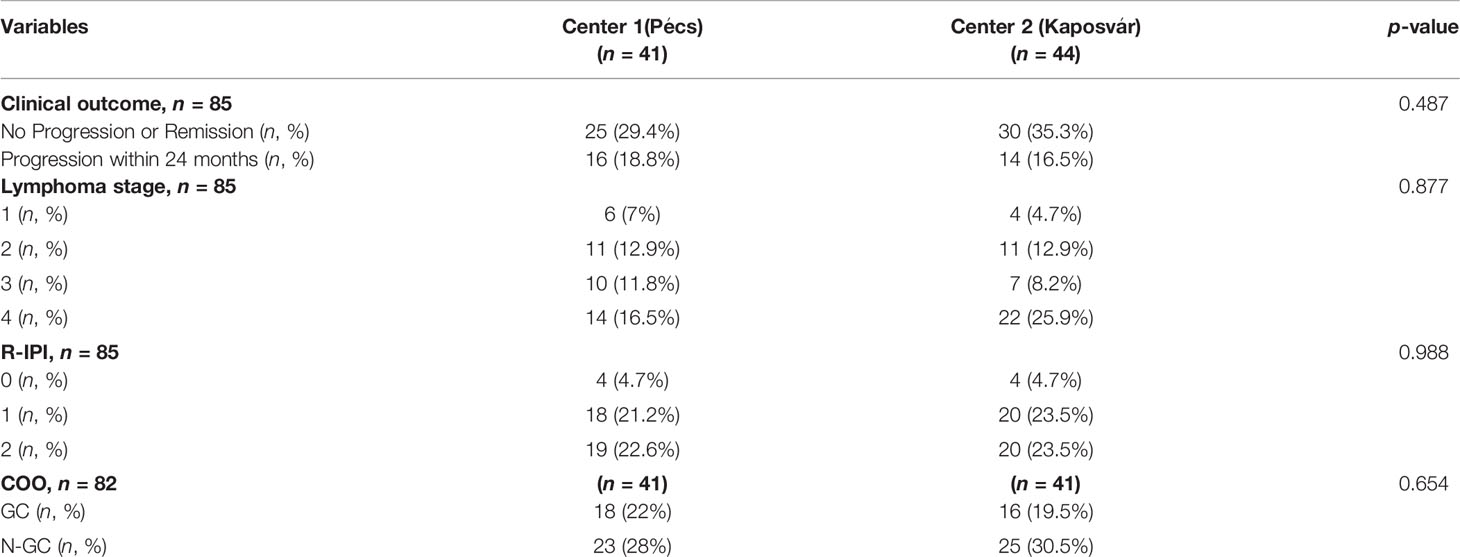
Table 2 Comparison of patients regarding to the two clinical centers where the FDG PET/CT examinations were performed.
Automated machine learning yielded 66% sensitivity, 77% specificity, 78% positive predictive value, 70% negative predictive value, 71% accuracy, and 0.74 AUC single-center cross-validation performance in Center 1.
Feature ranking revealed that the most important features for building 2-year EFS prediction are as follows: max diameter (9%), NGTDM busyness (9%), TLG (8%), TMTV (8%), and NGTDM coarseness (5%). The distributions of these parameters are plotted on violin plots (Figure 2).
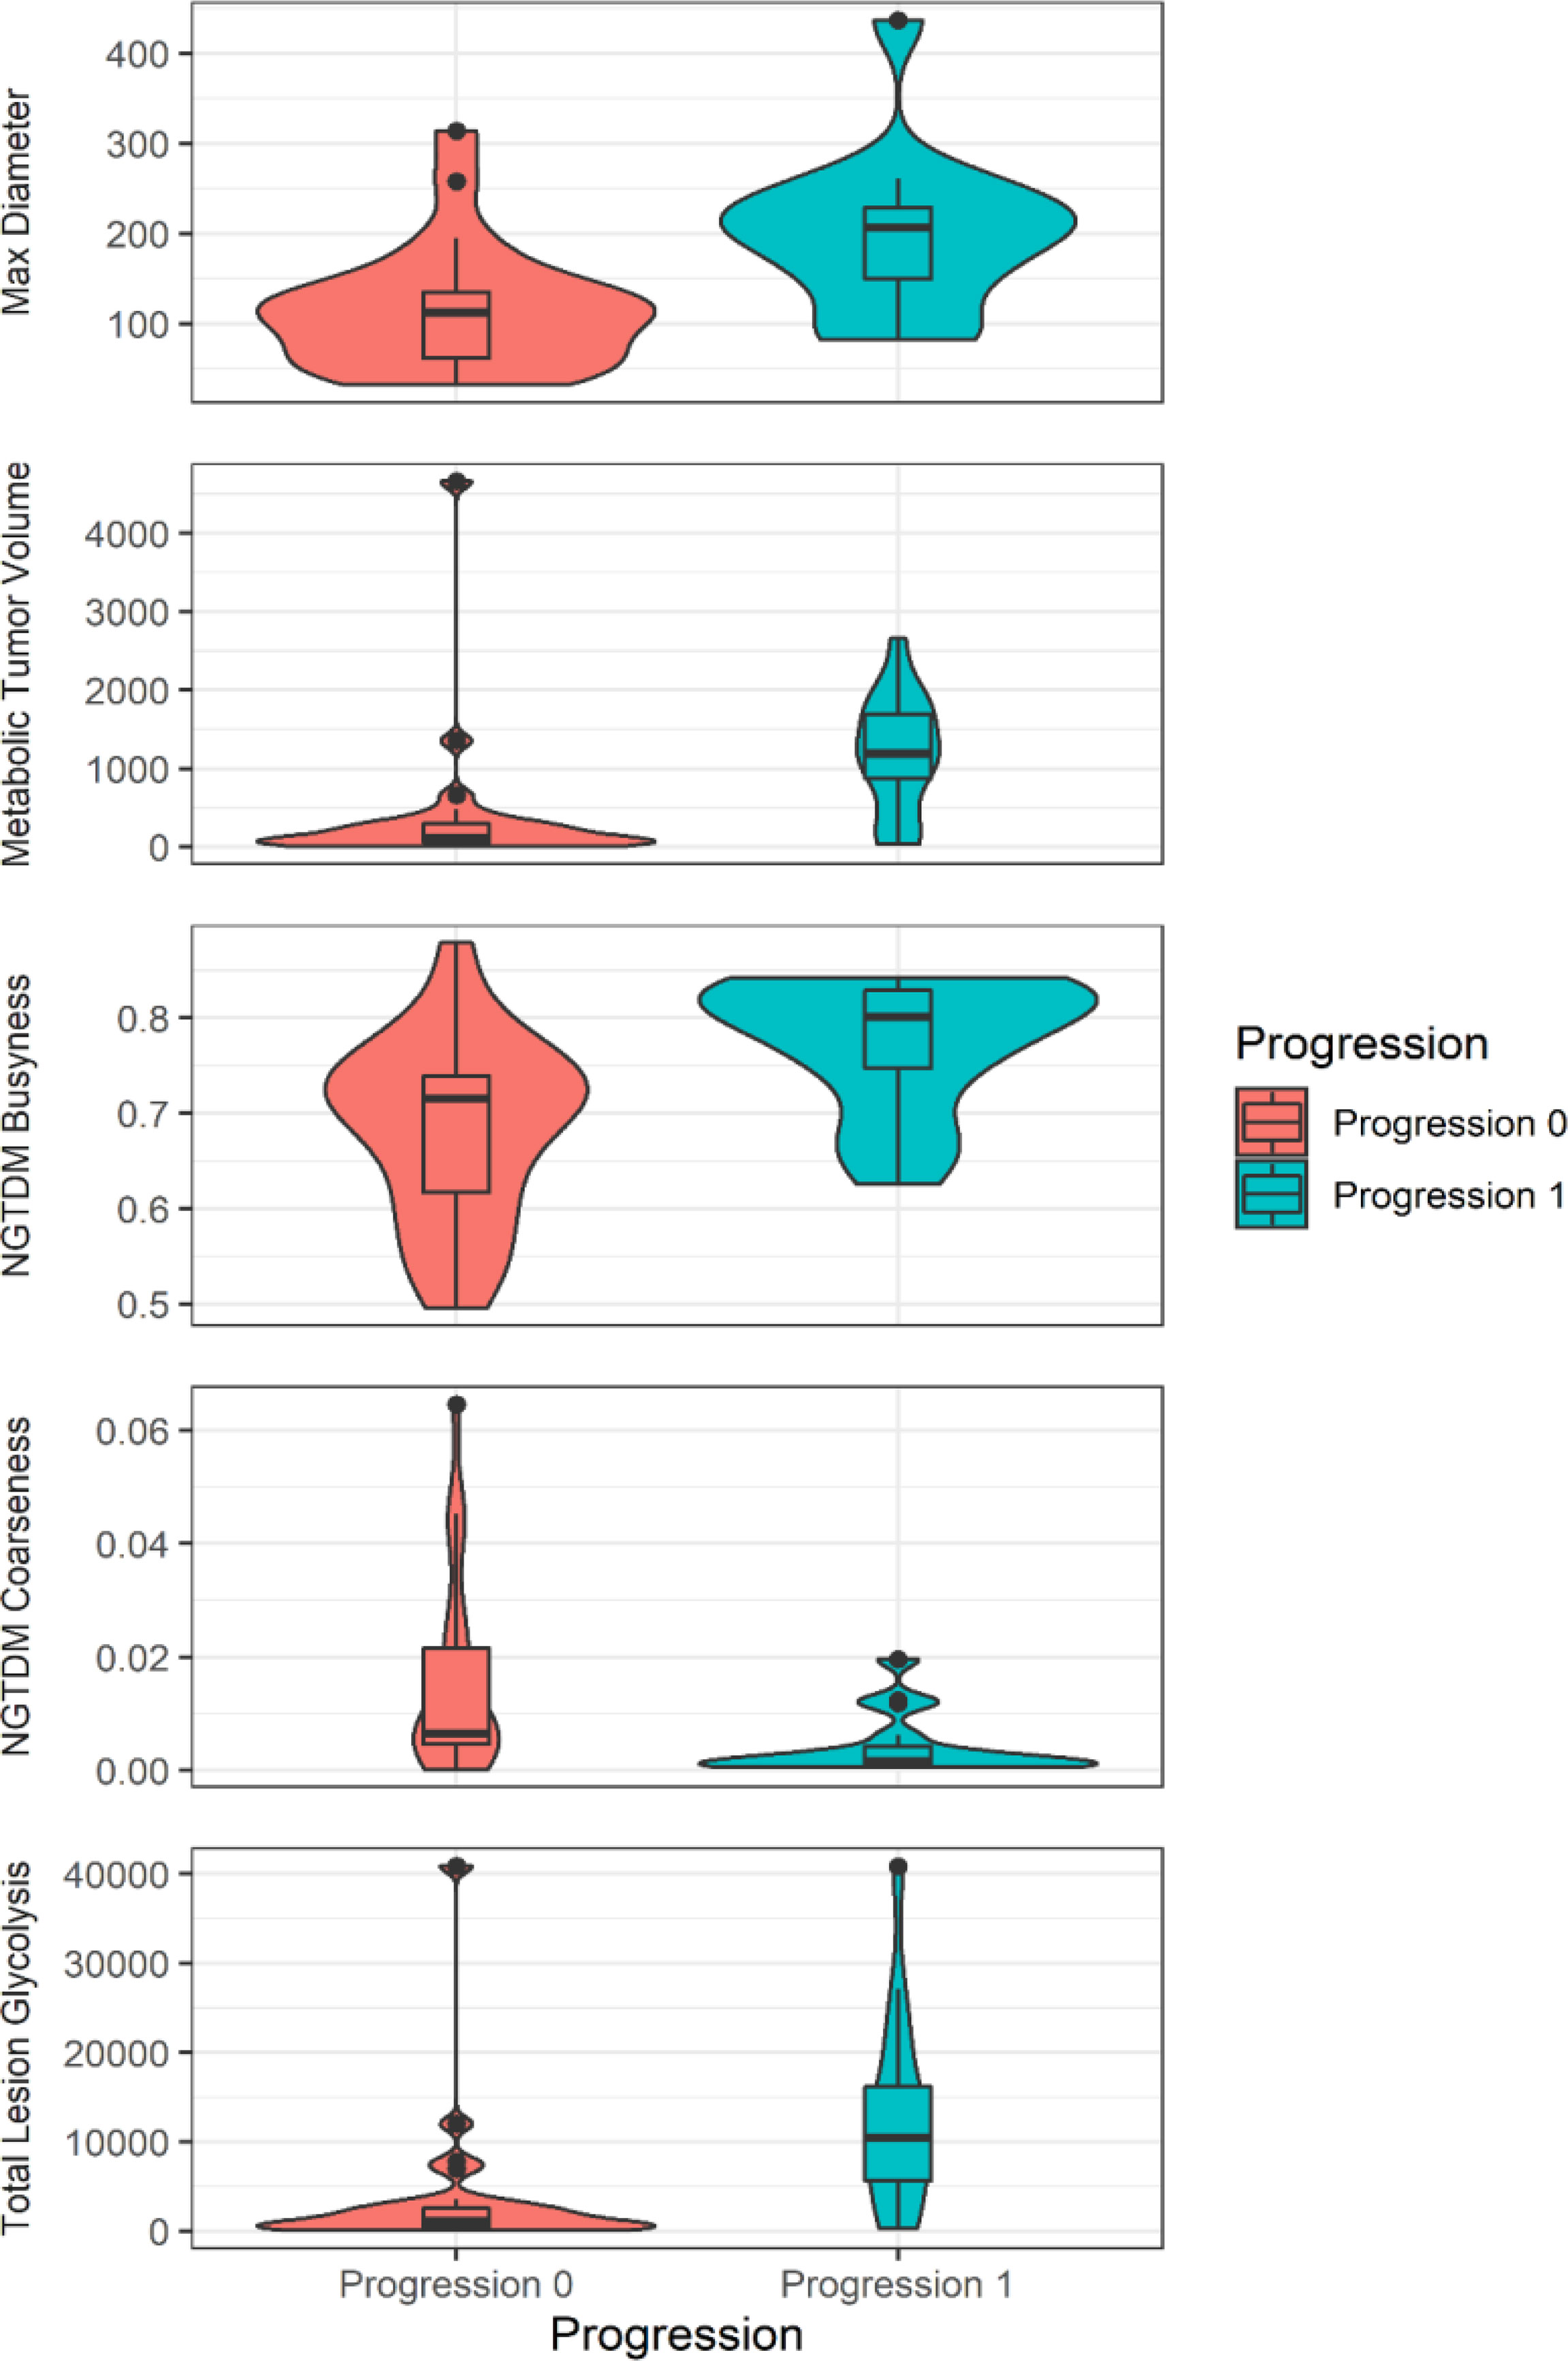
Figure 2 The violin plot (R: A Language and Environment for Statistical Computing, version 4.04., using package ggplot2, version 3.3.3) shows the values of the prominent features to predict 2-year event-free survival.
The predictive model built on the Center 1 dataset yielded 79% sensitivity, 83% specificity, 69% positive predictive value, 89% negative predictive value, 82% accuracy, and 0.85 AUC by evaluating the Center 2 dataset. See Figure 3 for the ROC curve of the independent validation performance over Center 2 cases. See Figure 4 for the Kaplan–Meier curve of the machine learning prediction vs. EFS over samples of Center 2.
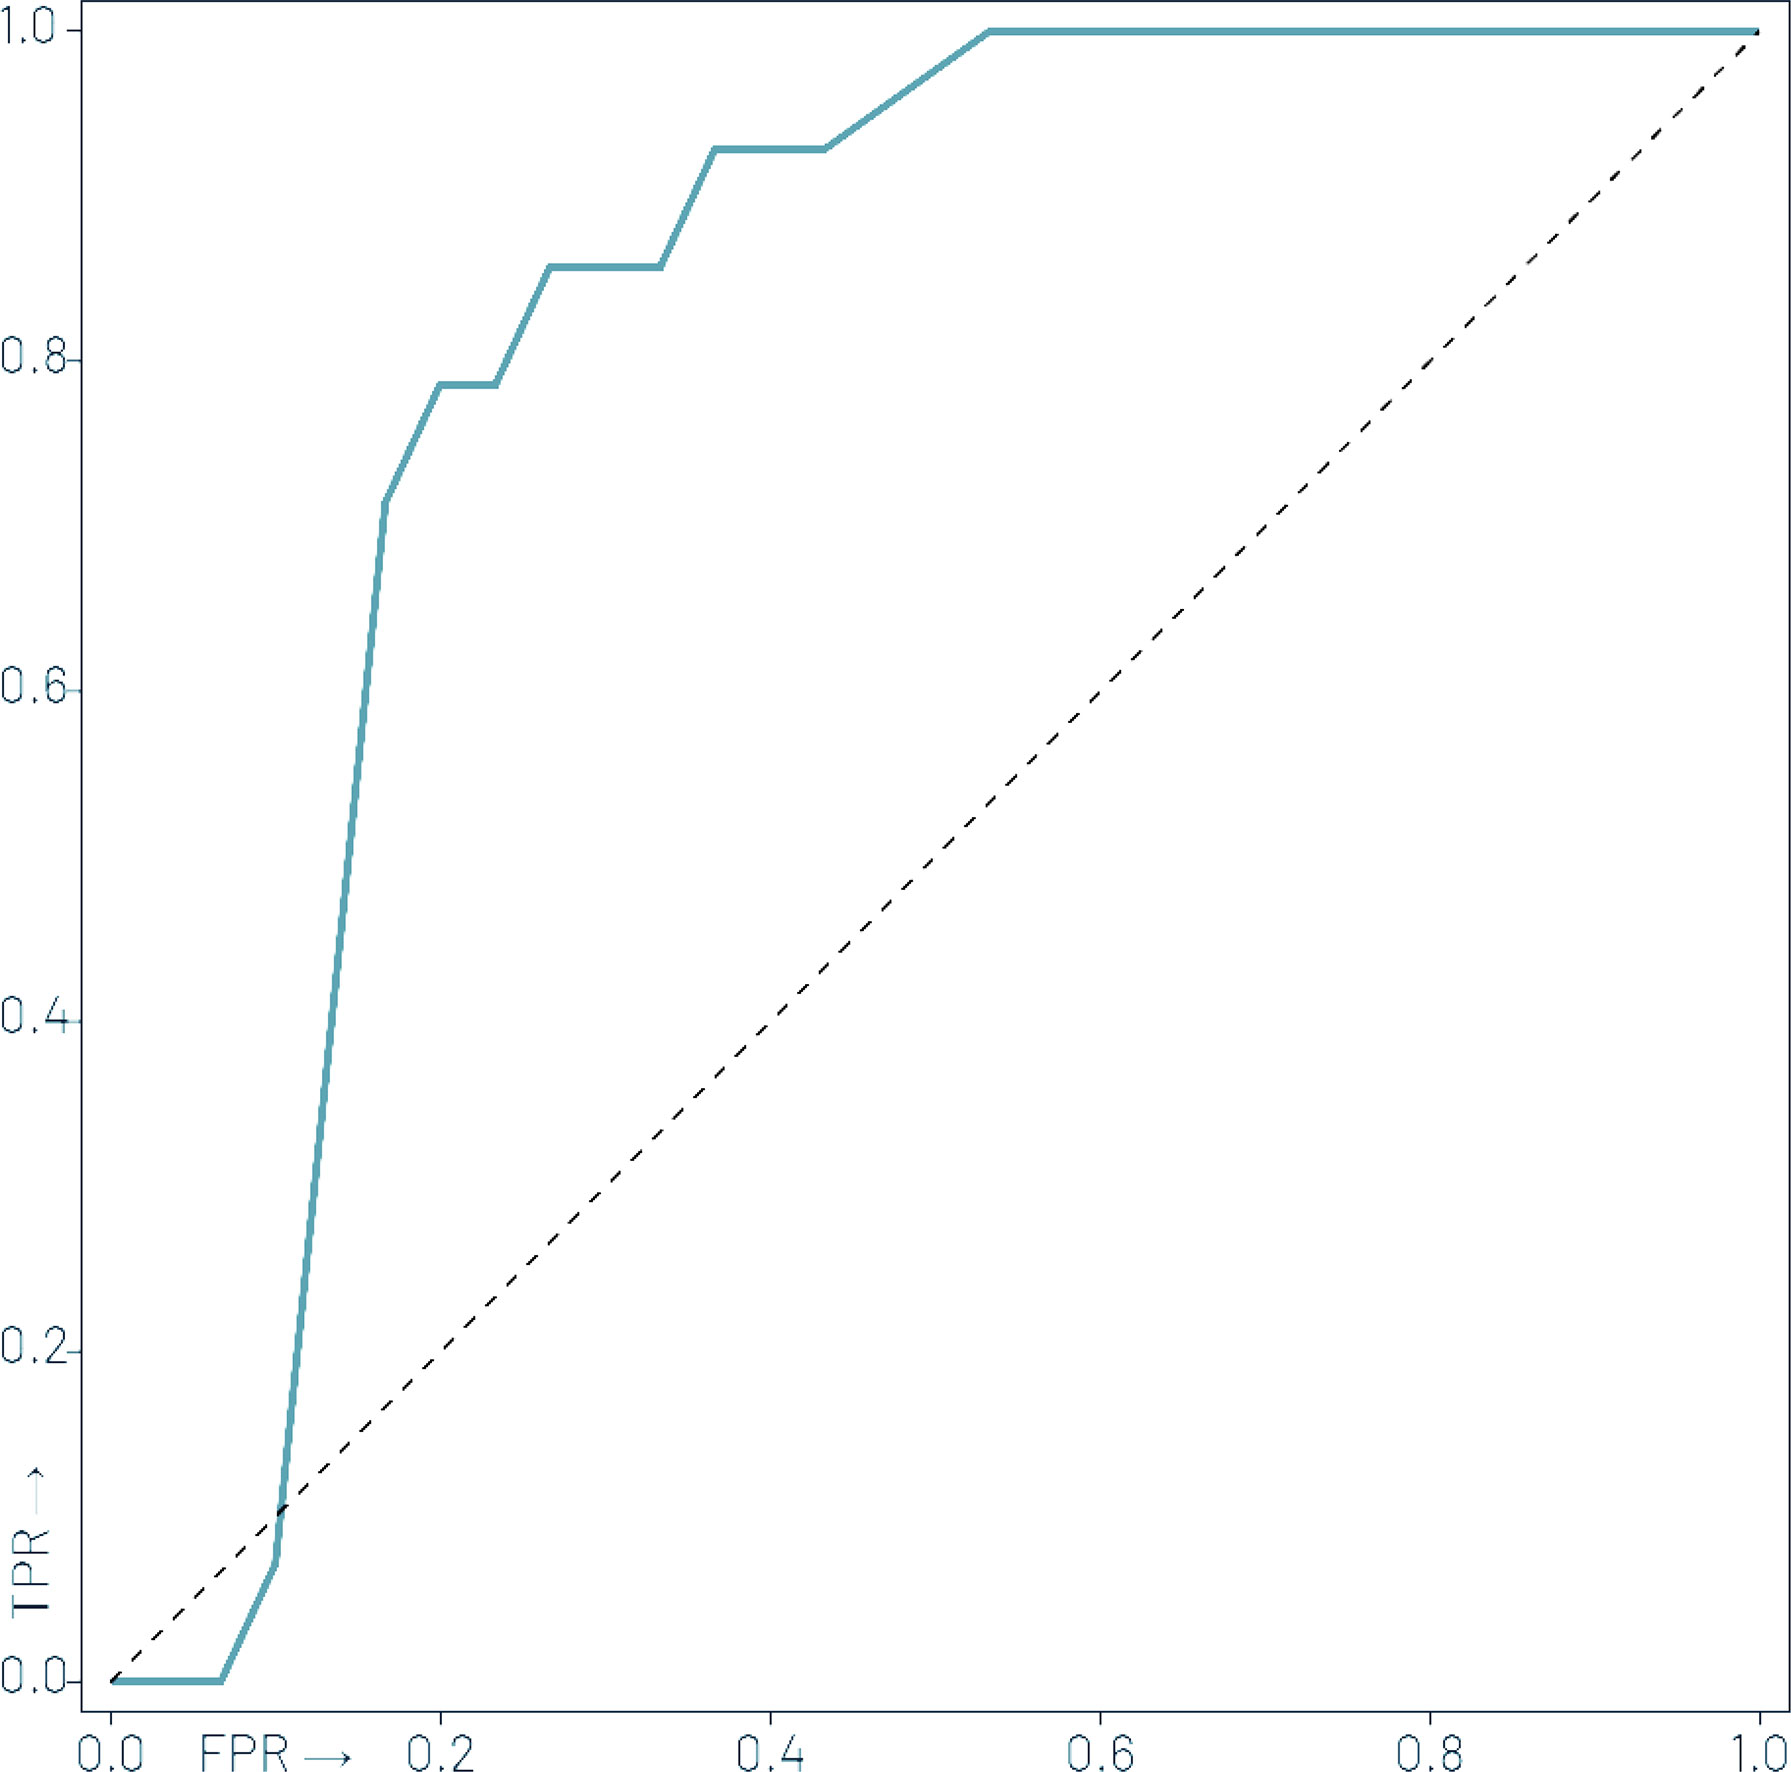
Figure 3 Receiver operator characteristic (ROC) curve of the independent validation performance of the machine learning model trained over Center 1 cases to predict 2-year event-free survival over Center 2 cases with an area under the ROC (AUC) of 0.85.
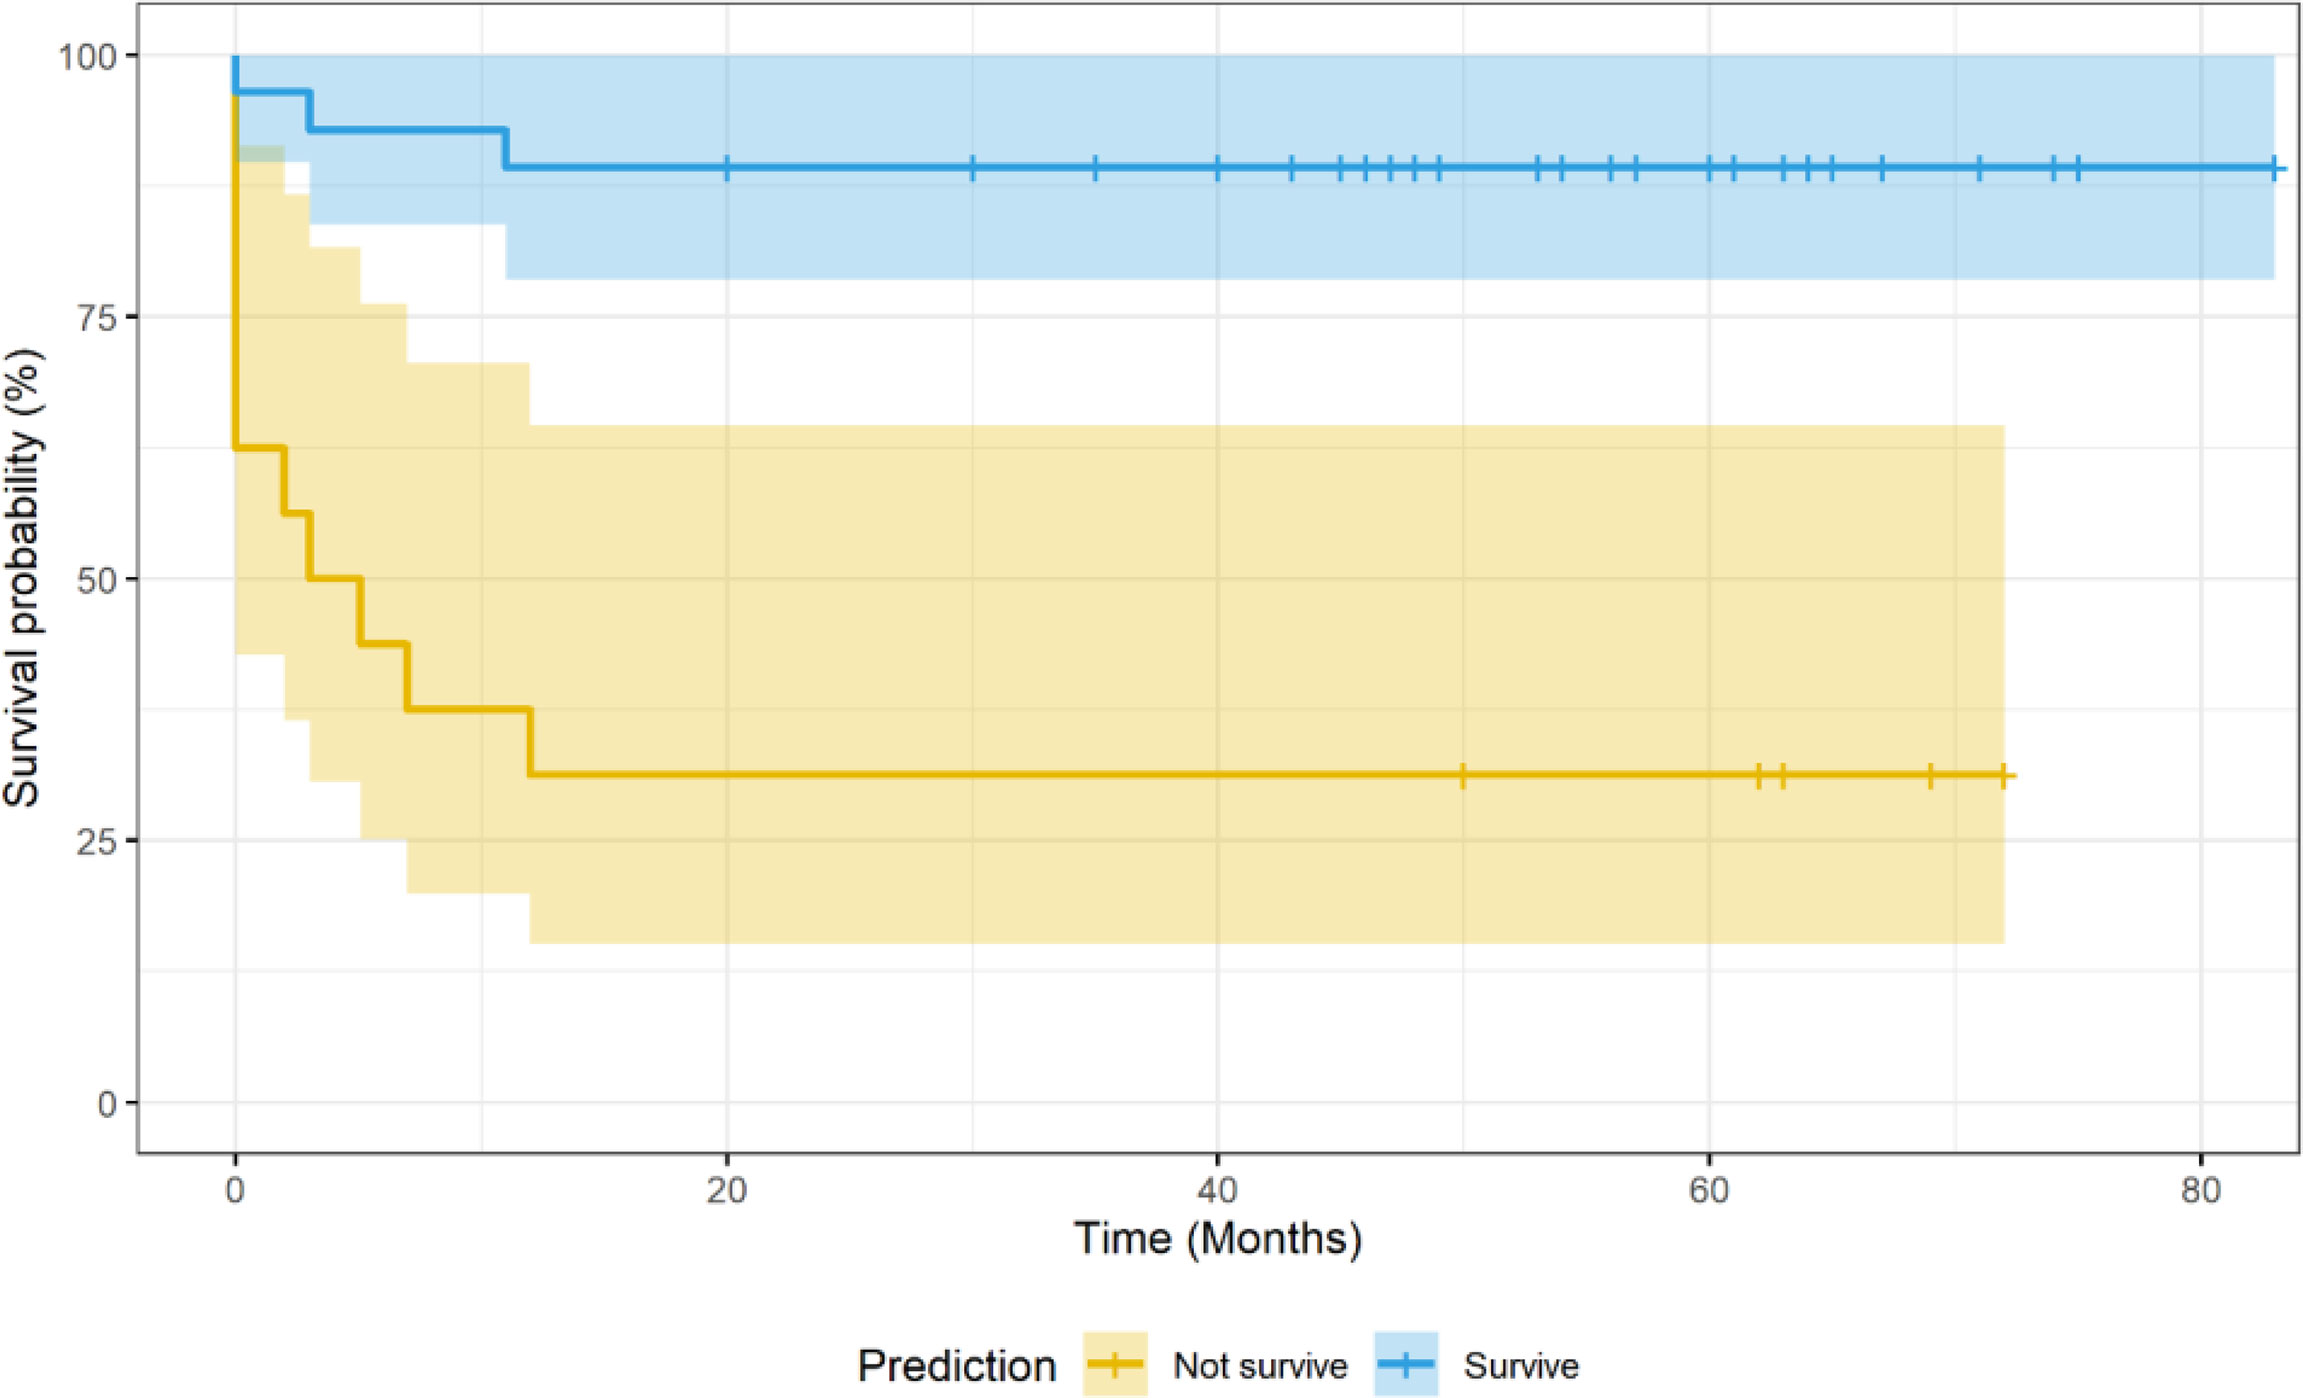
Figure 4 Kaplan–Meier curve of the machine learning (ML) model prediction vs. 2-year event-free survival in Center 2 cases. The ML model was trained with Center 1 cases.
DLBCL is a heterogeneous disease at many levels with diverse genetic features and variable clinical outcomes (2, 7, 27). Although DLBCL is potentially curable with standard treatment, there is an urgent need for new therapies since most refractory or relapsed patients will eventually die from the disease. Based on available data, about 40% of patients either will be resistant to the initial line of therapy or will relapse after the initial response. The majority of these patients cannot be salvaged by high-dose chemotherapy followed by ASCT and eventually will succumb to their disease. A better understanding of the pathogenesis of disease could help us understand the unique characteristics and the course of different subtypes of disease. Tremendous progress has been made over the past 20 years to identify the subtypes of DLBCL based on the COO, which carry significant impact on the prognosis of patients. In 2000, Alizadeh et al. (28) performed gene expression profiling with cDNA microarrays to explore the molecular heterogeneity in DLBCL. They described at least two distinct groups within DLBCL: the GCB group and the activated B-cell-like (ABC) or non-GCB group. This method has been widely recognized as the first COO-based classification of DLBCL. In several randomized clinical trials following the establishment of COO classification by Alizadeh et al., DLBCL patients with the ABC subtype showed significantly poorer outcome compared with those with the GCB subtype, even when immune chemotherapy was used. In recent years, COO classification has been not only established as a prognostic factor but also used to target therapies for DLBCL patients. The World Health Organization (WHO) Classification for Lymphoid Malignancies requires the determination of COO for every newly diagnosed DLBCL case. In recent years, next-generation sequencing provides the possibility of more accurate classification of DLBCL. New DLBCL subgroups have been identified based on detailed molecular analysis, which may provide a more accurate prognosis prediction and pave the way for personalized target therapy (5, 7, 29).
In connection with these recent advances in the molecular classification of lymphoma, several international trials have examined whether pretreatment baseline PET or interim PET imaging can separate poor-responder patients requiring intensification of therapy from good responders to the standard treatment (30–33).
The prognostic classification of DLBCL patients was originally based on immunohistochemical and molecular genetic differences and laboratory and anamnestic data. In addition to these parameters, the results of [18F]FDG PET/CT have a strong and crucial prognostic significance. For the prognosis, the current evaluation of lymphoma and therapeutic efficacy in patients relies on Deauville scoring, using hepatic [18F]FDG uptake and mediastinal blood pool as reference value (11, 34).
To optimize therapy for outcomes, many recently published papers propose that in addition to the Deauville scoring and delta SUV-max, other semi-quantitative metabolic functional parameters from pretreatment functional imaging studies could be used including TMTV and TLG, which have been mostly studied in DLBCL (35–37).
In addition to these parameters, it would be important to measure tumor heterogeneity in lymphoma, which may also lead to a better prediction of prognosis. [18F]FDG PET/CT is one of these non-invasive methods that examine the intratumor metabolic heterogeneity at a macroscopic scale (19, 38). Many studies in different tumor types predicted additional prognostic outcomes from textural parameters describing tumor heterogeneity (39). Tumor heterogeneity in PET can be examined generally with the analysis of the histogram or the spatial arrangement of voxel intensities extracted by computational postprocessing techniques (40). These parameters have been intensively studied in DLBCL and in other tumor types and seem to be also useful to select high-risk patients, but no definitive clinical metric proposal has been formed yet (41–46).
We aimed to investigate the potential prognostic significance of metabolic heterogeneity descriptors derived from primary PET and compare their diagnostic value with conventional PET metrics, such as TMTV, TLG, and SUV-max, and clinical data using multicenter automated machine learning analysis. We hypothesized that we could identify and predict poor-responder patients, who may require additional molecular investigations, classification, and personalized, molecularly targeted treatment. For this, we retrospectively assessed the [18F]FDG PET scans of 85 patients, which were performed in 2 clinical centers. The predictive model built on data from the first center resulted in 79% sensitivity, 83% specificity, 69% positive predictive value, 89% negative predictive value, 82% accuracy, and an AUC of 0.85 on the second center dataset. Thus, based on clinical and imaging parameters determined before starting treatment, we were able to predict with high accuracy which patients would progress or relapse within 2 years of diagnosis. It is also important to point out that the cross-validation performance was better than within Center 1 performance, which implies high robustness and generalizability of the build model. It is important to emphasize that the independent validation performance was higher utilizing Center 2 than the within-Center 1 cross-validation performance. This has multiple reasons: On the one hand, Center 1 was further split into subsets to conduct the cross-validation, which also decreases predictability due to lower number of training subsets. On the other hand, the 100-fold Monte Carlo cross-validation scheme performs splitting randomly, which may result in training-validation subsets being less similar than the similarity of Center 1 and Center 2 that represent reality, instead of a simulated distribution.
Our analysis determined prominent features to predict 2-year EFS. Based on the applied feature ranking, three volume-based biomarkers (TMTV, TLG, and max diameter of the largest VOI) and two metabolic heterogeneity descriptors (NGTDM busyness and coarseness) had the highest diagnostic significance. Volume-based parameters refer to the extent of the lymphoma. The prognostic value of semi-quantitative metrics such as TMTV and TLG in lymphoma as well as in other tumor types has already been demonstrated (35–37). In our study, the max diameter of the largest lymphoma foci appears to be a better prognosis predictor than TMTV (see Supplementary Material: Feature importance). While these features may be redundant, their overall importance compared to each other may be different per cohort. Therefore, future investigations shall focus on identifying which of these two features are clinically relevant. While clinical parameters were included in our ML model building process, feature ranking did not select them as relevant for predicting 2-year survival, compared to imaging features. As such, the highest-ranking clinical feature was R-IPI with a ranking of 12 and with a relative importance of 2.53%. This implies that 2-year survival can be predicted with imaging features, which may act as surrogates of, albeit being superior to clinical parameters.
According to the IBSI “Textures with large changes in grey levels between neighboring voxels are said to be busy” (40). If the busyness is high, the neighboring uptake change is sudden and not smooth. The violin plot shows that group 1 with poor prognosis has higher busyness values. This may be explained by the fact that lymphoma cells are embedded in a necrotic, sometimes hypoxic, periphery, which may be a key point of the ineffectiveness of therapy, also because the chemotherapeutic agent may experience difficulty penetrating these regions. Furthermore, gray-level differences in coarse textures are generally small due to large-scale patterns. Summing differences gives an indication of the level of the spatial rate of change in intensity. This means that high coarseness is associated with larger regions in the lesions, while low coarseness indicates that the texture subregions are smaller. The violin plot shows that group 1 with poor prognosis has lower coarseness values. Coarseness can be associated with cell diversities within the volume regarding their different FDG uptake, which can be due to less proliferative tumor cells, or an inhomogeneous tumor mass with necrosis and hypoxic area.
In a study predicting 2-year EFS in DLBCL, low gray-level emphasis provides better prognosis prediction than TMTV, or coarseness and busyness (41), which we assume is due to population differences. Therefore, to determine the real importance of these features, prospective studies with more patients shall be performed.
In other—mostly solid—tumor types, coarseness was highlighted in predicting the outcome of locally advanced rectum cancer (45). In another study, both coarseness and busyness proved to be more predictive than other SUV-based parameters in non-small cell lung cancer (47).
Among SUV-based metrics, SUV-max is the most used parameter in routine diagnostics. With SUV-max, indolent and aggressive lymphomas could be well-differentiated, and this metric is also correlated with tumor histology (proliferation rate) and blood levels of enzymes, for example, KI-67 status and LDH (48). Several research groups have already demonstrated the diagnostic value of SUV-max in lymphoma during primer staging; in one of them, SUV-max proved to be more prognostic than TMTV or TLG (49). However, in our study, these parameters were less important features than others. We hypothesized that the SUV measurements are more influenced by the instrumentations and environmental factors than volume-based and textural parameters.
In addition to PET parameters, clinical parameters are also crucial in the prediction of prognosis, and this fact was confirmed by our statistical approach even if these parameters had lower ranks than some PET parameters. Using chi-square test results, we found a significant relationship between the DLBCL subtype groups and clinical and pathological parameters such as R-IPI and COO. Patients with non-GCB or higher R-IPI values have a significantly worse 2-year prognosis as reported in many previous studies. The prognostic value and diagnostic significance of COO and R-IPI have been known for a very long time (4, 28). The COO can be easily determined in all patients, mainly according to the Hans algorithm, and its combination with TMTV has been suggested by some studies (50). R-IPI proved to be more prognostic than TMTV in another study (51). However, most of the studies use one or a maximum of two metrics for prognosis assessment (50, 52). In contrast, machine learning-built prediction models have the potential to deliver more in-depth associations among clinical and PET data (53–55).
This study had limitations. First, we analyzed only the largest VOI in each patient with radiomics. Nevertheless, prior studies routinely analyzed the largest VOIs in DLBCL patients and yielded promising results (41, 44). In addition, radiomic analysis is generally discouraged to be performed in small lesions. Second, our patient counts were relatively low in both Center 1 and Center 2 cohorts. Nevertheless, they were from different camera systems, which allowed us to perform an independent validation scheme of our predictive model.
With our dual-center study, we could demonstrate that predicting 2-year progression-free survival in DLBCL patients is feasible with high-precision building on imaging and clinical parameters. This is in line with prior studies that utilize holistic datasets to build so-called holomics prediction models with machine learning (16, 25, 56). Given that our model yielded a balanced sensitivity and specificity, it could be a viable option to personalize the patient’s treatment. In the era of personalized medicine, with more detailed and specialized molecular diagnostics—especially in DLBCL—this could help clinicians to manage their patients more adequately and effectively.
Based on our dual-center retrospective analysis, predicting 2-year EFS built on imaging features is feasible by utilizing high-performance automated machine learning. Subsequent DLBCL studies shall further evaluate the identified imaging biomarkers and their predictive performance in other clinical settings.
The original contributions presented in the study are included in the article/Supplementary Material. Further inquiries can be directed to the corresponding author.
The studies involving human participants were reviewed and approved by the appropriate local institutional research ethics committee and the Hungarian National Institute of Pharmacy and Nutrition under permission number 6536 – University of Pécs 2017 and OGYÉI/50268-8/2017. Written informed consent for participation was not required for this study in accordance with the national legislation and the institutional requirements.
Conceptualization: ZR, KZ, and HA. Methodology: LPapp and DM. Software: LPapp. Formal analysis: FB and ES. Investigation: DD and ZR. Resources: DM and ES. Data curation: ZT, LPaj, AB, ÉK, and ÁS. Writing—original draft preparation: ZR and HA. Writing—review and editing: LPapp, HA, KZ, and ES. Visualization: DM and DV. Supervision: HA, KZ, and LPapp. Project administration: ES and ZR. Funding acquisition: HA, DM, and KZ. All authors commented on previous versions of the manuscript. All authors have read and agreed to the published version of the manuscript.
The research was supported by the Hungarian Government`s higher Education Institutional Excellence Program project 20765-3/2018/FEKUTSTRAT. Research leading to these results has received funding from the European Union’s Horizon 2020 research and innovation program under grant agreement No. 739593. HCEMM was supported by EU Program: H2020-EU.4.a. This work was also partly funded by a grant from the Hungarian National Research, Development and Innovation Office (Thematic Excellence Program, TKP-BIOImaging, financed under the 2020-4.1.1-TKP2020 funding scheme).
The authors declare that the research was conducted in the absence of any commercial or financial relationships that could be construed as a potential conflict of interest.
All claims expressed in this article are solely those of the authors and do not necessarily represent those of their affiliated organizations, or those of the publisher, the editors and the reviewers. Any product that may be evaluated in this article, or claim that may be made by its manufacturer, is not guaranteed or endorsed by the publisher.
We particularly thank Kristóf Méhes (RapidMiner Ltd., Budapest, Hungary), Nelli Farkas (University of Pécs, Medical School, Institute of Bioanalysis, Pécs, Hungary), Béla Kajtár (University of Pécs, Medical School, Department of Pathology, Pécs, Hungary), and Krisztián Szigeti (Semmelweis University, Faculty of Medicine, Department of Biophysics and Radiation Biology, Budapest, Hungary) for their help in designing the study and evaluating the data, and for valuable suggestions.
The Supplementary Material for this article can be found online at: https://www.frontiersin.org/articles/10.3389/fonc.2022.820136/full#supplementary-material
1. Thandra KC, Barsouk A, Saginala K, Padala SA, Rawla P. Epidemiology of Non-Hodgkin's Lymphoma. Med Sci (Basel) (2021) 9:1–9. doi: 10.3390/medsci9010005
2. Martelli M, Ferreri AJ, Agostinelli C, Di Rocco A, Pfreundschuh M, Pileri SA. Diffuse Large B-Cell Lymphoma. Crit Rev Oncol Hematol (2013) 87:146–71. doi: 10.1016/j.critrevonc.2012.12.009
3. Swerdlow SH, Campo E, Pileri SA, Harris NL, Stein H, Siebert R, et al. The 2016 Revision of the World Health Organization Classification of Lymphoid Neoplasms. Blood (2016) 127:2375–90. doi: 10.1182/blood-2016-01-643569
4. Li S, Young KH, Medeiros LJ. Diffuse Large B-Cell Lymphoma. Pathology (2018) 50:74–87. doi: 10.1016/j.pathol.2017.09.006
5. Abramson JS. Hitting Back at Lymphoma: How do Modern Diagnostics Identify High-Risk Diffuse Large B-Cell Lymphoma Subsets and Alter Treatment? Cancer (2019) 125:3111–20. doi: 10.1002/cncr.32145
6. Pasqualucci L, Dalla-Favera R. Genetics of Diffuse Large B-Cell Lymphoma. Blood (2018) 131:2307–19. doi: 10.1182/blood-2017-11-764332
7. Liu Y, Barta SK. Diffuse Large B-Cell Lymphoma: 2019 Update on Diagnosis, Risk Stratification, and Treatment. Am J Hematol (2019) 94:604–16. doi: 10.1002/ajh.25460
8. Kubuschok B, Held G, Pfreundschuh M. Management of Diffuse Large B-Cell Lymphoma (DLBCL). Cancer Treat Res (2015) 165:271–88. doi: 10.1007/978-3-319-13150-4_11
9. Caimi PF, Hill BT, Hsi ED, Smith MR. Clinical Approach to Diffuse Large B Cell Lymphoma. Blood Rev (2016) 30:477–91. doi: 10.1016/j.blre.2016.06.003
10. Chaganti S, Illidge T, Barrington S, Mckay P, Linton K, Cwynarski K, et al. Guidelines for the Management of Diffuse Large B-Cell Lymphoma. Br J Haematol (2016) 174:43–56. doi: 10.1111/bjh.14136
11. Cheson BD, Fisher RI, Barrington SF, Cavalli F, Schwartz LH, Zucca E, et al. Recommendations for Initial Evaluation, Staging, and Response Assessment of Hodgkin and non-Hodgkin Lymphoma: The Lugano Classification. J Clin Oncol (2014) 32:3059–68. doi: 10.1200/JCO.2013.54.8800
12. El-Galaly TC, Villa D, Gormsen LC, Baech J, Lo A, Cheah CY. FDG-PET/CT in the Management of Lymphomas: Current Status and Future Directions. J Intern Med (2018) 284:358–76. doi: 10.1111/joim.12813
13. Voltin CA, Mettler J, Grosse J, Dietlein M, Baues C, Schmitz C, et al. FDG-PET Imaging for Hodgkin and Diffuse Large B-Cell Lymphoma-An Updated Overview. Cancers (Basel) (2020) 12:1–15. doi: 10.3390/cancers12030601
14. Gisselbrecht C, Van Den Neste E. How I Manage Patients With Relapsed/Refractory Diffuse Large B Cell Lymphoma. Br J Haematol (2018) 182:633–43. doi: 10.1111/bjh.15412
15. Thieblemont C, Bernard S, Meignan M, Molina T. Optimizing Initial Therapy in DLBCL. Best Pract Res Clin Haematol (2018) 31:199–208. doi: 10.1016/j.beha.2018.08.001
16. Papp L, Spielvogel CP, Rausch I, Hacker M, Beyer T. Personalizing Medicine Through Hybrid Imaging and Medical Big Data Analysis. Front Physics (2018) 6:51. doi: 10.3389/fphy.2018.00051
17. Traverso A, Wee L, Dekker A, Gillies R. Repeatability and Reproducibility of Radiomic Features: A Systematic Review. Int J Radiat Oncol Biol Phys (2018) 102:1143–58. doi: 10.1016/j.ijrobp.2018.05.053
18. Zwanenburg A, Vallières M, Abdalah MA, Aerts HJWL, Andrearczyk V, Apte A, et al. The Image Biomarker Standardization Initiative: Standardized Quantitative Radiomics for High-Throughput Image-Based Phenotyping. Radiology (2020) 295:328–38. doi: 10.1148/radiol.2020191145
19. Ibrahim A, Vallières M, Woodruff H, Primakov S, Beheshti M, Keek S, et al. Radiomics Analysis for Clinical Decision Support in Nuclear Medicine. Semin Nucl Med (2019) 49:438–49. doi: 10.1053/j.semnuclmed.2019.06.005
20. Hans CP, Weisenburger DD, Greiner TC, Gascoyne RD, Delabie J, Ott G, et al. Confirmation of the Molecular Classification of Diffuse Large B-Cell Lymphoma by Immunohistochemistry Using a Tissue Microarray. Blood (2004) 103:275–82. doi: 10.1182/blood-2003-05-1545
21. Cheson BD, Pfistner B, Juweid ME, Gascoyne RD, Specht L, Horning SJ, et al. Revised Response Criteria for Malignant Lymphoma. J Clin Oncol (2007) 25:579–86. doi: 10.1200/JCO.2006.09.2403
22. Eude F, Toledano MN, Vera P, Tilly H, Mihailescu SD, Becker S. Reproducibility of Baseline Tumour Metabolic Volume Measurements in Diffuse Large B-Cell LymphomA: Is There a Superior Method? Metabolites (2021) 11:1–16. doi: 10.3390/metabo11020072
23. Kinahan PE, Fletcher JW. Positron Emission Tomography-Computed Tomography Standardized Uptake Values in Clinical Practice and Assessing Response to Therapy. Semin Ultrasound CT MR (2010) 31:496–505. doi: 10.1053/j.sult.2010.10.001
24. Maurer MJ, Ghesquières H, Jais JP, Witzig TE, Haioun C, Thompson CA, et al. Event-Free Survival at 24 Months is a Robust End Point for Disease-Related Outcome in Diffuse Large B-Cell Lymphoma Treated With Immunochemotherapy. J Clin Oncol (2014) 32:1066–73. doi: 10.1200/JCO.2013.51.5866
25. Papp L, Spielvogel CP, Grubmüller B, Grahovac M, Krajnc D, Ecsedi B, et al. Supervised Machine Learning Enables non-Invasive Lesion Characterization in Primary Prostate Cancer With [ 68 Ga]Ga-PSMA-11 PET/MRI. Eur J Nucl Med Mol Imaging (2021) 48:1795–805. doi: 10.1007/s00259-020-05140-y
26. Papp L, Pötsch N, Grahovac M, Schmidbauer V, Woehrer A, Preusser M, et al. Glioma Survival Prediction With Combined Analysis of In Vivo. J Nucl Med (2018) 59:892–9. doi: 10.2967/jnumed.117.202267
27. Perry AM, Diebold J, Nathwani BN, MacLennan KA, Müller-Hermelink HK, Bast M, et al. Non-Hodgkin Lymphoma in the Developing World: Review of 4539 Cases From the International Non-Hodgkin Lymphoma Classification Project. Haematologica (2016) 101:1244–50. doi: 10.3324/haematol.2016.148809
28. Alizadeh AA, Eisen MB, Davis RE, Ma C, Lossos IS, Rosenwald A, et al. Distinct Types of Diffuse Large B-Cell Lymphoma Identified by Gene Expression Profiling. Nature (2000) 403:503–11. doi: 10.1038/35000501
29. Schmitz R, Wright GW, Huang DW, Johnson CA, Phelan JD, Wang JQ, et al. Genetics and Pathogenesis of Diffuse Large B-Cell Lymphoma. N Engl J Med (2018) 378:1396–407. doi: 10.1056/NEJMoa1801445
30. Freeman CL, Savage KJ, Villa DR, Scott DW, Srour L, Gerrie AS, et al. Long-Term Results of PET-Guided Radiation in Patients With Advanced-Stage Diffuse Large B-Cell Lymphoma Treated With R-CHOP. Blood (2021) 137:929–38. doi: 10.1182/blood.2020005846
31. Dührsen U, Müller S, Hertenstein B, Thomssen H, Kotzerke J, Mesters R, et al. Positron Emission Tomography-Guided Therapy of Aggressive Non-Hodgkin Lymphomas (PETAL): A Multicenter, Randomized Phase III Trial. J Clin Oncol (2018) 36:2024–34. doi: 10.1200/JCO.2017.76.8093
32. Hüttmann A, Rekowski J, Müller SP, Hertenstein B, Franzius C, Mesters R, et al. Six Versus Eight Doses of Rituximab in Patients With Aggressive B Cell Lymphoma Receiving Six Cycles of CHOP: Results From the "Positron Emission Tomography-Guided Therapy of Aggressive Non-Hodgkin Lymphomas" (PETAL) Trial. Ann Hematol (2019) 98:897–907. doi: 10.1007/s00277-018-3578-0
33. Zucca E, Cascione L, Ruberto T, Facchinelli D, Schär S, Hayoz S, et al. Prognostic Models Integrating Quantitative Parameters From Baseline and Interim Positron Emission Computed Tomography in Patients With Diffuse Large B-Cell Lymphoma: Post-Hoc Analysis From the SAKK38/07 Clinical Trial. Hematol Oncol (2020) 38:715–25. doi: 10.1002/hon.2805
34. Barrington SF, Mikhaeel NG, Kostakoglu L, Meignan M, Hutchings M, Müeller SP, et al. Role of Imaging in the Staging and Response Assessment of Lymphoma: Consensus of the International Conference on Malignant Lymphomas Imaging Working Group. J Clin Oncol (2014) 32:3048–58. doi: 10.1200/JCO.2013.53.5229
35. Vercellino L, Cottereau AS, Casasnovas O, Tilly H, Feugier P, Chartier L, et al. High Total Metabolic Tumor Volume at Baseline Predicts Survival Independent of Response to Therapy. Blood (2020) 135:1396–405. doi: 10.1182/blood.2019003526
36. Kostakoglu L, Chauvie S. PET-Derived Quantitative Metrics for Response and Prognosis in Lymphoma. PET Clin (2019) 14:317–29. doi: 10.1016/j.cpet.2019.03.002
37. Prieto Prieto JC, Vallejo Casas JA, Hatzimichael E, Fotopoulos A, Kiortsis DN, Sioka C. The Contribution of Metabolic Parameters of FDG PET/CT Prior and During Therapy of Adult Patients With Lymphomas. Ann Nucl Med (2020) 34:707–17. doi: 10.1007/s12149-020-01521-3
38. Bailly C, Bodet-Milin C, Bourgeois M, Gouard S, Ansquer C, Barbaud M, et al. Exploring Tumor Heterogeneity Using PET Imaging: The Big Picture. Cancers (Basel) (2019) 11:1–17. doi: 10.3390/cancers11091282
39. Mayerhoefer ME, Umutlu L, Schöder H. Functional Imaging Using Radiomic Features in Assessment of Lymphoma. Methods (2021) 188:105–11. doi: 10.1016/j.ymeth.2020.06.020
40. Mayerhoefer ME, Materka A, Langs G, Häggström I, Szczypiński P, Gibbs P, et al. Introduction to Radiomics. J Nucl Med (2020) 61:488–95. doi: 10.2967/jnumed.118.222893
41. Aide N, Fruchart C, Nganoa C, Gac AC, Lasnon C. Baseline. Eur Radiol (2020) 30:4623–32. doi: 10.1007/s00330-020-06815-8
42. Zhou Y, Ma XL, Pu LT, Zhou RF, Ou XJ, Tian R. Prediction of Overall Survival and Progression-Free Survival by the. Contrast Media Mol Imaging (2019) 2019:5963607. doi: 10.1155/2019/5963607
43. Sun Y, Qiao X, Jiang C, Liu S, Zhou Z. Texture Analysis Improves the Value of Pretreatment. Contrast Media Mol Imaging (2020) 2020:2981585. doi: 10.1155/2020/2981585
44. Senjo H, Hirata K, Izumiyama K, Minauchi K, Tsukamoto E, Itoh K, et al. High Metabolic Heterogeneity on Baseline 18FDG-PET/CT Scan as a Poor Prognostic Factor for Newly Diagnosed Diffuse Large B-Cell Lymphoma. Blood Adv (2020) 4:2286–96. doi: 10.1182/bloodadvances.2020001816
45. Lovinfosse P, Polus M, Van Daele D, Martinive P, Daenen F, Hatt M, et al. FDG PET/CT Radiomics for Predicting the Outcome of Locally Advanced Rectal Cancer. Eur J Nucl Med Mol Imaging (2018) 45:365–75. doi: 10.1007/s00259-017-3855-5
46. Park S, Ha S, Lee SH, Paeng JC, Keam B, Kim TM, et al. Intratumoral Heterogeneity Characterized by Pretreatment PET in non-Small Cell Lung Cancer Patients Predicts Progression-Free Survival on EGFR Tyrosine Kinase Inhibitor. PLos One (2018) 13:e0189766. doi: 10.1371/journal.pone.0189766
47. Cook GJ, Yip C, Siddique M, Goh V, Chicklore S, Roy A, et al. Are Pretreatment 18F-FDG PET Tumor Textural Features in non-Small Cell Lung Cancer Associated With Response and Survival After Chemoradiotherapy? J Nucl Med (2013) 54:19–26. doi: 10.2967/jnumed.112.107375
48. Kostakoglu L, Chauvie S. Metabolic Tumor Volume Metrics in Lymphoma. Semin Nucl Med (2018) 48:50–66. doi: 10.1053/j.semnuclmed.2017.09.005
49. Gallicchio R, Mansueto G, Simeon V, Nardelli A, Guariglia R, Capacchione D, et al. F-18 FDG PET/CT Quantization Parameters as Predictors of Outcome in Patients With Diffuse Large B-Cell Lymphoma. Eur J Haematol (2014) 92:382–9. doi: 10.1111/ejh.12268
50. Cottereau AS, Lanic H, Mareschal S, Meignan M, Vera P, Tilly H, et al. Molecular Profile and FDG-PET/CT Total Metabolic Tumor Volume Improve Risk Classification at Diagnosis for Patients With Diffuse Large B-Cell Lymphoma. Clin Cancer Res (2016) 22:3801–9. doi: 10.1158/1078-0432.CCR-15-2825
51. Adams HJ, de Klerk JM, Fijnheer R, Heggelman BG, Dubois SV, Nievelstein RA, et al. Prognostic Superiority of the National Comprehensive Cancer Network International Prognostic Index Over Pretreatment Whole-Body Volumetric-Metabolic FDG-PET/CT Metrics in Diffuse Large B-Cell Lymphoma. Eur J Haematol (2015) 94:532–9. doi: 10.1111/ejh.12467
52. Cottereau AS, Nioche C, Dirand AS, Clerc J, Morschhauser F, Casasnovas O, et al. F-FDG PET Dissemination Features in Diffuse Large B-Cell Lymphoma Are Predictive of Outcome. J Nucl Med (2020) 61:40–5. doi: 10.2967/jnumed.119.229450
53. Toyama Y, Hotta M, Motoi F, Takanami K, Minamimoto R, Takase K. Prognostic Value of FDG-PET Radiomics With Machine Learning in Pancreatic Cancer. Sci Rep (2020) 10:17024. doi: 10.1038/s41598-020-73237-3
54. Ahn HK, Lee H, Kim SG, Hyun SH. Pre-Treatment. Clin Radiol (2019) 74:467–73. doi: 10.1016/j.crad.2019.02.008
55. Zhong J, Frood R, Brown P, Nelstrop H, Prestwich R, McDermott G, et al. Machine Learning-Based FDG PET-CT Radiomics for Outcome Prediction in Larynx and Hypopharynx Squamous Cell Carcinoma. Clin Radiol (2021) 76:78.e9–.e17. doi: 10.1016/j.crad.2020.08.030
Keywords: DLBCL, radiomics, [18F]FDG PET/CT, automated machine learning, tumor imaging
Citation: Ritter Z, Papp L, Zámbó K, Tóth Z, Dezső D, Veres DS, Máthé D, Budán F, Karádi É, Balikó A, Pajor L, Szomor Á, Schmidt E and Alizadeh H (2022) Two-Year Event-Free Survival Prediction in DLBCL Patients Based on In Vivo Radiomics and Clinical Parameters. Front. Oncol. 12:820136. doi: 10.3389/fonc.2022.820136
Received: 22 November 2021; Accepted: 18 May 2022;
Published: 08 June 2022.
Edited by:
Marta Sonia González Pérez, University Clinical Hospital of Santiago, SpainReviewed by:
Lijun Lu, Southern Medical University, ChinaCopyright © 2022 Ritter, Papp, Zámbó, Tóth, Dezső, Veres, Máthé, Budán, Karádi, Balikó, Pajor, Szomor, Schmidt and Alizadeh. This is an open-access article distributed under the terms of the Creative Commons Attribution License (CC BY). The use, distribution or reproduction in other forums is permitted, provided the original author(s) and the copyright owner(s) are credited and that the original publication in this journal is cited, in accordance with accepted academic practice. No use, distribution or reproduction is permitted which does not comply with these terms.
*Correspondence: Zsombor Ritter, cml0dGVyenNvbWJvckBnbWFpbC5jb20=
Disclaimer: All claims expressed in this article are solely those of the authors and do not necessarily represent those of their affiliated organizations, or those of the publisher, the editors and the reviewers. Any product that may be evaluated in this article or claim that may be made by its manufacturer is not guaranteed or endorsed by the publisher.
Research integrity at Frontiers
Learn more about the work of our research integrity team to safeguard the quality of each article we publish.