- 1Department of Medical Imaging, Yueyang Central Hospital, Yueyang, China
- 2Department of Radiology, The Third Xiangya Hospital, Central South University, Changsha, China
- 3Magnetic Resonance (MR) Research, General Electric (GE) Healthcare, Beijing, China
Objective: The aim of this study is to determine the potential of zero echo time (ZTE) MR lung imaging in the assessment of solid pulmonary nodules or masses and diagnostic consistency to CT in terms of morphologic characterization.
Methods: Our Institutional Review Board approved this prospective study. Seventy-one patients with solid pulmonary nodules or masses larger than 1 cm in diameter confirmed by chest CT were enrolled and underwent further lung ZTE-MRI scans within 7 days. ZTE-MRI and CT images were compared in terms of image quality and imaging features. Unidimensional diameter and three-dimensional volume measurements on both modalities were manually measured and compared using the Wilcoxon signed-rank test, intraclass correlation coefficient (ICC), Pearson’s correlation analysis, and Bland–Altman analysis. Multivariable logistic regression analysis was used to identify the factors associated with significant inter-modality variation of volume.
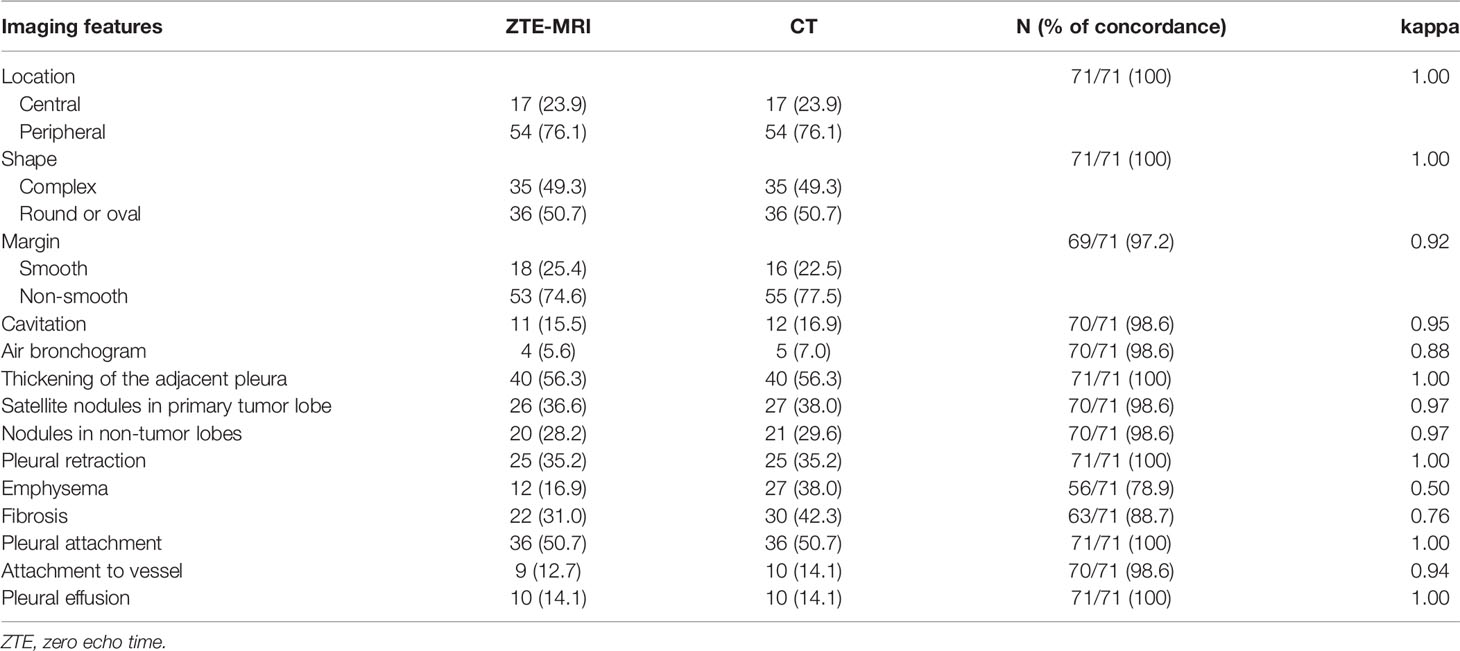
Results: Fifty-four of 71 (76.1%) patients were diagnosed with lung cancer. Subjective image quality was superior in CT compared with ZTE-MRI (p < 0.001). Inter-modality agreement for the imaging features was moderate for emphysema (kappa = 0.50), substantial for fibrosis (kappa = 0.76), and almost perfect (kappa = 0.88-1.00) for the remaining features. The size measurements including diameter and volume between ZTE-MRI and CT showed no significant difference (p = 0.36 for diameter and 0.60 for volume) and revealed perfect inter-observer (ICC = 0.975–0.980) and inter-modality (ICC = 0.942–0.992) agreements. Multivariable analysis showed that non-smooth margin [odds ratio (OR) = 6.008, p = 0.015] was an independent predictor for the significant inter-modality variation of volume.
Conclusion: ZTE lung imaging is feasible as a part of chest MRI in the assessment and surveillance for solid pulmonary nodules or masses larger than 1 cm, presenting perfect agreement with CT in terms of morphologic characterization.
Introduction
Pulmonary nodules or masses are commonly detected by chest CT in routine clinical practice. Most individuals with pulmonary nodules need regular imaging surveillance for subsequent treatment decisions (1). Likewise, patients with lung malignancies frequently undergo follow-up imaging examinations for the evaluation of treatment response and disease progression or recurrence (2). Chest CT is most generally used as a reference modality to monitor the dynamic change of pulmonary nodules or masses; however, repeated CT examinations increase radiation exposure to patients. MRI is desirably utilized for frequent imaging examinations with the characteristics of non-ionizing radiation and may benefit patients with lung diseases, especially for children and pregnant women. However, the intrinsic physical properties of the lung, e.g., short T2 and low proton density of lung parenchymal tissue, inhomogeneity of magnetic susceptibility at air and soft-tissue interface, and cardiopulmonary motion, hinder the widespread clinical application of lung MRI (3, 4). In addition, relatively long echo times (TEs) in conventional MRI sequences lead to difficulty in capturing rapidly decaying signals of lung tissue and small intrapulmonary structures with very short T2.
Zero echo time (ZTE) imaging is a newly introduced fast gradient echo-based MRI sequence with a minimum susceptibility effect that can overcome the abovementioned challenges (5–7). The features including a three-dimensional (3D) slab excitation and radial center-out acquisition complement the blank of lung MRI by the provision of high-resolution intrapulmonary structural information with a better signal-to-noise ratio (SNR) and contrast-to-noise ratio (CNR) (8, 9). With the capability of capturing the intrinsic signal of the lung parenchyma, it could be a promising lung imaging technique. A recent study reported that lung ZTE imaging can provide additional information in the detection and differentiation of lung lesions and enhance the utility of PET/MRI (10). Thus, this imaging scheme without ionizing radiation is expected to provide enough morphological information for patients with lung nodules who need dynamic surveillance or those with malignant tumors who require follow-up evaluation after treatment. In addition, ultrashort TE (UTE) sequence is another MRI technique that can image tissues with ultrashort T2/T2*, and several studies using UTE have been conducted for the assessment of pulmonary emphysema and various pulmonary parenchyma diseases (11–13). Ohno et al. reported that UTE could provide images that resemble CT with excellent performance in pulmonary nodule detection and evaluation of nodule types (11). Compared with UTE, ZTE shows higher sensitivity to short T2 and greater robustness against eddy currents without required trajectory calibration as well as a shorter scan time and lack of operational noise (14). However, the performance of lung ZTE-MRI in the assessment of pulmonary nodules or masses in comparison with conventional CT in routine practice is still not fully illustrated.
The aim of this study was to evaluate the potential of lung ZTE-MRI in the assessment of solid pulmonary nodules or masses and compare ZTE-MRI with CT in terms of morphologic characterization.
Materials and Methods
Patients
This prospective study was approved by our Institutional Review Board (No. YY2021-018) and was conducted in compliance with the Health Insurance Portability and Accountability Act. Written informed consent was obtained from all participants. Between February 2021 and June 2021, 112 adult patients with solid pulmonary nodules or masses larger than 1 cm in diameter detected on chest CT at our institution were enrolled. Patients who did not undergo lung ZTE-MRI scan within 7 days after CT (n = 24) were excluded, those without diagnosis data (n = 11), those without detected definite lesions on ZTE-MRI (n = 5), and those showing apparent differences in lung lesions between ZTE-MRI and CT due to acute inflammatory change (n = 1). After application of the exclusion criteria, 71 patients (52 men and 19 women; age range, 18–83 years; mean age, 61.3 ± 12.0 years) were finally enrolled in this study. The diagnosis of pulmonary lesions was confirmed by histopathology or imaging follow-up by typical imaging features.
Image Acquisition
Chest CT scanning was implemented using a 16-slice CT system (Lightspeed 16, GE Healthcare) at our institution. All examinations were scanned in a craniocaudal direction, with or without contrast medium. CT images were acquired with the following parameters: tube voltage, 120 kV; tube current, 100–440 mA; rotation time, 0.5 s; pitch, 1.375:1; collimation, 20 mm (16 × 1.25 mm); field of view, 350 × 350 mm; and standard soft-tissue algorithm reconstruction. The images were reconstructed at a section thickness of 2.5-mm increments. The radiation doses [median, interquartile range (IQR)] for volumetric CT dose index (CTDIvol) and dose-length product (DLP) were 9.5 mGy (7.5, 11.2 mGy) and 319.8 mGy · cm (249.4, 418.2 mGy · cm), respectively.
MRI examinations were performed without injection of a gadolinium agent using a commercial 3T scanner (Discovery MR750w, GE Healthcare) with a 36-channel body coil. All patients received respiratory-triggered ZTE lung imaging without fat suppression in a silent scan algorithm to accept end-expiratory images with the following parameters: field of view (isotropic), 320 × 320 mm; frequency, 256; slice thickness, 2.0 mm; number of slices, 120; number of motion-resolved datasets, 1; acquisition resolution, 2.0-mm isovoxel; receiver bandwidth, 41.67 kHz; flip angle, 2°; number of spokes per segment, 256; and scan time (mean, range), 187 s (177–194 s). In addition, single-shot echo-planar diffusion-weighted imaging (DWI) was performed for some patients (n = 57) during free-breathing with the following parameters: field of view, 360 × 360 mm; repetition time, 2,500 ms; echo time, 61.4 ms; slice thickness, 3.6 mm; spacing between slices, 3.6 mm; signal averages, 2; matrix 128 × 96; b values selected, 0, 100, and 800 s/mm2.
Qualitative Evaluation
All images were reviewed and analyzed in the Picture Archiving and Communication System (PACS) at our institution. Radiologists 1 and 2 (with 11 years and 18 years of experience in chest imaging, respectively) independently evaluated ZTE-MRI and CT images of all patients. There was a 2-week interval between the evaluation of ZTE-MRI and CT. A third senior radiologist with 25 years’ experience in chest imaging was consulted if there was a disagreement in results, and the senior reader’s decision was finally adopted. For the qualitative evaluation of image quality, the overall diagnostic acceptability of ZTE-MRI and CT was scored using a five-point scale according to the criteria used by Bae et al., respectively, based on the visualization of intrapulmonary vessels and bronchi, and sharpness of diaphragmatic contour as well as noise and artifacts (15).
For the evaluation of imaging features on ZTE-MRI and CT, the following data were recorded (16): 1) site of lesion, indicated as right upper lobe (RUL), right middle lobe (RML), right lower lobe (RLL), left upper lobe (LUL), or left lower lobe (LLL). If a patient had multiple lesions, then the largest one was selected for assessment; 2) location, indicated as central or peripheral; 3) shape, indicated as complex, round, or oval; 4) margin, indicated as smooth or non-smooth; 5) cavitation; 6) air bronchogram; 7) thickening of the adjacent pleura (including the pleural fissures); 8) satellite nodules in primary tumor lobe; 9) nodules in non-tumor lobes; 10) pleural retraction; 11) emphysema; 12) fibrosis; 13) pleural attachment; 14) attachment to vessel; and 15) pleural effusion.
Quantitative Evaluation
For the quantitative evaluation of image quality, signal intensities (SIs) of the lung parenchyma, pulmonary lesions, and normal structures on axial images of ZTE-MRI were measured. Radiologist 1 drew circular regions of interest (ROIs) in the lung parenchyma, pulmonary nodules or masses, tracheal lumen, tracheal wall, peripheral bronchus, peripheral pulmonary vessel, and aorta according to the previously described methods (15). All measurements were performed three times, and the mean values were recorded and used in this study. The size of the ROI was fitted to the diameter of the structure, and for the heterogeneous pulmonary lesions, only the solid components without cavitation were analyzed. The SNR was calculated as the mean SI of target structure/noise. The CNR of intrapulmonary structures was calculated as [mean SIstructure − mean SI lung]/noise. The noise was defined as the standard deviation (SD) of the SI in the tracheal lumen.
For the evaluation of unidimensional diameter and 3D volume of the pulmonary lesions on ZTE-MRI and CT, radiologist 1 measured the maximum diameter of the lesions on the axial images and manually delineated the lesion edges slice by slice using ITK-SNAP software (www.itksnap.org, v. 3.6.0), and the 3D volume of interest (VOI) reconstruction was performed to generate the lesion volume (17). There was also a 2-week interval between the evaluation of ZTE-MRI and CT. Radiologist 2 repeated the unidimensional and 3D measurements on ZTE-MRI and CT in randomly selected 50 patients following the above process.
Statistical Analysis
Continuous variables were expressed as mean ± SD or median with IQR, and categorical variables were expressed as number (percentage). Image quality scores between ZTE-MRI and CT were compared using the Wilcoxon signed-rank test. The inter-modality agreement of imaging features was determined by the percent of concordant cases and the kappa value. Intraclass correlation coefficient (ICC) was used to assess inter-modality and inter-observer agreement for the diameter and volume of the pulmonary lesions. The diameter or volume measurements between ZTE-MRI and CT were also compared using the Wilcoxon signed-rank test, Pearson’s correlation analysis, and Bland–Altman analysis. ICC or the kappa value was interpreted as follows: 0.20 or less, poor; 0.21–0.40, fair; 0.41–0.60, moderate; 0.61–0.80, substantial; and 0.81 or greater, almost perfect agreement. Univariable and multivariable logistic regression analyses with backward stepwise selection were performed to identify the potential factors associated with significant variation (> 10%) of volume between ZTE-MRI and CT. Statistical analyses were performed using IBM SPSS statistics software (version 25.0, SPSS Inc., Chicago, IL, USA). P-values less than 0.05 were considered statistically significant.
Results
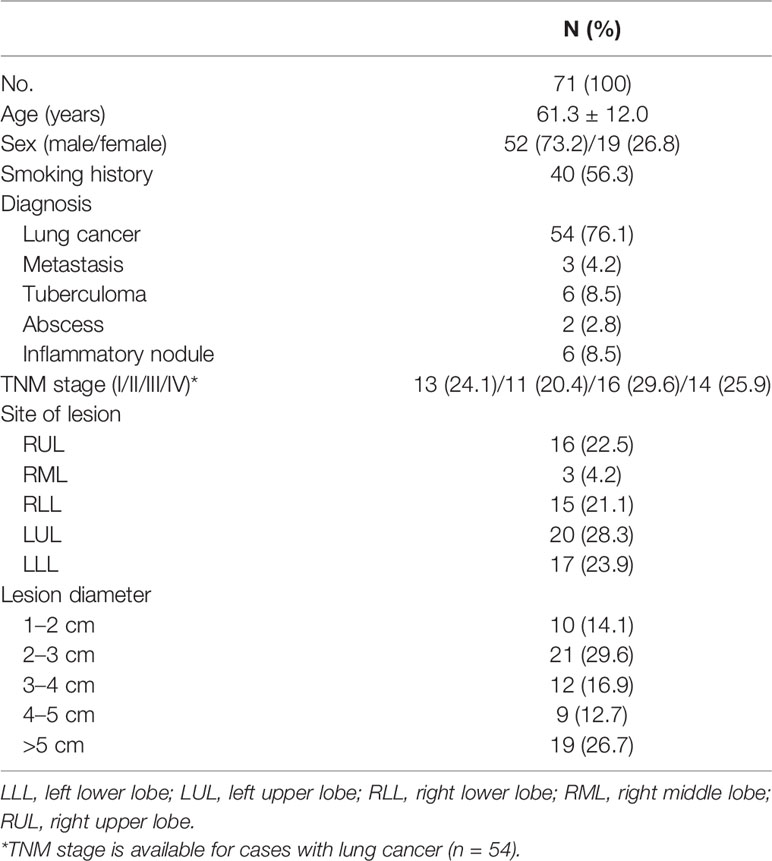
Patient characteristics of the study population are summarized in Table 1. The diagnosis of the pulmonary nodules (n = 31) or masses (n = 40) was as follows: lung cancer, 54; metastasis, 3; tuberculoma, 6; abscess, 2; and inflammatory nodule, 6. The site of the lesions was as follows: RUL, 16; RML, 3; RLL, 15; LUL, 20; and LLL, 17. All lung ZTE-MRI examinations were successfully performed without any adverse events.
Assessment of Image Quality
The subjective image quality score in terms of overall acceptability for intrapulmonary vessels and bronchi was lower in ZTE-MRI (4.54 ± 0.77 vs. 4.97 ± 0.17; p < 0.001) than in CT (Figure 1). The SNRs of the lung parenchyma, pulmonary nodules or masses, trachea, peripheral bronchus, peripheral pulmonary vessel, and aorta, and the CNRs of the pulmonary nodules or masses, peripheral bronchus, and peripheral pulmonary vessel are presented in Figures 2A, B.
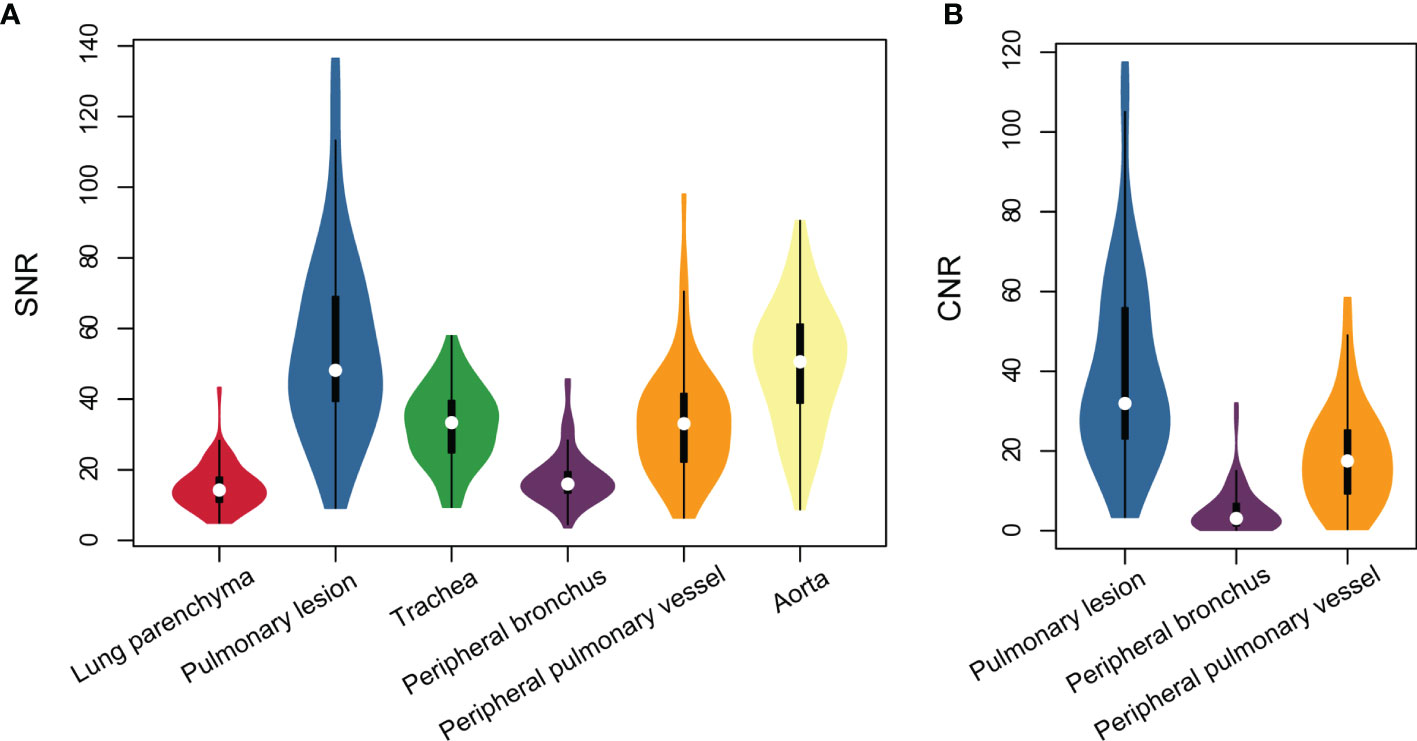
Figure 2 Violin plots represent SNR of all structures (A) and CNR of intrapulmonary structures (B) on lung ZTE-MRI.
Inter-Modality Agreement of Imaging Features
Inter-modality agreement between ZTE-MRI and CT for the imaging features was moderate for emphysema (kappa = 0.50), substantial for fibrosis (kappa = 0.76), and almost perfect (kappa = 0.88–1.00) for the remaining features, as shown in Table 2. The representative cases of CT and ZTE-MRI for characterization of the imaging features are provided in Figures 3A–L.
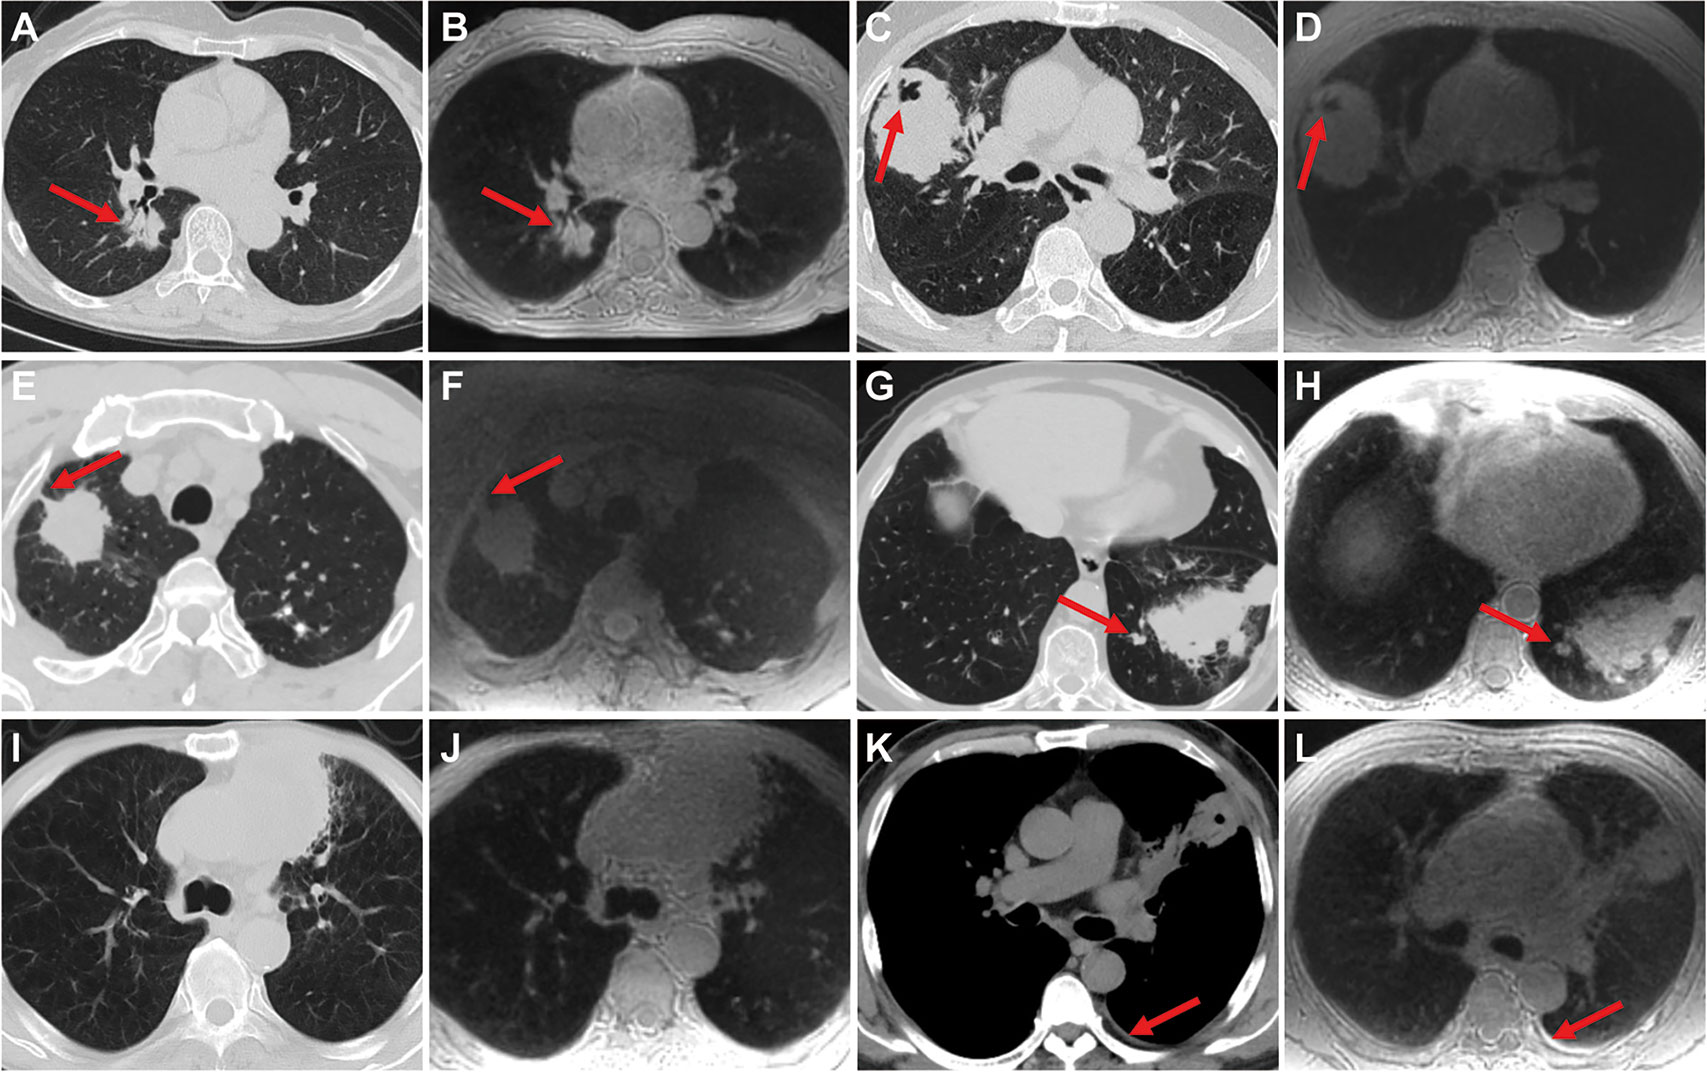
Figure 3 Representative images show the imaging features on CT and ZTE-MRI. Lung adenocarcinoma in the right lower lobe on CT (A) and ZTE-MRI (B), showing complex shape and air bronchogram sign; lung adenocarcinoma in the right middle lobe on CT (C) and ZTE-MRI (D), showing non-smooth margin and cavitation; lung adenocarcinoma in the right upper lobe on CT (E) and ZTE-MRI (F), showing pleural retraction; lung squamous carcinoma in the left lower lobe on CT (G) and ZTE-MRI (H), showing satellite nodules in the primary tumor lobe and pleural attachment; lung adenocarcinoma carcinoma in the left upper lobe on CT (I) and ZTE-MRI (J), showing emphysema; lung abscess in the left upper lobe on CT (K) and ZTE-MRI (L), showing pleural effusion in small amounts.
Inter-Modality and Inter-Observer Agreement of Size Measurements
Manual 3D segmentation of lung lesions was performed for all patients (Figures 4A–D). The 71 pulmonary nodules or masses had a median diameter of 3.2 cm (IQR: 2.3, 5.5 cm) on ZTE-MRI and 3.3 cm (IQR: 2.2, 5.4 cm) on CT, and the corresponding volume was 15.1 cm3 (IQR: 6.0, 55.4 cm3) on ZTE-MRI and 16.1 cm3 (IQR: 6.8, 56.1 cm3) on CT (Table 3). The average differences in the measured diameter or volume between ZTE-MRI and CT were small, and no significant difference was found (p = 0.36 for diameter and p = 0.60 for volume). The inter-modality ICC value was 0.992 [95% confidence interval (CI): 0.988, 0.995] for diameter and 0.942 (95% CI: 0.909, 0.961) for volume, respectively. Scatter plots (Figures 5A, B) demonstrate the strong correlations between ZTE-MRI and CT for diameter (rho = 0.992, p < 0.001) and volume (rho = 0.956, p < 0.001) measurements. Bland–Altman plots (Figures 5C, D) show the inter-modality agreements between ZTE-MRI and CT, with the means and limits of agreement (LoA) being −0.03 cm (−0.50, 0.43) for diameter and 1.7 cm3 (−37.8, 41.3) for volume.
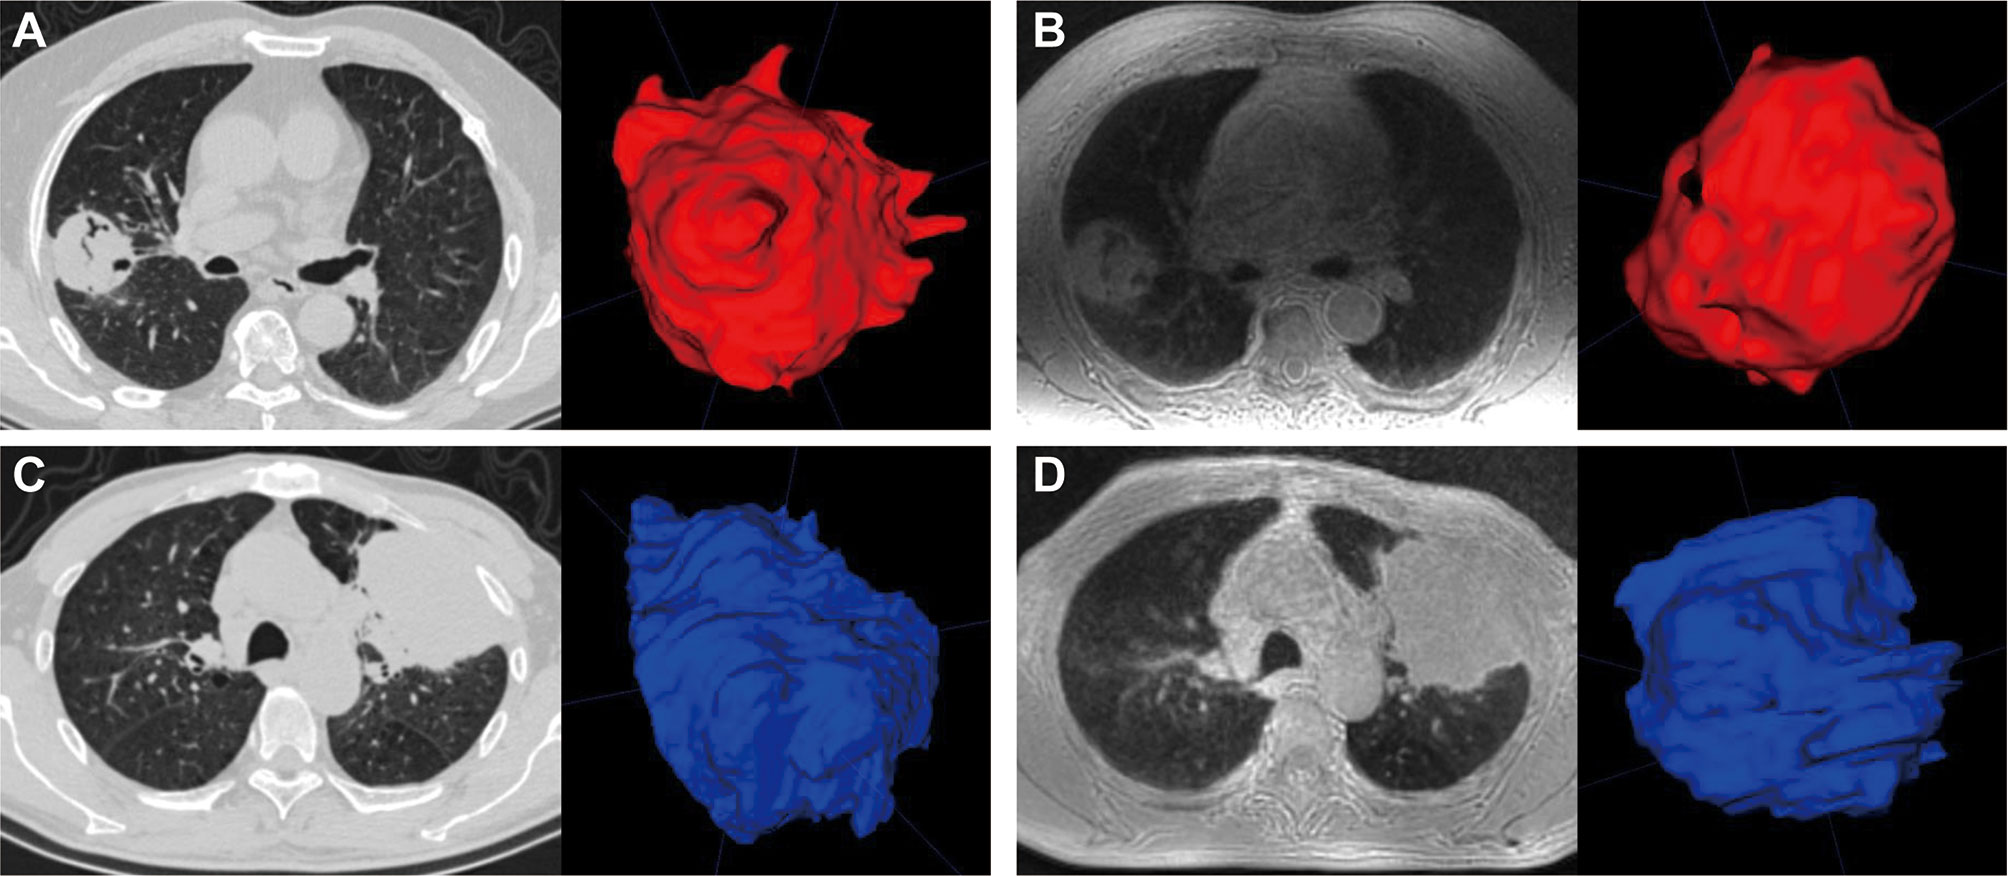
Figure 4 Manual segmentation of pulmonary lesions (red or blue) using volume rendering. CT (A) and ZTE-MRI (B) in the axial view showed that the measured volumes of a lung tumor in the right upper lobe were 40.7 and 46.6 mm3, respectively; CT (C) and ZTE-MRI (D) in the axial view show that the measured volumes of another lung tumor in the left upper lobe were 138.8 and 145.8 mm3, respectively.
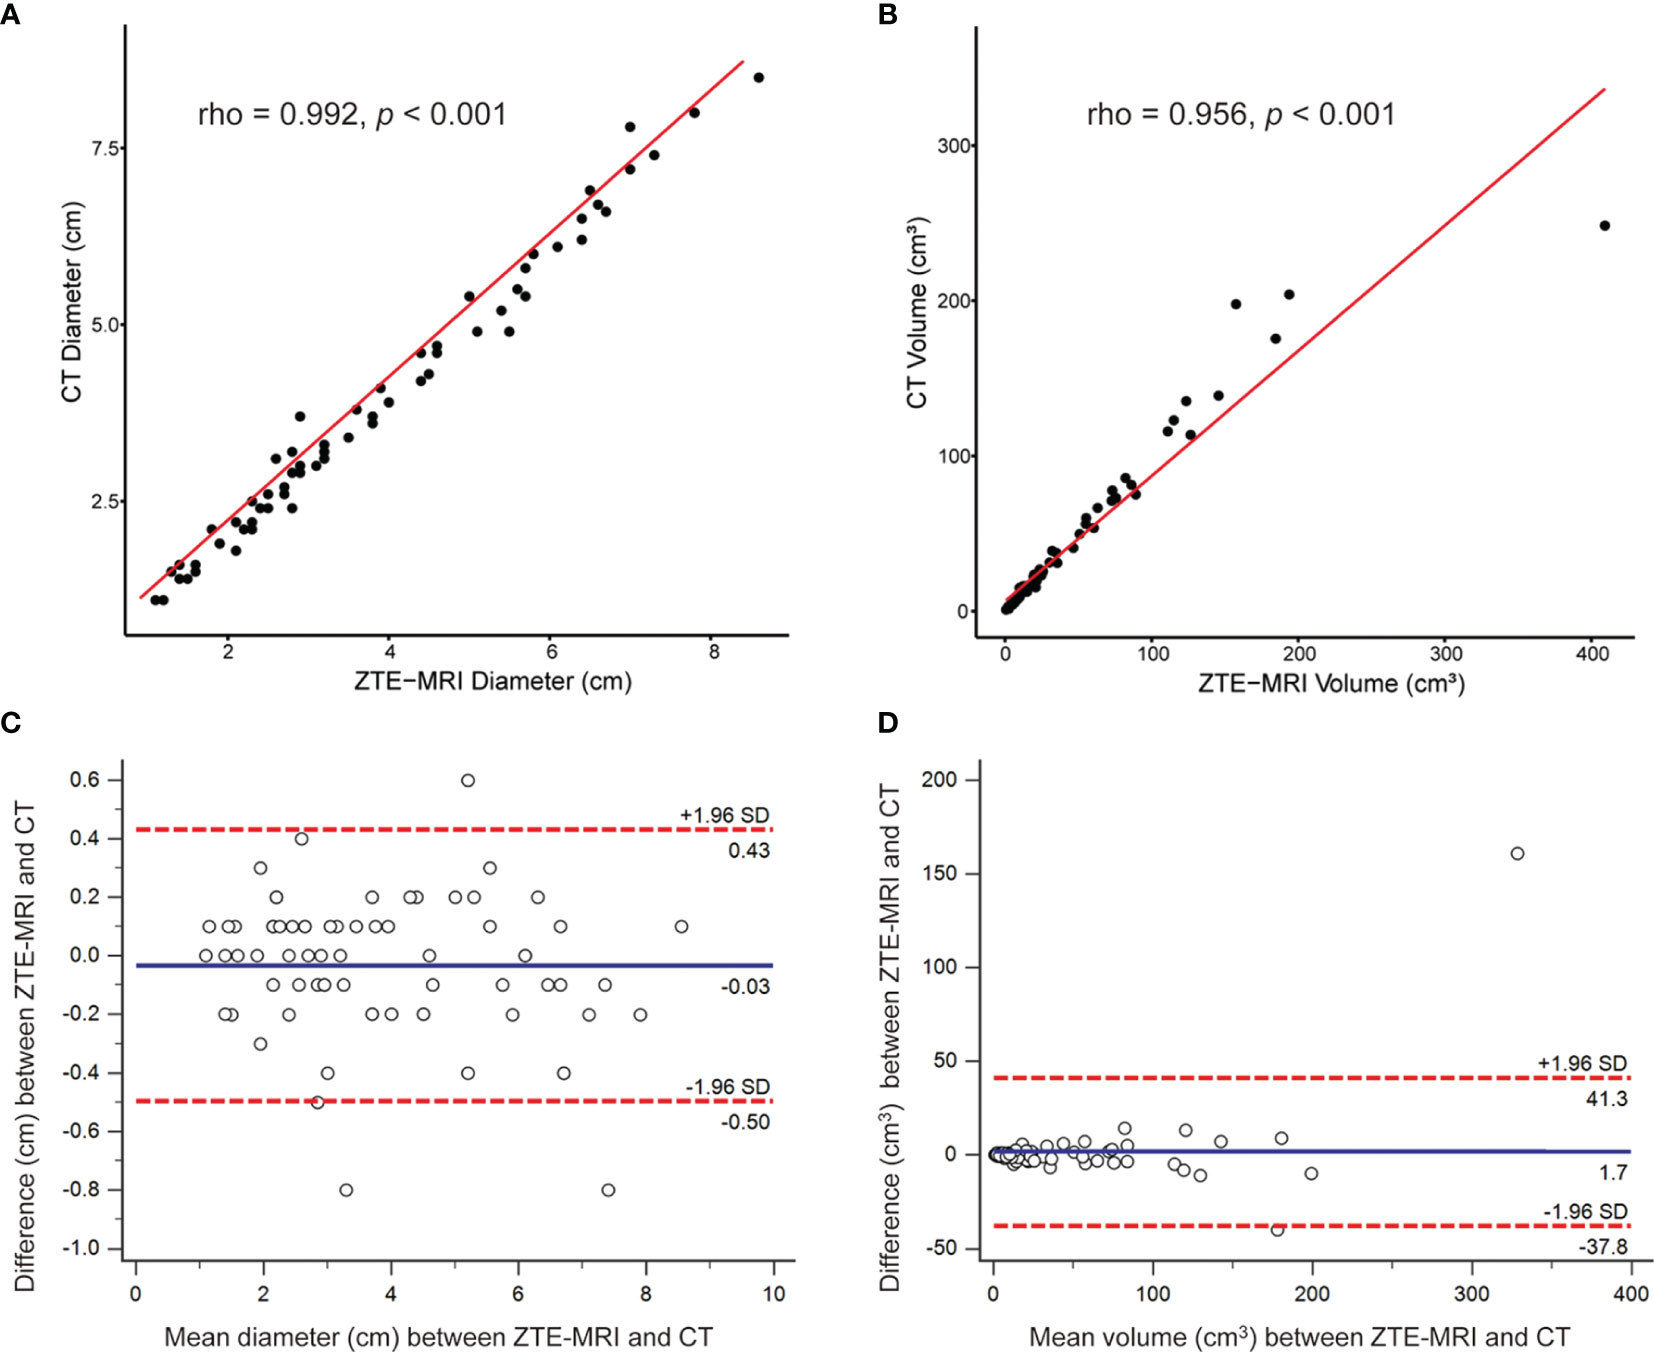
Figure 5 Inter-modality correlation and agreement for lesion measurements. Scatter plots demonstrat the correlations between ZTE-MRI and CT for diameter (A) and volume (B). Bland–Altman plots show the inter-modality agreement between ZTE-MRI and CT for diameter (C) and volume (D).
The results of inter-observer agreement of lesion measurements for ZTE-MRI and CT are presented in Table 4 and demonstrated in the Bland–Altman plots (Figures 6A–D), which shows that the mean and LoA were 0.07 cm (−0.82, 0.97) on ZTE-MRI and 0.05 cm (−0.79, 0.90) on CT for diameter and −0.6 cm3 (−21.1, 19.9) on ZTE-MRI and −1.3 cm3 (−26.3, 23.7) on CT for volume. Diameter and volume measurements of different raters, on both ZTE-MRI and CT, were significantly inter-correlated (ICC = 0.975-0.980).
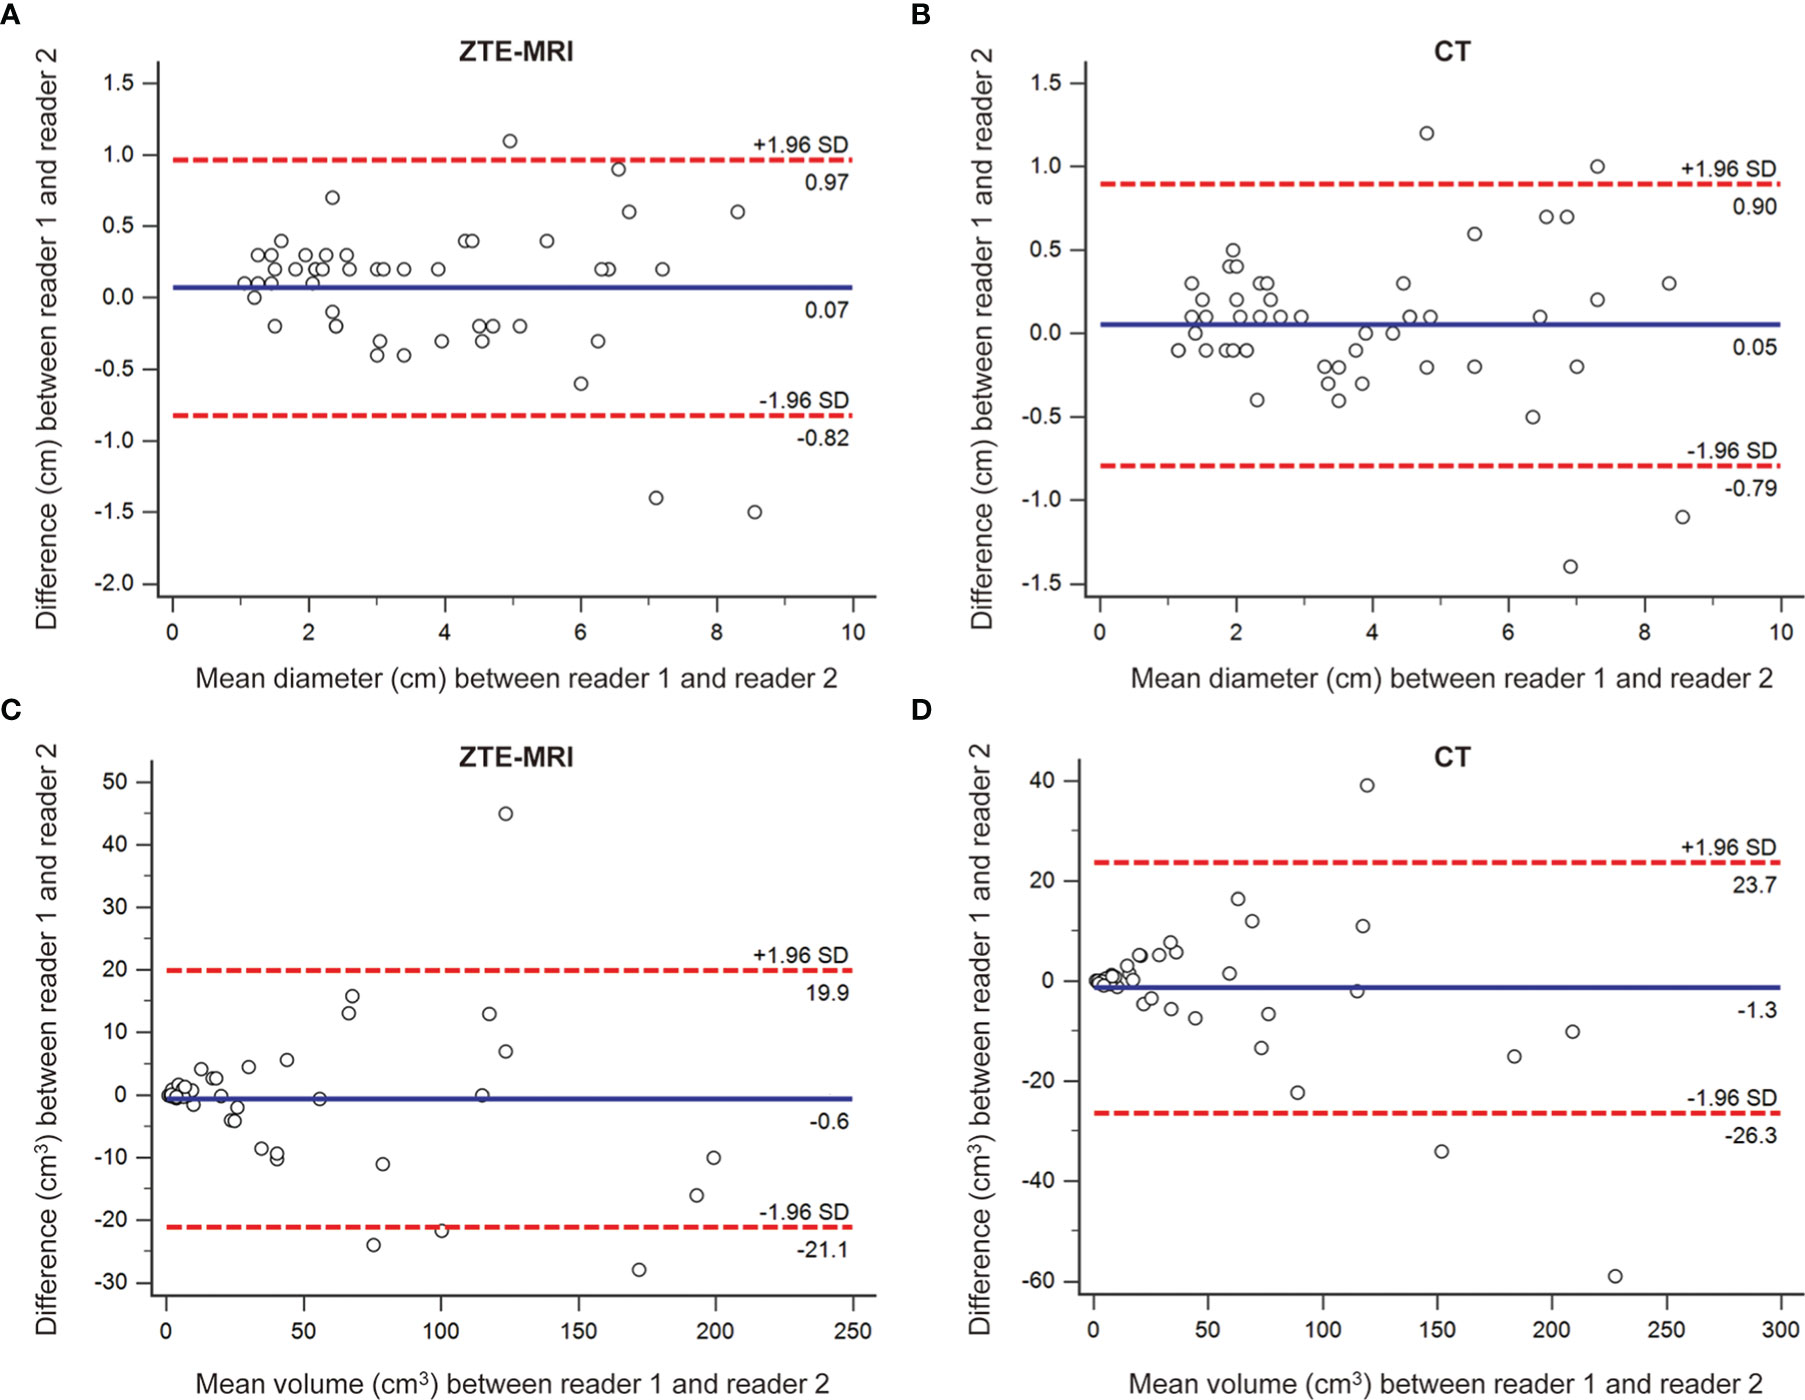
Figure 6 Inter-observer agreement for lesion measurements on ZTE-MRI and CT. Bland–Altman plots show the agreements of diameter on ZTE-MRI (A) and CT (B), and the agreements of volume on ZTE-MRI (C) and CT (D).
Factors Associated With Significant Inter-Modality Variation of Volume
To further explore the potential factors associated with the significant inter-modality variation of volume, univariable and multivariable logistic regression analyses were performed (Table 5). The results showed that non-smooth margin [odds ratio (OR) 6.008, 95% CI 1.419, 25.444; p = 0.015], emphysema (OR 0.198, 95% CI 0.059, 0.664; p = 0.009), and pleural attachment (OR 0.219, 95% CI 0.072, 0.662; p = 0.007) were independent predictors for the significant inter-modality variation of volume. Figures 7A–H show two representative cases without or with significant inter-modality variation of volume.
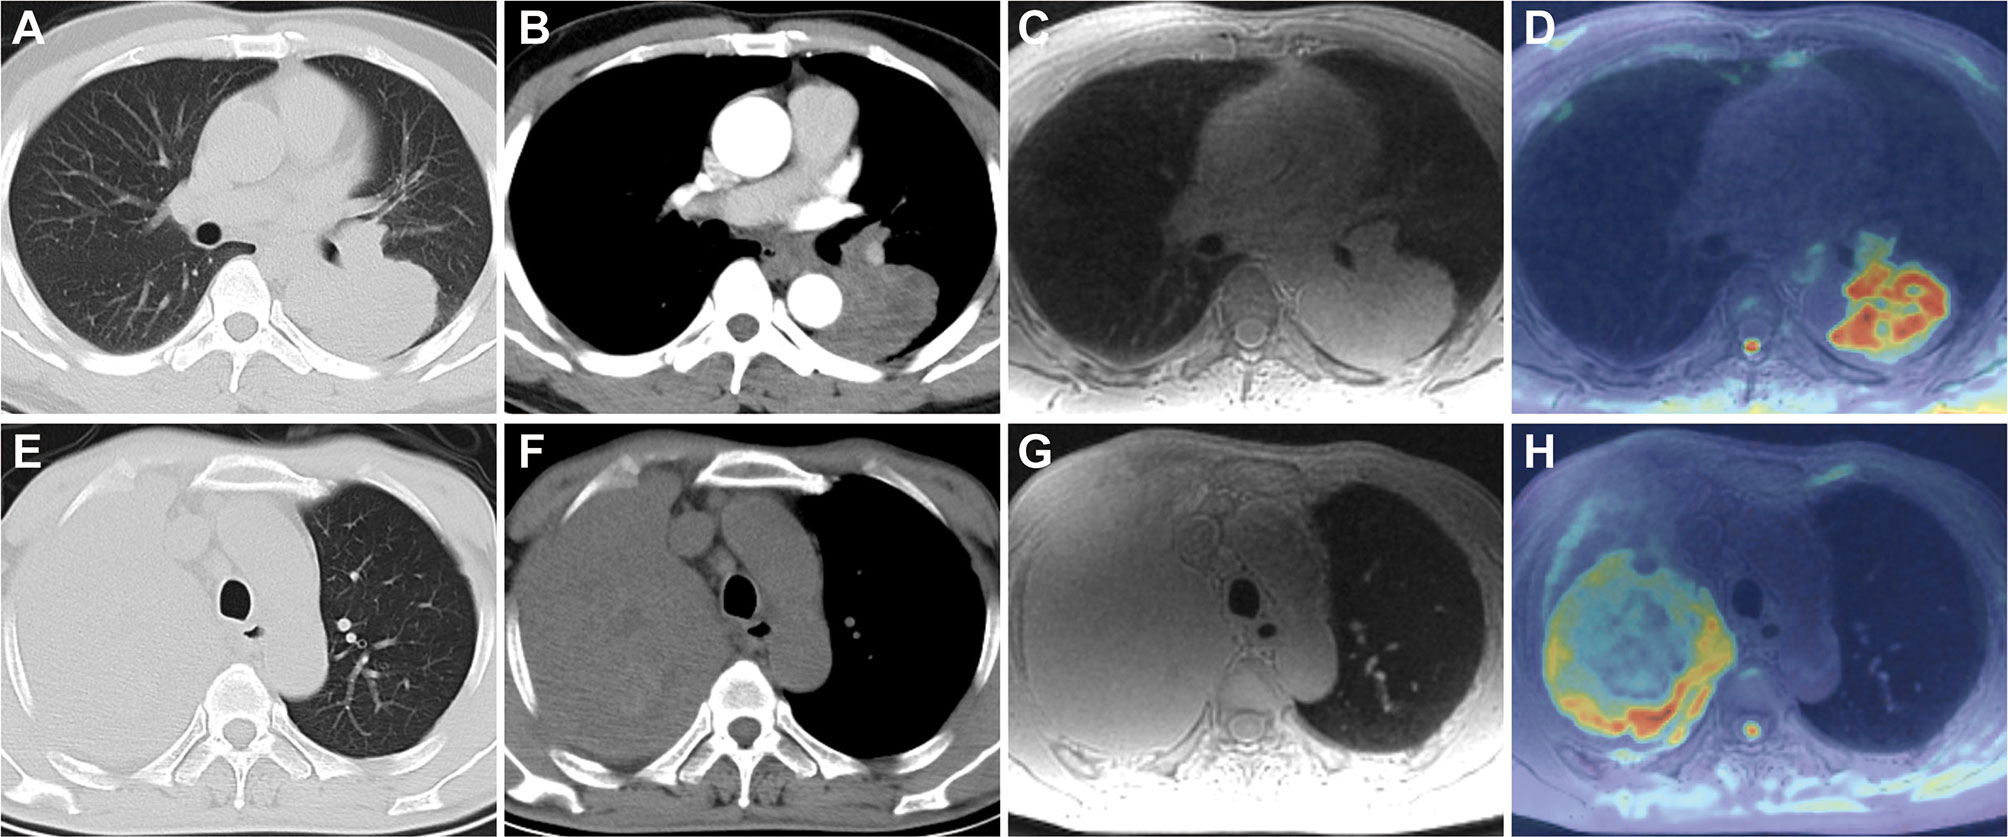
Figure 7 Lung CT and MRI images of two patients without or with significant inter-modality variation of volume. A 48-year-old man with lung adenocarcinoma in the left lower lobe on axial CT lung window (A), mediastinal window (B), and ZTE-MRI (C); ADC map (D) showed the consistent lesion extent with ZTE-MRI and CT; a 59-year-old man with lung adenocarcinoma in the right upper lobe on axial CT lung window (E), mediastinal window (F), and ZTE-MRI (G); ADC map (H) shows the actual lesion extent which was inconsistent with ZTE-MRI; it is confusing to distinguish the boundary between the non-smooth lesion and surrounding lung tissue with obstructive atelectasis on ZTE-MRI.
Discussion
In this study, we assessed the performance of lung ZTE-MRI by prospectively head-to-head comparison with CT in the assessment of solid pulmonary nodules or masses (over half of the cohort), including image quality, imaging features, and size measurements. The results showed that the image quality of ZTE-MRI was slightly inferior to CT, but the overall display of intrapulmonary structures and lesions on ZTE-MRI in clinical practice was acceptable. The imaging features on ZTE-MRI showed good consistency with CT except for emphysema and fibrosis, especially for the relationship between pulmonary lesions and pleura. Furthermore, ZTE-MRI revealed perfect inter-modality agreement with CT and inter-observer agreement for the diameter and volume measurements.
ZTE imaging is a 3D slab excitated gradient echo-based sequence and radial center-out filling technique. It has certain restrictions concerning image geometry and scan time but offers flexibly multiple views and permits post-processed averaging through slices of arbitrary orientation and thickness, which improves SNR after selecting the anatomy of interest while maintaining full in-plane resolution (18, 19). Our results indicated that CT was superior to ZTE-MRI in subjective evaluation of image quality such as the more clear depiction of normal structures. Considering that MRI has a lower spatial resolution than CT and is sensitive to magnetic susceptibility, lung MRI is still challenging regarding the delineation of fine intrapulmonary structures, but the overall display of pulmonary nodules was acceptable for the purpose of clinical use. Measured SNR and CNR of intrapulmonary structures on ZTE-MRI images were also in line with a previous report (15). Despite that the ZTE-MRI images were acquired in a quiet and free-breath mode using respiratory triggering, long-time scanning may induce respiratory motion artifacts in some patients, especially for those with severe emphysema or poor lung function (20, 21). ZTE-MRI image collection was performed within a limited time window around end-expiration because patients’ breathing pattern is most consistent and the breathing time is longer in this phase (22). Despite the use of gating, image blurring occurred routinely, especially near the apex pulmonis and diaphragm. In future research, retrospective soft gating techniques would be tried to improve the image quality of ZTE-MRI.
Imaging features on ZTE-MRI showed good consistency with CT except for emphysema and fibrosis. However, some previous reports showed that ZTE-MRI or UTE-MRI were useful to accurately and reliably detect the pathomorphological alterations and quantify the volumetric extent of emphysematous lungs (12, 20, 23). Further studies with quantitative analysis are needed to clarify this controversy. Notably, the nodule-pleura interface margin can be depicted by ZTE-MRI. An earlier study has also shown that MRI offers superior contrast between pleura and adjacent tissues compared with CT (24). Hence, head-to-head comparison in our study suggested that ZTE-MRI may be served as an important approach for the assessment of pleural invasion of pulmonary nodules or masses. The clinical utility of ZTE-MRI for the detection of pleural invasion in patients with lung malignancies, particularly the Pancoast–Tobias tumors, deserves to be verified (25).
Size evaluation of pulmonary nodules or masses is crucial for pathological characterization and therapy monitoring. The evaluation of lesion size varying with time during the follow-up period is the cornerstone for tumor treatment response in the conventional Response Evaluation Criteria in Solid Tumors (RECIST) (26, 27). In our study, ZTE-MRI showed perfect inter-modality agreement with CT and inter-observed agreement for the diameter and volume measurements. A previous UTE-MRI study showed systematically underestimated diameter measurements of pulmonary nodules by approximately 1–2 mm compared with CT, which was in line with our results and possibly explained by smooth structure margins on MRI and blurry lesion margins due to free-breathing image acquisition condition (12). Although diameter measure has been commonly used in clinical practice in the symbol of growth or dynamic change of lesions, volume measure is increasingly recommended in the provision of supplementary information for assessing treatment response and predicting survival in lung cancer patients, particularly those with large, irregular lesions (28, 29). Previous studies indicated that there was very good concordance of lung nodule volumes between CT and UTE-MRI, in both phantom and human settings (30). Tsim et al. reported that MRI volumetry gained superiority over CT for malignant pleural mesothelioma in terms of the association with patient survival (24). Thus, high-resolution ZTE-MRI should be useful for the size evaluation including diameter and volume of pulmonary nodules or masses, which has the potential to obviate frequent chest CT scans, especially in patients who are vulnerable to radiation exposure. Besides, non-smooth margin was found to be an independent predictor for the significant inter-modality variation of volume, which may be caused by the distinct delineation of the peripheral part of the irregular lesions and the adjacent lung tissue on the two imaging modalities (31). In our cohort, there was an eccentric case with non-smooth margin tumor that showed significantly larger volume on ZTE-MRI compared with CT (shown in Figures 7C, D), resulting in the outlier in the inter-modality agreement of volume measurement.
This study had several limitations. First, a relatively small sample size was used in our study. Second, only patients with solid pulmonary nodules or masses larger than 1 cm were enrolled. Our study was primarily designed to evaluate the potential of ZTE-MRI lung imaging in comparison with CT for lesion morphologic characterization, instead of detection rate. To further validate the performance of ZTE-MRI in the assessment of sub-solid or ground glass opacification nodules and smaller nodules, future research with larger sample size, specific populations (such as pregnant women), and multiple lesion types are needed. Third, CT images obtained with breath-holding in deep inspiration whereas ZTE-MRI images acquired with respiratory gating under free-breathing on a different date brought possible discrepancies between CT and ZTE-MRI. Finally, readers analyzed the lung ZTE-MRI images and reference standard CT images, which could introduce bias in the evaluation of the image quality, imaging features, and size measurements. To minimize this bias, readers conducted the analyses of ZTE-MRI images at a 2-week interval from the analyses of CT images.
Conclusion
ZTE lung imaging was feasible as a part of chest MRI without contrast agent in the assessment and surveillance of solid pulmonary nodules or masses larger than 1 cm, presenting perfect agreement with CT in terms of morphologic characterization.
Data Availability Statement
The raw data supporting the conclusions of this article will be made available by the authors, without undue reservation.
Author Contributions
QL, ZF, and WZ were involved in the design of the work, analysis of data, and approval of the final version to be published. QL, ZF, and WL contributed to the statistical analysis of the data and drafting the manuscript. WF, LH, XC, and ZM contributed to the acquisition and analysis of data. All authors contributed to the article and approved the submitted version.
Funding
This study was supported by the Innovation Guidance Project of Clinical Medical Technology in Hunan Province, China (2020SK52704, QL) and the Natural Science Foundation of Hunan Province, China (2021JJ30695, WZ).
Conflict of Interest
The authors of this manuscript declare a relationship with GE Healthcare. WL is a senior scientist in GE Healthcare (Beijing, China) and assisted the ZTE sequence setting and necessary training for this study. She has no intention to apply for a patent based on this paper or invent any product and did not provide any financial support.
The remaining authors declare that the research was conducted in the absence of any commercial or financial relationships that could be construed as a potential conflict of interest.
Publisher’s Note
All claims expressed in this article are solely those of the authors and do not necessarily represent those of their affiliated organizations, or those of the publisher, the editors and the reviewers. Any product that may be evaluated in this article, or claim that may be made by its manufacturer, is not guaranteed or endorsed by the publisher.
References
1. Bueno J, Landeras L, Chung JH. Updated Fleischner Society Guidelines for Managing Incidental Pulmonary Nodules: Common Questions and Challenging Scenarios. Radiographics (2018) 38(5):1337–50. doi: 10.1148/rg.2018180017
2. Schwartz LH, Litiere S, de Vries E, Ford R, Gwyther S, Mandrekar S, et al. RECIST 1.1-Update and Clarification: From the RECIST Committee. Eur J Cancer (2016) 62:132–7. doi: 10.1016/j.ejca.2016.03.081
3. Hatabu H, Ohno Y, Gefter WB, Parraga G, Madore B, Lee KS, et al. Expanding Applications of Pulmonary MRI in the Clinical Evaluation of Lung Disorders: Fleischner Society Position Paper. Radiology (2020) 297(2):286–301. doi: 10.1148/radiol.2020201138
4. Romei C, Turturici L, Tavanti L, Miedema J, Fiorini S, Marletta M, et al. The Use of Chest Magnetic Resonance Imaging in Interstitial Lung Disease: A Systematic Review. Eur Respir Rev (2018) 27(150):180062. doi: 10.1183/16000617.0062-2018
5. Gibiino F, Sacolick L, Menini A, Landini L, Wiesinger F. Free-Breathing, Zero-TE MR Lung Imaging. Magma (2015) 28(3):207–15. doi: 10.1007/s10334-014-0459-y
6. Breighner RE, Endo Y, Konin GP, Gulotta LV, Koff MF, Potter HG. Technical Developments: Zero Echo Time Imaging of the Shoulder: Enhanced Osseous Detail by Using MR Imaging. Radiology (2018) 286(3):960–6. doi: 10.1148/radiol.2017170906
7. Weiger M, Pruessmann KP. Short-T(2) MRI: Principles and Recent Advances. Prog Nucl Magn Reson Spectrosc (2019) 114-115:237–70. doi: 10.1016/j.pnmrs.2019.07.001
8. Bae K, Jeon KN, Hwang MJ, Lee JS, Ha JY, Ryu KH, et al. Comparison of Lung Imaging Using Three-Dimensional Ultrashort Echo Time and Zero Echo Time Sequences: Preliminary Study. Eur Radiol (2019) 29(5):2253–62. doi: 10.1007/s00330-018-5889-x
9. Weiger M, Wu M, Wurnig MC, Kenkel D, Boss A, Andreisek G, et al. ZTE Imaging With Long-T2 Suppression. NMR BioMed (2015) 28(2):247–54. doi: 10.1002/nbm.3246
10. Zeng F, Nogami M, Ueno YR, Kanda T, Sofue K, Kubo K, et al. Diagnostic Performance of Zero-TE Lung MR Imaging in FDG PET/MRI for Pulmonary Malignancies. Eur Radiol (2020) 30(9):4995–5003. doi: 10.1007/s00330-020-06848-z
11. Ohno Y, Koyama H, Yoshikawa T, Kishida Y, Seki S, Takenaka D, et al. Standard-, Reduced-, and No-Dose Thin-Section Radiologic Examinations: Comparison of Capability for Nodule Detection and Nodule Type Assessment in Patients Suspected of Having Pulmonary Nodules. Radiology (2017) 284(2):562–73. doi: 10.1148/radiol.2017161037
12. Wielpütz MO, Lee HY, Koyama H, Yoshikawa T, Seki S, Kishida Y, et al. Morphologic Characterization of Pulmonary Nodules With Ultrashort TE MRI at 3T. AJR Am J Roentgenol (2018) 210(6):1216–25. doi: 10.2214/AJR.17.18961
13. Ohno Y, Koyama H, Yoshikawa T, Seki S, Takenaka D, Yui M, et al. Pulmonary High-Resolution Ultrashort TE MR Imaging: Comparison With Thin-Section Standard- and Low-Dose Computed Tomography for the Assessment of Pulmonary Parenchyma Diseases. J Magn Reson Imaging (2016) 43(2):512–32. doi: 10.1002/jmri.25008
14. Li Y, Xiong Y, Hou B, Liu C, Wang J, Liu WV, et al. Comparison of Zero Echo Time MRI With T1-Weighted Fast Spin Echo for the Recognition of Sacroiliac Joint Structural Lesions Using CT as the Reference Standard. Eur Radiol (2022). doi: 10.1007/s00330-021-08513-5
15. Bae K, Jeon KN, Hwang MJ, Lee JS, Park SE, Kim HC, et al. Respiratory Motion-Resolved Four-Dimensional Zero Echo Time (4D ZTE) Lung MRI Using Retrospective Soft Gating: Feasibility and Image Quality Compared With 3D ZTE. Eur Radiol (2020) 30(9):5130–8. doi: 10.1007/s00330-020-06890-x
16. Rizzo S, Petrella F, Buscarino V, De Maria F, Raimondi S, Barberis M, et al. CT Radiogenomic Characterization of EGFR, K-RAS, and ALK Mutations in Non-Small Cell Lung Cancer. Eur Radiol (2016) 26(1):32–42. doi: 10.1007/s00330-015-3814-0
17. Yushkevich PA, Piven J, Hazlett HC, Smith RG, Ho S, Gee JC, et al. User-Guided 3D Active Contour Segmentation of Anatomical Structures: Significantly Improved Efficiency and Reliability. Neuroimage (2006) 31(3):1116–28. doi: 10.1016/j.neuroimage.2006.01.015
18. Weiger M, Brunner DO, Dietrich BE, Muller CF, Pruessmann KP. ZTE Imaging in Humans. Magn Reson Med (2013) 70(2):328–32. doi: 10.1002/mrm.24816
19. Zhang C, Dou W, Yu K, Ji Y, Wang W, Sami MU, et al. The Feasibility of Non-Contrast-Enhanced Zero Echo Time Magnetic Resonance Angiography for Characterization of Intracranial Atherosclerotic Disease. Quant Imaging Med Surg (2021) 11(6):2442–52. doi: 10.21037/qims-20-696
20. Bianchi A, Tibiletti M, Kjørstad Å, Birk G, Schad LR, Stierstorfer B, et al. Three-Dimensional Accurate Detection of Lung Emphysema in Rats Using Ultra-Short and Zero Echo Time MRI. NMR BioMed (2015) 28(11):1471–9. doi: 10.1002/nbm.3417
21. Ma W, Sheikh K, Svenningsen S, Pike D, Guo F, Etemad-Rezai R, et al. Ultra-Short Echo-Time Pulmonary MRI: Evaluation and Reproducibility in COPD Subjects With and Without Bronchiectasis. J Magn Reson Imaging (2015) 41(5):1465–74. doi: 10.1002/jmri.24680
22. Liu C, Alessio A, Pierce L, Thielemans K, Wollenweber S, Ganin A, et al. Quiescent Period Respiratory Gating for PET/Ct. Med Phys (2010) 37(9):5037–43. doi: 10.1118/1.3480508
23. Benlala I, Berger P, Girodet PO, Dromer C, Macey J, Laurent F, et al. Automated Volumetric Quantification of Emphysema Severity by Using Ultrashort Echo Time MRI: Validation in Participants With Chronic Obstructive Pulmonary Disease. Radiology (2019) 292(1):216–25. doi: 10.1148/radiol.2019190052
24. Tsim S, Cowell GW, Kidd A, Woodward R, Alexander L, Kelly C, et al. A Comparison Between MRI and CT in the Assessment of Primary Tumour Volume in Mesothelioma. Lung Cancer (2020) 150:12–20. doi: 10.1016/j.lungcan.2020.09.025
25. Zhang Y, Kwon W, Lee HY, Ko SM, Kim SH, Lee WY, et al. Imaging Assessment of Visceral Pleural Surface Invasion by Lung Cancer: Comparison of CT and Contrast-Enhanced Radial T1-Weighted Gradient Echo 3-Tesla MRI. Korean J Radiol (2021) 22(5):829–39. doi: 10.3348/kjr.2020.0955
26. Gerwing M, Herrmann K, Helfen A, Schliemann C, Berdel WE, Eisenblatter M, et al. The Beginning of the End for Conventional RECIST - Novel Therapies Require Novel Imaging Approaches. Nat Rev Clin Oncol (2019) 16(7):442–58. doi: 10.1038/s41571-019-0169-5
27. Calandri M, Solitro F, Angelino V, Moretti F, Veltri A. The Role of Radiology in the Evaluation of the Immunotherapy Efficacy. J Thorac Dis (2018) 10(Suppl 13):S1438–46. doi: 10.21037/jtd.2018.05.130
28. Greenberg V, Lazarev I, Frank Y, Dudnik J, Ariad S, Shelef I. Semi-Automatic Volumetric Measurement of Response to Chemotherapy in Lung Cancer Patients: How Wrong Are We Using RECIST? Lung Cancer (2017) 108:90–5. doi: 10.1016/j.lungcan.2017.02.017
29. Owen B, Gandara D, Kelly K, Moore E, Shelton D, Knollmann F. CT Volumetry and Basic Texture Analysis as Surrogate Markers in Advanced Non-Small-Cell Lung Cancer. Clin Lung Cancer (2020) 21(3):225–31. doi: 10.1016/j.cllc.2019.08.004
30. Delacoste J, Dunet V, Dournes G, Lovis A, Rohner C, Elandoy C, et al. MR Volumetry of Lung Nodules: A Pilot Study. Front Med (Lausanne) (2019) 6:18. doi: 10.3389/fmed.2019.00018
Keywords: magnetic resonance imaging, zero echo time sequence, pulmonary nodule, comparison, computed tomography
Citation: Liu Q, Feng Z, Liu WV, Fu W, He L, Cheng X, Mao Z and Zhou W (2022) Assessment of Solid Pulmonary Nodules or Masses Using Zero Echo Time MR Lung Imaging: A Prospective Head-to-Head Comparison With CT. Front. Oncol. 12:812014. doi: 10.3389/fonc.2022.812014
Received: 17 November 2021; Accepted: 24 March 2022;
Published: 26 April 2022.
Edited by:
Takahito Nakajima, University of Tsukuba, JapanReviewed by:
Sikandar Shaikh, Shadan Hospital and Institute of Medical Sciences, IndiaBeigelman Catherine, Centre Hospitalier Universitaire Vaudois (CHUV), Switzerland
Gael Dournes, Centre Hospitalier Universitaire de Bordeaux, France
Copyright © 2022 Liu, Feng, Liu, Fu, He, Cheng, Mao and Zhou. This is an open-access article distributed under the terms of the Creative Commons Attribution License (CC BY). The use, distribution or reproduction in other forums is permitted, provided the original author(s) and the copyright owner(s) are credited and that the original publication in this journal is cited, in accordance with accepted academic practice. No use, distribution or reproduction is permitted which does not comply with these terms.
*Correspondence: Wenming Zhou, eHkzMTkyOUAxNjMuY29t
†These authors have contributed equally to this work
 Qianyun Liu1†
 Zhichao Feng
 Weiyin Vivian Liu
 Lei He
 Wenming Zhou