
94% of researchers rate our articles as excellent or good
Learn more about the work of our research integrity team to safeguard the quality of each article we publish.
Find out more
ORIGINAL RESEARCH article
Front. Oncol., 31 January 2022
Sec. Cancer Imaging and Image-directed Interventions
Volume 12 - 2022 | https://doi.org/10.3389/fonc.2022.811197
This article is part of the Research TopicDifferentiating Brain Cancers and Glioblastoma through Imaging MethodologiesView all 5 articles
 Yu Han1†Zi-Jun Wang2†Wen-Hua Li3†
 Yang Yang1Jian Zhang4
 Xi-Biao Yang5Lin Zuo1Gang Xiao1Sheng-Zhong Wang1Lin-Feng Yan1*
 Guang-Bin Cui1*
Objectives: To investigate the value of morphological feature and signal intensity ratio (SIR) derived from conventional magnetic resonance imaging (MRI) in distinguishing primary central nervous system lymphoma (PCNSL) from atypical glioblastoma (aGBM).
Methods: Pathology-confirmed PCNSLs (n = 93) or aGBMs (n = 48) from three institutions were retrospectively enrolled and divided into training cohort (n = 98) and test cohort (n = 43). Morphological features and SIRs were compared between PCNSL and aGBM. Using linear discriminant analysis, multiple models were constructed with SIRs and morphological features alone or jointly, and the diagnostic performances were evaluated via receiver operating characteristic (ROC) analysis. Areas under the curves (AUCs) and accuracies (ACCs) of the models were compared with the radiologists’ assessment.
Results: Incision sign, T2 pseudonecrosis sign, reef sign and peritumoral leukomalacia sign were associated with PCNSL (training and overall cohorts, P < 0.05). Increased T1 ratio, decreased T2 ratio and T2/T1 ratio were predictive of PCNSL (all P < 0.05). ROC analysis showed that combination of morphological features and SIRs achieved the best diagnostic performance for differentiation of PCNSL and aGBM with AUC/ACC of 0.899/0.929 for the training cohort, AUC/ACC of 0.794/0.837 for the test cohort and AUC/ACC of 0.869/0.901 for the overall cohort, respectively. Based on the overall cohort, two radiologists could distinguish PCNSL from aGBM with AUC/ACC of 0.732/0.724 for radiologist A and AUC/ACC of 0.811/0.829 for radiologist B.
Conclusion: MRI morphological features can help differentiate PCNSL from aGBM. When combined with SIRs, the diagnostic performance was better than that of radiologists’ assessment.
Preoperative distinguishing primary central nervous system lymphoma (PCNSL) from glioblastoma (GBM) is of highly clinical relevance because treatment strategies for the two diseases vary substantially. In patients with GBM, surgical resection followed by concurrent chemoradiation is the first-line treatment, whereas patients with PCNSL usually undergo stereotactic biopsy followed by high-dose methotrexate (1, 2). Moreover, preoperative application of steroids may affect the histopathologic diagnosis of PCNSL (2). Therefore, reliable preoperative differentiation of both entities is important.
Conventional magnetic resonance (MR) imaging features allow distinguishing PCNSL from typical GBM for most patients because PCNSL in an immunocompetent patient usually manifests as a homogeneously enhanced mass lesion on contrast-enhanced T1-weighted (T1CE) images. And typical GBM usually exhibits an irregular rim-like enhancement with necrosis (3, 4). However, this enhancement pattern is not reliable in cases of atypical glioblastoma (aGBM) with no visible necrosis, which complicates the discrimination between aGBM and PCNSL (5, 6).
Both conventional and advanced MR techniques have been reported to be helpful in differentiating PCNSL from GBM (7–12). However, most of these studies enrolled all GBM patients, which can be differentiated from PCNSL based on findings of conventional MRI in most cases. A few studies on differentiating PCNSL from aGBM involve advanced imaging sequences or radiomics strategy (5, 6, 13, 14). Despite great advances, these techniques are associated with increased costs and postprocessing time and may not be routinely adopted by every patient in clinical practice. In contrast, T2-weighted imaging (T2WI), T1-weighted imaging (T1WI), and T1CE imaging are almost always available. Systematic evaluation of MRI morphological features of PCNSL and aGBM is, however, lacking. As an important supplement to subjective analysis, easily obtained quantitative parameters can further provide diagnostic information. Considering the pathophysiological difference between PCNSL and aGBM may be reflected in the form of signal intensity ratio (SIR), whether SIR analysis is effective in distinguishing aGBM from PCNSL remains largely unknown.
Here, we endeavored to compare morphological features and analyze SIR based on conventional MR sequences (T1WI, T2WI, and T1CE) to develop a quick and easy tool for differentiation of PCNSL and aGBM.
Ethics review board approvals from three institutions were obtained, and written informed consent was waived for this retrospective study.
Potentially eligible patients from Tangdu Hospital (from January 2012 to June 2021), XD Group Hospital (from January 2015 to May 2021), and West China Hospital (from January 2016 to June 2021) were identified with pathologically proven PCNSL or GBM.
Inclusion criteria were as follows: 1) no prior treatment history before MR examination, including biopsy, surgery, radiotherapy, chemotherapy, or corticosteroid treatment; 2) pretreatment MRI with conventional sequences available, including axial T1WI, T2WI, and T1CE imaging; 3) no hemorrhage inside the tumor based on T1WI and T2WI; 4) all PCNSL patients were immunocompetent. The exclusion criteria were as follows: 1) typical GBM with visible necrosis; 2) poor image quality with motion artifacts or susceptibility; 3) intracranial metastasis from systemic lymphoma. Atypical GBM was defined as solid enhancement with no visible necrosis based on axial T2WI and T1CE imaging, which were evaluated by two independent raters (YY and GX, with 5 and 10 years of experience in neuro-oncology imaging, respectively). When discrepancy exists, consensus was reached through discussion with a senior radiologist (G-BC, with 27 years of experience in brain tumor diagnosis).
According to the inclusion and exclusion criteria, 98 patients (center 1, n = 72; center 2, n = 26) with pathologically proven PCNSL (n = 66) or aGBM (n = 32) were consecutively enrolled and comprised the training cohort. Another cohort of 43 patients from center 3 with a diagnosis of PCNSL (n = 27) or aGBM (n = 16) comprised the external test cohort. The flow diagram for patient selection is shown in Figure 1.
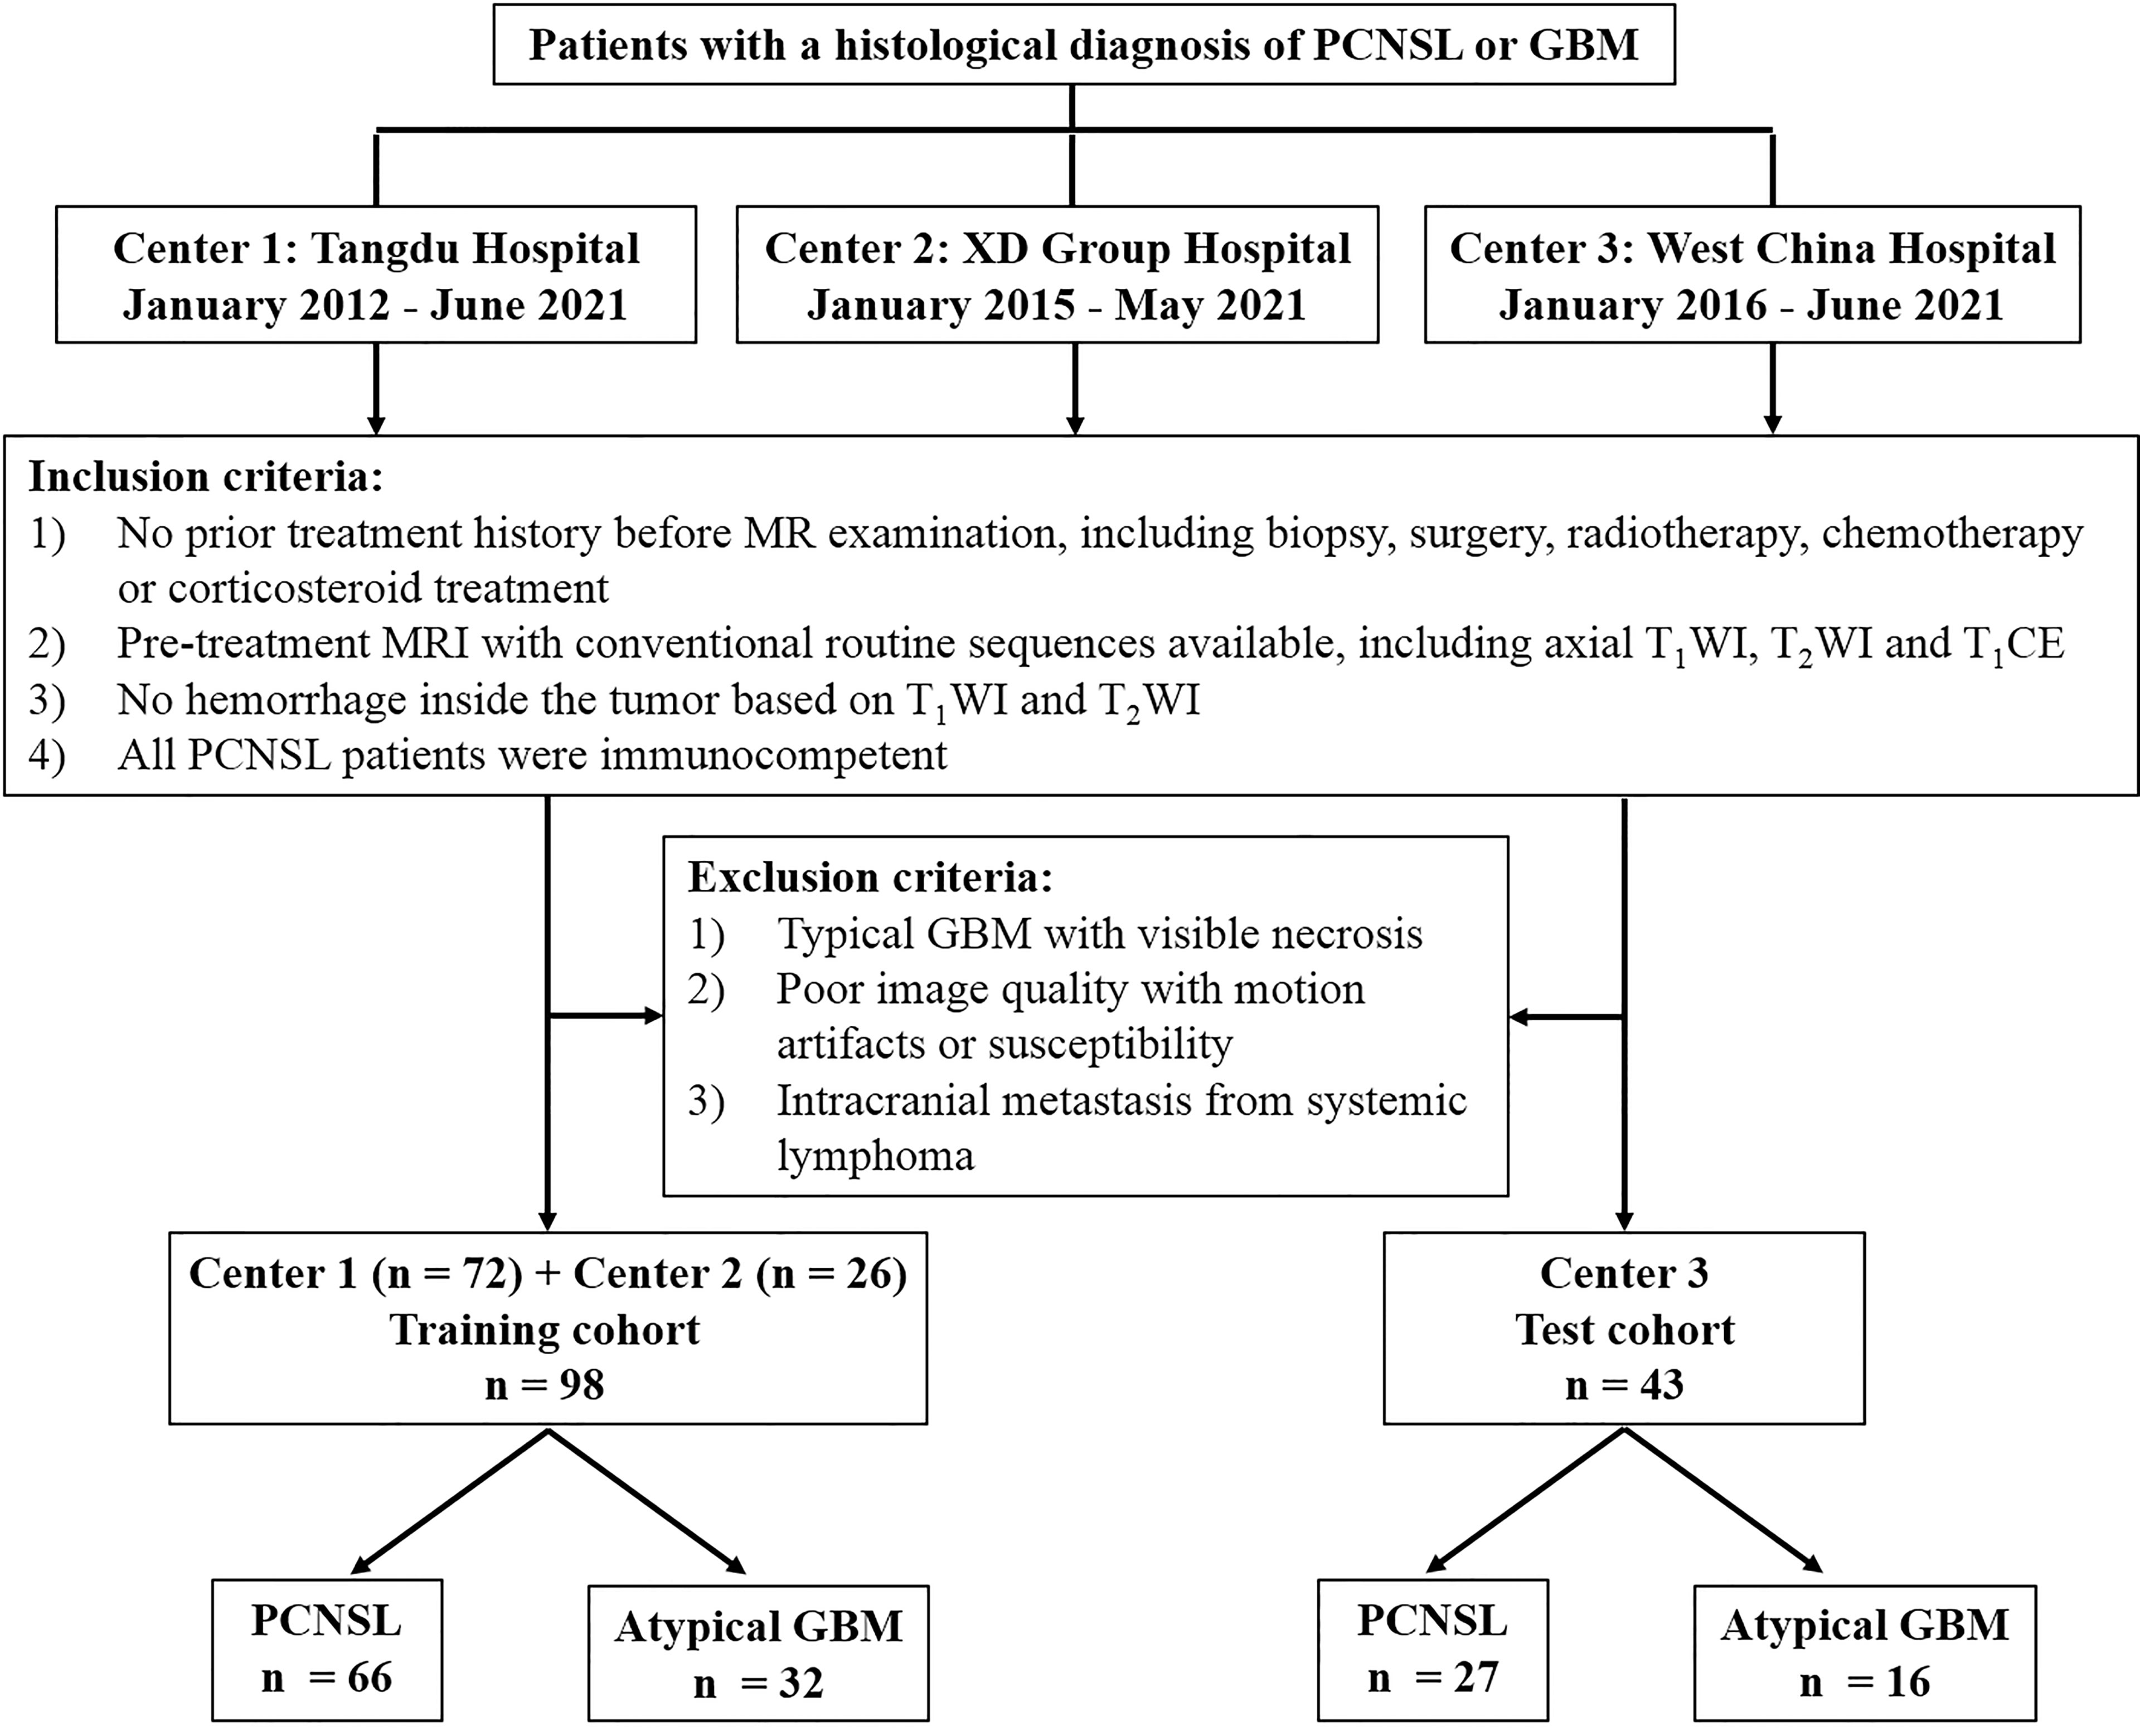
Figure 1 Flow diagram for patient selection.
MRI scans were performed at three institutions with different protocols and various scanners. The routine sequences included axial T1WI, T2WI, and T1CE imaging. The detailed MRI parameters are provided in Table S1 in the Supplementary Material. All patient names were de-identified prior to analysis.
Qualitative morphological features, which were characterized based on the criteria outlined in Table 1, were analyzed independently by two neuroradiologists (YY and GX), who were blinded to the final results. The inconsistency between them was resolved by discussion with a third senior neuroradiologist (G-BC). Notably, reef sign, peritumoral leukomalacia sign, and T2 pseudonecrosis sign were defined in our study for the first time (representative cases, see Supplementary Material Figure S1).
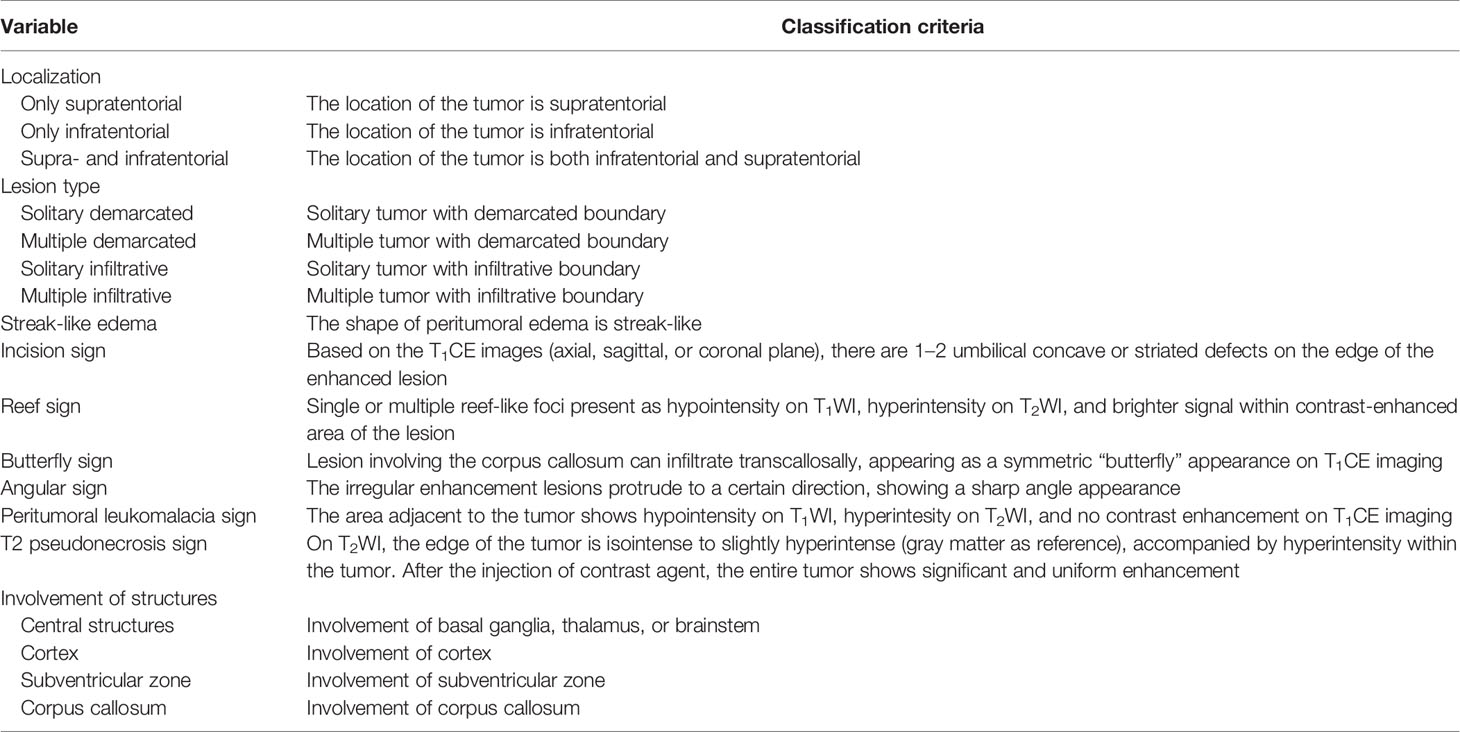
Table 1 MRI morphological feature definition.
ITK-SNAP software (version 3.8.0; http://itksnap.org) was used for SIR analysis (15). The abovementioned two neuroradiologists independently placed region of interest (ROI) for further consistency testing. The details of ROI placement strategy are shown in Figure S2 and Table S2 in Supplementary Material. Finally, four quantitative parameters, including T2 ratio (rT2), T1 ratio (rT1), T1CE ratio (rT1CE), and rT2/rT1 ratio (T2/T1), were obtained for each patient. The calculation formula is as follows:
rT2 = mean signal intensity of the lesion (SIlesion) on T2WI mean signal intensity of contralateral normal white matter (SIcontrol)
rT1 = SIlesion on T1WI/SIcontrol
rT1CE = SIlesion on T1CE/SIcontrol
T2/T1 = rT2/rT1
Two neuroradiologists (LZ and L-FY, with 10 and 17 years’ experience in radiology, respectively) independently reviewed the images. All radiologists had no prior knowledge of exact number of each entity and the final results. They can only have access to conventional MR images (T1WI, T2WI, and T1CE). Diagnosis was based on subjective analysis according to their clinical experience. The final diagnosis was recorded using a 4-point scale (1 = definite GBM; 2 = likely GBM; 3 = likely PCNSL; and 4 = definite PCNSL). To assess intra-observer agreement, radiologists reevaluated images after a 2-month washout period.
All statistical analyses were performed with SPSS 20.0 software (IBM Corp., Chicago, IL, USA) and R software version 3.6.1 (http://www.R-project.org). The normal distribution of data was investigated with Kolmogorov–Smirnov test. Numerical variables with normal distribution were denoted as mean and standard deviation. Continuous and categorical variables were compared using two-sample t-test and Fisher’s exact test, respectively. The intraclass correlation coefficient (ICC) was used to test the consistency of SIRs between the two radiologists. Intra-observer agreements of radiologist’s assessment were evaluated with Cohen’s kappa coefficient. Linear discrimination analysis (LDA) models for distinguishing aGBM from PCNSL were constructed with SIRs and morphological features alone or jointly. Receiver operating characteristic (ROC) analysis was performed to determine the performance of radiologists’ assessment and different models in the training, test, and overall cohorts, and accuracy (ACC) and area under the curve (AUC) were obtained. P < 0.05 indicated a significant difference.
Patient demographic characteristics are summarized in Table 2. In this study, 93 PCNSLs (47 men, 46 women; mean age, 58.49 ± 12.56 years) and 48 aGBMs (29 men, 19 women; mean age, 55.12 ± 10.9 years) were enrolled. There were no significant differences in age and gender distribution between the two diseases (all P > 0.05). The vast majority of patients (83 out of 93 PCNSLs and 47 of 48 aGBMs) received surgical resection. Patients in the PCNSL group were pathologically confirmed as diffuse large B-cell lymphoma. Despite the diversity of clinical symptoms, headache, dizziness, or nausea was the most common initial symptom for patients with aGBM (44.1%, 41 out of 93) or PCNSL (41.7%, 20 out of 48).
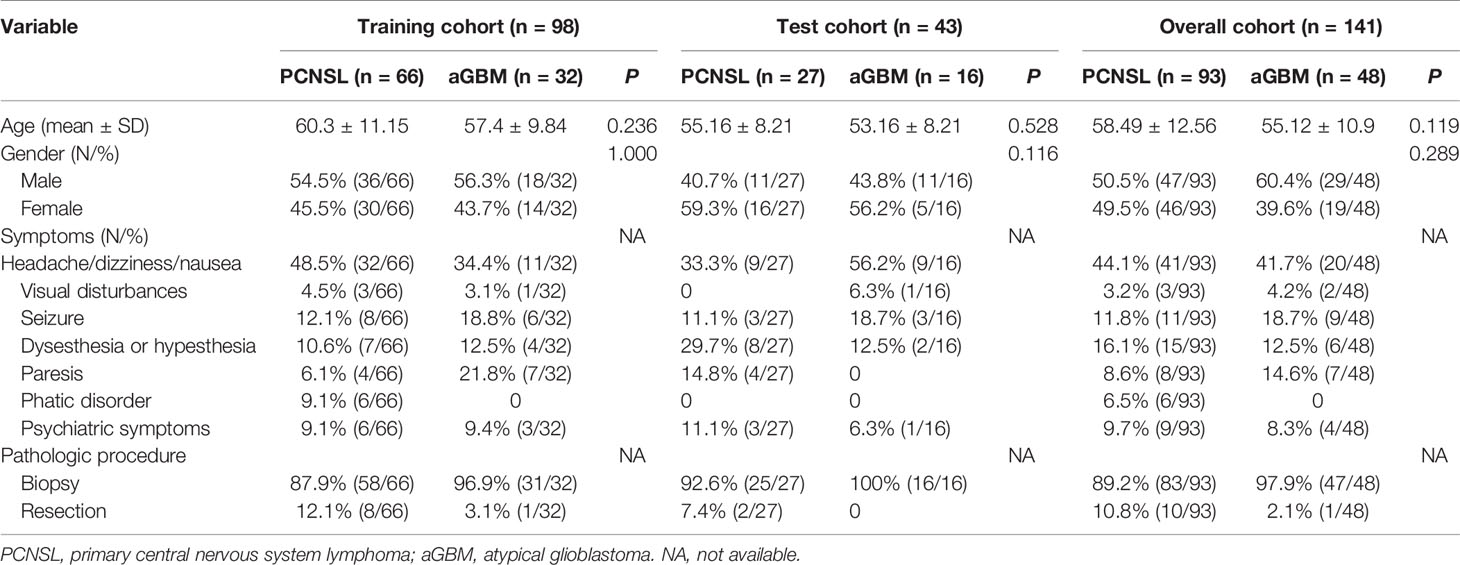
Table 2 Baseline demographics of patients.
MRI morphological features for both groups are shown in Table 3. Incision sign, reef sign, T2 pseudonecrosis sign, and peritumoral leukomalacia sign were detected in the PCNSL group but none in the aGBM group. Among them, reef sign and peritumoral leukomalacia sign were statistically different in both training (all P < 0.001) and test cohorts (reef sign, P = 0.003; peritumoral leukomalacia sign, P = 0.018). Similarly, significant statistical differences between the two groups were observed in incision sign and T2 pseudonecrosis sign based on the training cohort (all P < 0.001), whereas the differences in the test cohort were not statistically significant. Accounting for the small sample size of the test cohort, in order to increase the statistical power, we combined the training and test cohorts and performed statistical analysis on the overall cohort again. The results showed that incision sign and T2 pseudonecrosis sign were significantly different between the two groups (all P < 0.001). In addition, PCNSL was more likely to involve both supratentorial and infratentorial compartment than aGBM based on the overall cohort (P = 0.036). There were no significant differences in lesion type, streak-like edema, butterfly sign, angular sign, and involvement of structures between the PCNSL and aGBM groups (all P > 0.05).
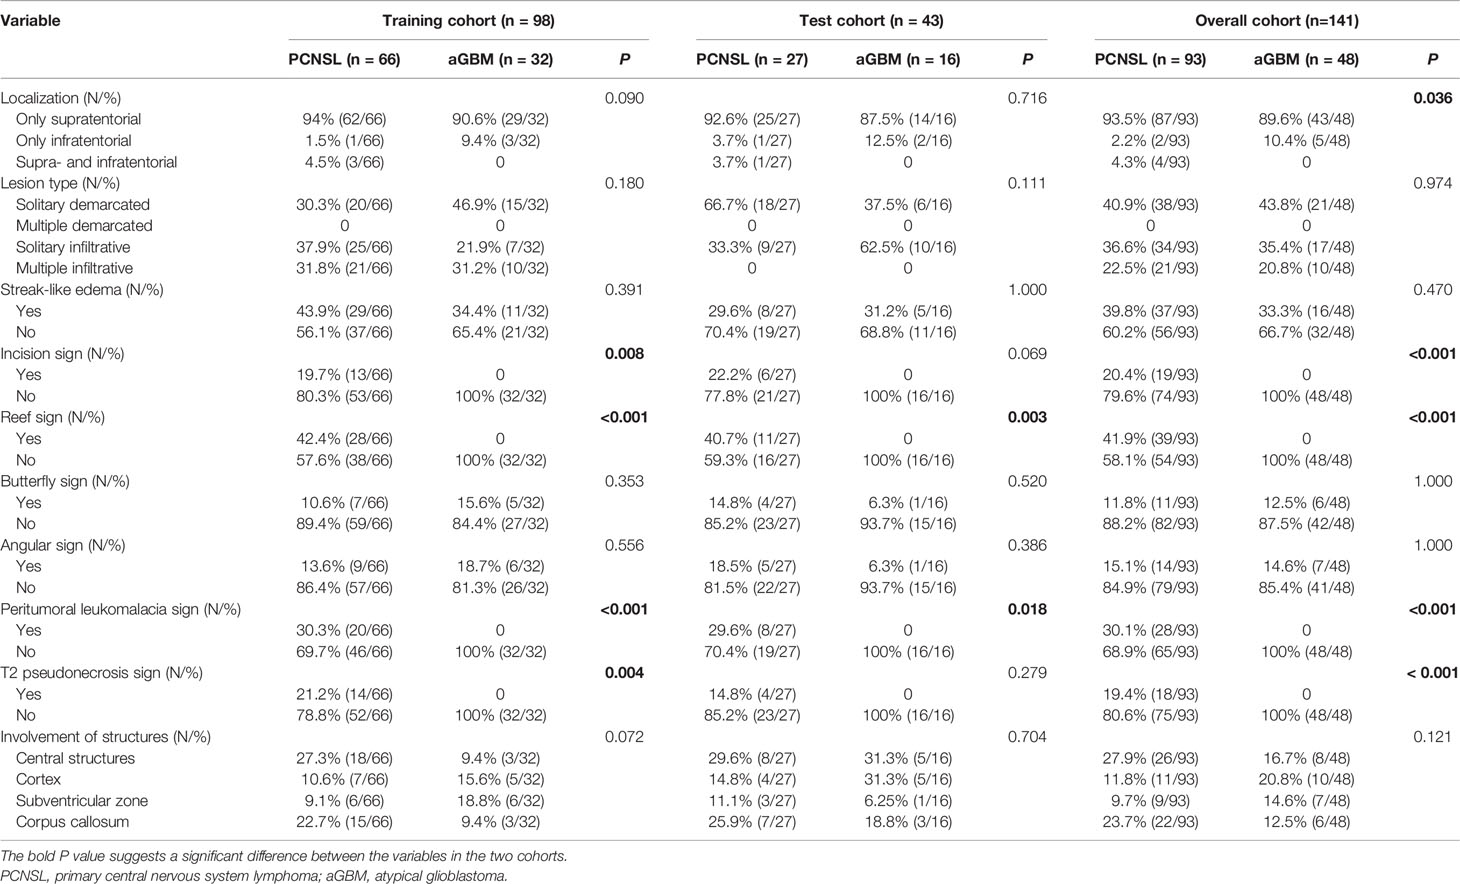
Table 3 MRI morphological features in PCNSL and aGBM.
The rT2, rT1, T2/T1, and rT1CE values calculated for PCNSLs and aGBMs are summarized in Table 4. T2/T1 and rT2 values in aGBMs were significantly higher than those in PCNSLs in both the training and test cohorts (all P < 0.001). The rT1 value in aGBMs was significantly lower than that in PCNSLs (training cohort, P < 0.001; test cohort, P = 0.048). The rT1CE value of PCNSLs was slightly higher than that of aGBMs, but the difference was not statistically significant (all P > 0.05). The representative cases are shown in Figures 2, 3.
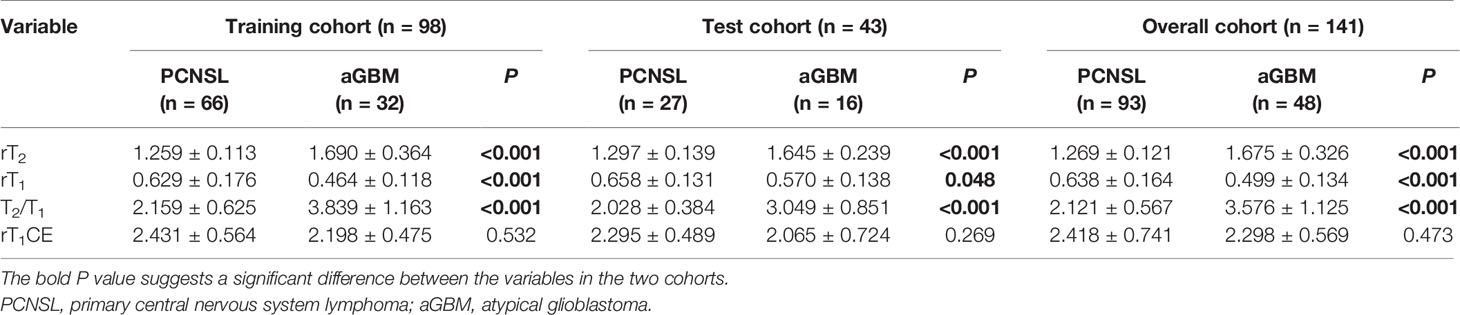
Table 4 Quantitative MR signal intensity ratio comparisons between PCNSL and aGBM.
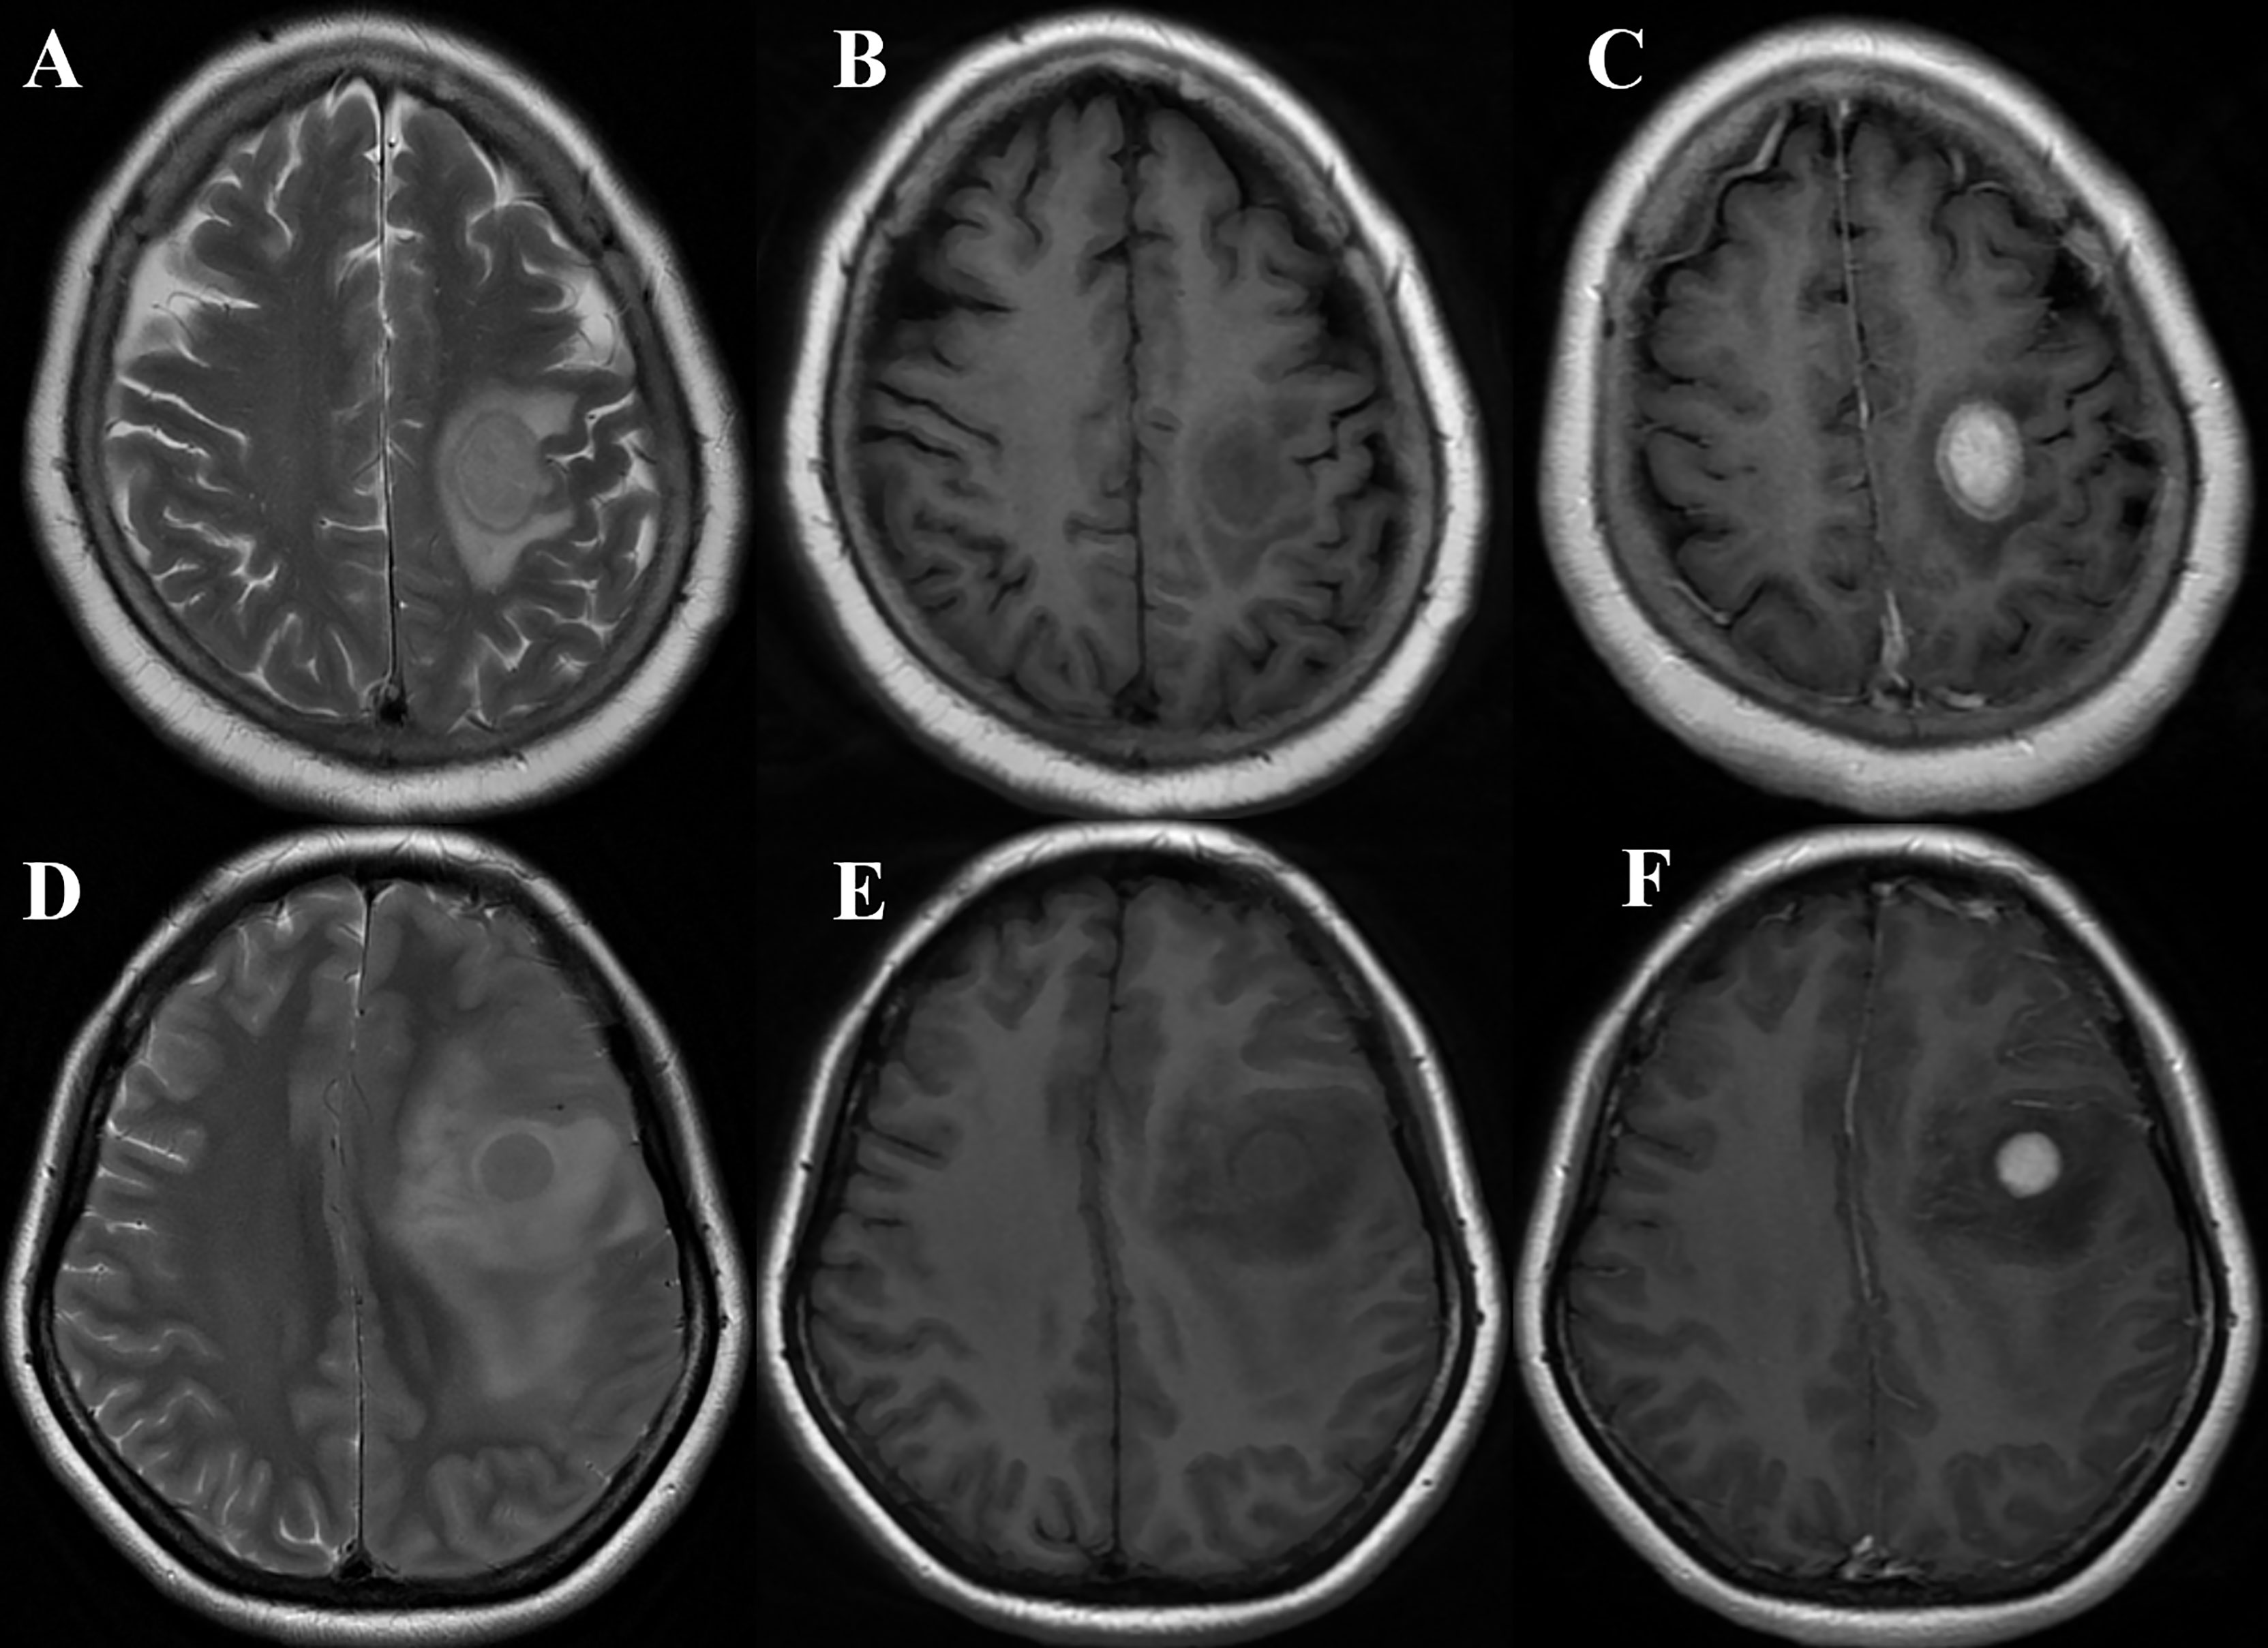
Figure 2 (A–C) A 68-year-old woman with primary central nervous system lymphoma (PCNSL) presented with left hemiparesis for 1 month. MRI showed a left frontal lobe lesion with iso- to slight hyperintensity on T2WI (A), slight hypointensity on T1WI (B), and marked homogeneous enhancement on T1CE imaging (C) (take gray matter for reference). The quantitative parameters showed that rT1, rT2, T2/T1, and rT1CE were 0.65, 1.20, 1.82, and 1.87, respectively. The case was correctly diagnosed as PCNSL by models 1, 2, 4, and 5 and radiologist B while wrongly classified as glioblastoma (GBM) by radiologist A. (D–F) A 43-year-old woman with GBM presented with seizure. MRI showed a left frontal lobe lesion with isointensity on T2WI (D), slight hypointensity on T1WI (E), and marked homogeneous enhancement on T1CE imaging (F) (take gray matter for reference). The quantitative parameters showed that rT1, rT2, T2/T1, and rT1CE were 0.66, 1.46, 2.25 and 2.11, respectively. The case was correctly diagnosed as GBM by models 1, 2, 4, 5, and 6 and radiologist B while wrongly classified as PCNSL by radiologist A.
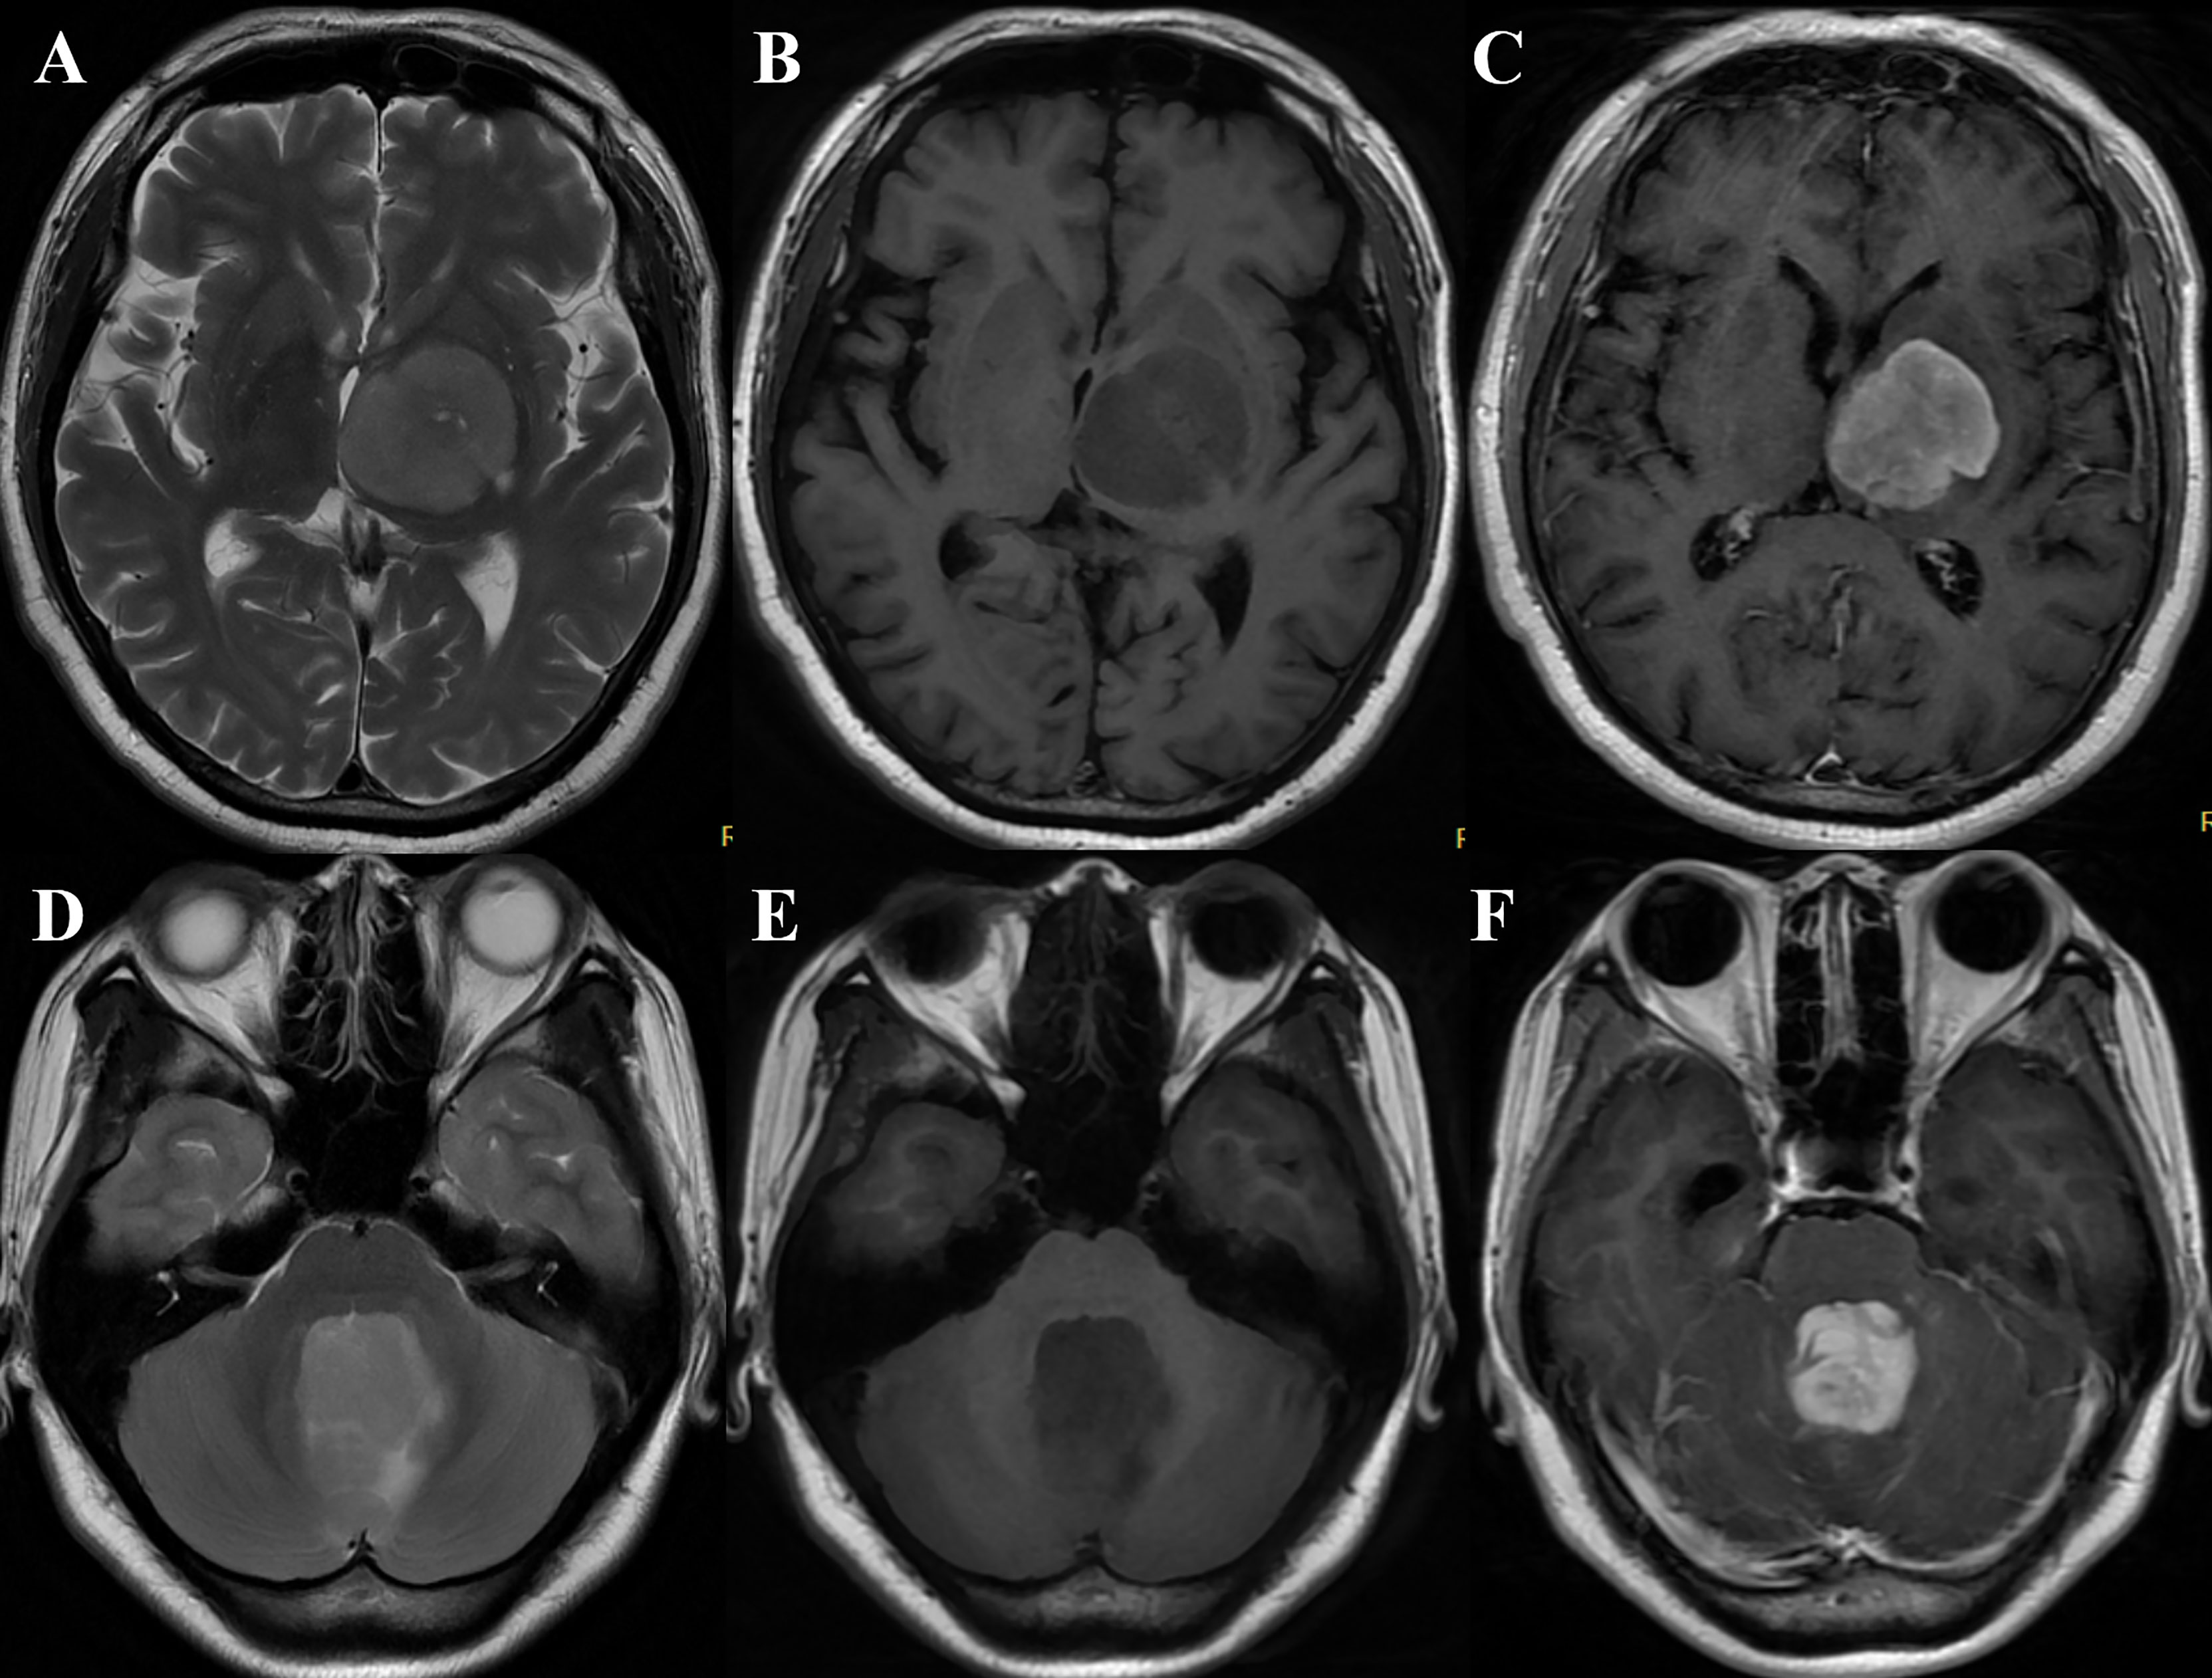
Figure 3 (A–C) A 60-year-old woman with primary central nervous system lymphoma (PCNSL) presented with right hemiparesis for 3 months. MRI demonstrated the lesion was located in the left basal ganglia and thalamus with slight hyperintensity on T2WI (A), hypointensity on T1WI (B), and marked heterogeneous enhancement on T1CE imaging (C) (take gray matter for reference). The quantitative parameters showed that rT1, rT2, T2/T1, and rT1CE were 0.83, 1.34, 1.62, and 1.23, respectively. The case was correctly diagnosed as PCNSL by models 1, 2, 4, 5, and 6 and radiologist B while wrongly classified as glioblastoma (GBM) by radiologist (A). (D–F) A 23-year-old woman with GBM presented with nausea and vomiting for 2 months. MRI showed a vermis lesion with slight hyperintensity on T2WI (D), hypointensity on T1WI (E), and obvious homogeneous enhancement on T1CE imaging (F) (take gray matter for reference). The quantitative parameters showed that rT1, rT2, T2/T1, and rT1CE were 0.57, 1.91, 3.35, and 2.73, respectively. The case was correctly diagnosed as GBM by models 1, 2, 4, and 5 while wrongly classified as PCNSL by the two radiologists.
Table 5 exhibits the diagnostic performance of different models and radiologists’ assessment. For univariate quantitative parameters analyses, compared to models 4 (rT2) and 6 (rT1), model 5 (T2/T1) achieved higher efficacy, with an AUC of 0.805 [95% confidence interval (CI), 0.718–0.893] for the training cohort, 0.719 (95% CI, 0.593–0.844) for the test cohort, and 0.822 (95% CI, 0.752–0.892) for the overall cohort, for distinguishing PCNSL from aGBM. For multiple variable combination analysis, models 2 and 3 were constructed with quantitative (rT2 + T2/T1 + rT1) and qualitative parameters (localization + incision sign + reef sign + peritumoral leukomalacia sign + T2 pseudonecrosis sign), respectively. The diagnostic performance of model 2 is better than that of model 3, with an AUC of 0.826 (95% CI, 0.709–0.885) for the training cohort, 0.778 (95% CI, 0.624–0.877) for the test cohort, and 0.833 (95% CI, 0.754–0.892) for the overall cohort, for distinguishing PCNSL from aGBM. When all the quantitative and qualitative parameters were combined, model 1 achieved the highest diagnostic efficiency, with an AUC of 0.899 (95% CI, 0.828–0.969) for the training cohort, 0.794 (95% CI, 0.666–0.922) for the test cohort, and 0.869 (95% CI, 0.807–0.932) for overall cohort.
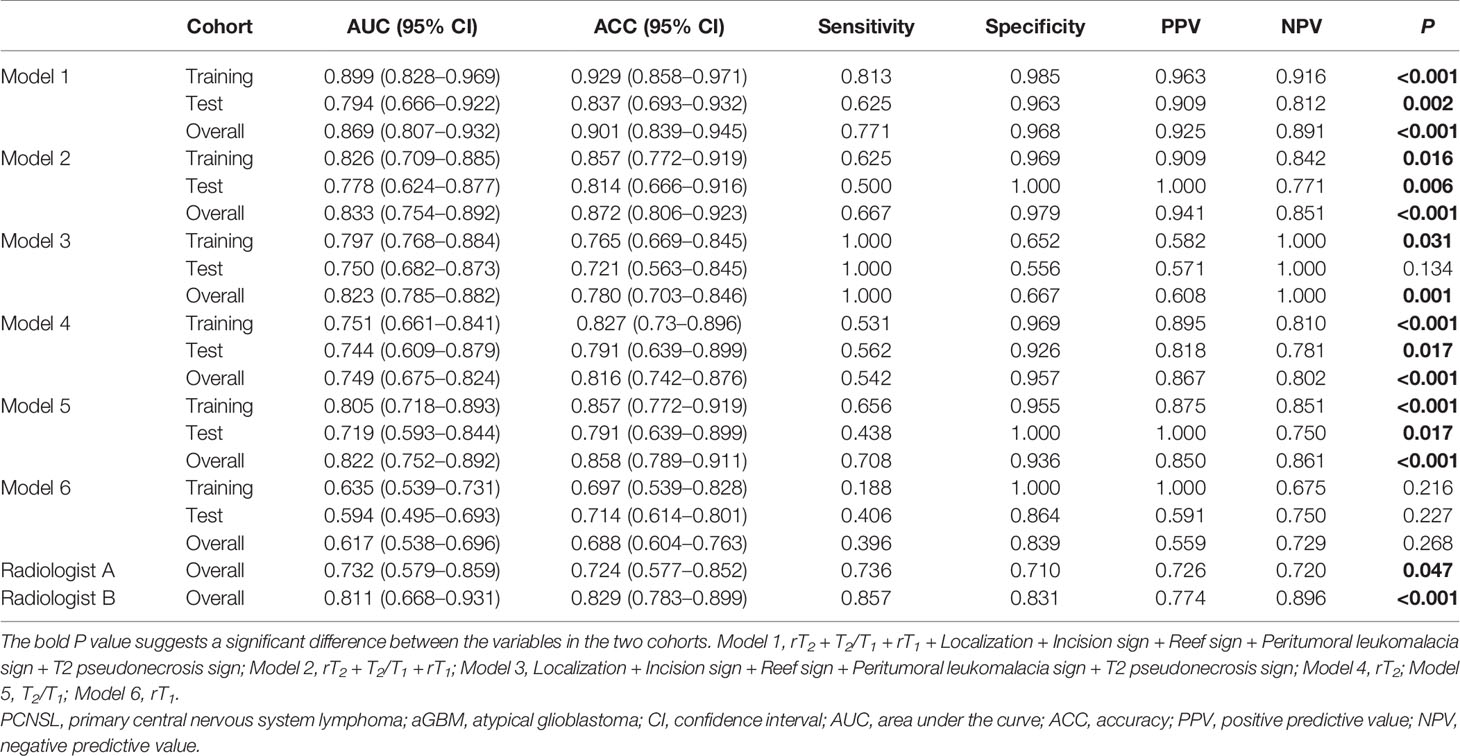
Table 5 Diagnostic efficacy of different models and radiologists’ assessment in differentiating PCNSL from aGBM.
For radiologist’s assessment, the diagnostic performance of radiologist B with more experience (AUC = 0.811, ACC = 0.829, sensitivity = 0.857, and specificity = 0.831) was better than that of radiologist A (AUC = 0.732, ACC = 0.724, sensitivity = 0.736, and specificity = 0.710).
Table 6 shows that both inter-reader agreement for SIR measurement and intra-reader agreement for radiologist’s assessment achieved good performance, with ICC/Kappa value ranging from 0.796 to 0.913. For SIR measurements, inter-reader agreement was highest for the measurement of rT2 (ICC = 0.913). Regarding reproducibility of radiologist’s assessment, experienced radiologist B (Kappa = 0.903) showed higher intra-reader agreement than that of radiologist A (Kappa = 0.796).
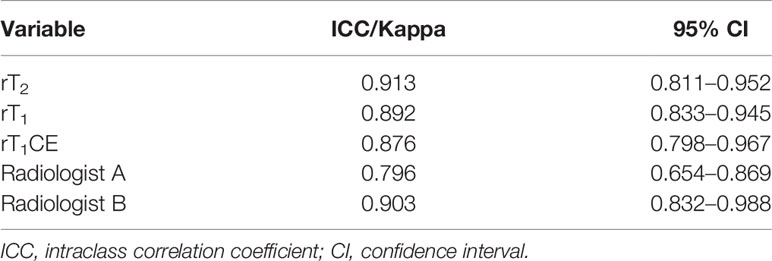
Table 6 Reproducibility of signal intensity ratio measurements and radiologists’ assessment.
Differentiating PCNSL from aGBM (with no visible necrosis) is challenging. In the present study, we found that T2 pseudonecrosis sign, incision sign, reef sign, and peritumoral leukomalacia sign were closely related to PCNSL. Compared to radiologist’s assessment, model 1, which combined the SIRs and MRI morphological features, achieved the best diagnostic performance in distinguishing PCNSL from aGBM.
During the past decades, various MR modalities and different analysis strategies were explored to differentiate PCNSL from GBM (7–10, 13, 14, 16, 17), whereas the present study focused on SIR analysis of conventional MR sequences mainly based on the following four considerations. First, in clinical practice, T1WI, T2WI, and T1CE imaging are routinely obtained for patients across different hospitals (18). In contrast, advanced MRI techniques, such as diffusion-weighted imaging (DWI) and perfusion-weighted imaging (PWI), are performed when necessary, which require additional expense and time. Furthermore, no unified standard was established for differential diagnosis. For example, although several prior studies have confirmed the efficiency of DWI in distinguishing PCNSL from GBM, overlapping of parameters makes accurate differential diagnosis challenging (19–21). Likewise, PWI is another commonly used technique, and its quantitative measurement reproducibility leads to the lack of a unified threshold to distinguish the two entities (22, 23). Second, radiomics approach can be used for differential diagnosis of PCNSL and GBM. Despite promising results, a recent systematic review suggested that conclusions derived from radiomics should be interpreted with caution due to the suboptimal quality of the studies (17). In contrast, the traditional analysis method is time-saving and easy for clinical implementation and interpretation. Third, clinical experience of radiologists suggests that PCNSL has slightly higher T1WI and lower T2WI signal intensity than GBM. However, visual judgment is subjective, and precise quantitative assessment is needed, especially for those that cannot be differentiated by the naked eye. Although T1 and T2 mapping can accurately quantify T1 and T2 values of tissue, they are not performed as routine sequences due to long scanning time and complex postprocessing. In contrast, signal intensity of the lesion is easily obtained from T1WI and T2WI but is susceptible to many factors, including the characteristics of the tissue itself (T1 value, T2 value, and proton density) and MRI equipment and scanning parameters (field strength, repetition time, and echo time). Therefore, in this study, the SIR was used as a quantitative parameter to eliminate the influence of different MRI scanners and imaging parameters on the results. Similar to our study design, the SIR also showed potential for differential diagnosis in other scenarios (12, 24–26). However, different from previous studies, we used an external test cohort to further clarify the actual diagnostic performance of the SIR. Fourth, our study did not involve complex image preprocessing, including image registration, brain extraction, and standardization. ITK-SNAP software used in our study can realize simultaneously quantitative measurement of T1WI and T2WI signal intensity in the same ROI without image registration. The entire analysis was limited to the time required to identify lesions and electronically locate ROIs. From the clinical point of view, this approach may be a highly cost-effective quantitative analysis tool.
Most previous studies enrolled all PCNSL and GBM cases, regardless of sign of intratumoral necrosis as a powerful indicator to distinguish the two entities, and their inclusion criteria could partially explain the higher ACC (7, 8, 10, 27). Therefore, we reasoned that confining our study to PCNSL and aGBM cases is closer to the clinical diagnostic dilemma in order to seek more powerful imaging signs to identify the two entities. In our study, four morphological features were closely associated with PCNSL, including incision sign, T2 pseudonecrosis sign, reef sign, and peritumoral leukomalacia sign. Among them, the diagnostic value of incision sign has been confirmed in a previous study (28). T2 pseudonecrosis sign, reef sign, and peritumoral leukomalacia sign, defined by the present study for the first time, were observed only in PCNSL and not in aGBM. For T2 pseudonecrosis sign, the mismatch between heterogeneous T2WI signals and homogeneous enhancement is the diagnostic core, which may be related to the degree of tumor infiltration along the white matter fiber bundles. The reef sign was defined as single or multiple foci that presented as hypointensity on T1WI, hyperintensity on T2WI, and brighter signal within contrast-enhanced area of the lesion. Although the corresponding pathological mechanism of this sign is still unclear, it may be related to the leakage of contrast medium in the tumor area (29). Peritumoral leukomalacia sign was defined as an area manifested as hypointensity on T1WI and hyperintensity on T2WI in the region adjacent to the tumor. The possible explanation is that the PCNSL cells are closely arranged and cluster along vascular channels, which destroy the blood supply of the adjacent brain parenchyma, resulting in encephalomalacia (30). The above four imaging signs were statistically significant between PCNSL and aGBM based on the overall cohort. So, we believe that these signs may be useful in daily radiological practice and help differentiate PCNSL and aGBM.
In the present study, PCNSL had higher rT1 and lower rT2 than aGBM. The possible mechanism is that a high degree of cellularity and high nuclear–cytoplasm ratio lead to the decrease of tumor water content (31, 32), which contributes to signal characteristics. Although the rT1CE of PCNSL was slightly higher than that of GBM, there was no significant difference between the two groups. This result differs from that of the study by Anwar et al. (9), which reported a sensitivity of 83.3%, specificity of 85.7%, and AUC of 0.92 for differentiating PCNSL and GBM. Different study populations, MRI sequence parameters, and timing and dosage of MRI contrast administration may contribute to this inconsistency. Notably, compared with rT2 or rT1, T2/T1 achieved the highest AUC in distinguishing PCNSL from aGBM. The good diagnostic performance may be attributed to the fact that T2/T1 can provide better contrast as a quantitative tool. Many studies have confirmed that T1/T2 ratio was useful in differentiating benign and malignant lesion in breast (33) and liver (24), quantifying the demyelinated cortex in multiple sclerosis (25).
There are several limitations for the current study. First, our sample size was relatively small, especially for the aGBM group. From 3 medical centers, only 48 patients with atypical and solid enhancement met the inclusion criteria and were selected. Second, radiologic–pathologic correlation for morphological features was not performed. Third, although the repeatability and reproducibility of SIR measurements were good; however, possible bias still existed due to the manual positioning ROIs. Finally, our cohort included heterogeneous MRI equipment and scanning parameters mimicking the circumstances encountered in a clinical setting. However, as a semiquantitative parameter, how SIR is affected by different equipment and scanning parameters is not clear. Further prospective study is needed.
T2 pseudonecrosis sign, reef sign, and peritumoral leukomalacia sign are closely related to PCNSL, which are never reported before. Compared to radiologists’ assessment, the combination model of morphological features and SIRs can provide better diagnostic performance in distinguishing PCNSL from aGBM.
The data analyzed in this study are subject to the following licenses/restrictions: The raw data are not publicly available due to them containing information that could compromise research participant privacy/consent. Requests to access these datasets should be directed to aGFueXUwOTIwQDE2My5jb20=.
The studies involving human participants were reviewed and approved by the institutional review board from Tangdu Hospital, XD Group Hospital, and West China Hospital. Written informed consent for participation was not required for this study in accordance with the national legislation and the institutional requirements.
G-BC and L-FY conceived the study. YH, Z-JW, and W-HL participated in the study design. YH, Z-JW, W-HL, YY, JZ, X-BY, LZ, GX, S-ZW, and L-FY performed the data acquisition. L-FY and YH participated in the statistical analyses. All authors participated in the data interpretation. YH drafted the first version of the report. All authors contributed to the article and approved the submitted version.
This study received financial support from the Key Industrial Chain Projects in the Field of Social Development of Shaanxi Province (No. 2019ZDLSF02-07 to G-BC), National Natural Science Foundation of China (No. 82102127 to YY) and the General Projects in the Field of Social Development of Shaanxi Province (No. 2019SF-002 to L-FY).
The authors declare that the research was conducted in the absence of any commercial or financial relationships that could be construed as a potential conflict of interest.
All claims expressed in this article are solely those of the authors and do not necessarily represent those of their affiliated organizations, or those of the publisher, the editors and the reviewers. Any product that may be evaluated in this article, or claim that may be made by its manufacturer, is not guaranteed or endorsed by the publisher.
The Supplementary Material for this article can be found online at: https://www.frontiersin.org/articles/10.3389/fonc.2022.811197/full#supplementary-material
1. Weller M, Van Den Bent M, Tonn JC, Stupp R, Preusser M, Cohen-Jonathan-Moyal E, et al. European Association for Neuro-Oncology (EANO) Guideline on the Diagnosis and Treatment of Adult Astrocytic and Oligodendroglial Gliomas. Lancet Oncol (2017) 18:e315–29. doi: 10.1016/S1470-2045(17)30194-8
2. Hoang-Xuan K, Bessell E, Bromberg J, Hottinger AF, Preusser M, Ruda R, et al. Diagnosis and Treatment of Primary CNS Lymphoma in Immunocompetent Patients: Guidelines From the European Association for Neuro-Oncology. Lancet Oncol (2015) 16:e322–332. doi: 10.1016/S1470-2045(15)00076-5
3. Peters S, Knoss N, Wodarg F, Cnyrim C, Jansen O. Glioblastomas vs. Lymphomas: More Diagnostic Certainty by Using Susceptibility-Weighted Imaging (SWI). Rofo (2012) 184:713–8. doi: 10.1055/s-0032-1312862
4. Haldorsen IS, Espeland A, Larsson EM. Central Nervous System Lymphoma: Characteristic Findings on Traditional and Advanced Imaging. AJNR Am J Neuroradiol (2011) 32:984–92. doi: 10.3174/ajnr.A2171
5. Kickingereder P, Wiestler B, Sahm F, Heiland S, Roethke M, Schlemmer HP, et al. Primary Central Nervous System Lymphoma and Atypical Glioblastoma: Multiparametric Differentiation by Using Diffusion-, Perfusion-, and Susceptibility-Weighted MR Imaging. Radiology (2014) 272:843–50. doi: 10.1148/radiol.14132740
6. Suh CH, Kim HS, Lee SS, Kim N, Yoon HM, Choi CG, et al. Atypical Imaging Features of Primary Central Nervous System Lymphoma That Mimics Glioblastoma: Utility of Intravoxel Incoherent Motion MR Imaging. Radiology (2014) 272:504–13. doi: 10.1148/radiol.14131895
7. Abdel Razek AAK, El-Serougy L, Abdelsalam M, Gaballa G, Talaat M. Differentiation of Primary Central Nervous System Lymphoma From Glioblastoma: Quantitative Analysis Using Arterial Spin Labeling and Diffusion Tensor Imaging. World Neurosurg (2019) 123:e303–9. doi: 10.1016/j.wneu.2018.11.155
8. Lee JY, Bjornerud A, Park JE, Lee BE, Kim JH, Kim HS. Permeability Measurement Using Dynamic Susceptibility Contrast Magnetic Resonance Imaging Enhances Differential Diagnosis of Primary Central Nervous System Lymphoma From Glioblastoma. Eur Radiol (2019) 29:5539–48. doi: 10.1007/s00330-019-06097-9
9. Anwar SSM, Baig MZ, Laghari AA, Mubarak F, Shamim MS, Jilani UA, et al. Accuracy of Apparent Diffusion Coefficients and Enhancement Ratios on Magnetic Resonance Imaging in Differentiating Primary Cerebral Lymphomas From Glioblastoma. Neuroradiol J (2019) 32:328–34. doi: 10.1177/1971400919857556
10. You SH, Yun TJ, Choi HJ, Yoo RE, Kang KM, Choi SH, et al. Differentiation Between Primary CNS Lymphoma and Glioblastoma: Qualitative and Quantitative Analysis Using Arterial Spin Labeling MR Imaging. Eur Radiol (2018) 28:3801–10. doi: 10.1007/s00330-018-5359-5
11. Lee B, Park JE, Bjornerud A, Kim JH, Lee JY, Kim HS. Clinical Value of Vascular Permeability Estimates Using Dynamic Susceptibility Contrast MRI: Improved Diagnostic Performance in Distinguishing Hypervascular Primary CNS Lymphoma From Glioblastoma. AJNR Am J Neuroradiol (2018) 39:1415–22. doi: 10.3174/ajnr.A5732
12. Malikova H, Koubska E, Weichet J, Klener J, Rulseh A, Liscak R, et al. Can Morphological MRI Differentiate Between Primary Central Nervous System Lymphoma and Glioblastoma? Cancer Imaging (2016) 16:40. doi: 10.1186/s40644-016-0098-9
13. Suh HB, Choi YS, Bae S, Ahn SS, Chang JH, Kang SG, et al. Primary Central Nervous System Lymphoma and Atypical Glioblastoma: Differentiation Using Radiomics Approach. Eur Radiol (2018) 28:3832–9. doi: 10.1007/s00330-018-5368-4
14. Choi YS, Lee HJ, Ahn SS, Chang JH, Kang SG, Kim EH, et al. Primary Central Nervous System Lymphoma and Atypical Glioblastoma: Differentiation Using the Initial Area Under the Curve Derived From Dynamic Contrast-Enhanced MR and the Apparent Diffusion Coefficient. Eur Radiol (2017) 27:1344–51. doi: 10.1007/s00330-016-4484-2
15. Yushkevich PA, Piven J, Hazlett HC, Smith RG, Ho S, Gee JC, et al. User-Guided 3D Active Contour Segmentation of Anatomical Structures: Significantly Improved Efficiency and Reliability. Neuroimage (2006) 31:1116–28. doi: 10.1016/j.neuroimage.2006.01.015
16. Bathla G, Priya S, Liu Y, Ward C, Le NH, Soni N, et al. Radiomics-Based Differentiation Between Glioblastoma and Primary Central Nervous System Lymphoma: A Comparison of Diagnostic Performance Across Different MRI Sequences and Machine Learning Techniques. Eur Radiol (2021) 31(11):8703–13. doi: 10.1007/s00330-021-07845-6
17. Suh CH, Kim HS, Jung SC, Park JE, Choi CG, Kim SJ. MRI as a Diagnostic Biomarker for Differentiating Primary Central Nervous System Lymphoma From Glioblastoma: A Systematic Review and Meta-Analysis. J Magn Reson Imaging (2019) 50:560–72. doi: 10.1002/jmri.26602
18. Freyschlag CF, Krieg SM, Kerschbaumer J, Pinggera D, Forster MT, Cordier D, et al. Imaging Practice in Low-Grade Gliomas Among European Specialized Centers and Proposal for a Minimum Core of Imaging. J Neurooncol (2018) 139:699–711. doi: 10.1007/s11060-018-2916-3
19. Makino K, Hirai T, Nakamura H, Kuroda JI, Shinojima N, Uetani H, et al. Differentiating Between Primary Central Nervous System Lymphomas and Glioblastomas: Combined Use of Perfusion-Weighted and Diffusion-Weighted Magnetic Resonance Imaging. World Neurosurg (2018) 112:e1–6. doi: 10.1016/j.wneu.2017.10.141
20. Hong EK, Choi SH, Shin DJ, Jo SW, Yoo RE, Kang KM, et al. Radiogenomics Correlation Between MR Imaging Features and Major Genetic Profiles in Glioblastoma. Eur Radiol (2018) 28:4350–61. doi: 10.1007/s00330-018-5400-8
21. Lu S, Wang S, Gao Q, Zhou M, Li Y, Cao P, et al. Quantitative Evaluation of Diffusion and Dynamic Contrast-Enhanced Magnetic Resonance Imaging for Differentiation Between Primary Central Nervous System Lymphoma and Glioblastoma. J Comput Assist Tomogr (2017) 41:898–903. doi: 10.1097/RCT.0000000000000622
22. Oei MTH, Meijer FJA, Mordang JJ, Smit EJ, Idema AJS, Goraj BM, et al. Observer Variability of Reference Tissue Selection for Relativecerebral Blood Volume Measurements in Glioma Patients. Eur Radiol (2018) 28:3902–11. doi: 10.1007/s00330-018-5353-y
23. Beuzit L, Eliat PA, Brun V, Ferre JC, Gandon Y, Bannier E, et al. Dynamic Contrast-Enhanced MRI: Study of Inter-Software Accuracy and Reproducibility Using Simulated and Clinical Data. J Magn Reson Imaging (2016) 43:1288–300. doi: 10.1002/jmri.25101
24. Farraher SW, Jara H, Chang KJ, Ozonoff A, Soto JA. Differentiation of Hepatocellular Carcinoma and Hepatic Metastasis From Cysts and Hemangiomas With Calculated T2 Relaxation Times and the T1/T2 Relaxation Times Ratio. J Magn Reson Imaging (2006) 24:1333–41. doi: 10.1002/jmri.20758
25. Nakamura K, Chen JT, Ontaneda D, Fox RJ, Trapp BD. T1-/T2-Weighted Ratio Differs in Demyelinated Cortex in Multiple Sclerosis. Ann Neurol (2017) 82:635–9. doi: 10.1002/ana.25019
26. Bai J, Shi J, Zhang S, Zhang C, Zhai Y, Wang S, et al. MRI Signal Intensity and Electron Ultrastructure Classification Predict the Long-Term Outcome of Skull Base Chordomas. AJNR Am J Neuroradiol (2020) 41:852–8. doi: 10.3174/ajnr.A6557
27. He YX, Qu CX, He YY, Shao J, Gao Q. Conventional MR and DW Imaging Findings of Cerebellar Primary CNS Lymphoma: Comparison With High-Grade Glioma. Sci Rep (2020) 10:10007. doi: 10.1038/s41598-020-67080-9
28. Cheng G, Zhang J. Imaging Features (CT, MRI, MRS, and PET/CT) of Primary Central Nervous System Lymphoma in Immunocompetent Patients. Neurol Sci (2019) 40:535–42. doi: 10.1007/s10072-018-3669-7
29. Koeller KK, Smirniotopoulos JG, Jones RV. Primary Central Nervous System Lymphoma: Radiologic-Pathologic Correlation. Radiographics (1997) 17:1497–526. doi: 10.1148/radiographics.17.6.9397461
30. Bhagavathi S, Wilson JD. Primary Central Nervous System Lymphoma. Arch Pathol Lab Med (2008) 132:1830–4. doi: 10.1043/1543-2165-132.11.1830
31. Guo AC, Cummings TJ, Dash RC, Provenzale JM. Lymphomas and High-Grade Astrocytomas: Comparison of Water Diffusibility and Histologic Characteristics. Radiology (2002) 224:177–83. doi: 10.1148/radiol.2241010637
32. Wang S, Kim S, Chawla S, Wolf RL, Knipp DE, Vossough A, et al. Differentiation Between Glioblastomas, Solitary Brain Metastases, and Primary Cerebral Lymphomas Using Diffusion Tensor and Dynamic Susceptibility Contrast-Enhanced MR Imaging. AJNR Am J Neuroradiol (2011) 32:507–14. doi: 10.3174/ajnr.A2333
Keywords: primary central nervous system lymphoma, glioblastoma, magnetic resonance imaging, signal intensity ratio, morphological feature
Citation: Han Y, Wang Z-J, Li W-H, Yang Y, Zhang J, Yang X-B, Zuo L, Xiao G, Wang S-Z, Yan L-F and Cui G-B (2022) Differentiation Between Primary Central Nervous System Lymphoma and Atypical Glioblastoma Based on MRI Morphological Feature and Signal Intensity Ratio: A Retrospective Multicenter Study. Front. Oncol. 12:811197. doi: 10.3389/fonc.2022.811197
Received: 08 November 2021; Accepted: 05 January 2022;
Published: 31 January 2022.
Edited by:
Ellen Ackerstaff, Memorial Sloan Kettering Cancer Center, United StatesCopyright © 2022 Han, Wang, Li, Yang, Zhang, Yang, Zuo, Xiao, Wang, Yan and Cui. This is an open-access article distributed under the terms of the Creative Commons Attribution License (CC BY). The use, distribution or reproduction in other forums is permitted, provided the original author(s) and the copyright owner(s) are credited and that the original publication in this journal is cited, in accordance with accepted academic practice. No use, distribution or reproduction is permitted which does not comply with these terms.
*Correspondence: Guang-Bin Cui, Y2didGRAMTI2LmNvbQ==; Lin-Feng Yan, eWxmODM0MkAxNjMuY29t
†These authors have contributed equally to this work
Disclaimer: All claims expressed in this article are solely those of the authors and do not necessarily represent those of their affiliated organizations, or those of the publisher, the editors and the reviewers. Any product that may be evaluated in this article or claim that may be made by its manufacturer is not guaranteed or endorsed by the publisher.
Research integrity at Frontiers
Learn more about the work of our research integrity team to safeguard the quality of each article we publish.