 Rita Araújo1
 Victoria Fabris
 Caroline A. Lamb
 Claudia Lanari
 Luisa A. Helguero
 Ana M. Gil
94% of researchers rate our articles as excellent or good
Learn more about the work of our research integrity team to safeguard the quality of each article we publish.
Find out more
ORIGINAL RESEARCH article
Front. Oncol., 01 March 2022
Sec. Cancer Metabolism
Volume 12 - 2022 | https://doi.org/10.3389/fonc.2022.786931
This article is part of the Research TopicTumor Metabolism in Cancer Therapy ResistanceView all 8 articles
Breast cancer (BC) is the most common type of cancer in women and, in most cases, it is hormone-dependent (HD), thus relying on ovarian hormone activation of intracellular receptors to stimulate tumor growth. Endocrine therapy (ET) aimed at preventing hormone receptor activation is the primary treatment strategy, however, about half of the patients, develop resistance in time. This involves the development of hormone independent tumors that initially are ET-responsive (HI), which may subsequently become resistant (HIR). The mechanisms that promote the conversion of HI to HIR tumors are varied and not completely understood. The aim of this work was to characterize the metabolic adaptations accompanying this conversion through the analysis of the polar metabolomes of tumor tissue and non-compromised mammary gland from mice implanted subcutaneously with HD, HI and HIR tumors from a medroxyprogesterone acetate (MPA)-induced BC mouse model. This was carried out by nuclear magnetic resonance (NMR) spectroscopy of tissue polar extracts and data mining through multivariate and univariate statistical analysis. Initial results unveiled marked changes between global tumor profiles and non-compromised mammary gland tissues, as expected. More importantly, specific metabolic signatures were found to accompany progression from HD, through HI and to HIR tumors, impacting on amino acids, nucleotides, membrane percursors and metabolites related to oxidative stress protection mechanisms. For each transition, sets of polar metabolites are advanced as potential markers of progression, including acquisition of resistance to ET. Putative biochemical interpretation of such signatures are proposed and discussed.
Breast cancer (BC) accounts for nearly 25% of diagnosed cancer cases in women worldwide, causing the highest number of deaths by cancer in this population. About 70% of all BC cases express estrogen receptor α (ERα) and progesterone receptor (PR), being referred to as hormone receptor (HR)-positive BC (1). Since HR-positive breast tumors depend on activation of ERα to sustain growth, most endocrine therapies target the ER signalling pathway (2). Current therapeutic strategies include blocking ERα transcriptional activity with tamoxifen or fulvestrant, and blocking estrogen conversion in peripheral tissues with aromatase inhibitors (3). PR can also sustain tumor growth and, thus, endocrine therapies targeting PR are also beginning to be used in selected cases (4–6). The most common progestins used for BC treatment in advanced stages are megestrol acetate and medroxyprogesterone acetate (MPA) (6), while antiprogestins, including RU486 (mifepristone) and onapristone, have been used to treat BC patients for whom other treatments have failed (6, 7). Although the vast majority of BC patients initially respond to endocrine therapy (ET), about 30-50% eventually relapse (acquired resistance), while ca. 20-30% never respond (de novo resistance) (8). Resistance to ET results from a variety of cellular changes that converge in metabolic adaptations, the overexpression of the MYC transcription factor being one of the most studied (9, 10). Therefore, there is an interest in characterizing metabolic changes associated with endocrine resistance, which may be developed into predictive markers to assist the patient at diagnosis and help the implementation of personalized follow-up schemes.
Targeted and untargeted metabolomics have been successfully applied to identify metabolite alterations in breast cancer, both in tissue and biofluids, to improve understanding of tumor metabolic pathways and unveil metabolic markers with diagnostic potential (11). Studies focused on changes in metabolism that are associated to acquired resistance to therapy have mainly considered cell line models of ER-positive/PR-positive, HER2-enriched and basal-like BC subtypes (12–16). Metabolic adaptations have been identified in cells that developed resistance to ET. In particular, comparison of the ET-resistant LCC9 cell line vs. the sensitive LCC1 cell line using integrated transcriptomics (microarray analysis) and metabolomics (GC-MS and UPLC-MS), identified increased levels of lysine, pyroglutamate, prostaglandin, 3,14-dihydro-15-keto prostaglandin F2-α (PGF2α), N-methyl-D-aspartate, L-2,3-dihydrodipicolinate, lysophosphatidylethanolamine (lysoPtE), lysophosphatidylcholine (lysoPtC), valine, α-(methylamino) isobutyrate, betaine, glutamate, hydroxybutyrate, hypotaurine, in tandem with decreased levels of specific unsaturated fatty acids (FAs) in resistant LCC9 cells, compared to sensitive LCC1 (12). NMR metabolomics of MCF-7 cells that acquired tamoxifen resistance registered increased levels of lactate, glycine, phosphocholine (PC) and glutamine, and decreased formate (13). In addition, long-term estrogen-deprived (LTED) cells (MM134 and SUM44 cell lines) were seen to activate FA/cholesterol metabolisms, with specific cholesterol metabolites (namely, 25-hydroxicholesterol and 27-hydroxicholesterol) driving cell proliferation (14). In the same study, significant upregulation of FA synthase (FASN) in LTED cells and variations in other key FA synthesis enzymes were detected. These results illustrate an important dependence on key enzymes in the FA/cholesterol pathways in endocrine-resistant ER-positive cells (14). Furthermore, selected amino acids (namely aspartate and glutamate) have been suggested to confer metabolic plasticity to both endocrine-resistant ER-positive cells and tumors (15). In addition, increased levels of α-ketoglutarate, citrate, glutamine, malate, oxaloacetate, succinate, uridine-5’-triphosphate (UTP) were found in LTDE cells compared with parental MCF7 cells (15). In a more recent report, metabolomics was combined with transcriptomics and metabolic flux experiments to address therapy resistance (16). The authors reported the metabolic adaptations of therapy resistant BC cells (MCF7-ESR1Y537S, MCF7-ESR1D538G and BT474) and sensitive cells (MCF7), disclosing that individual drugs impacted importantly on cell metabolism (16).
The role of PR in BC growth and response to therapy has gained much attention in the past years (5, 17). PR can modulate ERα transactivation of target genes, with genes like MYC or CCND1 containing regions regulated by ERα and PR, where both receptors physically interact to drive gene expression (18, 19). Thus, targeting PR stands as an alternative to treat specific subtypes of antiestrogen-resistant BC (5, 7). However, there is limited evidence (both in vitro and in vivo) about how progestins or antiprogestins impact on cell metabolism, and whether tumors that acquire resistance to ET, such as that involving mifepristone, alter their metabolism. Recently, the metabolomes of two HR-positive mouse mammary adenocarcinomas that rely on PR activation to sustain growth were compared, to show that different metabolic signatures characterize the metastatic and non-metastatic phenotypes (20). To our knowledge no metabolomic studies have analyzed metabolism changes in acquired antiprogestin resistance.
In the present study, the MPA-induced BC model was used for the characterization of polar metabolite changes, through untargeted Nuclear Magnetic Resonance (NMR) metabolomics, in neoplastic tissue vs. mammary tissue, and during the process through which tumors i) become independent of MPA for growth, and ii) subsequently become independent of HR signalling and acquire ET resistance. The results presented here are discussed under the light of putative biochemical mechanisms that characterize each tumor state/transition and potential metabolic biomarkers are advanced for each type of endocrine response.
The mouse mammary ductal adenocarcinomas C4-HD, C4-HI and C4-HIR, all expressing ER and PR, from the MPA-induced model were used (21–23). Briefly, the parental tumor line, C4-HD, was induced by treatment of BALB/c female mouse with MPA depot and always transplanted with MPA to sustain growth (hormone-dependent; HD growth). Through successive passaging into mice without MPA the hormone-independent (HI) variant was established (C4-HI). Both C4-HD and C4-HI tumors regress if PR activation is blocked (either by MPA withdrawal in the case of C4-HD, or PR inhibition with antiprogestins (C4-HD and C4-HI). Through selective pressure, the C4-HIR (hormone-independent and therapy resistant) tumor line was obtained, which grows in the presence of the antiprogestins mifepristone and onapristone (21). In this work, each tumor line was implanted subcutaneously in the right and left inguinal flanks of 2-month-old BALB/C virgin female mice (n=6 mice and, thus, n=12 tumors) and allowed to grow until they reached a size of 30-40 mm2. During this time the animals were fed ad libitum and were kept under a 12 h light/dark cycle. Tumor samples and axial mammary gland (MG) tissue from the same animal were excised and immediately frozen in liquid nitrogen. In parallel, a group of mice (n=6) without tumors were grown in identical conditions (+/- 20 mg MPA depot), to obtain healthy MG tissue for comparison (Figures 1A, B). The mice were maintained at the Animal Facility at the Instituto de Biología y Medicina Experimental (IByME) of Buenos Aires, in Argentina. All animal procedures were performed at the IByME Animal facility and approved by the local Institutional Animal Care and Use Committee (Approval no. 030/2016, dated 24 June 2016), complying with regulatory standards of animal ethics.
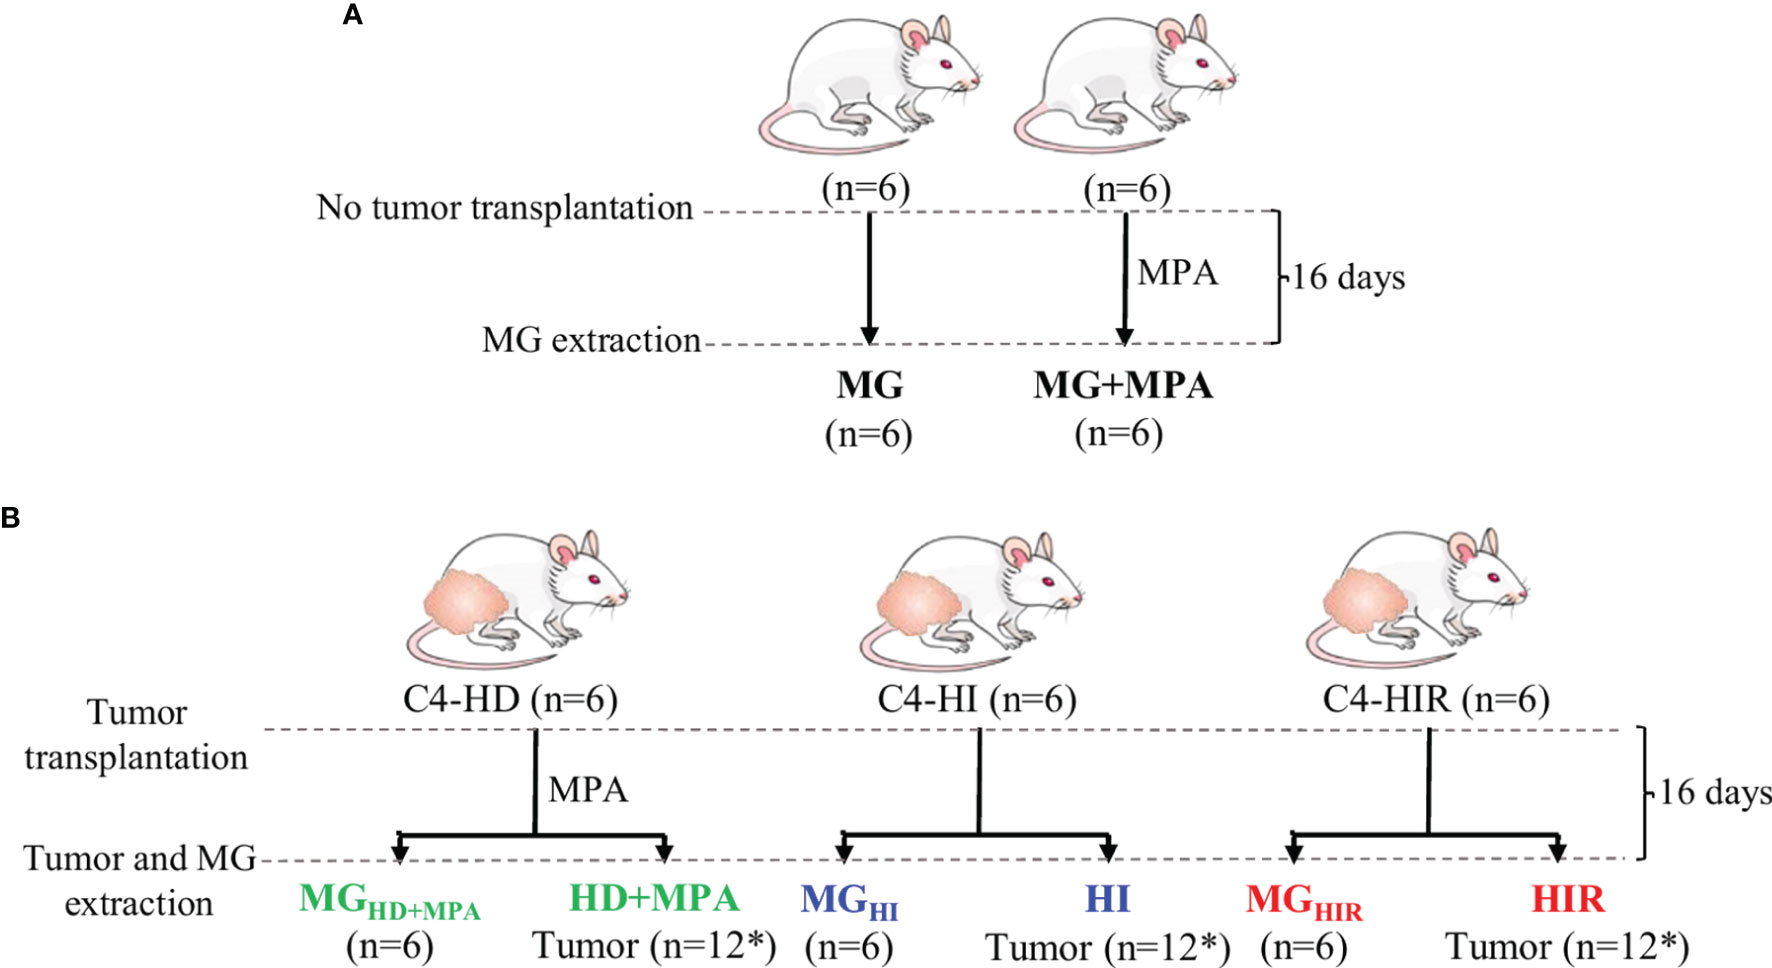
Figure 1 Experimental design and nomenclature of tissues from each group. (A) Two-month-old healthy, virgin female mice were divided into two groups, one implanted with 20 mg depot MPA and the other one left without depot (control). After 16 days, the mammary gland (MG) tissue was excised for analysis (MG+MPA and MG); and (B) the syngeneic tumors C4-HD (hormone-dependent; HD), C4-HI (hormone-independent; HI) and C4-HIR (hormone-independent and endocrine therapy-resistant; HIR) were implanted in the right and left inguinal flanks of 2-month-old virgin female mice. The mice bearing C4-HD tumors were also implanted with 20 mg MPA depot. The tumors (HD, HI and HIR) and MG tissue from the same animal (MGHD+MPA, MGHI and MGHIR) were excised and analysed. *Indicates that 12 tumors were obtained from six mice that were implanted on both inguinal flanks.
Both tumor and MG tissue were ground using a pestle and mortar, while kept in liquid nitrogen. All tissue samples (average weight of 50 mg) were extracted using methanol: chloroform: water (1:1:0.75) (24) and the polar phase was separated for analysis. In brief, ground tissue samples were transferred to an eppendorf tube, followed by the addition of 500 µL of cold 80% methanol, 400µL of cold chloroform and 200 µL of cold Mili-Q water, and vortex homogenisation for 60 s. Samples were left to rest on ice for 10 minutes and then centrifuged (8,000 rpm, 5 min, 23°C). Polar phases were separated, vacuum-dried and stored at -80°C until analysis. At the time of NMR acquisition, the dried aqueous extracts were suspended in 600 µL of 100 mM sodium phosphate buffer (pH 7.4, in D2O containing 0.25% 3-(trimethylsilyl)-propionic-2,2,3,3-d4 acid (TSP) for chemical shift referencing), homogenized, and 550 µL were transferred to 5mm NMR tubes.
All NMR spectra were acquired on a Bruker AVANCE III spectrometer (Rheinstetten, Germany) operating at 500.13 MHz for proton. Standard 1D 1H NMR spectra of aqueous extracts were recorded at 298 K with water pressaturation, using the “noesypr1d” pulse program (Bruker library), with 2.34 s acquisition time, 2 s relaxation delay, 512 scans, 7002.801 Hz spectral width, and 32 k data points. Each free-induction decay was zero-filled to 64 k points and multiplied by a 0.3 Hz exponential function prior to Fourier transformation. After acquisition, spectra were manually phased, baseline-corrected, and chemical-shift referenced to TSP. For selected samples, two-dimensional NMR spectra, namely 1H-1H TOCSY (Total Correlation Spectroscopy) and 1H-13C HSQC (Heteronuclear Single Quantum Coherence) spectra were also recorded to support spectral assignment. Peak assignment was also based on comparison with data available on the Bruker BBIOREFCODE spectral database and the human metabolome database (HMDB) (25), as well as on existing literature.
Prior to multivariate analysis (MVA), the 1D 1H NMR spectra were converted to data matrices (AMIX-viewer 3.9.14, BrukerBiospin, Rheinstetten, Germany), excluding the suppressed water region (4.63-5.02 ppm) and residual methanol signals (3.35-3.36 ppm). The spectra were aligned by recursive segment-wise peak alignment (RSPA) (Matlab 8.3.0, The MathWorks Inc., Natick, Massachusetts, USA) and normalized to spectral total area, to account for different sample weights. 1D spectra data matrices were then scaled to unit variance (UV) and MVA was carried out using principal component analysis (PCA) and partial least-squares discriminant analysis (PLS-DA) (SIMCA-P 11.5; Umetrics, Umeå, Sweden). Results were visualized through factorial coordinates (‘scores plots’) and factorial contributions (‘loadings plots’), the latter colored according to variable importance to the projection (VIP). PLS-DA models were considered statistically robust for predictive power (Q2) values ≥ 0.5. For each relevant resonance, peak areas were integrated in the raw spectra (Amix 3.9.5, Bruker BioSpin, Rheinstetten, Germany), normalized to total spectral area and associated effect size (ES) values and statistical significance were calculated (p-value assessed by the student’s t test, R-statistical software, R Foundation for Statistical Computing, Vienna, Austria). Significant changes in metabolite levels (p < 0.05) were identified and p-values underwent the False Discovery Rate (FDR) correction for multiple comparisons based on the Benjamini and Hochberg method (26).
The average 1H NMR spectra of aqueous extracts from MG tissue and all murine MPA-induced mammary tumors are shown in Figure 2A. A total of 44 polar metabolites were identified overall, almost all detected in both MG and tumor tissue (Table S1). Compared to previous NMR reports of aqueous extracts from mouse and rat mammary tumors (20, 24, 27) and high-resolution magic angle spinning (HRMAS) NMR of human breast tumor tissue (28–30), all metabolites hereby identified in the MPA-induced tumors have been observed previously in different types of BC tissue, with the exception of adipate, ascorbate and hypoxanthine, which could not be detected here. Visual inspection of the average spectra of tumors and MG tissue (Figure 2A) suggests that tumors seem to exhibit qualitatively higher levels of lactate (peaks 3), some nucleotides (at ca. 6 ppm and higher), some amino acids [e.g. branched chain amino acids, branched-chain amino acids (BCAA) (peaks 1), alanine (peak 4), glutamate (peaks 7), glycine (peak 18), phenylalanine (peaks 24), and tyrosine (peaks 22)], glycerophosphocholine (GPC, peak 15), as well as decreased levels of creatine (peaks 12), glucose (peak 20), taurine (peaks 16) and glutamine (peaks 9). With the aim of statistically validating these (and possible other) variations, PCA was carried out, revealing effective group separation between all tumors and all MG tissue samples, and showing clear intra-group separation between HD, HI and HIR tumors (Figure 2B). The PLS-DA scores scatter plot of all tumors vs MG tissue (Figure 2B) was significantly robust (high predictive power, expressed by Q2 = 0.98), maximizing separation between all MG samples and all tumors (thus blurring the separation between tumor types, clearly seen in PCA). The corresponding loadings plot (Figure 2C) identified a large number of signals that were increased or decreased in tumors, compared with MG tissue (positive and negative signals, respectively). Indeed, a total of just over 30 metabolites and 4 still unassigned resonances were found to vary significantly between all mammary tumors (irrespective of their endocrine response) and MG tissue (independently of whether they were obtained from healthy or tumor-bearing animals) (Table S2). Clear changes comprise increased glutamate/glutamine ratio, increased alanine, BCAA, reduced glutathione (GSH) and aromatic amino acids, along with decreased taurine and creatine; decreased ATP and/or ADP and increased uridine diphosphate N-acetylglucosamine (UDP-GlcNAc) and uridine; increased total choline (GPC; in particular); increased lactate and reduced glucose and mannose; increased acetone and decreased inositol species. Notably, all variations were found to remain statistically significant upon FDR correction and exhibited low p-values, which demonstrate their robustness. However, these strong overall differences mask specific changes related to tumor endocrine response, as will be addressed in the next section.
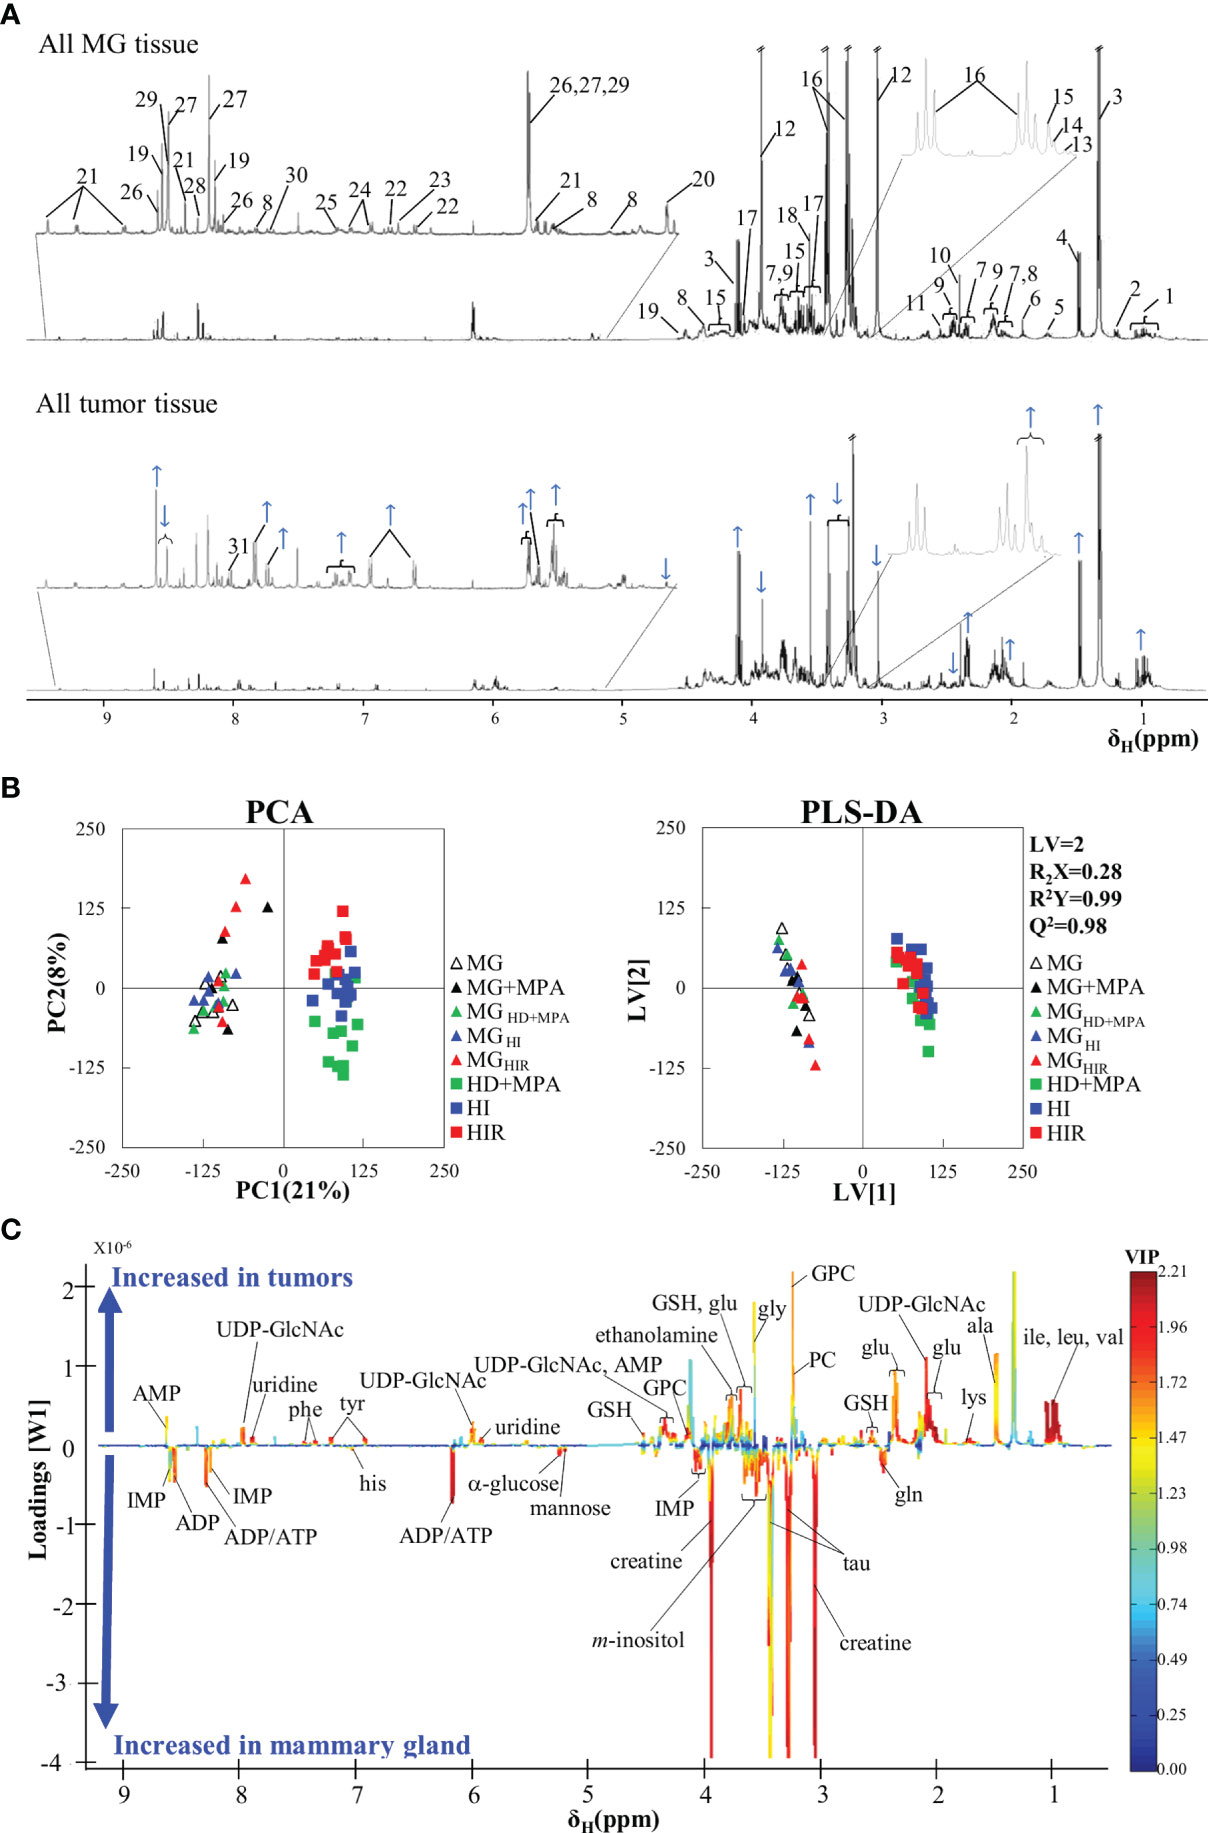
Figure 2 Average 1H NMR (500 MHz) spectra of aqueous extracts, PCA and PLS-DA scatter plots and corresponding loadings plots. (A) Average 1H NMR spectra of aqueous extracts of all tumors (top) and mammary gland (MG) samples (bottom). Peak assignments: 1: isoleucine/leucine/valine, 2: 3-HBA (3-hydroxybutyrate), 3: lactate, 4: alanine, 5: lysine, 6: acetate, 7: glutamate, 8: UDP-GlcNAc (UDP-N-acetylglucosamine), 9: glutamine, 10: succinate, 11: GSH (reduced glutathione), 12: creatine, 13: choline, 14: PC (phosphocholine), 15: GPC (glycerophosphocholine), 16: taurine, 17: m-inositol, 18: glycine, 19: IMP (inosine monophosphate), 20: α-glucose, 21: NAD+ (oxidized nicotinamide adenine dinucleotide), 22: tyrosine, 23: histidine, 24: phenylalanine, 25: uracil, 26: AMP (adenosine monophosphate), 27: ADP (adenosine diphosphate), 28: inosine, 29: ATP (adenosine triphosphate), 30: uridine 31: Un8.12: unassigned metabolite at δ 8.12; (B) PCA and PLS-DA scatter plots of all tumor samples (n = 36) vs. all MG samples (n = 30); and (C) corresponding PLS-DA loadings plots for the model in B) (right).
In addition, it could be argued that MPA treatment or the origin of MG tissue (healthy or tumor-bearing mice) could influence metabolic profile and, hence, work as a confounder in this study. However, multivariate analysis results (Figures 2B, C) suggested that no significant differences occur between the metabolic profiles of i) MPA-treated and non-treated MG tissues, and ii) MG tissue from healthy animals and from tumor-bearing animals. Indeed, the absence of a significant MPA impact on tissue metabolic profile was evidenced by both PCA and PLS-DA (results not shown), the latter revealing that MPA-treated MG may show only weak increasing tendencies in GPC and GSH (effect sizes 1.36 ± 1.26, p-value 0.041; and 1.45 ± 1.27, p-value 0.015, respectively). In addition, MG from tumor-bearing mice (compared to that of healthy animals) only showed small variations in glutamine and mannose (effect sizes 1.09 ± 0.78, p-value 0.012; and -0.98 ± 0.77, p-value 0.025, respectively). The above weak tendencies were found to be negligible compared to the changes affecting the same metabolites for different tumor groups, as will be described below.
Unsupervised PCA analysis of the three tumor types showed a discernible separation of the three sample groups in PC1, further confirmed by PLS-DA (Figure S1), reflecting significantly distinct metabolic profiles of the respective polar extracts. Pairwise comparison of HD+MPA tumors and MG samples obtained from the same animals (MGHD+MPA) (Figure 3) produced robust group separations in both PCA and PLS-DA (Q2 = 0.96) scatter plots, along with a loadings plot rich in high VIP signals (Figure 3B), where positive and negative peaks reflect metabolites that are increased and decreased in tumors, respectively. Integration and subsequent univariate statistical analysis unveiled relevant changes in the levels of 14 amino acids and derivatives: GSH, creatine and phosphocreatine (PCr), 8 nucleotide-related metabolites, 2 precursors of membrane lipids (ethanolamine and GPC), 4 organic acids (acetate, formate, lactate and 3-hydroxybutyrate, 3-HBA), 2 sugars (glucose and mannose), 3 other compounds (ketone body acetone, and m- and s-inositols) (Table 1). Indeed, all metabolite variations identified (except for one unassigned resonance) remained significant after FDR correction (* in Table 1). Figure 3C illustrates that the largest changes, as viewed by effect size, comprise: i) increases in glutamate, all three BCAA, UDP-GlcNAc, GPC and GSH; and ii) decreases in taurine, creatine, ADP and/or ATP, glucose, among others (notably, only a small decrease is noted for lactate in HD tumors).
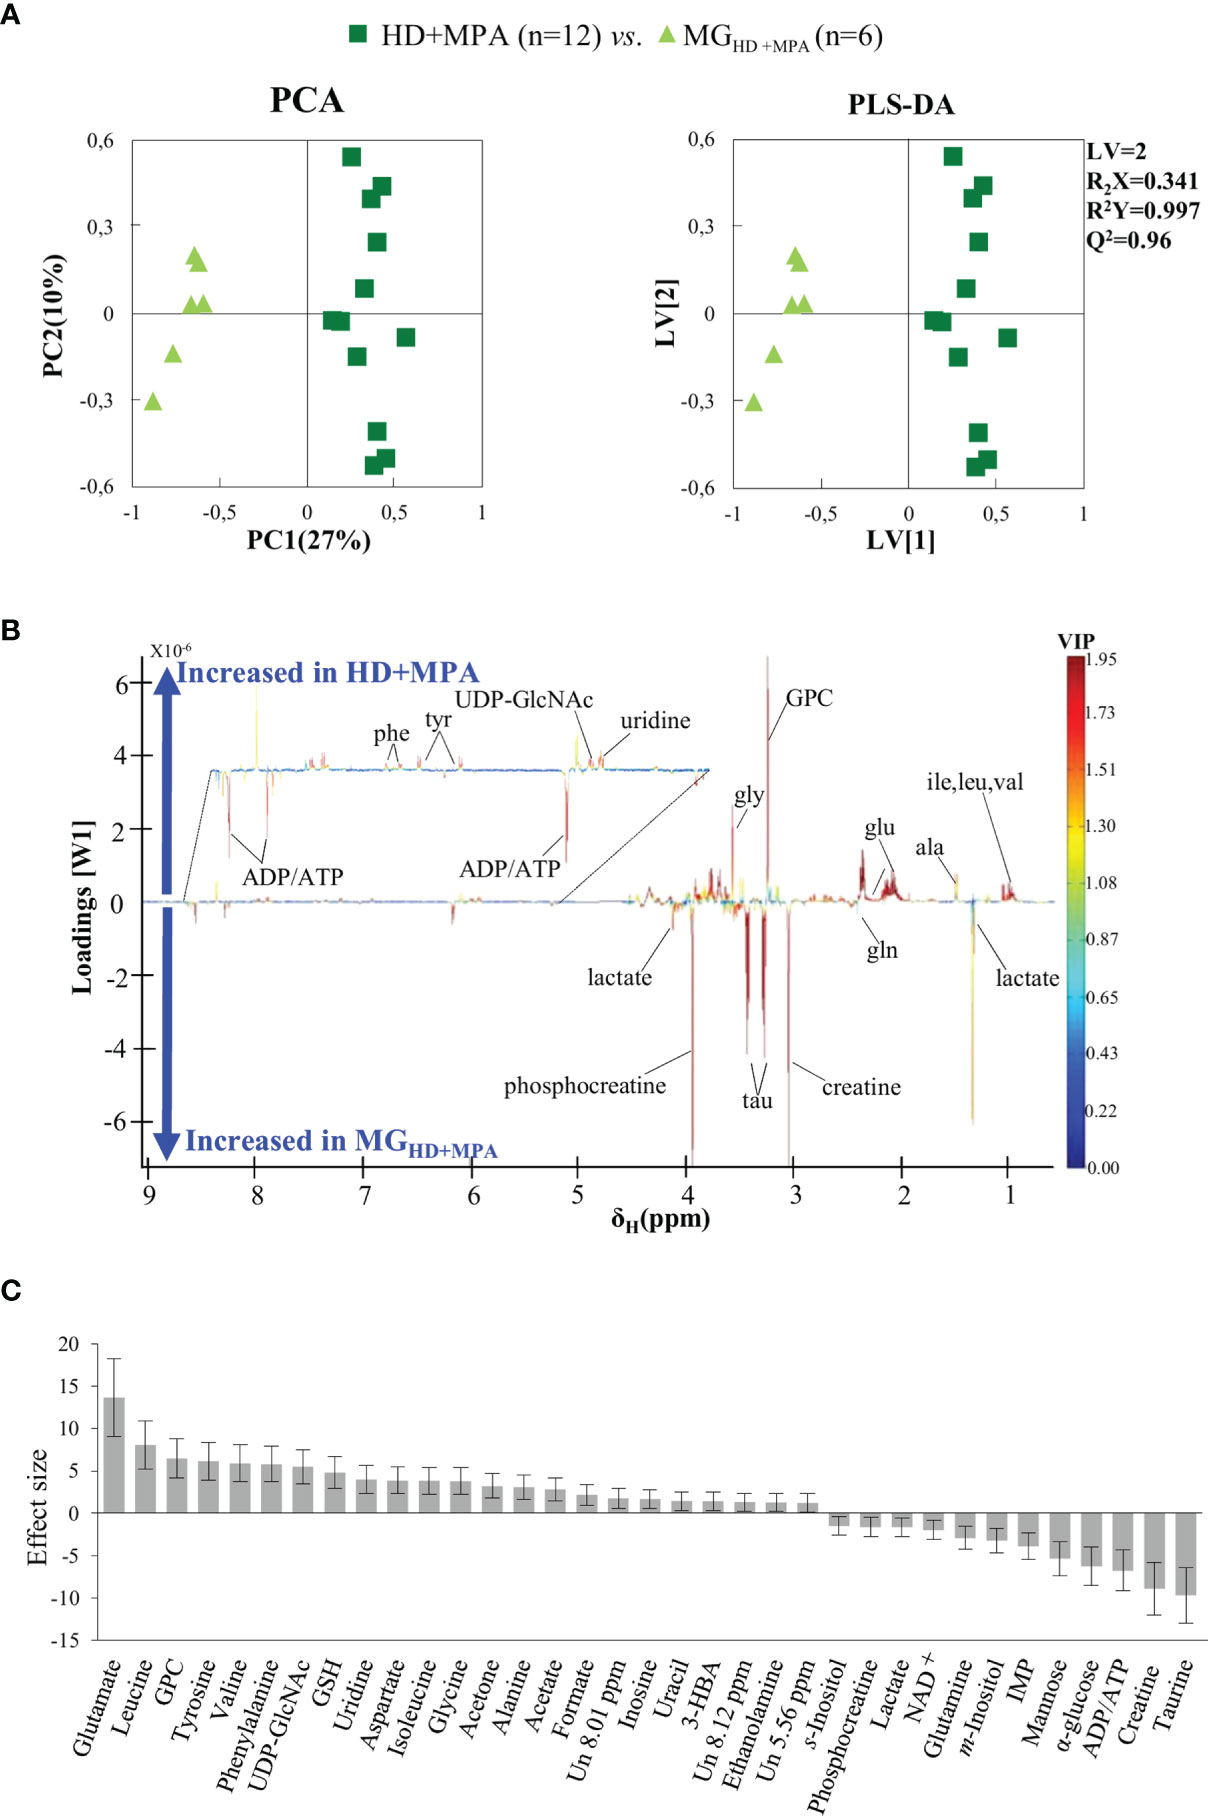
Figure 3 PCA and PLS-DA scatter plots, loadings plots and metabolic variations in the first step of tumor progression. (A) PCA and PLS-DA of HD+MPA tumors (n = 12) vs. MGHD+MPA tissue (n = 6); (B) PLS-DA loadings plots; three-letter code used for amino acids and all other abbreviations defined as in Figure 2 caption; and (C) metabolic variations reported in the transition from MGHD+MPA tissue to HD+MPA tumors expressed by effect-size (ES), with corresponding error.
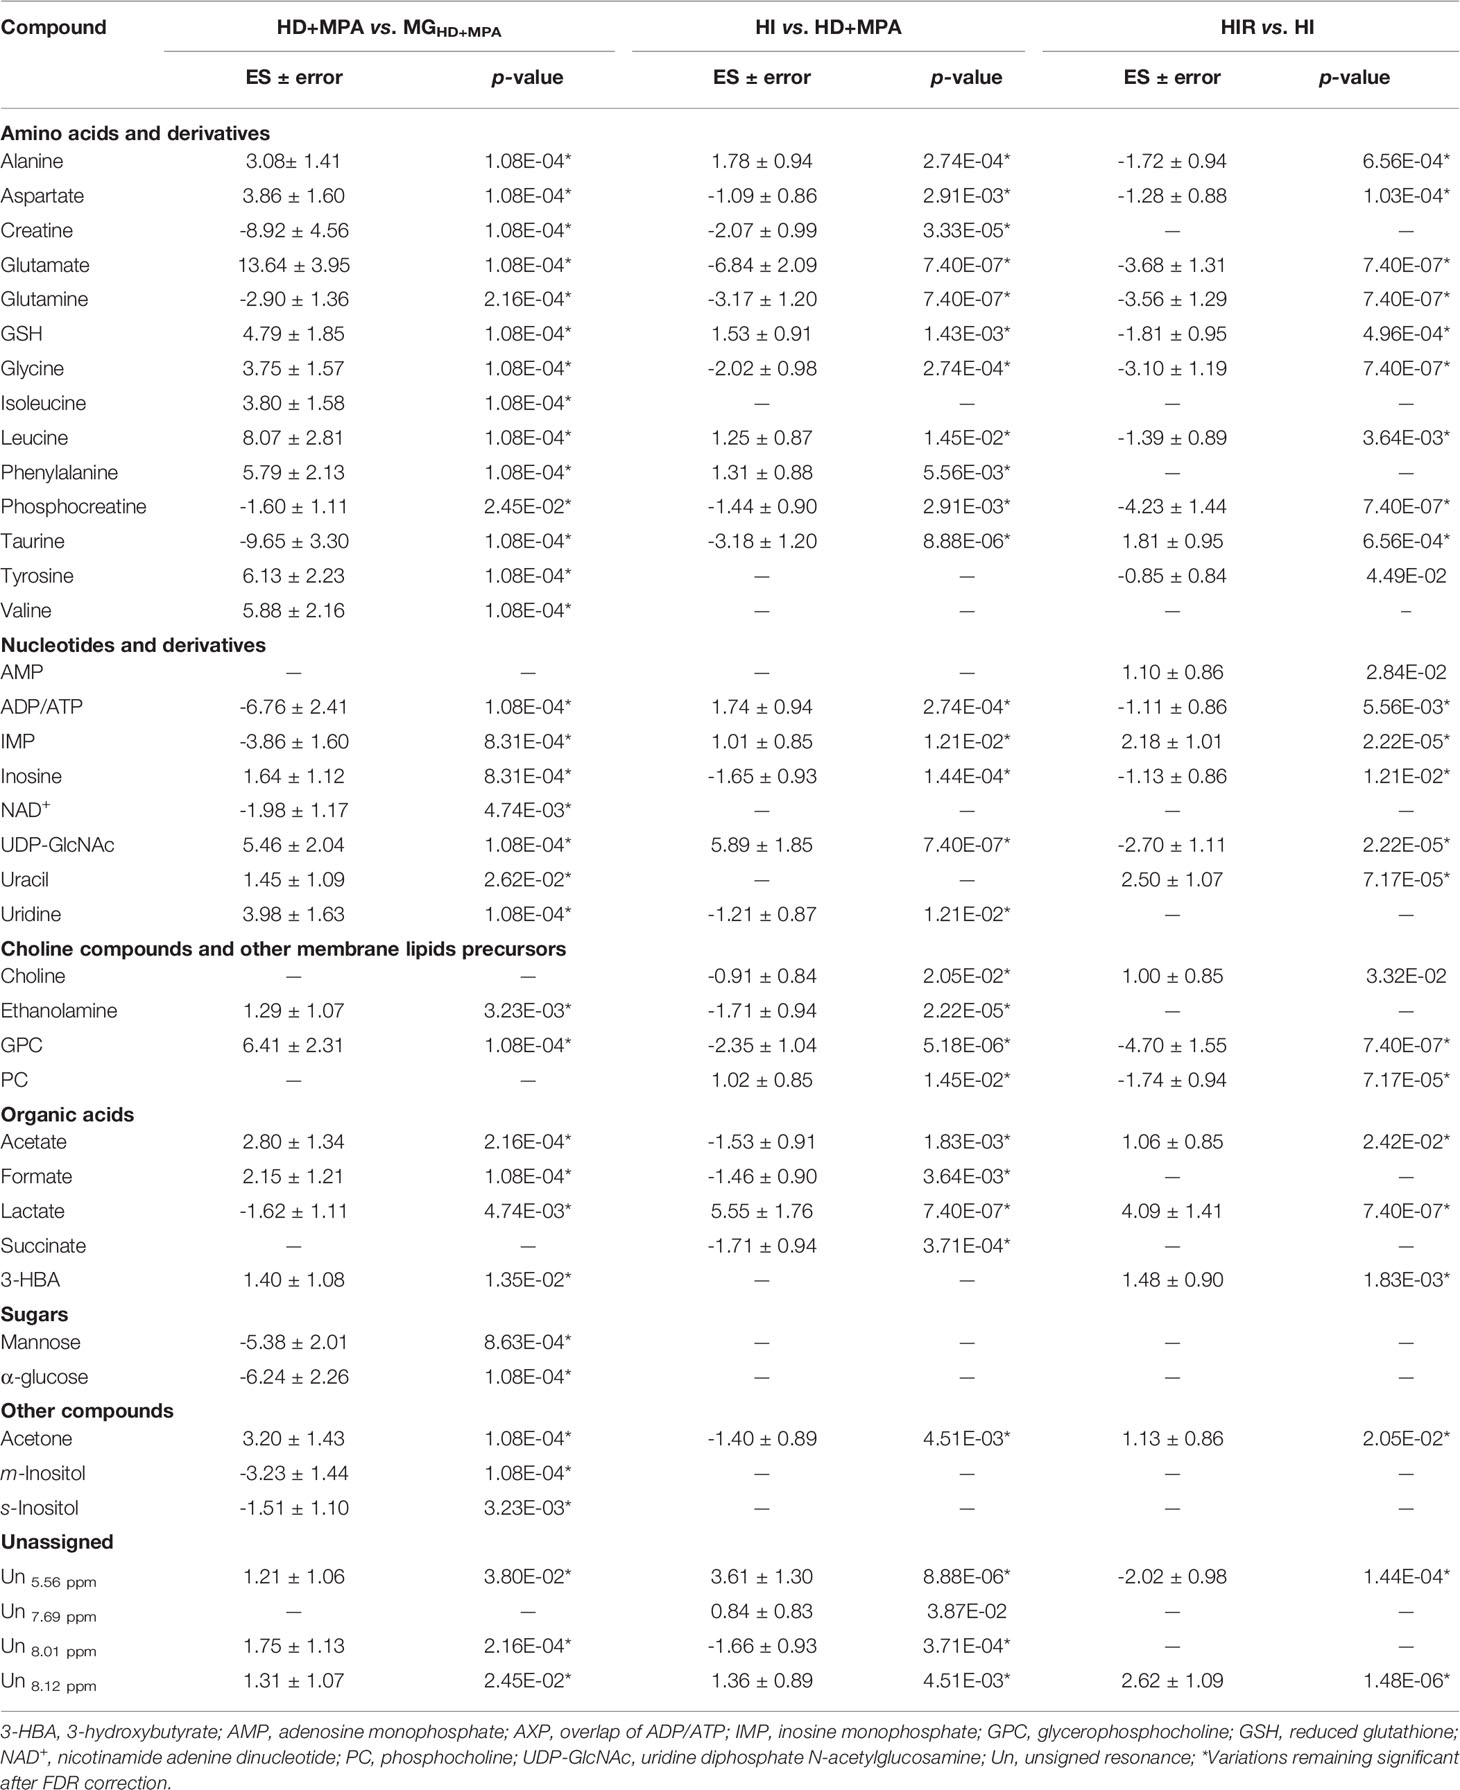
Table 1 Metabolite changes in aqueous extracts of pairwise group comparisons.
Regarding HI tumors, compared to HD+MPA tumors (Figure 4A, top), once again multivariate analysis indicated robust group separation (Q2 = 0.92 for PLS-DA). Regarding amino acids, BCAA are hardly changed (note the absence of changes in isoleucine and valine, with a weak increase in leucine, p-value 0.0145), whereas inversions of variation direction were noted for aspartate (↓), glutamate (↓) (the latter now exhibiting the largest decrease, Figure 4A, bottom) and glycine (↓). In addition, other variation inversions affected ADP and/or ATP (↑), inosine and uridine (↓), ethanolamine (↓), GPC (↓), acetate (↓), formate (↓), and acetone (↓). Notably, UDP-GlcNAc exhibited the largest increase, followed by lactate (Figure 4A, bottom) and, while new weaker changes were noted for choline, PC and succinate, other metabolite levels remained unaltered between HI and HD+MPA tumors, namely, NAD+, uracil, 3-HBA, sugars (mannose and glucose) and inositols.
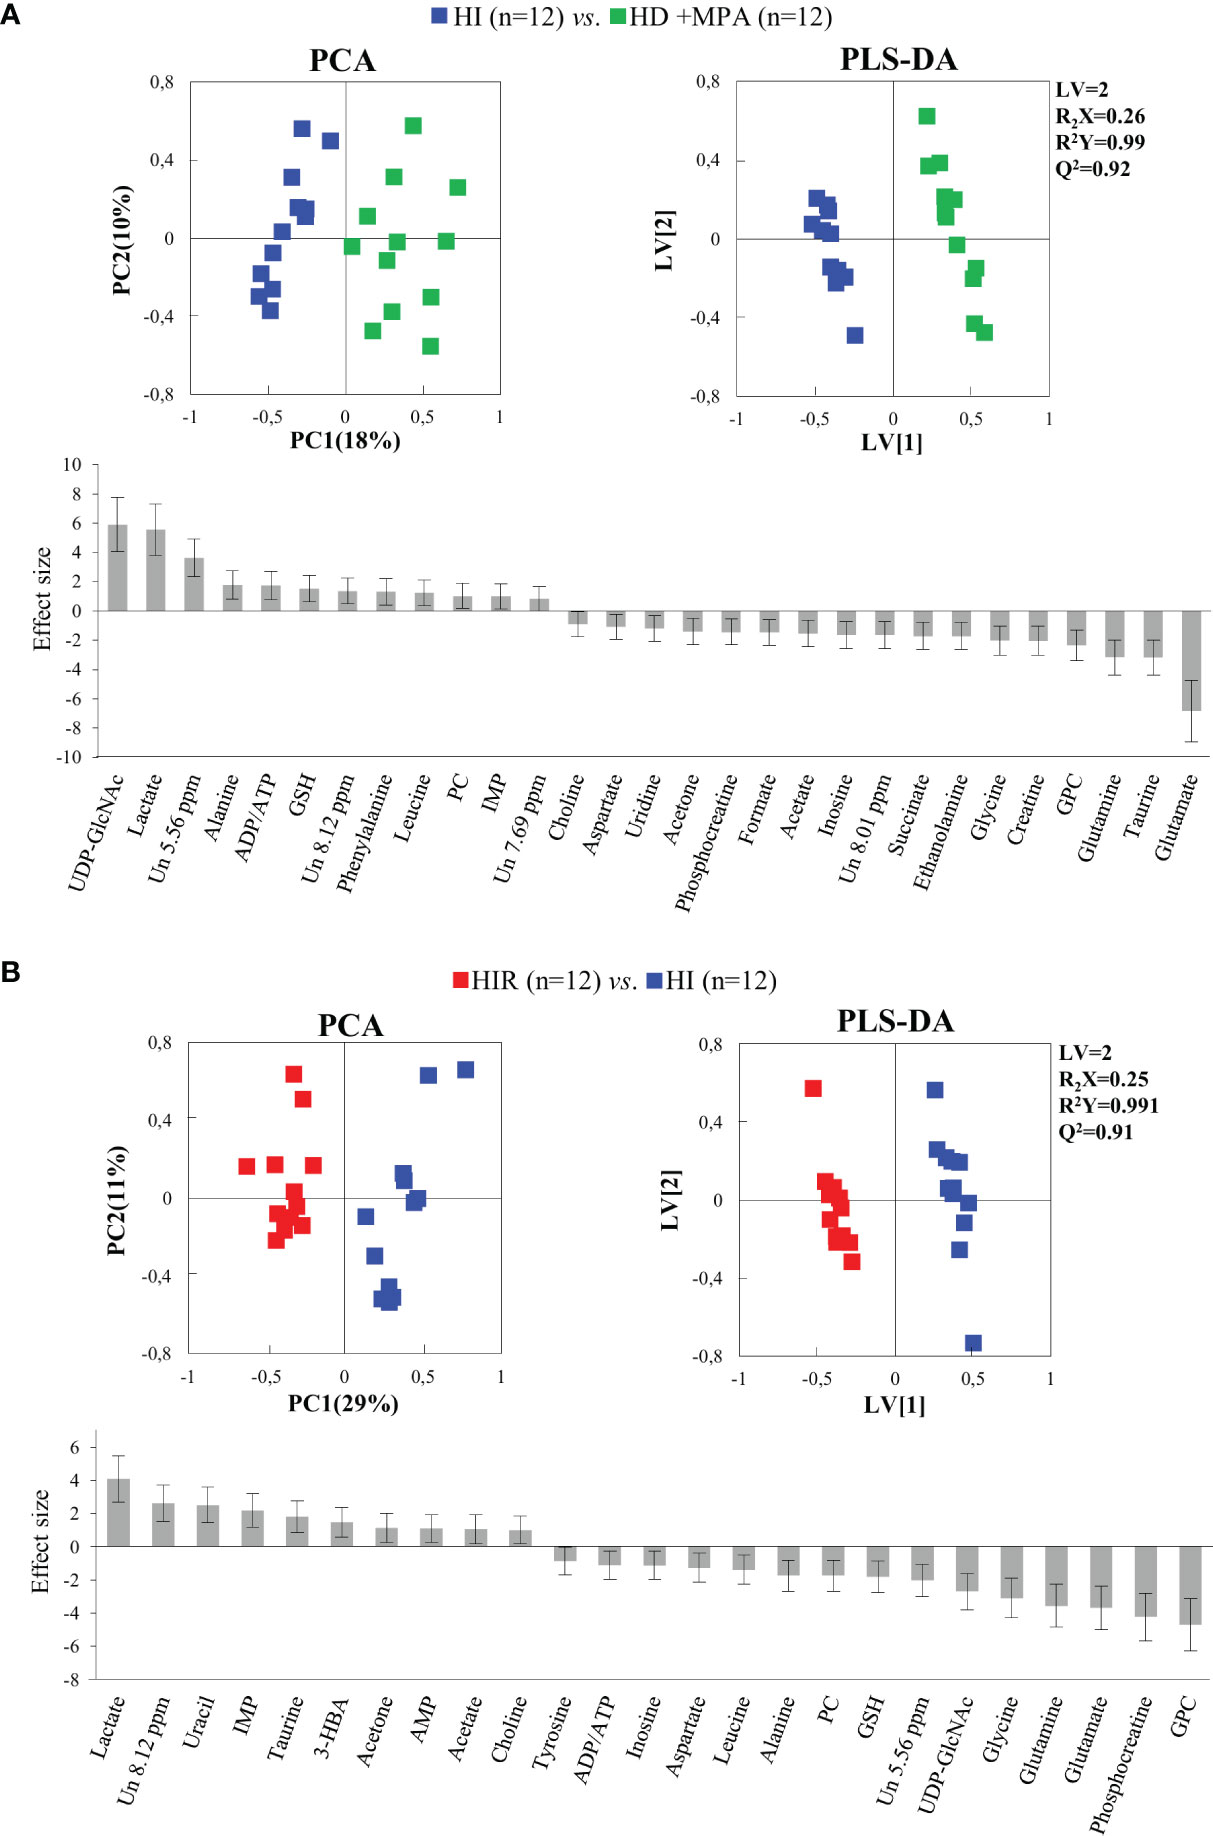
Figure 4 PCA and PLS-DA scatter plots and metabolic variations for acquisition of hormonal independence and acquisition of treatment resistance. (A) PCA and PLS-DA of HI tumors (n = 12) vs. HD+MPA tumors (n = 12) and corresponding metabolic variations expressed by ES; (B) PCA and PLS-DA of HIR tumors (n = 12) vs. HI tumors (n = 12) and corresponding metabolic variations expressed by ES. All abbreviations defined as in Figure 2 caption.
Metabolic profile differences between HI and HIR tumors also became clear in both PCA and PLS-DA scores scatter plots (Figure 4B, top), although now defining a partially distinct signature for the latter (Table 1), where BCAA remained unchanged (except for a slight decrease in leucine), as were creatine, phenylalanine and inositol species. Reversed changes in HIR tumors, compared to HI tumors, affected alanine (↓), GSH (↑), taurine (↑), ADP/ATP (↓), UDP-GlcNAc (↓), PC (↓), acetate (↑), and acetone (↑). Importantly, lactate increase is seen to correspond to the largest positive variation (thus expressing an important continuing increase from HD to HI and to HIR tumors), while significant decreases affected GPC, PCr, glutamate and glutamine (Figure 4B, bottom). The effect size values listed in Table 1 are also illustrated in a heatmap (Figure S2), where it becomes visually clear that HD tumors exhibit changes, compared to MG tissue of the same animals, in a relatively larger number of metabolites in most families (32 identified metabolites), with statistical relevance described by p-values between 0.05 and 0.001. HD to HI, and HI to HIR transitions are accompanied by changes in 25 and 23 metabolites, respectively, in some cases with relatively stronger statistical relevance (p-value < 0.0001).
The trajectories followed by each relevant metabolite are shown in Figure 5 to illustrate firstly, that all tumors may be distinguished from MG tissue mainly by significant increases in BCAA, alanine, glutamate, GPC and GSH, and decreases in creatine, taurine, ATP and/or ADP, IMP, glucose, mannose and m-inositol (while other significant changes characterize lower abundance metabolites, such as glutamine, phenylalanine, tyrosine, uridine and UDP-GlcNAc, Table S2), together with relatively higher GPC/Cr, PC/Cr, Cho/Cr and Glu/Gln ratios (Figure 6) [illustrative ratios discussed in previous tissue studies (31–35)]. Therefore, these changes constitute a differentiating metabolite signature of these mammary carcinomas relatively to MG, independently of their endocrine response.
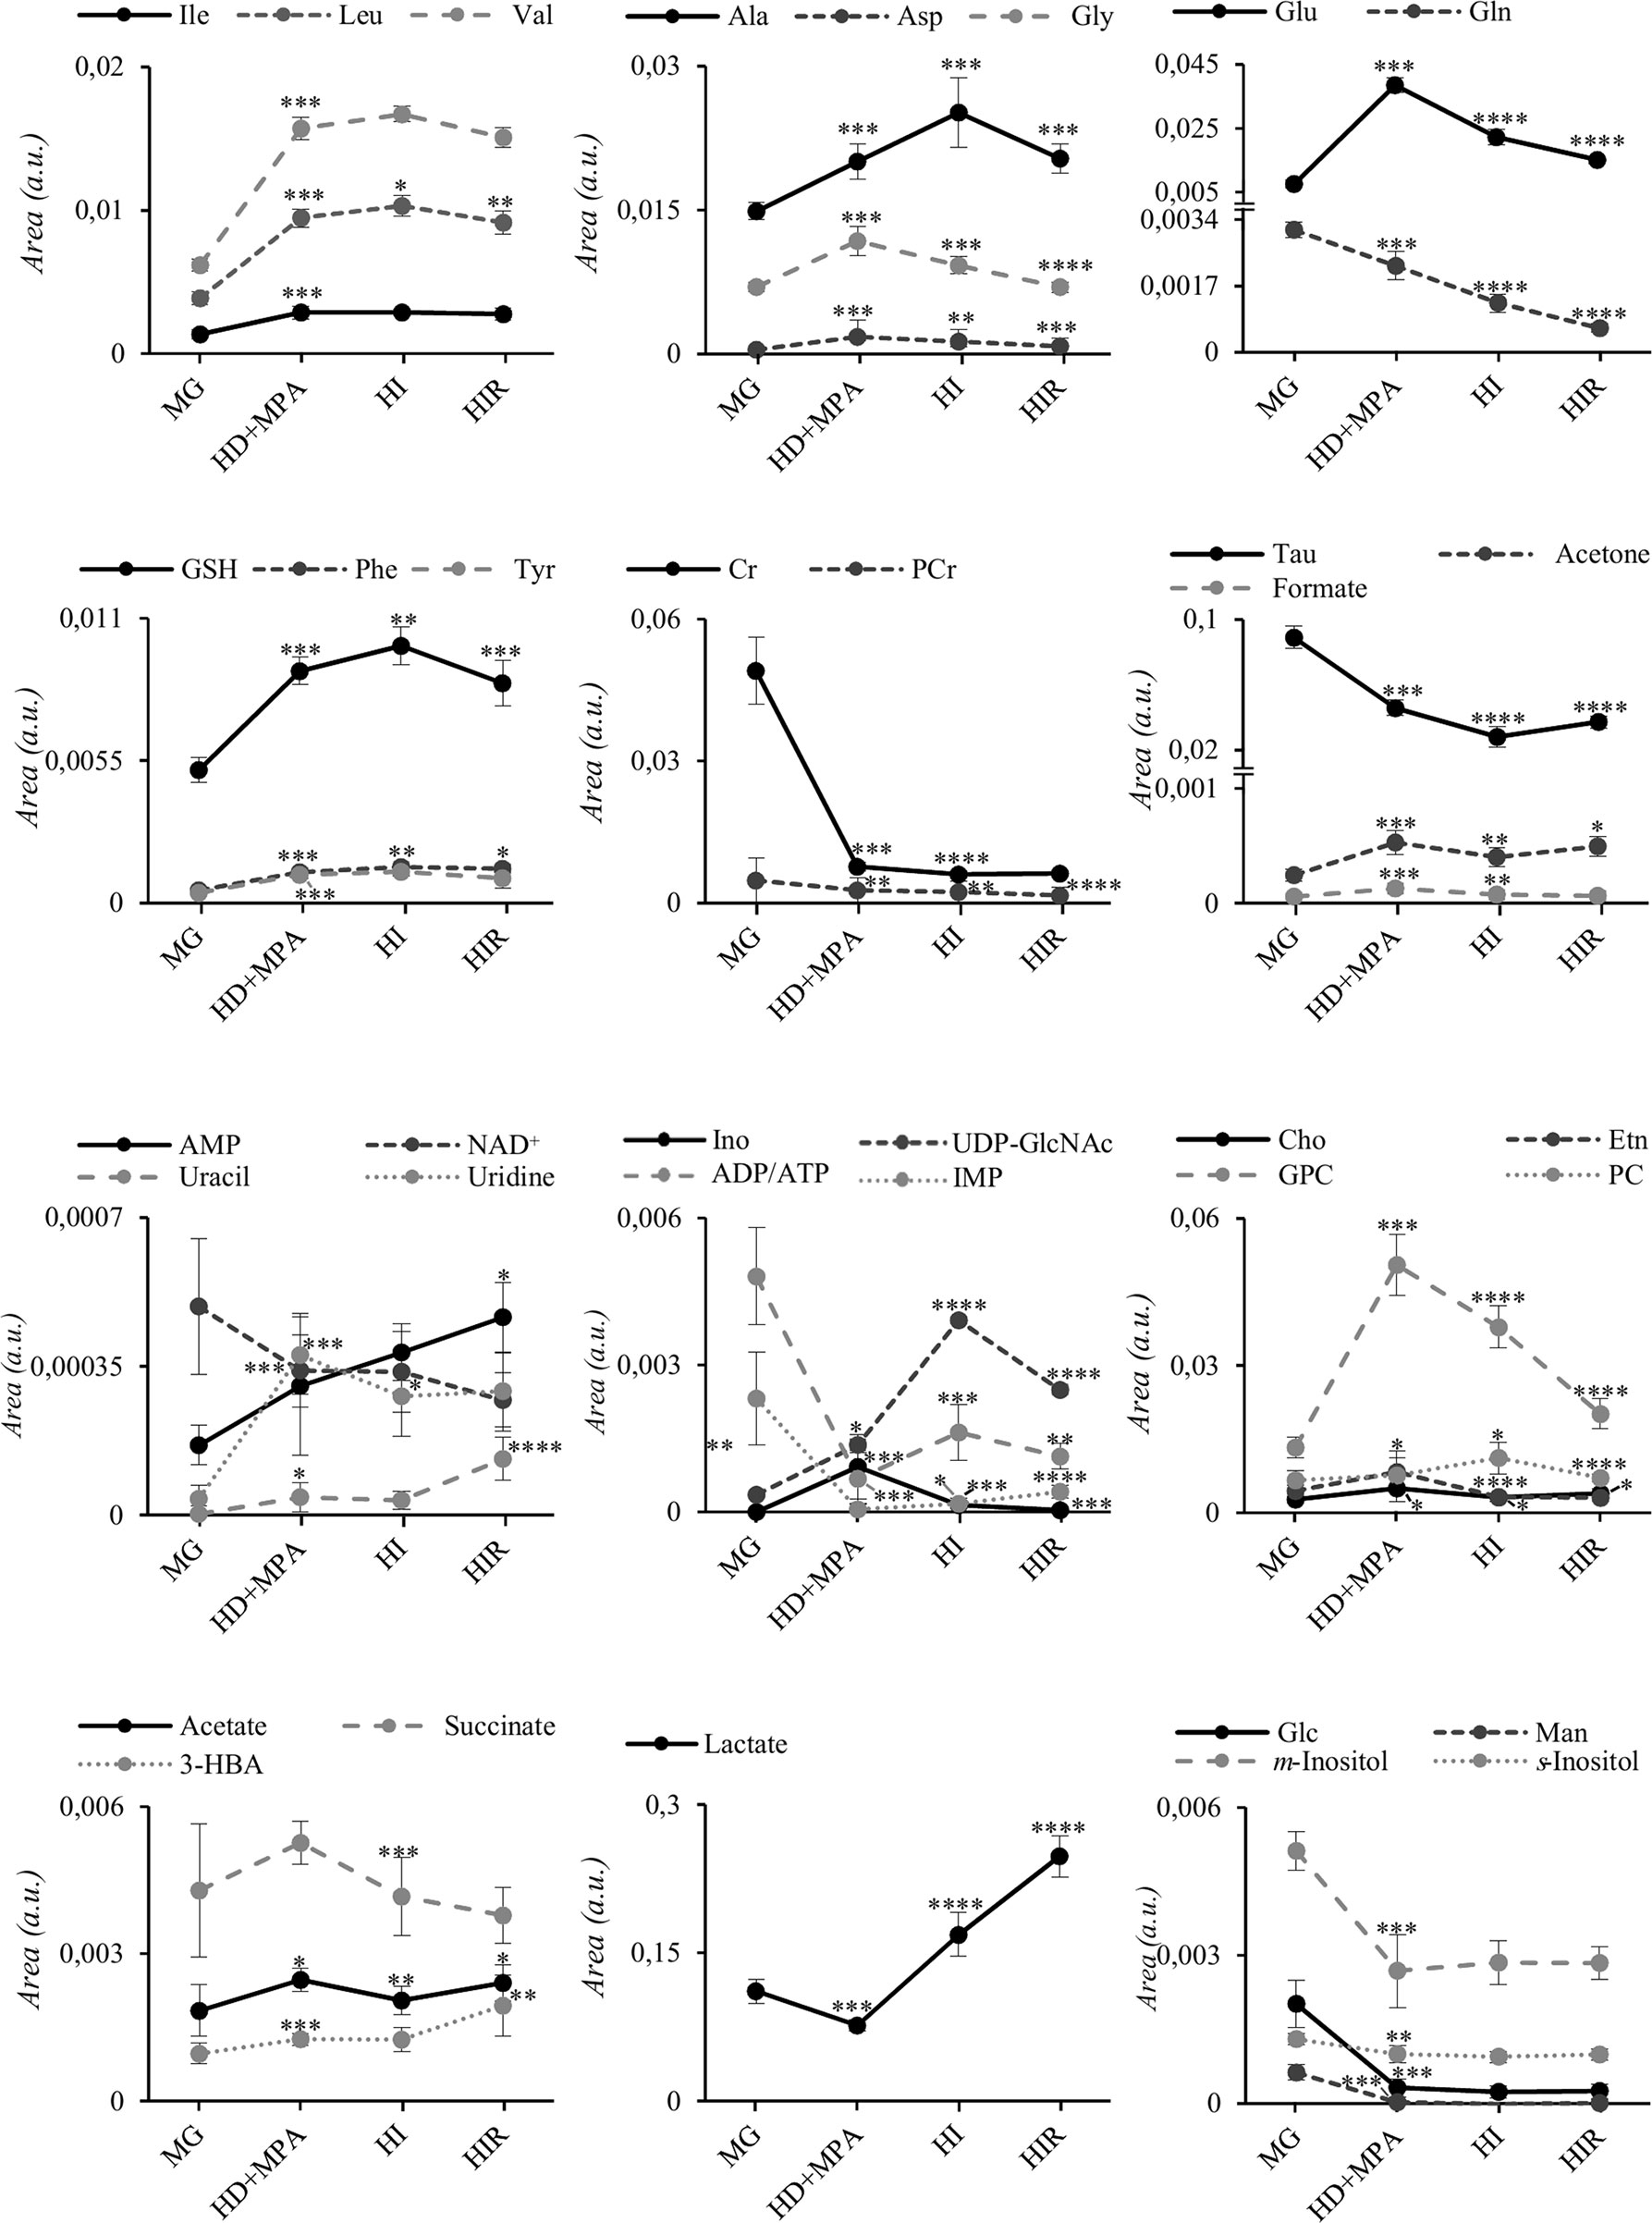
Figure 5 Metabolite trajectories throughout tumor stage progression. Peak areas corresponding to each metabolite were normalized by total spectral area. MG, mammary gland from healthy mice; HD+MPA, hormone-dependent tumor; HI, hormone-independent tumor; HIR, hormone-independent and therapy resistant tumor. *p-value < 0.05; **p-value < 0.01; ***p-value < 0.001; ****p-value < 0.0001. Three-letter code used for amino acids; Cr, creatine; Etn, ethanolamine; Glc, glucose; Ino, inosine; Man, mannose; PCr, phosphocreatine. All other abbreviations are defined as in Figure 2 caption.
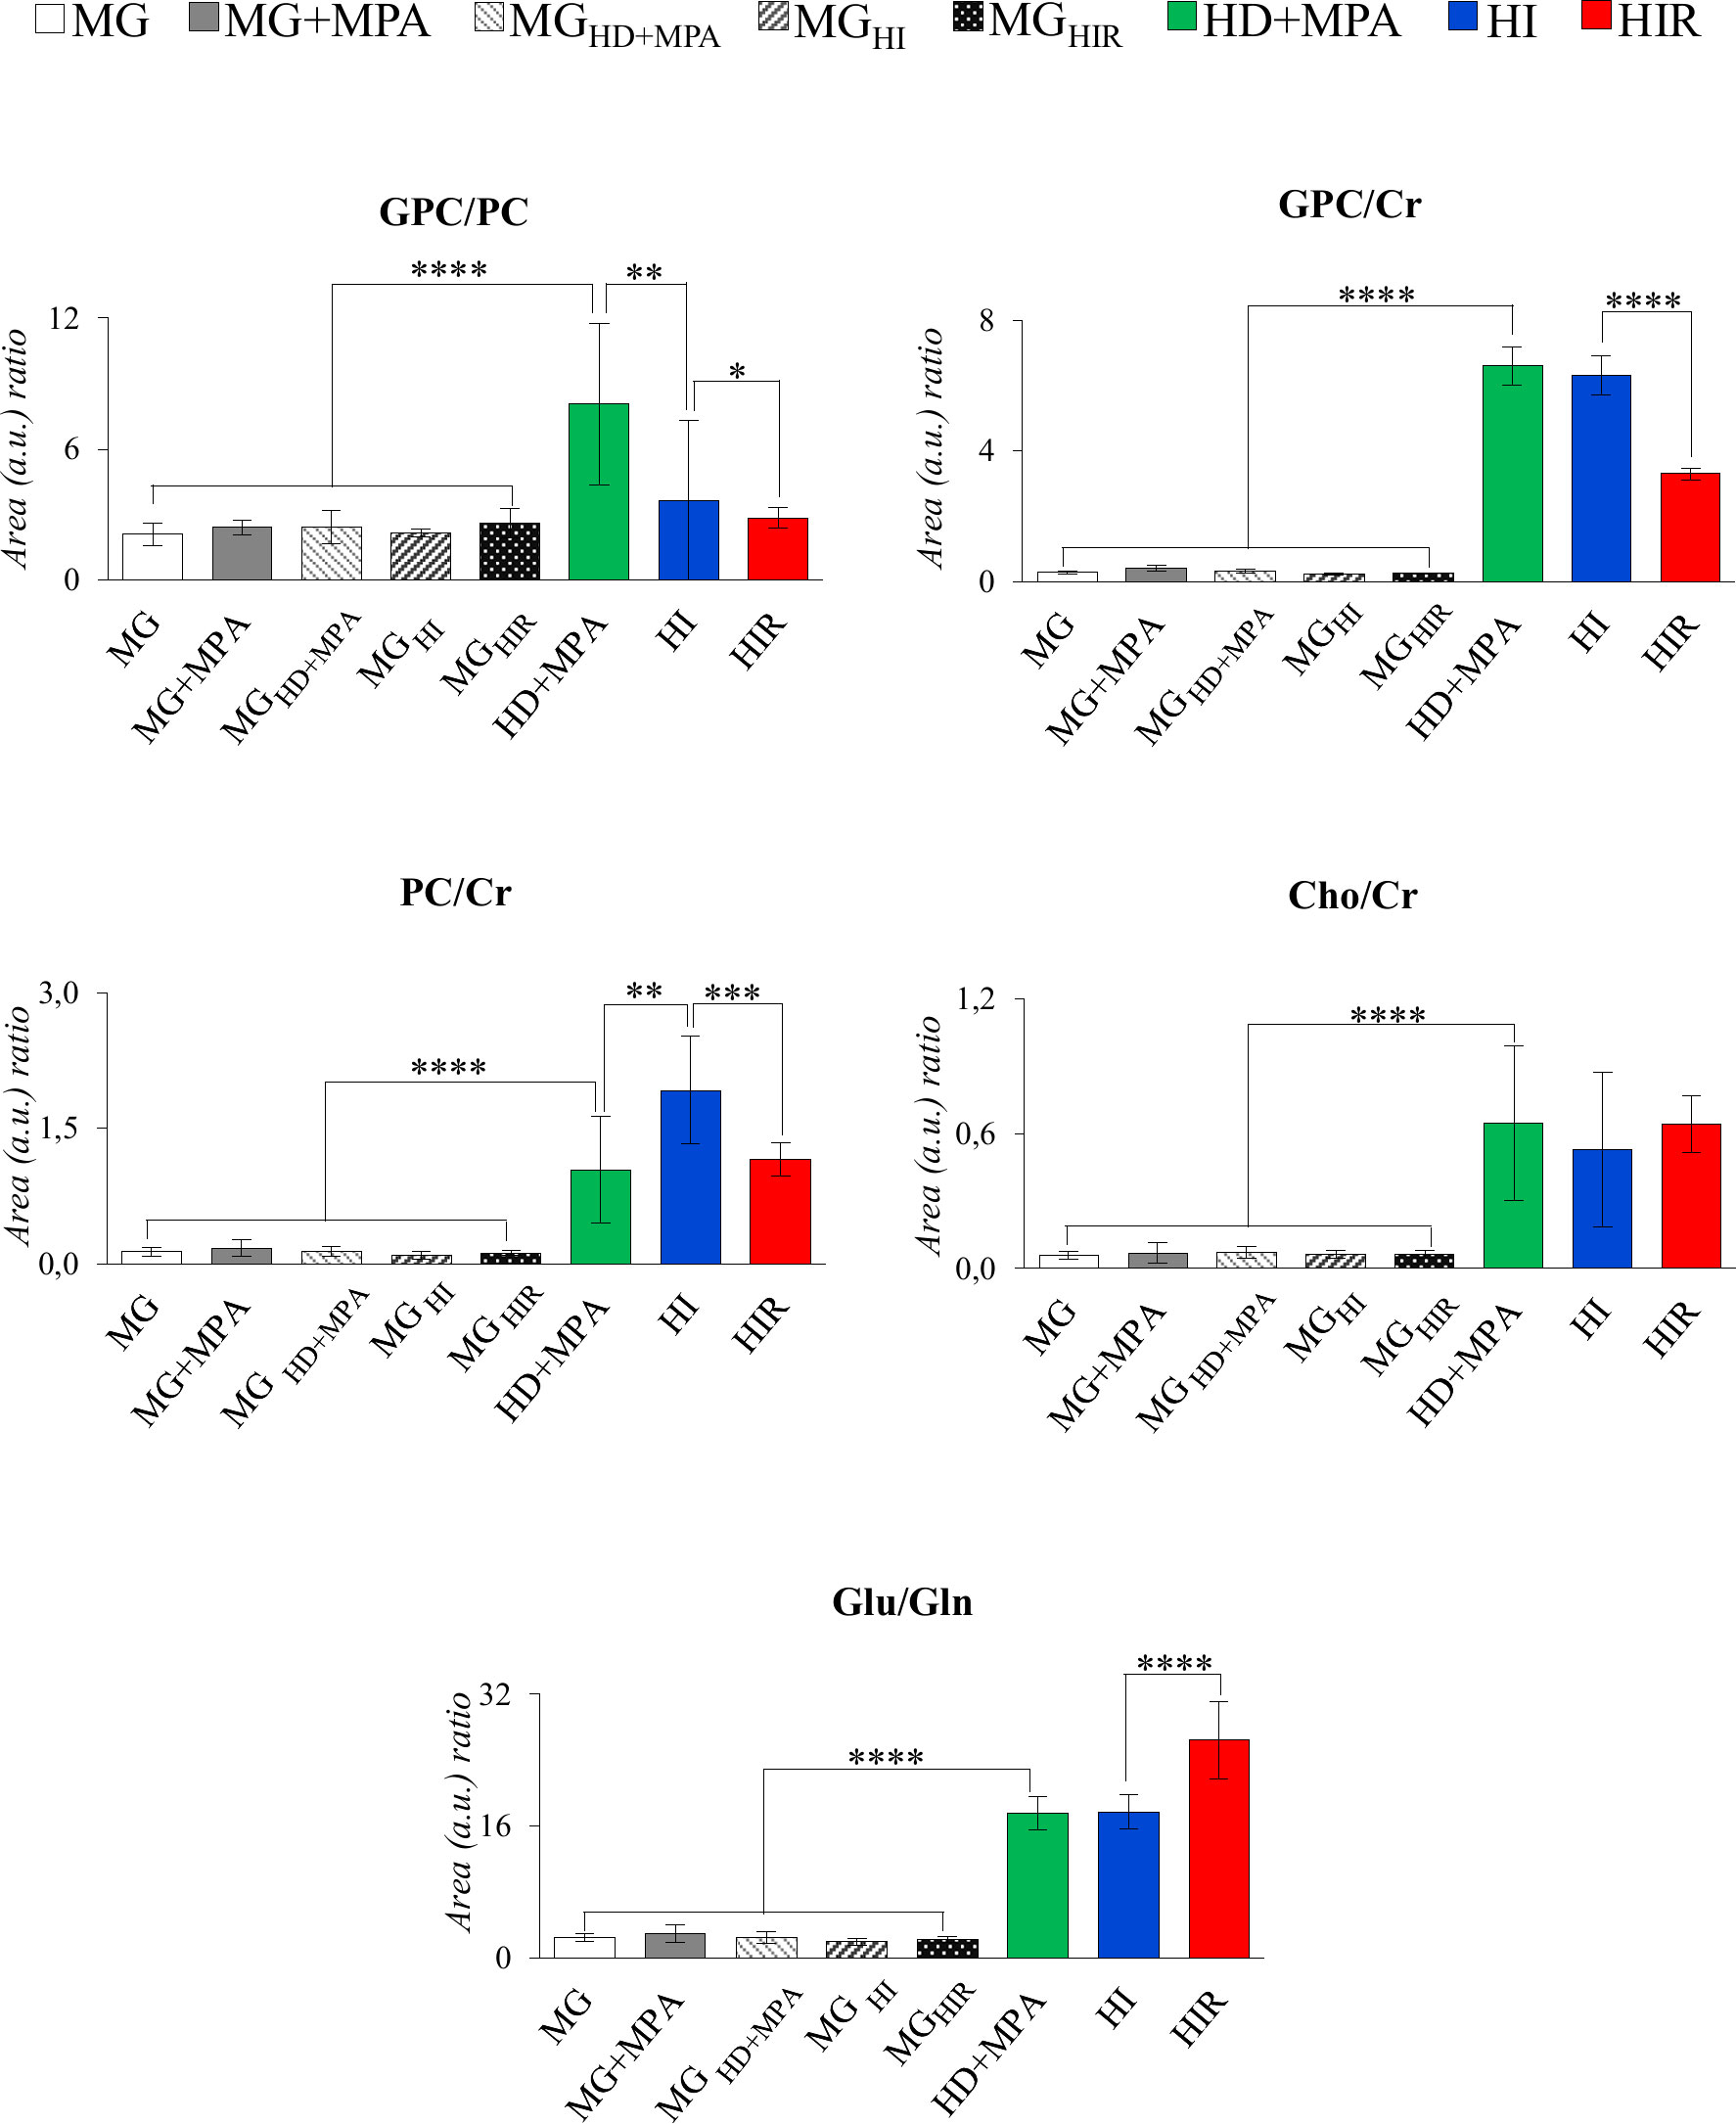
Figure 6 Graphical representation of selected metabolite ratios. All ratios were obtained from the average normalized peak areas. All abbreviations defined as in Figure 2 caption. Asterisks represent the statistical relevance of a certain group compared to the previously represented one: *p-value < 0.05; **p-value < 0.01; ***p-value < 0.001; ****p-value < 0.0001.
In addition, tumor groups with different endocrine responses may be clearly distinguished between each other in terms of single metabolite levels (Figure 5), as follows: i) HD tumors, with higher levels of glycine, glutamate, inosine and GPC, and lower levels of lactate; ii) HI tumors, with higher levels of alanine, UDP-GlcNAc, ATP and/or ADP, and lactate levels intermediate between those of HD and HIR tumors, iii) HIR tumors, with lower levels of GPC and glutamate (though remaining higher than MG), intermediate levels of UDP-GlcNAc (between HD and HI) and maximum levels of lactate. In particular, the relative levels of glutamate, UDP-GlcNAc, GPC, lactate and ATP and/or ADP seem to be capable of differentiating all three types of tumors considered in this study. Further to single metabolite levels, specific metabolite ratios also add to the specific signatures of each tumor type (Figure 6), with i) HD tumors having higher GPC/PC ratios than all other tumors and MG samples, ii) HI tumors having higher PC/Cr ratios than all other samples, and iii) HIR tumors having GPC/Cr ratios intermediate between those in other tumors and MG samples, as well as particularly high levels of Glu/Gln (mainly due to an order of magnitude decrease in glutamine levels, and in spite of the noted decrease in glutamate, Figure 5).
Cancer cells can reprogram their metabolism to support proliferation, invasion, and resistance to anti-cancer therapy (36, 37). This allows them to survive in stressful conditions and reflects the acquisition of oncogenic mutations and epigenetic modifications. Understanding the metabolite changes during cancer progression is relevant for diagnosis, follow-up and treatment, hence, this study addresses three mammary invasive ductal adenocarcinoma tumour lines that express similar levels of ER and PR but respond differently to ET (21), with the aim of characterising the metabolic profiles of neoplastic tissue compared to normal tissue (MG), and disclosing metabolic signatures discriminative of HD, HI and HIR tumors. As expected, metabolite profile differences were of larger magnitude between HD tumours and MG, than during the progression towards hormone-independence and therapy resistance. Nevertheless, interesting characteristic metabolite changes could be identified for each tumour line.
Compared to MG, all tumors, irrespective of their endocrine response, shared higher levels of BCAA, alanine, glutamate, GSH and GPC, and lower levels of creatine, taurine, ATP and/or ADP, IMP, glucose, mannose and m-inositol. Changes in lower concentration metabolites e.g., glutamine, phenylalanine, tyrosine, uridine and UDP-GlcNAc were also observed. It is important to note that the average metabolite changes described above may mask finer characteristics of each different tumor type; however, this group of metabolites may be useful in differentiating healthy and tumoral tissues. Aerobic glycolysis is a hallmark of many cancers (36) and, in this model, there is a high glucose and mannose demand by proliferating cancer cells to sustain glycolysis. Therefore, glutamate dehydrogenase activity would then be responsible for the production of TCA cycle intermediate α-ketoglutarate, consistently with the observed high alanine levels and slightly high lactate levels. Note that lactate levels are strongly tumor type dependent (see below) and only a weak overall increase is noted when all tumors are grouped together. BCAAs are essential amino acids and, thus, need to be internalized from the tumor microenvironment or obtained through protein degradation. Tumor cells express high levels of specific amino acid transporters according to the specific tumor type (38). SLC7A5 (BCAA, Phe and Tyr transporter) is a prognostic factor for breast cancer (39) and is included in the Mammostrat prognosis prediction test for ER-positive breast cancer tumors (40); while, SLC6A14 (transporter of neutral and cationic amino acids) is highly expressed in ER-positive breast cancer tissue and cell lines, and its transcription is under Erα and MYC regulation (41). BCAA activate the mTORC1 pathway to stimulate protein synthesis, tumor growth and survival, but can also be metabolized into branched-chain α-keto acids in a process involving conversion of α-ketoglutarate to glutamate (catalysed by BCAT1 or BCAT2 BCAA transaminase activity), and/or further catabolized to acetyl-CoA and succinyl-CoA that feed into the TCA (42). Thus, we suggest that BCAA internalization in this model is possibly enhanced to feed into the TCA cycle, contributing to the higher levels of glutamate (through BCAA transaminase activity of BCAT enzymes), in tandem with glutaminolysis (through glutaminase, GLS). Indeed, BCAT1 levels have been shown to be elevated in various breast cancer tissues (including invasive carcinoma and intraductal carcinoma) as compared with normal breast tissue (43, 44). In addition, elevated GLS expression has been associated with high grade and metastatic breast cancer (38) and inhibition of GLS activity or gene expression prevents oncogenic transformation (45) and tumor growth (46). Interestingly, the MPA-induced tumors used in this study rely on ER/PR induction of the oncogene MYC to grow, with MYC inhibition resulting in cancer cell death and tumor regression (47, 48). MYC activates transcription of the SLC1A5a glutamine transporter to increase glutamine influx, also activating SLC6A14 (49) and GLS overexpression (49, 50). Glutamate may also help to sustain the high GSH levels in the tumors, to support anti-oxidative stress mechanisms through reactive oxygen species (ROS) detoxification, reducing oxidative damage to protect cells from apoptosis (51). These protective mechanisms may involve taurine (52, 53) and inositol species (54), thus justifying the decrease of these metabolites. On the other hand, the higher taurine and creatine levels in MG, compared to the tumors, could also possibly reflect the higher thermogenic capacity of adipocyte-rich MG tissue, since this tissue has been shown to contain brown adipose tissue (55, 56). Furthermore, the higher levels of creatine relatively to PCr in tumors may reflect the need of the former for ATP synthesis (57), whereas increased choline and choline-containing metabolites are characteristic of cancer tissue. Elevated levels of phosphocholine and glycerophosphocholine have been reported in most types of cancer confirming the importance of choline metabolism in cancer development (35). Choline compounds are usually associated with cell proliferation (58), choline metabolism being controlled by Erα (59) and MYC (60). In this tumor model, GPC increase is the main reason for the noted increased choline ratios (Cho/Cr, GPC/Cr, PC/Cr) and main contribution for higher total choline content. In relation to UDP-GlcNAc levels, we suggest that cancer cells upregulate the hexosamine biosynthetic pathway (HBP), with increased glucose and glutamine uptake as well as oncogenic signals mediated by Ras oncogenes (61) and mTORC2 (62) leading to higher UDP-GlcNAc levels. N-linked and O-linked glycosylation use UDP-GlcNAc as substrate to modify the activity of metabolic enzymes, transcription factors, and several signalling molecules (63). Furthermore, N-glycosylation has been proven to be elevated in elevated in breast cancer primary tumors, as well as in lymph node metastases and distant metastases compared to healthy mammary tissue (64).
However, the main contribution of this work regards the metabolic distinction between tumors characterized by different endocrine responses, here designated by hormone-dependent, hormone-independent/sensitive to therapy and hormone-independent/resistant to therapy (HD, HI and HIR, respectively). In an attempt to illustrate the interplay of relevant active metabolic pathways determining the metabolic profile of each tumor type, Figure 7 illustrates the main changes characterizing each comparison discussed above i.e., MG to HD tumors, HD to HI tumors, and HI to HIR tumors. The reasons for these changes in terms of enzyme activity adaptations remain to be established and this will be the scope of follow-up work. Interestingly, HD tumors show a non-glycolytic metabolic pattern, as glucose (and other sugars) are broken down more extensively than in MG and in the other tumor types but do not translate into higher lactate levels or ADP and/or ATP levels. On the contrary, the decrease of lactate and ADP and/or ATP suggests the absence of the Warburg effect and no particular enhancement of TCA cycle activity in HD tumors. It is possible, therefore, that glucose is preferentially used as precursor of protein/lipid glycosylation processes, through the synthesis of UDP-GlcNAc as explained above. In relation to glutamine metabolism, it appears that HD tumors maintain glutamine levels. The glutamine transporters SLC1A5 and SLC6A14 are highly expressed in ER-positive breast cancer as they are under transcriptional control of ER and MYC. Therefore, glutamine levels are maintained through thehosphn of these transporters to activate glutamate synthesis (glutamate reaches a maximum level in HD vs other tumors), as well as to feed the TCA cycle and produce GSH. Relatively high GPC levels (and high GPC/PC ratio) clearly distinguish HD tumors from the remaining types, GPC levels remaining above those characteristic of MG tissue. Indeed, the interplay of GPC and other membrane lipid precursors is clearly dependent on tumor type. As comparable degrees of cell proliferation are expected for all tumors as they were all excised in the exponential growth phase, and therefore hosphatidylcholine biosynthesis would be maintained relatively unchanged, these differences between tumors may relate to increasing capacity of organelles such as the endoplasmic reticulum (see below).
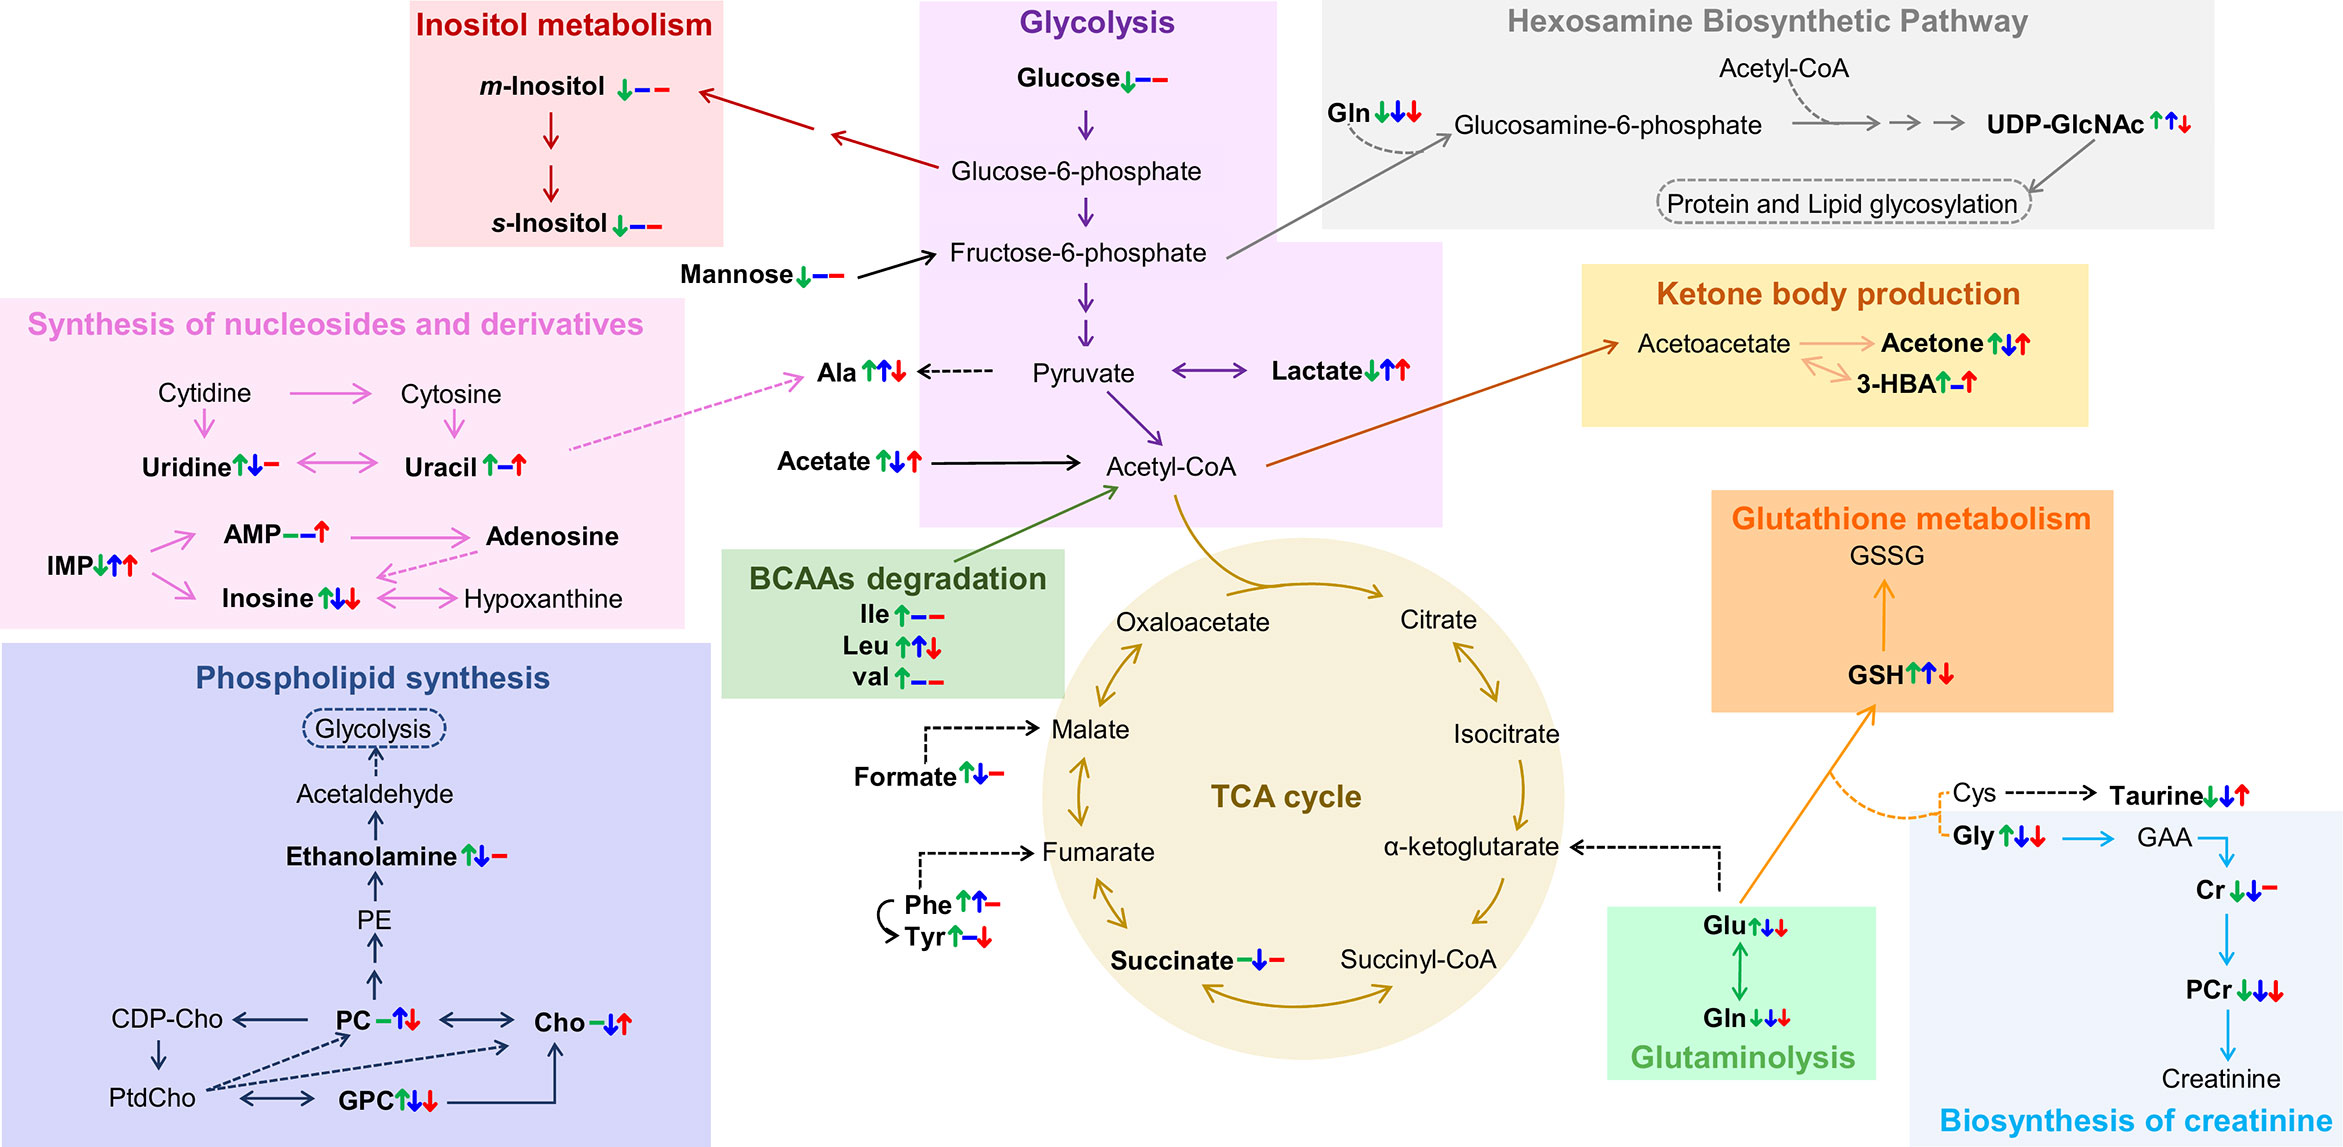
Figure 7 Metabolic pathways putatively identified as the main metabolic adaptations found between polar extracts of MGHD+MPA, HD+MPA, HI and HIR tissues. Metabolite names in bold identify compounds detected by NMR (irrespective of their variation). Colored arrows (↓↑) and dashes (-) indicated after a metabolite name illustrate variations corresponding to each pairwise comparison, following the order: HD+MPA vs MGHD+MPA (left symbol), HI vs HD+MPA (middle symbol), and HIR vs HI (right symbol). Three letter code were used for amino acids; CDP-Cho, cytidine diphosphate-choline; GAA, guanidoacetate; PE, phosphoethanolamine; PtdCho, phosphatidylcholine, all other abbreviations defined as in Figure 2 caption.
The development of HI tumors seems to involve the production of higher levels of lactate and alanine levels. These tumors are, thus, more glycolytic (increase in lactate) than HD tumors and MG. Aerobic glycolysis has been shown to be associated with the resistance to chemotherapy and ET resistance. In particular, tamoxifen resistance is associated with enhanced glycolysis in ER-positive breast cancer cells through activation of EGFR/MAPK pathway (65, 66), a pathway also responsible for ligand-independent Erα activation (37) In the MPA-induced tumor model, the FGF-2/FGFR-2 axis drives HI growth (67). This is mediated by ligand-independent Erα and PR activation, followed by their induction of MYC expression and was also verified in human breast cancer cells (48). FGFR signalling leading to MYC activation has been shown to induce glycolytic enzymes necessary for vascular development (68), while MYC itself also induces the expression of many glycolytic enzymes. Thus, increased glycolysis resulting from MYC-dependency is somewhat expected in this model. Additionally, the low glucose levels may be indicative, not only of enhanced glycolysis activity, but also of enhanced conversion (together with acetyl-CoA) into UDP-GlcNAc, which shows its highest level in HI tumors; consistently, uridine and uracil levels (needed for UTP biosynthesis later used for UDP-GlcNAc) are kept low in HI tumors, possibly to support the more significant glycosylation processes apparently characterizing such tumors. In agreement with our findings, a previous microarray comparing C4-HD and C4-HI tumours found upregulation of glutamine-fructose-6-phosphate aminotransferase 2 (GFPT2, which controls the flux of glucose into the hexosamine pathway) (22). The fact that UDP-GlcNAc is upregulated in HI tumors is very interesting as this is the precursor of O-glycosylation that has been shown to occur in ER and PR to promote hormone-independent activation (69, 70). HI tumors exhibit intermediate glutamate levels, which may indicate an enhanced uptake of this amino acid into the TCA cycle but also higher glutathione synthase (GSS) activity as these tumors also have higher GSH than the other tumor types. A statistically relevant increase in PC (and specifically high PC/Cr ratios) again reflects the distinct membrane metabolism characteristics of each tumor type. It is possible that at least some of the above distinguishing features between HD and HI tumors, e.g. altered amino acid metabolism (20, 71, 72), may be relatable to the higher metastatic behavior of the latter tumors (21), although such possibility requires further investigation.
Finally, the hormone-independent tumors which have become resistant to therapy, HIR, are the most glycolytic tumors, reaching the highest lactate levels, while maintaining glucose levels low. This strong glycolytic nature is consistent with the specifically high Glu/Gln ratio, due to a marked decrease in glutamine, identifying active glutaminolysis as an additional feature of HIR tumors. Therefore, and as mentioned previously, the metabolic dependency on glucose and glutamine that was clear for HI tumors and associated with resistance to ET and FGFR driven MYC expression, becomes enhanced in HIR tumors. Moreover, HIR tumors exhibit similar levels of GSH, taurine and m-inositol to other tumors, indicating similar extension of active anti-oxidative mechanisms also associated with ET resistance (73), however they are distinguished by the lowest glutamate levels (and low alanine) within the tumors, which possibly are consumed to produce GSH. UDP-GlcNAc is also upregulated in HIR but to a lesser extent than in HI tumors maintaining a relevant protein glycosylation activity; still, it is worth mentioning that endocrine resistant breast cancer cells increase their endoplasmic reticulum capacity (through the activation of unfolded protein response), which is one of the major cellular organelles where protein glycosylation occurs (74, 75). In HIR tumors, the lowest GPC levels (within the tumors) again seems to reflect a distinct status of membrane metabolism where lower GPC may be the result of higher phospholipid (phosphatidylcholine, main membrane constituent) synthesis. Again, potentially different metastatic status may relate to the signature differences described above, although such feature could not be evaluated for HIR tumors, due to their rapid growth and subsequent early sacrifice of the animals (before metastasis could occur or be detected) (76). This possible relationship between metabolite signatures and tumor metastatic status is of large interest in BC research and requires further investigation.
Our results show, for the first time to our knowledge, that different endocrine response of MPA-induced breast tumors clearly relate to distinct metabolic signatures. Several pathways are observed to adapt to each of HD, HI and HIR status, mainly with the involvement of selected amino acids, nucleotides, choline compounds and sugars. In particular, the relative levels of glutamate, UDP-GlcNAc, GPC and lactate seem to be capable of differentiating all three types of tumors, with HIR tumors showing a relatively stronger glycolytic profile, specific membrane metabolism pattern and an extent of O-glycosylation processes which is intermediate to HD and HI tumors. While our results unveil the importance of metabolic adaptations and potential metabolic markers to distinguish different endocrine responses and, in particular, therapy resistance in breast tumors, the present study has some limitations, which should be addressed in future follow-up work, namely the use of relative metabolite levels instead of absolute concentrations (which are difficult to assess efficiently by NMR of complex mixtures but feasible by other more targeted analytical methods), and the awareness that the metabolic profiles identified here reflect the tumors as a whole, thus globally representing the heterogeneous population of cell types in the tumor microenvironment. The relationship between metabolic profile and cell distribution in both environments would be an interesting follow-up step in understanding the hereby presented metabolic adaptations and relationship to resistance. Furthermore, given the recognized relevance of the MPA-model to the human disease, the translation of these results to human subjects is a necessary step and a subject of ongoing work in our group.
The original contributions presented in the study are included in the article/Supplementary Material. Further inquiries can be directed to the corresponding authors.
All animal procedures were performed at the IByME Animal facility and approved by the local Institutional Animal Care and Use Committee (Approval no. 030/2016, dated 24 June 2016), complying with regulatory standards of animal ethics.
RA: experimental design, data acquisition and processing; data analysis, writing of first draft, editing, and finalization of paper. VF: experimental design, sampling, and editing and finalization of paper. CaL: experimental design, sampling, and editing and finalization of paper. ClL: conceptualization, experimental design, sampling, editing and finalization of paper, and funding acquisition. LH: conceptualization, experimental design, data analysis, writing of first draft, and editing and finalization of paper, funding acquisition. AG: conceptualization, experimental design, data analysis, writing of first draft, editing and finalization of paper, and funding acquisition. All authors contributed to the article and approved the submitted version.
This work was developed within the scope of the project CICECO-Aveiro Institute of Materials, UIDB/50011/2020, UIDP/50011/2020 & LA/P/0006/2020, financed by national funds through the FCT/MEC (PIDDAC). AG acknowledges the Portuguese National NMR Network (RNRMN), supported by FCT funds, and RA thanks RNRMN for her grant through the Doctoral Program in NMR applied to Chemistry, Materials and Biosciences – PTNMRPhD (PD/00065/2013). The authors also acknowledge financial support from the Portuguese Foundation for Science and Technology through projects UIDB/04501/2020, UIDP/04501/2020, MEDISIS (CENTRO-01-0246-FEDER-000018) and pAGE (CENTRO-01-0145-FEDER-000003) project cofounded through the Comissão de Coordenação e Desenvolvimento Regional do Centro and COMPETE 2020 program and European Union fund FEDER (LH). The authors also acknowledge the Agencia Nacional de Promoción Científica y Tecnológica, Argentina (ANPCYT); grant PICT 2017-2073 (CL).
The authors declare that the research was conducted in the absence of any commercial or financial relationships that could be construed as a potential conflict of interest.
All claims expressed in this article are solely those of the authors and do not necessarily represent those of their affiliated organizations, or those of the publisher, the editors and the reviewers. Any product that may be evaluated in this article, or claim that may be made by its manufacturer, is not guaranteed or endorsed by the publisher.
The Supplementary Material for this article can be found online at: https://www.frontiersin.org/articles/10.3389/fonc.2022.786931/full#supplementary-material
Supplementary Figure 1 | PCA and PLS-DA scores plots of the NMR spectra of polar extracts from HD, HI and HIR tumors.
Supplementary Figure 2 | Heatmap of metabolite variations characterizing tissues from MG, to HD, HI and HIR tumors.
1. Dai X, Cheng H, Bai Z, Li J. Breast Cancer Cell Line Classification and Its Relevance With Breast Tumor Subtyping. J Cancer (2017) 8:16. doi: 10.7150/jca.18457
2. Zattarin E, Leporati R, Ligorio F, Lobefaro R, Vingiani A, Pruneri G, et al. Hormone Receptor Loss in Breast Cancer: Molecular Mechanisms, Clinical Settings, and Therapeutic Implications. Cells (2020) 9:12. doi: 10.7150/jca.18457
3. Morandi A, Indraccolo S. Linking Metabolic Reprogramming to Therapy Resistance in Cancer. Biochim Biophys Acta Rev Cancer (2017) 1868:1. doi: 10.1016/j.bbcan.2016.12.004
4. Brisken C. Progesterone Signaling in Breast Cancer: A Neglected Hormone Coming Into the Limelight. Nat Rev Cancer (2013) 13:6. doi: 10.1038/nrc3518
5. Lamb CA, Fabris VT, Jacobsen BM, Molinolo A, Lanari C. Biological and Clinical Impact of Imbalanced Progesterone Receptor Isoform Ratios in Breast Cancer. Endocr Relat Cancer (2018) 25:12. doi: 10.1530/erc-18-0179
6. Horwitz KB, Sartorius CA. 90 Years of Progesterone: Progesterone and Progesterone Receptors in Breast Cancer: Past, Present, Future. J Mol Endocrinol (2020) 65:1. doi: 10.1530/JME-20-0104
7. Lanari C, Wargon V, Rojas P, Molinolo AA. Antiprogestins in Breast Cancer Treatment: Are We Ready? Endocr Relat Cancer (2012) 3:19. doi: 10.1530/ERC-11-0378
8. Ferreira Almeida C, Oliveira A, João Ramos M, Fernandes PA, Teixeira N, Amaral C. Estrogen Receptor-Positive (ER+) Breast Cancer Treatment: Are Multi-Target Compounds the Next Promising Approach? Biochem Pharmacol (2020) 177:113989. doi: 10.1016/j.bcp.2020.113989
9. Shajahan-Haq AN, Cook KL, Schwartz-Roberts JL, Eltayeb AE, Demas DM, Warri AM, et al. MYC Regulates the Unfolded Protein Response and Glucose and Glutamine Uptake in Endocrine Resistant Breast Cancer. Mol Cancer (2014) 13:239. doi: 10.1186/1476-4598-13-239
10. Green AR, Aleskandarany MA, Agarwal D, Elsheikh S, Nolan CC, Diez-Rodriguez M, et al. MYC Functions Are Specific in Biological Subtypes of Breast Cancer and Confers Resistance to Endocrine Therapy in Luminal Tumours. Br J Cancer (2016) 114:8. doi: 10.1038/bjc.2016.46
11. Gandhi N, Das GM. Metabolic Reprogramming in Breast Cancer and Its Therapeutic Implications. Cells (2019) 8:2. doi: 10.3390/cells8020089
12. Shajahan-Haq AN, Boca SM, Jin L, Bhuvaneshwar K, Gusev Y, Cheema AK, et al. EGR1 Regulates Cellular Metabolism and Survival in Endocrine Resistant Breast Cancer. Oncotarget (2017) 8:57. doi: 10.18632/oncotarget.18292
13. Kim HS, Tian L, Kim H, Moon WK. Investigation of Discriminant Metabolites in Tamoxifen-Resistant and Choline Kinase-Alpha-Downregulated Breast Cancer Cells Using 1h-Nuclear Magnetic Resonance Spectroscopy. PloS One (2017) 12:6. doi: 10.1371/journal.pone.0179773
14. Du T, Sikora MJ, Levine KM, Tasdemir N, Riggins RB, Wendell SG, et al. Key Regulators of Lipid Metabolism Drive Endocrine Resistance in Invasive Lobular Breast Cancer. Breast Cancer Res (2018) 20:1. doi: 10.1186/s13058-018-1041-8
15. Bacci M, Lorito N, Ippolito L, Ramazzotti M, Luti S, Romagnoli S, et al. Reprogramming of Amino Acid Transporters to Support Aspartate and Glutamate Dependency Sustains Endocrine Resistance in Breast Cancer. Cell Rep (2019) 28:1. doi: 10.1016/j.celrep.2019.06.010
16. Cotul EK, Zuo Q, Santaliz-Casiano A, Imir OB, Mogol AN, Tunc E, et al. Combined Targeting of Estrogen Receptor Alpha and Exportin 1 in Metastatic Breast Cancers. Cancers (Basel) (2020) 12:9. doi: 10.3390/cancers12092397
17. Anderson E. The Role of Oestrogen and Progesterone Receptors in Human Mammary Development and Tumorigenesis. Breast Cancer Res (2002) 4:5. doi: 10.1186/bcr452
18. Giulianelli S, Molinolo A, Lanari C. Targeting Progesterone Receptors in Breast Cancer. Vitam Horm (2013) 93:1. doi: 10.1016/B978-0-12-416673-8.00009-5
19. Giulianelli S, Lamb CA, Lanari C. Progesterone Receptors in Normal Breast Development and Breast Cancer. Essays Biochem (2021) 1:EBC20200163. doi: 10.1042/EBC20200163
20. Bispo D, Fabris V, Lamb CA, Lanari C, Helguero LA, Gil AM. Hormone-Independent Mouse Mammary Adenocarcinomas With Different Metastatic Potential Exhibit Different Metabolic Signatures. Biomolecules (2020) 10:9. doi: 10.3390/biom10091242
21. Lanari C, Lamb CA, Fabris VT, Helguero LA, Soldati R, Bottino MC, et al. The MPA Mouse Breast Cancer Model: Evidence for a Role of Progesterone Receptors in Breast Cancer. Endocr Relat Cancer (2009) 16:2. doi: 10.1677/ERC-08-0244
22. Giulianelli S, Herschkowitz JI, Patel V, Lamb CA, Gutkind JS, Molinolo A, et al. MPA-Induced Gene Expression and Stromal and Parenchymal Gene Expression Profiles in Luminal Murine Mammary Carcinomas With Different Hormonal Requirements. Breast Cancer Res Treat (2011) 129:1. doi: 10.1007/s10549-010-1185-4
23. Araújo R, Bispo D, Helguero LA, Gil AM. Metabolomic Studies of Breast Cancer in Murine Models: A Review. Biochim Biophys Acta Mol Basis Dis (2020) 1866:5. doi: 10.1016/j.bbadis.2020.165713
24. Carneiro TJ, Araújo R, Vojtek M, Gonçalves-Monteiro S, Diniz C, Batista de Carvalho ALM, et al. Multi-Organ NMR Metabolomics to Assess In Vivo Overall Metabolic Impact of Cisplatin in Mice. Metabolites (2019) 9:11. doi: 10.3390/metabo9110279
25. Wishart DS, Feunang YD, Marcu A, Guo AC, Liang K, Vázquez-Fresno R, et al. HMDB 4.0: The Human Metabolome Database for 2018. Nucleic Acids Res (2018) 46:(D1). doi: 10.1093/nar/gkx108
26. Benjamini Y, Hochberg Y. Controlling the False Discovery Rate: A Practical and Powerful Approach to Multiple Testing. J R Stat Soc Ser B Stat Methodol (1995) 57:1. doi: 10.2307/2346101
27. Whitehead TL, Holley AW, Korourian S, Shaaf S, Kieber-Emmons T, Hakkak R. (1)H Nuclear Magnetic Resonance Metabolomic Analysis of Mammary Tumors From Lean and Obese Zucker Rats Exposed to 7,12-Dimethylbenz[a]Anthracene. Int J Mol Med (2007) 20:4. doi: 10.1186/bcr1263
28. Park VY, Yoon D, Koo JS, Kim EK, Kim SI, Choi JS, et al. Intratumoral Agreement of High-Resolution Magic Angle Spinning Magnetic Resonance Spectroscopic Profiles in the Metabolic Characterization of Breast Cancer. Med (Baltimore) (2016) 95:15. doi: 10.1097/MD.0000000000003398
29. Yoon H, Yoon D, Yun M, Choi JS, Park VY, Kim MJ, et al. Metabolomics of Breast Cancer Using High-Resolution Magic Angle Spinning Magnetic Resonance Spectroscopy: Correlations With 18F-FDG Positron Emission Tomography-Computed Tomography, Dynamic Contrast-Enhanced and Diffusion-Weighted Imaging MRI. PloS One (2016) 11:7. doi: 10.1371/journal.pone.0159949
30. Gogiashvili M, Horsch S, Marchan R, Gianmoena K, Cadenas C, Tanner B, et al. Impact of Intratumoral Heterogeneity of Breast Cancer Tissue on Quantitative Metabolomics Using High-Resolution Magic Angle Spinning 1h NMR Spectroscopy. NMR BioMed (2018) 31:2. doi: 10.1002/nbm.3862
31. Pearce JM, Mahoney MC, Lee JH, Chu WJ, Cecil KM, Strakowski SM, et al. 1h NMR Analysis of Choline Metabolites in Fine-Needle-Aspirate Biopsies of Breast Cancer. MAGMA (2013) 26:3. doi: 10.1007/s10334-012-0349-0
32. Budczies J, Pfitzner BM, Györffy B, Winzer KJ, Radke C, Dietel M, et al. Glutamate Enrichment as New Diagnostic Opportunity in Breast Cancer. Int J Cancer (2015) 136:7. doi: 10.1002/ijc.29152
33. Chae EY, Shin HJ, Kim S, Baek HM, Yoon D, Kim S, et al. The Role of High-Resolution Magic Angle Spinning 1h Nuclear Magnetic Resonance Spectroscopy for Predicting the Invasive Component in Patients With Ductal Carcinoma In Situ Diagnosed on Preoperative Biopsy. PloS One (2016) 11:8. doi: 10.1371/journal.pone.0161038
34. Lampa M, Arlt H, He T, Ospina B, Reeves J, Zhang B, et al. Glutaminase Is Essential For the Growth of Triple-Negative Breast Cancer Cells With a Deregulated Glutamine Metabolism Pathway and Its Suppression Synergizes With mTOR Inhibition. PloS One (2017) 12:9. doi: 10.1371/journal.pone.0185092
35. Sonkar K, Ayyappan V, Tressler CM, Adelaja O, Cai R, Cheng M, et al. Focus on The Glycerophosphocholine Pathway in Choline Phospholipid Metabolism of Cancer. NMR BioMed (2019) 32:10. doi: 10.1002/nbm.4112
36. Hanahan D, Weinberg RA. Hallmarks of Cancer: The Next Generation. Cell (2011) 144:5. doi: 10.1016/j.cell.2011.02.013
37. Rani A, Stebbing J, Giamas G, Murphy J. Endocrine Resistance in Hormone Receptor Positive Breast Cancer-From Mechanism to Therapy. Front Endocrinol (Lausanne) (2019) 10:245. doi: 10.3389/fendo.2019.00245
38. Cha YJ, Kim ES, Koo JS. Amino Acid Transporters and Glutamine Metabolism in Breast Cancer. Int J Mol Sci (2018) 19:3. doi: 10.3390/ijms19030907
39. Mihály Z, Kormos M, Lánczky A, Dank M, Budczies J, Szász MA, et al. A Meta-Analysis of Gene Expression-Based Biomarkers Predicting Outcome After Tamoxifen Treatment in Breast Cancer. Breast Cancer Res Treat (2013) 140:2. doi: 10.1007/s10549-013-2622-y
40. Bartlett JM, Bloom KJ, Piper T, Lawton TJ, van de Velde CJ, Ross DT, et al. Mammostrat as an Immunohistochemical Multigene Assay for Prediction of Early Relapse Risk in the Tamoxifen Versus Exemestane Adjuvant Multicenter Trial Pathology Study. J Clin Oncol (2012) 30:36. doi: 10.1200/JCO.2012.42.8896
41. Karunakaran S, Ramachandran S, Coothankandaswamy V, Elangovan S, Babu E, Periyasamy-Thandavan S, et al. SLC6A14 (ATB0,+) Protein, a Highly Concentrative and Broad Specific Amino Acid Transporter, Is a Novel and Effective Drug Target For Treatment Of Estrogen Receptor-Positive Breast Cancer. J Biol Chem (2011) 286:36. doi: 10.1074/jbc.M111.229518
42. Ananieva EA, Wilkinson AC. Branched-Chain Amino Acid Metabolism in Cancer. Curr Opin Clin Nutr Metab Care (2018) 21:1. doi: 10.1097/MCO.0000000000000430
43. Ma XJ, Dahiya S, Richardson E, Erlander M, Sgroi DC. Gene Expression Profiling of the Tumor Microenvironment During Breast Cancer Progression. Breast Cancer Res (2009) 11:1. doi: 10.1186/bcr2222
44. Zhao H, Langerød A, Ji Y, Nowels KW, Nesland JM, Tibshirani R, et al. Different Gene Expression Patterns in Invasive Lobular and Ductal Carcinomas of the Breast. Mol Biol Cell (2004) 15:6. doi: 10.1091/mbc.e03-11-0786
45. Wang JB, Erickson JW, Fuji R, Ramachandran S, Gao P, Dinavahi R, et al. Targeting Mitochondrial Glutaminase Activity Inhibits Oncogenic Transformation. Cancer Cell (2010) 18:3. doi: 10.1016/j.ccr.2010.08.009
46. Gross MI, Demo SD, Dennison JB, Chen L, Chernov-Rogan T, Goyal B, et al. Antitumor Activity of the Glutaminase Inhibitor CB-839 in Triple-Negative Breast Cancer. Mol Cancer Ther (2014) 13:4. doi: 10.1158/1535-7163.MCT-13-0870
47. Giulianelli S, Vaqué JP, Soldati R, Wargon V, Vanzulli SI, Martins R, et al. Estrogen Receptor Alpha Mediates Progestin-Induced Mammary Tumor Growth by Interacting With Progesterone Receptors at the Cyclin D1/MYC Promoters. Cancer Res (2012) 72:9. doi: 10.1158/0008-5472.CAN-11-3290
48. Giulianelli S, Riggio M, Guillardoy T, Pérez Piñero C, Gorostiaga MA, Sequeira G, et al. FGF2 Induces Breast Cancer Growth Through Ligand-Independent Activation and Recruitment of Erα And PrbΔ4 Isoform to MYC Regulatory Sequences. Int J Cancer (2019) 145:7. doi: 10.1002/ijc.32252
49. Gao P, Tchernyshyov I, Chang TC, Lee YS, Kita K, Ochi T, et al. C-Myc Suppression of Mir-23a/B Enhances Mitochondrial Glutaminase Expression and Glutamine Metabolism. Nature (2009) 458:7239. doi: 10.1038/nature07823
50. Wise DR, DeBerardinis RJ, Mancuso A, Sayed N, Zhang XY, Pfeiffer HK, et al. Myc Regulates a Transcriptional Program That Stimulates Mitochondrial Glutaminolysis and Leads to Glutamine Addiction. Proc Natl Acad Sci USA (2008) 105:487. doi: 10.1073/pnas.0810199105
51. Vučetić M, Cormerais Y, Parks SK, Pouysségur J. The Central Role of Amino Acids in Cancer Redox Homeostasis: Vulnerability Points of the Cancer Redox Code. Front Oncol (2017) 7:319. doi: 10.3389/fonc.2017.00319
52. Zhang X, Lu H, Wang Y, Liu C, Zhu W, Zheng S, et al. Taurine Induces the Apoptosis of Breast Cancer Cells by Regulating Apoptosis-Related Proteins of Mitochondria. Int J Mol Med (2015) 35:1. doi: 10.3892/ijmm.2014.2002
53. Parvez S, Tabassum H, Banerjee BD, Raisuddin S. Taurine Prevents Tamoxifen-Induced Mitochondrial Oxidative Damage in Mice. Basic Clin Pharmacol Toxicol (2008) 102:4. doi: 10.1111/j.1742-7843.2008.00208.x
54. Beckonert O, Monnerjahn J, Bonk U, Leibfritz D. Visualizing Metabolic Changes in Breast-Cancer Tissue Using 1h-NMR Spectroscopy and Self-Organizing Maps. NMR BioMed (2003) 16:1. doi: 10.1002/nbm.797
55. Master SR, Hartman JL, D’Cruz CM, Moody SE, Keiper EA, Ha SI, et al. Functional Microarray Analysis of Mammary Organogenesis Reveals a Developmental Role in Adaptive Thermogenesis. Mol Endocrinol (2002) 16:6. doi: 10.1210/mend.16.6.0865
56. Colleluori G, Perugini J, Barbatelli G, Cinti S. Mammary Gland Adipocytes in Lactation Cycle, Obesity and Breast Cancer. Rev Endocr Metab Disord (2021) 22:2. doi: 10.1007/s11154-021-09633-5
57. Wallimann T, Tokarska-Schlattner M, Schlattner U. The Creatine Kinase System and Pleiotropic Effects of Creatine. Amino Acids (2011) 40:5. doi: 10.1007/s00726-011-0877-3
58. Glunde K, Bhujwalla ZM, Ronen SM. Choline Metabolism in Malignant Transformation. Nat Rev Cancer (2011) 11:12. doi: 10.1038/nrc3162
59. Jia M, Andreassen T, Jensen L, Bathen TF, Sinha I, Gao H, et al. Estrogen Receptor α Promotes Breast Cancer by Reprogramming Choline Metabolism. Cancer Res (2016) 76:19. doi: 10.1158/0008-5472.CAN-15-2910
60. Xiong J, Wang L, Fei XC, Jiang XF, Zheng Z, Zhao Y, et al. MYC Is a Positive Regulator of Choline Metabolism and Impedes Mitophagy-Dependent Necroptosis in Diffuse Large B-Cell Lymphoma. Blood Cancer J (2017) 7:77. doi: 10.1038/bcj.2017.61
61. Ying H, Kimmelman AC, Lyssiotis CA, Hua S, Chu GC, Fletcher-Sananikone E, et al. Oncogenic Kras Maintains Pancreatic Tumors Through Regulation of Anabolic Glucose Metabolism. Cell (2012) 149:3. doi: 10.1016/j.cell.2012.01.058
62. Moloughney JG, Kim PK, Vega-Cotto NM, Wu CC, Zhang S, Adlam M, et al. Mtorc2 Responds to Glutamine Catabolite Levels to Modulate the Hexosamine Biosynthesis Enzyme Gfat1. Mol Cell (2016) 63:5. doi: 10.1016/j.molcel.2016.07.015
63. Akella NM, Ciraku L, Reginato MJ. Fueling The Fire: Emerging Role of The Hexosamine Biosynthetic Pathway in Cancer. BMC Biol (2019) 17:1. doi: 10.1186/s12915-019-0671-3
64. Ščupáková K, Adelaja OT, Balluff B, Ayyappan V, Tressler CM, Jenkinson NM, et al. Clinical Importance of High-Mannose, Fucosylated and Complex N-Glycans in Breast Cancer Metastasis. JCI Insight (2021) 6:24. doi: 10.1172/jci.insight.146945
65. He M, Jin Q, Chen C, Liu Y, Ye X, Jiang Y, et al. The miR-186-3p/EREG Axis Orchestrates Tamoxifen Resistance and Aerobic Glycolysis in Breast Cancer Cells. Oncogene (2019) 38:28. doi: 10.1038/s41388-019-0817-3
66. Woo YM, Shin Y, Lee EJ, Lee S, Jeong SH, Kong HK, et al. Inhibition of Aerobic Glycolysis Represses Akt/mTOR/HIF-1α Axis and Restores Tamoxifen Sensitivity in Antiestrogen-Resistant Breast Cancer Cells. PloS One (2015) 10:7. doi: 10.1371/journal.pone.0132285
67. Giulianelli S, Cerliani JP, Lamb CA, Fabris VT, Bottino MC, Gorostiaga MA, et al. Carcinoma-Associated Fibroblasts Activate Progesterone Receptors and Induce Hormone Independent Mammary Tumor Growth: A Role for the FGF-2/FGFR-2 Axis. Int J Cancer (2008) 123:11. doi: 10.1002/ijc.23802
68. Yu P, Wilhelm K, Dubrac A, Tung JK, Alves TC, Fang JS, et al. FGF-Dependent Metabolic Control of Vascular Development. Nature (2017) 545:7653. doi: 10.1038/nature22322
69. Deng B, Tarhan YE, Ueda K, Ren L, Katagiri T, Park JH, et al. Critical Role of Estrogen Receptor Alpha O-Glycosylation by N-Acetylgalactosaminyltransferase 6 (GALNT6) in Its Nuclear Localization in Breast Cancer Cells. Neoplasia (2018) 20:10. doi: 10.1016/j.neo.2018.08.006
70. Trinca GM, Goodman ML, Papachristou EK, D’Santos CS, Chalise P, Madan R, et al. O-GlcNAc-Dependent Regulation of Progesterone Receptor Function in Breast Cancer. Horm Cancer (2018) 9:1. doi: 10.1007/s12672-017-0310-9
71. Kader AS, Dib S, Achkar IW, Thareja G, Suhre K, Rafii A, et al. Defining the Landscape of Metabolic Dysregulations in Cancer Metastasis. Clin Exp Metastasis (2021) 38:1–18. doi: 10.1007/s10585-021-10140-9
72. Teoh ST, Ogrodzinski MP, Ross C, Hunter KW, Lunt SY. Sialic Acid Metabolism: A Key Player in Breast Cancer Metastasis Revealed by Metabolomics. Front Oncol (2018) 8:174. doi: 10.3389/fonc.2018.00174
73. Kim SK, Yang JW, Kim MR, Roh SH, Kim HG, Lee KY, et al. Increased Expression of Nrf2/ARE-Dependent Anti-Oxidant Proteins in Tamoxifen-Resistant Breast Cancer Cells. Free Radic Biol Med (2008) 45:4. doi: 10.1016/j.freeradbiomed.2008.05.011
74. Direito I, Fardilha M, Helguero LA. Contribution of the Unfolded Protein Response to Breast and Prostate Tissue Homeostasis and Its Significance to Cancer Endocrine Response. Carcinogenesis (2019) 40:2. doi: 10.1093/carcin/bgy182
75. Direito I, Monteiro L, Melo T, Figueira D, Lobo J, Enes V, et al. Protein Aggregation Patterns Inform About Breast Cancer Response to Antiestrogens and Reveal the RNA Ligase RTCB as Mediator of Acquired Tamoxifen Resistance. Cancers (Basel) (2021) 13:13. doi: 10.3390/cancers13133195
Keywords: endocrine-related breast cancer, murine model, metabolomics, metabonomics, therapy resistance, biomarkers
Citation: Araújo R, Fabris V, Lamb CA, Lanari C, Helguero LA and Gil AM (2022) Metabolic Adaptations in an Endocrine-Related Breast Cancer Mouse Model Unveil Potential Markers of Tumor Response to Hormonal Therapy. Front. Oncol. 12:786931. doi: 10.3389/fonc.2022.786931
Received: 30 September 2021; Accepted: 02 February 2022;
Published: 01 March 2022.
Edited by:
Sara Granja, University of Minho, PortugalReviewed by:
Xuxu Gou, Baylor College of Medicine, United StatesCopyright © 2022 Araújo, Fabris, Lamb, Lanari, Helguero and Gil. This is an open-access article distributed under the terms of the Creative Commons Attribution License (CC BY). The use, distribution or reproduction in other forums is permitted, provided the original author(s) and the copyright owner(s) are credited and that the original publication in this journal is cited, in accordance with accepted academic practice. No use, distribution or reproduction is permitted which does not comply with these terms.
*Correspondence: Ana M. Gil, YWdpbEB1YS5wdA==; Luisa A. Helguero, bHVpc2EuaGVsZ3Vlcm9AdWEucHQ=
Disclaimer: All claims expressed in this article are solely those of the authors and do not necessarily represent those of their affiliated organizations, or those of the publisher, the editors and the reviewers. Any product that may be evaluated in this article or claim that may be made by its manufacturer is not guaranteed or endorsed by the publisher.
Research integrity at Frontiers
Learn more about the work of our research integrity team to safeguard the quality of each article we publish.